
Vaccine Preventable Disease: Surveillance Report to December 31, 2017
Table of contents
- Table of figures
- Abbreviations
- Executive summary
- Introduction
- Vaccine preventable diseases under elimination in Canada
- Vaccine preventable diseases with low-level incidence in Canada
- Vaccine preventable diseases with moderate-level incidence in Canada
- Conclusion
- Acknowledgements
- Appendix A: Methods and limitations
- References
- Endnotes
Download the alternative format
(PDF format, 3.60 MB, 66 pages)
Date published: 2020-04-16
Table of figures
- Figure 1: Total number and average incidence rates (per 100,000 population) of reported vaccine preventable disease cases in Canada by age group, 2013 to 2017 (n=37,203)
- Figure 2: Number and incidence rates (per 100,000 population) of reported measles cases in Canada by year, 1950 to 2017
- Figure 3: Total number and overall incidence rates (per 100,000 population) of reported measles cases in Canada by age group, 2013 to 2017 (n=753)
- Figure 4: Number and incidence rates (per 100,000 population) of reported rubella cases in Canada by year, 1950 to 2017
- Figure 5: Number and incidence rate (per 100,000 population) of reported acute flaccid paralysis cases in children less than 15 years old, in Canada by year, 1996 to 2017
- Figure 6: Number and incidence rates (per 100,000 population) of reported diphtheria cases in Canada by year, 1925 to 2017
- Figure 7: Number and incidence rates (per 100,000 population) of reported tetanus cases in Canada by year, 1935 to 2017
- Figure 8: Number and incidence rates (per 100,000 population) of reported cases of invasive disease due to Hib in Canada by year, 1986 to 2017
- Figure 9: Total number and overall incidence rate (per 100,000 population) of reported cases of invasive disease due to Hib in Canada by age group, 2013 to 2017 (n=117)
- Figure 10: Number and incidence rate (per 100,000 population) of reported invasive meningococcal disease cases in Canada by year, 1997 to 2017
- Figure 11: Incidence of IMD (per 100,000 population) in Canada by serogroup and year, 1997 to 2017
- Figure 12: Total reported cases and overall incidence rate (per 100,000 population) of invasive meningococcal disease in Canada by age group, 2013 to 2017 (n=547)
- Figure 13: Number and incidence rate (per 100,000 population) of reported mumps cases in Canada by year, 1950 to 2017
- Figure 14: Number and incidence rates (per 100,000 population) of reported mumps cases by age group, 2017 (n=2,263)
- Figure 15: Number and incidence rate (per 100,000 population) of reported pertussis cases in Canada by year, 1938 to 2017
- Figure 16: Total number and overall incidence rates (per 100,000 population) of reported pertussis cases in Canada, by age group, 2013 to 2017 (n=13,838)
- Figure 17: Number and incidence rate (per 100,000 population) of reported IPD cases in Canada, by year, 2001 to 2017
- Figure 18: Incidence of IPD, selected age groups, 2001 to 2017
- Figure 19: Total number and overall incidence rate (per 100,000 population) of reported invasive pneumococcal disease cases in Canada by age group, 2013 to 2017 (n=16,341)
- Figure 20: Number and incidence rate (per 100,000 population) of reported varicella cases in Canada by year, 1991 to 2017
- Figure 21: Total number and overall incidence rate (per 100,000 population) of reported varicella cases in Canada by age group, 2013 to 2017 (n=2,750)
- Figure 22: Number of pediatric varicella hospitalizations in Canada reported through IMPACT, 1999 to 2017
Abbreviations
- AFP
- Acute flaccid paralysis
- aNICS
- Adult National Immunization Coverage Survey
- CAFPSS
- Canadian Acute Flaccid Paralysis Surveillance System
- CIRID
- Centre for Immunization and Respiratory Infectious Diseases
- CMRSS
- Canadian Measles and Rubella Surveillance System
- cNICS
- Childhood National Immunization Coverage Survey
- CNDSS
- Canadian Notifiable Disease Surveillance System
- CPS
- Canadian Pediatric Society
- CRI
- Congenital rubella infection
- CRS
- Congenital rubella syndrome
- eIMDSS
- Enhanced Invasive Meningococcal Disease Surveillance System
- Hib
- Haemophilus influenzae type b
- HPV
- Human papilloma virus
- IMD
- Invasive meningococcal disease
- IMPACT
- Immunization Monitoring Program ACTive
- IPD
- Invasive pneumococcal disease
- IPV
- Inactivated Poliomyelitis Vaccines
- NACI
- National Advisory Committee on Immunization
- OPV
- Oral polio vaccine
- NML
- National Microbiology Laboratory
- PAHO
- Pan-American Health Organization
- PHAC
- Public Health Agency of Canada
- Tdap
- Tetanus, diphtheria, pertussis vaccine
- VPDs
- Vaccine preventable diseases
- WHO
- World Health Organization
- WPV
- Wild-type poliovirus
Executive summary
Disease prevention is a core function of public health. Many common infectious diseases that were once a major cause of morbidity and mortality in Canada are now preventable with vaccines. Nevertheless, as this report clearly outlines, vaccine-preventable diseases (VPDs) are still a public health concern in Canada and it is important to achieve the highest possible levels of vaccination. The Vaccine Preventable Disease in Canada: Surveillance Report to December 31, 2017 summarizes the epidemiology of 12 nationally notifiable VPDs for which publicly funded routine vaccination programs are in place in all provinces and territories, including a summary of the epidemiology from the most recent five-year period (2013 to 2017). It serves the following purposes:
- Summarize the epidemiology of 12 VPDs and associated vaccination coverage in Canada.
- Provide data against which progress in disease reduction can be measured.
- Support the Government of Canada's international commitments to report on disease elimination and eradication initiatives.
- Provide evidence to inform vaccination programs and policy.
This report uses data from a variety of national surveillance systems including the Canadian Notifiable Diseases Surveillance System, the Canadian Measles and Rubella Surveillance System, the Enhanced Invasive Meningococcal Disease Surveillance System, the Canadian Acute Flaccid Paralysis Surveillance System, and the Canadian Immunization Monitoring Program, ACTive (IMPACT). Vaccination coverage estimates obtained from the 2017 Childhood National Immunization Coverage Survey and the 2016 Adult National Immunization Coverage Survey were also included to provide context. Each VPD was placed into one of three categories: VPDs under elimination in Canada, VPDs with low-level incidence, and VPDs with moderate-level incidence. The findings for each of these categories are summarized below.
How are we doing?
VPDs under eliminationFootnote a
Canada's elimination status was maintained for measles, rubella, congenital rubella syndrome/congenital rubella infection (CRS/CRI), and polio. Based on surveillance data from 2013 to 2017, Canada is on track to meet national VPD reduction targets for these diseases by 2025. Although measles outbreaks due to imported cases were reported in recent years, these did not result in the re-establishment of endemic transmission in Canada. Despite several reports of imported rubella and CRS/CRI cases in recent years, these did not result in secondary spread. Although vaccination coverage rates were fairly high among two-year-olds for measles (90%), rubella (90%), and polio (91%), they remained below the 95% national vaccine coverage goal for these diseases.
VPD with low-level incidenceFootnote b
Among the described VPDs not under elimination, diphtheria and tetanus accounted for the fewest cases with five or fewer cases reported per year between 2013 and 2017. Similarly, the incidence of invasive disease due to Haemophilus influenzae type b (Hib) has declined by 99% among those under five years of age since the introduction of Hib containing vaccine, with fewer than 25 cases reported in all age groups annually. Reported cases of invasive meningococcal disease (IMD) continue to decrease with fewer than 200 cases reported each year, of which fewer than 9% were due to IMD serogroup C. IMD serogroup B, for which no routine vaccination programs currently exist, accounted for the majority (41%) of IMD cases reported between 2013 and 2017. While mumps incidence rates have declined by over 99% since the introduction of routine vaccination programs, outbreaks occurred across the country in 2016 and 2017, with incidence rates highest among adolescents and adults. Based on surveillance data from 2013 to 2017, Canada is on track to meet national VPD reduction targets by 2025 for tetanus, Hib and IMD but not currently on track to meet the reduction target for mumps if large outbreaks continue to occur. Presently, surveillance data is not available to assess progress in meeting national VPD reduction targets for respiratory diphtheria and maternal and neonatal tetanus.
Despite these low disease incidence rates, vaccine coverage rates can be improved. Rates for diphtheria (76%), tetanus (76%) and Hib (73%) by two years of age were considerably below the national vaccine coverage goal of 95% for each of these diseases. Although coverage among two-year-olds for mumps-containing vaccine (90%) and meningococcal C vaccine (88%) were high, they were still below the national vaccine coverage goal of 95%.
VPDs with moderate-level incidenceFootnote c
Pertussis is a cyclical disease with incidence rates peaking every two to five years. An increasing trend was observed from 2013 to 2017 with the highest incidence rates observed among infants less than one-year-old and in children between 10 and 14 years old. Based on surveillance data from 2015 to 2017, Canada is on track to meet the VPD reduction target for pertussis by 2025. Pertussis vaccination rates can be improved as they fall below the national vaccine coverage goal of 95%, with only 76% having received the recommended doses of pertussis-containing vaccine by two years of age.
Although 86% of invasive pneumococcal disease (IPD) cases from 2013 to 2017 were reported among adults 30 years of age and older, the highest incidence rates were among individuals 60 years of age and older, followed by infants under one year of age and children between one and four years of age. While the incidence rate of IPD in children under two years of age has declined since the introduction of the pneumococcal vaccine, incidence rates in adults 65 years of age and older have remained stable. Based on data for this period, Canada is not currently on track to meet the disease reduction target for IPD in adults 65 years of age and older by 2025. Vaccination rates for IPD can be improved as they are below the national vaccine coverage goal of 95% for children by two years of age and 80% for individuals 65 years of age and older. The vaccine coverage rates for those groups were 81% and 42% respectively.
Overall, a declining trend in varicella cases was observed from 2013 to 2017. Cases were reported in all age groups. However, children less than 15 years of age were the most affected. The highest incidence rates were in infants less than one year of age (who are not eligible for varicella vaccine) and in children between five and 14 years of age. Based on surveillance data from 2013 to 2017, Canada is on track to meet the VPD reduction target for varicella by 2025. Note, however, that varicella is not reportable in all provinces and territories and cases may not be seen by a physician. Vaccination rates for varicella can be improved as they are below the national vaccine coverage goal of 95%, with only 83% having received their first dose of varicella-containing vaccine by two years of age.
Introduction
Vaccines are one of the greatest achievements in public health and are considered to have saved more lives in the past 50 years in Canada than any other health interventionReference 1Reference 2Reference 3. While infectious diseases were the leading cause of death both in Canada and worldwide in the 1900s, they are now responsible for less than 5% of all deaths in Canada, thanks in part to publicly funded vaccination programsReference 1Reference 4Reference 5. Furthermore, Canada has contributed to the global eradication of smallpox as well as the elimination of endemically transmitted poliomyelitis (1994), measles (1998), rubella (2005) and CRS/CRI (2000) in the Americas through strong public health initiatives, including surveillance activities and routine publicly funded vaccination programsReference 4Reference 5Reference 6. As part of Canada's National Immunization Strategy for 2016-2021, vaccine coverage goals and vaccine preventable disease (VPD) reduction targets were set in collaboration with provinces and territories and are based on international standards and best practicesReference 7.
Despite these successes, VPDs remain a public health concern in Canada. While vaccination coverage rates are good, Canada has yet to meet any of the national vaccination coverage goals. Despite low rates of disease, VPDs still constitute a considerable health burden to the population, with infections causing a variety of serious complications such as pneumonia, meningitis, encephalitis, amputations, and death. Infections due to VPDs also have substantial economic and societal costs related to missed school and work days, health care provider visits, hospitalization and rehabilitationReference 2Reference 3. Finally, despite attaining elimination status for several VPDs, the risk of an importation and possible resurgence of any of the VPDs under elimination exists so long as these diseases continue to occur in countries outside of the Americas and vaccination coverage remains suboptimal. Therefore, vaccination rates should be improved to ensure herd immunity. Moreover, surveillance and prevention of VPDs are essential to protect population health and maintain successes in health achievement.
The prevention and control of VPDs is a shared responsibility. At the federal level, the Public Health Agency of Canada (PHAC) conducts surveillance of VPDs at the national level; provides leadership and coordination for the National Immunization Strategy; delivers public and professional education and outreach to promote vaccination acceptance and uptake; and, ensures the security of vaccine supply. The National Advisory Committee on Immunization makes recommendations for the use of vaccines in Canada. Provincial and Territorial public health authorities are responsible for vaccination program decisions and implementing programs that meet their goals, policies, and strategies in light of their specific epidemiologic and financial circumstances.
Objective
This report provides a description of the epidemiology of 12 nationally notifiable VPDs for which publicly funded routine vaccination programs exist in all provinces and territories in Canada, with a highlight of the data from 2013 to 2017. This report is intended to serve the following objectives:
- Summarize the epidemiology of 12 VPDs and associated vaccination coverage in Canada.
- Provide data against which progress in disease reduction can be measured.
- Support the Government of Canada's international commitments to report on disease elimination and eradication initiatives.
- Provide evidence to inform vaccination programs and policy.
Format and content
The 12 VPDs are grouped according to their incidence levels in Canada as follows:
Diseases under elimination: VPDs that have domestic and international programs to reduce their disease-specific incidence to zero:
- Measles
- Rubella
- CRS/CRI
- Polio
Endemic diseases with low-level incidence: VPDs that generally have an annual incidence rate of less than one case per 100,000 population:
- Tetanus
- Diphtheria
- Invasive disease due to Hib
- IMD
- Mumps
Endemic disease with moderate levels of incidence: VPDs that consistently have an annual incidence rate equal to or greater than one case per 100,000 population:
- Pertussis
- IPD
- Varicella
A description of the various data sources used, the types of analyses conducted and the various limitations of the data used in this report are provided in Appendix A. In addition, the epidemiology of VPDs contained in this report should be interpreted with an awareness of available vaccination programs, populations eligible for vaccination, rates of vaccine uptake by the population, and vaccine effectiveness. Details pertaining to specific vaccines can be found in the Canadian Immunization Guide and National Advisory Committee on Immunization statements.
Only nationally notifiable VPDs are presented in this report, thus VPDs such as zoster, rotavirus gastroenteritis, and human papillomavirus infection are not included in this report. Furthermore, information on the national epidemiology of influenza and hepatitis are covered in separate surveillance reports.
While this report presents an overview of VPDs in Canada, routine surveillance reports for many of the diseases included here are published on a regular basis and are referenced throughout this report. Readers interested in more detailed data are encouraged to consult these publications.
How are we doing?
National surveillance data indicate that from 2013 to 2017, an average of 7,443 VPD cases were reported annually (Table 1), representing an average annual crude incidence rate of 20.7 cases per 100,000 population (Table 2). The VPDs that accounted for the largest proportion of reported cases were IPD (44%) and pertussis (37%). Age groups most affected by VPDs included children less than one year of age (92.4 cases per 100,000 population), children one to four years of age (46.3 cases per 100,000 population), and children ten to fourteen years of age (41.3 cases per 100,000 population) (Figure 1). Over the same period, case counts were highest among those aged 60 years and older (n=9,213 cases) and 30 to 39 years old (n=5,803 cases). The most affected age groups varied by disease, with some diseases such as pertussis and IMD having a greater incidence in young children, while incidence was highest in the elderly for IPD and in adolescents/young adults for mumps.
Based on surveillance data from 2013 to 2017, Canada is on track to meet the disease reduction targets for the majority of VPDs by 2025 (Table 3). However, efforts to reduce cases of IPD in adults 65 years of age and older and to reduce cases of mumps in Canada can be improved to ensure the reduction targets for these diseases are met by 2025. Work is currently underway to allow for surveillance of cases of respiratory diphtheria and maternal and neonatal tetanus at the national level.
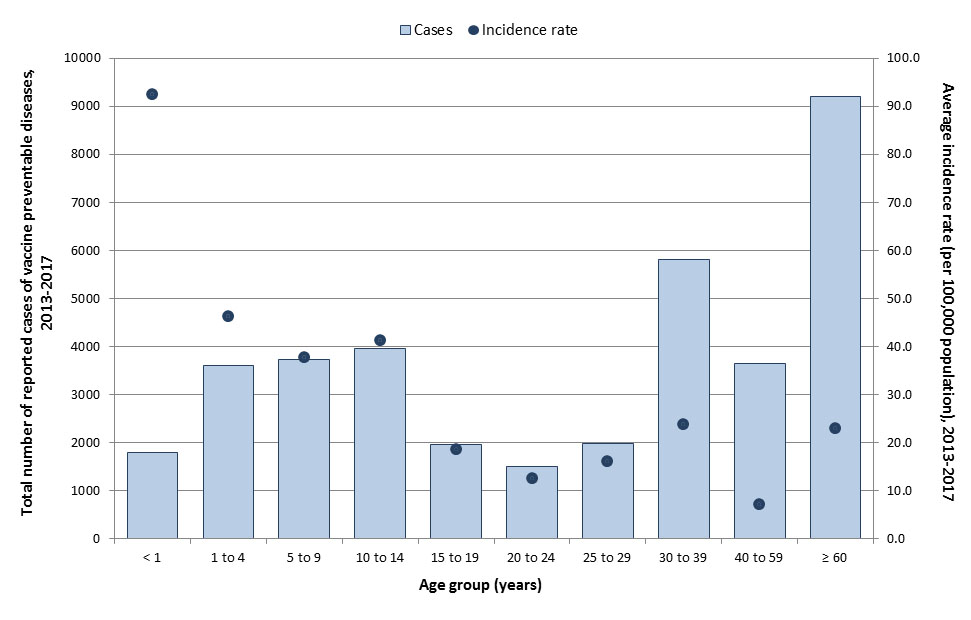
Figure 1: Text equivalent
| Age groups | Total number of cases | Overall incidence rate (per 100,000 population) |
|---|---|---|
| <1 | 1,795 | 92.4 |
| 1 to 4 | 3,599 | 46.3 |
| 5 to 9 | 3,731 | 37.6 |
| 10 to 14 | 3,968 | 41.3 |
| 15 to 19 | 1,967 | 18.6 |
| 20 to 24 | 1,501 | 12.5 |
| 25 to 29 | 1,984 | 16.1 |
| 30 to 39 | 5,803 | 23.9 |
| 40 to 59 | 3,642 | 7.2 |
| 60+ | 9,213 | 22.9 |
| Age group (years) | Measles | Rubella | CRS/CRI | Polio | Tetanus | Diphtheria | Hib | Mumps | IMD | Varicella | IPD | Pertussis | Overall |
|---|---|---|---|---|---|---|---|---|---|---|---|---|---|
| < 1 | 6.0 (0-14) | 0 | 0.2 (0-1) | 0 | 0 | 0 | 4.0 (3-5) | 3.2 (0-10) | 12.6 (6-19) | 24.8 (14-31) | 62.4 (55-71) | 245.8 (169-315) | 359.0 (291-417) |
| 1 to 4 | 12.8 (2-25) | 0 | N/A | 0 | 0.4 (0-1) | 0.2 (0-1) | 3.2 (1-5) | 13.6 (0-53) | 13.6 (8-18) | 56.0 (25-75) | 174.8 (151-192) | 445.2 (180-659) | 719.8 (446-938) |
| 5 to 9 | 34.6 (0-125) | 0 | 0 | 0.2 (0-1) | 0 | 0.8 (0-2) | 30.6 (0-135) | 3.2 (1-5) | 119.4 (21-214) | 24.2 (21-28) | 524.0 (218-788) | 737.0 (376-937) | |
| 10 to 14 | 36.0 (0-106) | 0 | 0 | 0 | 0.2 (0-1) | 0.4 (0-1) | 41.4 (2-186) | 2.8 (2-4) | 113.4 (50-165) | 29.2 (22-36) | 571.2 (238-836) | 794.6 (372-1015) | |
| 15 to 19 | 24.8 (0-72) | 0 | 0 | 0 | 0 | 0.2 (0-1) | 79.2 (3-311) | 14.8 (11-18) | 56.6 (41-78) | 42.0 (35-54) | 176.8 (73-247) | 394.4 (197-627) | |
| 20 to 24 | 11.8 (1-27) | 0 | 0 | 0.6 (0-2) | 0.2 (0-1) | 0 | 91.8 (3-335) | 8.6 (4-19) | 35.6 (25-50) | 66.0 (63-69) | 92.4 (41-130) | 307.0 (171-578) | |
| 25 to 29 | 6.8 (0-11) | 0.2 (0-1) | 0 | 0.2 (0-1) | 0 | 0.4 (0-2) | 87.0 (3-352) | 3.8 (2-6) | 31.6 (24-37) | 228.4 (211-264) | 77.4 (41-112) | 435.8 (296-753) | |
| 30 to 39 | 10.6 (0-24) | 0 | 0 | 1.2 (0-2) | 0.2 (0-1) | 2.0 (1-3) | 118.6 (5-482) | 5.2 (3-7) | 49.6 (34-63) | 894.4 (859-914) | 208.0 (96-305) | 1289.8 (1034-1702) | |
| 40 to 59 | 7.2 (1-14) | 0.4 (0-1) | 0 | 0.6 (0-2) | 0.4 (0-1) | 5.2 (0-11) | 88.0 (7-361) | 16.4 (13-20) | 46.2 (35-60) | 72.2 (71-76) | 324.0 (161-441) | 560.6 (313-903) | |
| ≥ 60 | 0 | 0 | 0 | 1.0 (0-2) | 0.6 (0-2) | 7.2 (4-15) | 11.2 (0-38) | 28.4 (17-35) | 16.8 (15-20) | 1674.6 (1633-1822) | 102.8 (59-137) | 1842.6 (1744-2051) | |
| Unspecified | 0 | 0 | 0 | 0 | 0 | 0 | 0 | 0.2 (0-1) | 0.4 (0-1) | 0 | 1.8 (0-4) | 2.6 (0-5) | |
| All ages | 150.6 (11-418) | 0.6 (0-1) | 0 | 4.2 (2-6) | 1.8 (0-4) | 23.4 (12-33) | 564.6 (40-2263) | 109.6 (99-121) | 550.4 (315-719) | 3268.2 (3177-3477) | 2769.4 (1277-3944) | 7443.0 (5254-9828) |
| Age group (years) | Measles | Rubella | CRS/CRI | Polio | Tetanus | Diphtheria | Hib | Mumps | IMD | Varicella | IPD | Pertussis | Overall |
|---|---|---|---|---|---|---|---|---|---|---|---|---|---|
| < 1 | 1.5 (0-3.6) | 0 | 0.1 (0-0.3) | 0 | 0 | 0 | 1.0 (0.8-1.3) | 0.8 (0-2.6) | 3.2 (1.5-4.9) | 11.8 (6.6-14.6) | 16.1 (14.2-18.4) | 63.3 (43.8-80.9) | 92.4 (75.4-107.0) |
| 1 to 4 | 0.8 (0.1-1.6) | 0 | N/A | 0 | <0.05 (0-0.1) | <0.05 (0.0-0.1) | 0.2 (0.1-0.3) | 0.9 (0-3.4) | 0.9 (0.5-1.2) | 6.7 (3.0-9.0) | 11.3 (9.7-12.3) | 28.6 (11.6-42.2) | 46.3 (28.9-60.1) |
| 5 to 9 | 1.8 (0-6.4) | 0 | 0 | <0.05 (0-0.1) | 0 | <0.05 (0.-0.1) | 1.5 (0-6.7) | 0.2 (0.1-0.3) | 11.0 (1.9-19.7) | 3.7 (3.5-3.8) | 26.3 (11.5-39.2) | 37.2 (19.8-46.7) | |
| 10 to 14 | 1.9 (0-5.6) | 0 | 0 | 0 | <0.05 (0.0-0.1) | <0.05 (0-0.1) | 2.1 (0.1-9.5) | 0.1 (0.1-0.2) | 10.7 (4.6-15.4) | 1.3 (1.1-1.5) | 29.7 (12.6-43.3) | 41.3 (19.7-52.7) | |
| 15 to 19 | 1.2 (0-3.4) | 0 | 0 | 0 | 0 | <0.05 (0-0.0) | 3.7 (0.1-14.7) | 0.7 (0.5-0.8) | 4.8 (3.5-6.7) | 1.4 (1.0-1.7) | 8.4 (3.4-11.7) | 18.6 (9.1-20.4) | |
| 20 to 24 | 0.5 (0.0-1.1) | 0 | 0 | <0.05 (0-0.1) | <0.05 (0.0-0.0) | 0 | 3.8 (0.1-13.9) | 0.4 (0.2-0.8) | 2.7 (1.9-3.9) | 1.7 (1.5-2.3) | 3.8 (1.7-5.4) | 12.8 (7.1-13.2) | |
| 25 o to 29 | 0.3 (0-0.5) | <0.05 (0-0.0) | 0 | <0.05 (0-0.0) | 0 | <0.05 (0-0.1) | 3.5 (0.1-13.9) | 0.2 (0.1-0.2) | 2.34 (1.79-2.74) | 2.7 (2.6-2.8) | 3.1 (1.7-4.5) | 17.6 (12.3-18.4) | |
| 30 to 39 | 0.2 (0-0.5) | 0 | 0 | <0.05 (0-0.0) | <0.05 (0.0-0.0) | <0.05 (0.0-0.1) | 2.4 (0.1-9.7) | 0.1 (0.1-0.1) | 1.9 (1.3-2.4) | 4.7 (4.4-5.3) | 4.3 (2.0-6.2) | 26.4 (21.8-27.4) | |
| 40 to 59 | 0.1 (0.0-0.1) | <0.05 (0-0.0) | 0 | <0.05 (0-0.0) | <0.05 (0.0-0.0) | 0.1 (0-0.1) | 0.9 (0.1-3.6) | 0.2 (0.1-0.2) | 0.8 (0.6-1.1) | 8.8 (8.4-9.0) | 3.2 (1.6-4.3) | 5.5 (3.1-6.1) | |
| ≥ 60 | 0 | 0 | 0 | <0.05 (0-0.0) | <0.05 (0.0-0.0) | 0.1 (0.0-0.2) | 0.1 (0-0.4) | 0.4 (0.2-0.4) | 0.4 (0.4-0.5) | 20.8 (19.8-21.7) | 1.3 (0.8-1.6) | 22.9 (22.3-23.3) | |
| Unspecified | 0 | 0 | 0 | 0 | 0 | N/A | N/A | N/A | N/A | N/A | N/A | N/A | |
| All ages | 0.4 (0.0-1.2) | <0.05 (0.0-0.0) | 0 | <0.05 (0.0-0.0) | <0.05 (0.0-0.0) | 0.1 (0.0-0.1) | 1.5 (0.1-6.2) | 0.3 (0.3-0.3) | 2.9 (1.6-3.7) | 9.1 (8.9-9.5) | 7.7 (3.6-10.9) | 20.7 (14.9-22.9) |
Note: For summary purposes, incidence rate are indicated with one decimal. Therefore, when incidence rates are lower than 0.05 per 100,000 population, it is indicated as such. Incidence rates for all ages is detailed in each VPD section.
| Disease | Reduction targets | 2015 baseline | Average 2013 to 2017 (range per year) | Is Canada on track to meet this target by 2025? |
|---|---|---|---|---|
| Under elimination | ||||
| Measles | 0 endemic cases | 0 endemic cases | 0 endemic cases | Yes |
| Rubella | 0 endemic cases | 0 endemic cases | 0 endemic cases | Yes |
| CRS/CRI | 0 cases | 0 cases | 0 cases | Yes |
| Polio | 0 cases | 0 cases | 0 cases | Yes |
| Low-level incidence | ||||
| Tetanus | Less than 5 cases (per year) | 3 cases | 4 cases (2 - 6) | Yes |
| Maternal/neonatal tetanus | 0 cases | Not available | Not available | Unable to assess |
| Diphtheria | 0 cases of respiratory diphtheria (per year) | Not available | Not available | Unable to assess |
| Hib | Less than 5 preventable cases in children less than five years of age (per year) | 1 case | Less than 1 case (0 - 1) |
Yes |
| IMD | Less than 5 cases of IMD serogroup C in children under 18 years of age (per year) | 0 cases | Less than 1 case (0 - 2) |
Yes |
| Mumps | Less than 100 cases (5 year-rolling average) |
100 cases | 565 cases (40 - 2263) | No |
| Moderate-level incidence | ||||
| Varicella | Less than 50 hospitalizations in vaccine-eligible children less than 18 years of age (per year)
|
21 hospitalizations
|
19 hospitalizations Footnote e(13 - 35) | Yes |
| IPD | 5% reduction in the overall incidence of IPD among ≥65 years of age | 23.5 cases per 100,000 population | 23.9 cases per 100,000 population (22.7 - 24.7) |
No |
| Pertussis | Less than 3 deaths in infants less than 6-months-old (3 year-rolling average) |
0 | Less than 1 case Footnote f (0 - 1) | Yes |
Vaccine preventable diseases under elimination in Canada
Measles
Key points:
- With routine vaccination, the incidence of measles in Canada has declined by over 99% from an average incidence rate of 373.3 cases per 100,000 population in the pre-vaccine era to 0.4 cases per 100,000 population from 2013 to 2017.
- Canada continues to maintain its measles elimination status and is on track to meet the reduction target of zero endemic measles cases by 2025; however, reported outbreaks of measles due to imported cases continue to occur, illustrating the need to remain vigilant until measles is eradicated worldwide.
- Vaccination rates should be improved to reach 95% coverage for herd immunity. Based on the 2017 childhood National Immunization Coverage Survey (cNICS), 90% of children in Canada received the recommended dose of measles-containing vaccine by two years of age and 87% received the recommended doses by seven years of age.
A measles-containing vaccine was made available in Canada in 1963 and routine vaccination programs were in place in all provinces and territories by 1970 Reference 8Reference 9. In 1996/1997 all provinces and territories added a second dose of measles-containing vaccine to their routine schedulesReference 10. Before measles-containing vaccine became available, many thousands of measles cases were reported annually, and large outbreaks occurred in two to five-year cycles. With routine vaccination, the incidence of measles has declined by over 99% from an average incidence rate of 373.3 cases per 100,000 population in the pre-vaccine era (1950 to 1954)Footnote g to 0.4 cases per 100,000 population from 2013 to 2017 (Figure 2). Nonetheless, imported cases continue to occur in Canada, and have resulted in secondary spread and measles outbreaks.
This report summarizes data up until 2017. More recent data on measles can be found in the Measles and Rubella Weekly Monitoring Reports.
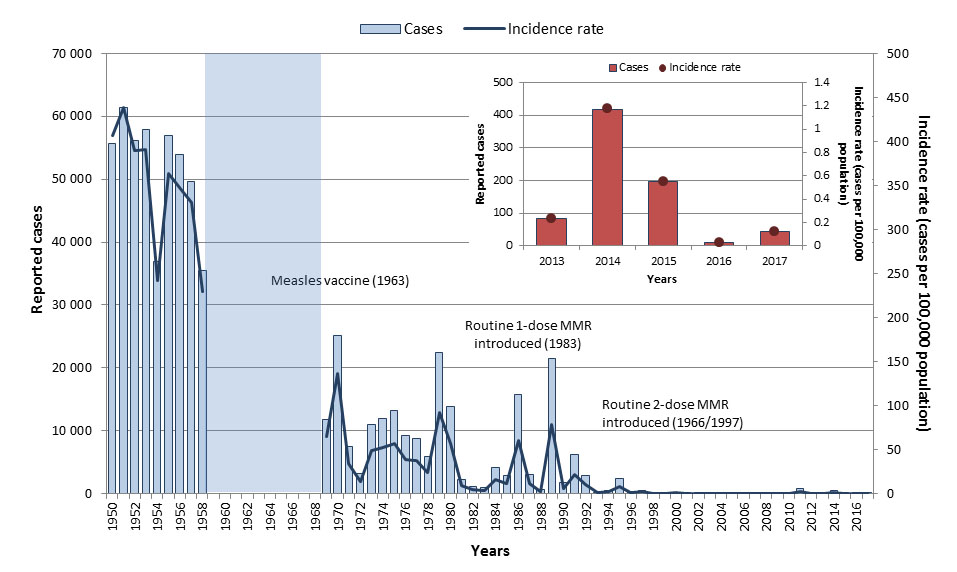
Figure 2: Text equivalent
| Year | Cases | Incidence rate (per 100,000 population) |
|---|---|---|
| 1950 | 55,653 | 406.6 |
| 1951 | 61,370 | 438.8 |
| 1952 | 56,178 | 389.2 |
| 1953 | 57,871 | 390.5 |
| 1954 | 36,850 | 241.5 |
| 1955 | 56,922 | 363.3 |
| 1956 | 53,986 | 348.1 |
| 1957 | 49,712 | 330.3 |
| 1958 | 35,531 | 229.3 |
| 1959 | - | - |
| 1960 | - | - |
| 1961 | - | - |
| 1962 | - | - |
| 1963 | - | - |
| 1964 | - | - |
| 1965 | - | - |
| 1966 | - | - |
| 1967 | - | - |
| 1968 | - | - |
| 1969 | 11,720 | 64.4 |
| 1970 | 25,137 | 136.4 |
| 1971 | 7,439 | 33.8 |
| 1972 | 3,136 | 14.1 |
| 1973 | 10,911 | 48.3 |
| 1974 | 11,985 | 52.3 |
| 1975 | 13,143 | 56.6 |
| 1976 | 9,158 | 38.9 |
| 1977 | 8,832 | 37.1 |
| 1978 | 5,858 | 24.4 |
| 1979 | 22,444 | 92.4 |
| 1980 | 13,864 | 56.3 |
| 1981 | 2,307 | 9.3 |
| 1982 | 1,064 | 4.2 |
| 1983 | 934 | 3.7 |
| 1984 | 4,086 | 15.9 |
| 1985 | 2,899 | 11.2 |
| 1986 | 15,796 | 60.3 |
| 1987 | 3,065 | 11.5 |
| 1988 | 710 | 2.6 |
| 1989 | 21,523 | 78.5 |
| 1990 | 1,738 | 6.3 |
| 1991 | 6,151 | 21.9 |
| 1992 | 2,915 | 10.2 |
| 1993 | 192 | 0.7 |
| 1994 | 517 | 1.8 |
| 1995 | 2,366 | 8.0 |
| 1996 | 328 | 1.1 |
| 1997 | 531 | 1.8 |
| 1998 | 17 | 0.1 |
| 1999 | 32 | 0.1 |
| 2000 | 207 | 0.7 |
| 2001 | 38 | 0.1 |
| 2002 | 9 | <0.1 |
| 2003 | 17 | 0.1 |
| 2004 | 9 | <0.1 |
| 2005 | 8 | <0.1 |
| 2006 | 13 | <0.1 |
| 2007 | 101 | 0.3 |
| 2008 | 61 | 0.2 |
| 2009 | 14 | <0.1 |
| 2010 | 98 | 0.3 |
| 2011 | 752 | 2.2 |
| 2012 | 10 | <0.1 |
| 2013 | 83 | 0.2 |
| 2014 | 418 | 1.2 |
| 2015 | 196 | 0.5 |
| 2016 | 11 | <0.1 |
| 2017 | 45 | 0.12 |
Epidemiology between 2013 and 2017
From 2013 to 2017, a total of 753 measles cases were reported in Canada through the Canadian Measles and Rubella Surveillance System. The annual number of reported cases ranged from 11 to 418, with an average of 151 cases. Of these cases, 65 (9%) were imported to Canada and 630 (84%) were due to subsequent transmissions in Canada (i.e., were exposed in Canada and could be linked to a confirmed measles case). For 58 cases (8%), the source of infection (i.e., a link to another measles case) or location of exposure (i.e., acquired in Canada or abroad) could not be determined. Annual incidence rates ranged from 0.03 to 1.2 cases per 100,000 population (Figure 2). Sixty-one (8%) cases were hospitalized. Cases were reported in every age group except among those aged 60 years or older. The most-affected age group varied from year to year depending on the outbreak context, but for the period as a whole, the highest incidence rates were reported in 10 to 14-year-olds (1.9 cases per 100,000 population), followed by five to nine-year-olds (1.8 cases per 100,000 population, (Figure 3). Cases were relatively evenly distributed across the sexes. Two large outbreaks were reported in Canada during this time period: one in 2014 where 325 cases were linked to an outbreak in the Netherlands; and another in 2015 where 159 cases were linked to an outbreak at a theme park in California.
In 2017, 45 measles cases were reported, of which nine were imported. The incidence rate was 0.1 cases per 100,000 population. Both age-specific incidence rates and case counts were highest among 25 to 29 years old (0.4 cases per 100,000 population, 11 cases). Six (13%) cases reported hospitalization. Based on the data for this period, Canada is on track to meet its vaccine preventable disease reduction target by year 2025 of zero endemic cases of measles. Canada continues to maintain its measles elimination status post 2017; however, an upswing in measles cases is being reported to the World Health Organization (WHO) worldwide. Future surveillance reports will provide an epidemiologic summary of measles activity reported in Canada post 2017.
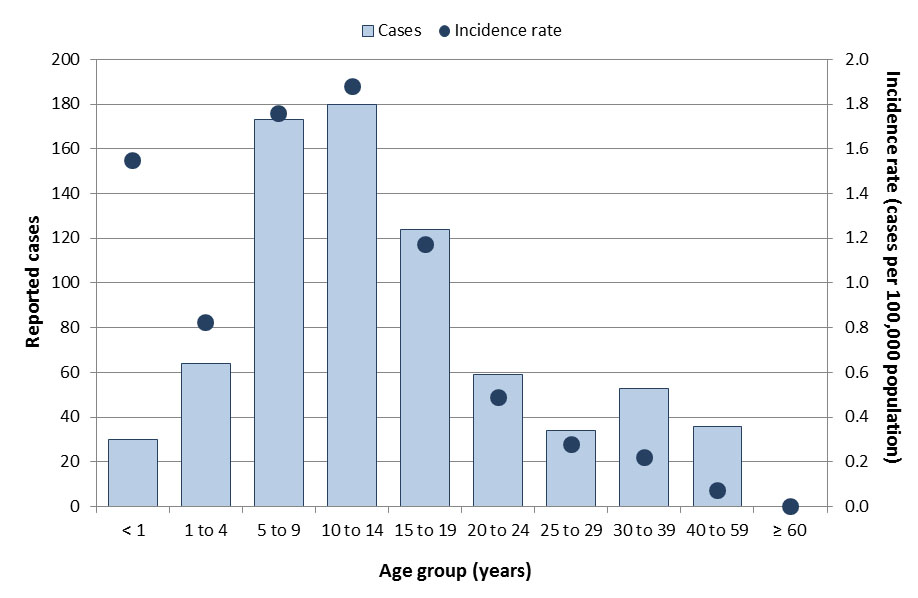
Figure 3: Text equivalent
| Age groups | Total number of cases | Incidence rate (per 100,000 population) |
|---|---|---|
| < 1 | 30 | 1.5 |
| 1 to 4 | 64 | 0.8 |
| 5 to 9 | 173 | 1.8 |
| 10 to 14 | 180 | 1.9 |
| 15 to 19 | 124 | 1.2 |
| 20 to 24 | 59 | 0.5 |
| 25 to 29 | 34 | 0.3 |
| 30 to 39 | 53 | 0.2 |
| 40 to 59 | 36 | 0.1 |
| ≥ 60 | 0 | 0 |
Measles vaccination coverage
Based on the 2017 cNICS, 90% of children in Canada received the recommended doses of measles-containing vaccine by two years of age and 87% received the recommended doses by seven years of ageReference 11.
Further reading
- PHAC measles webpage
- Canadian Immunization Guide measles vaccine chapter
- National Advisory Committee on Immunization measles vaccine guidance
- Measles annual reports
- Measles and rubella weekly reports
- Vaccination Coverage Goals and Vaccine Preventable Disease Reduction Targets by 2025
Rubella
Key points:
- With routine vaccination, the incidence of rubella in Canada has declined by over 99% from an average incidence rate of 107.2 cases per 100,000 population in the pre-vaccine era to 0.002 cases per 100,000 population from 2013 to 2017.
- While three cases of rubella were reported between 2013 and 2017 (all imported), none resulted in secondary transmission within Canada, thus maintaining Canada's rubella elimination status. Canada is on track to meet the disease reduction target of zero endemic rubella cases by 2025.
- Vaccination rates should be improved to reach the national goal of 95%. Based on the 2017 cNICS, 90% of children in Canada received the recommended dose of rubella-containing vaccine by two years of age and 94.5% received the recommended doses by seven years of ageFootnote i.
A rubella-containing vaccine was made available in Canada in 1969 and routine vaccination programs were in place across all provinces and territories by 1983 Reference 10Reference 12. Before rubella-containing vaccine became available, many thousands of rubella cases were reported annually and outbreaks occurred in three to six-year cycles. With routine vaccination, the incidence of rubella has declined by over 99% from an average incidence rate of 107.2 cases per 100,000 population in the pre-vaccine era (1950 to 1954)Footnote j to 0.002 cases per 100,000 population from 2013 to 2017 (Figure 4). Because imported cases continue to occur, there is still a risk of secondary spread to Canadians who are still vulnerable due to inadequate vaccination. Ongoing vigilance is required as a result.
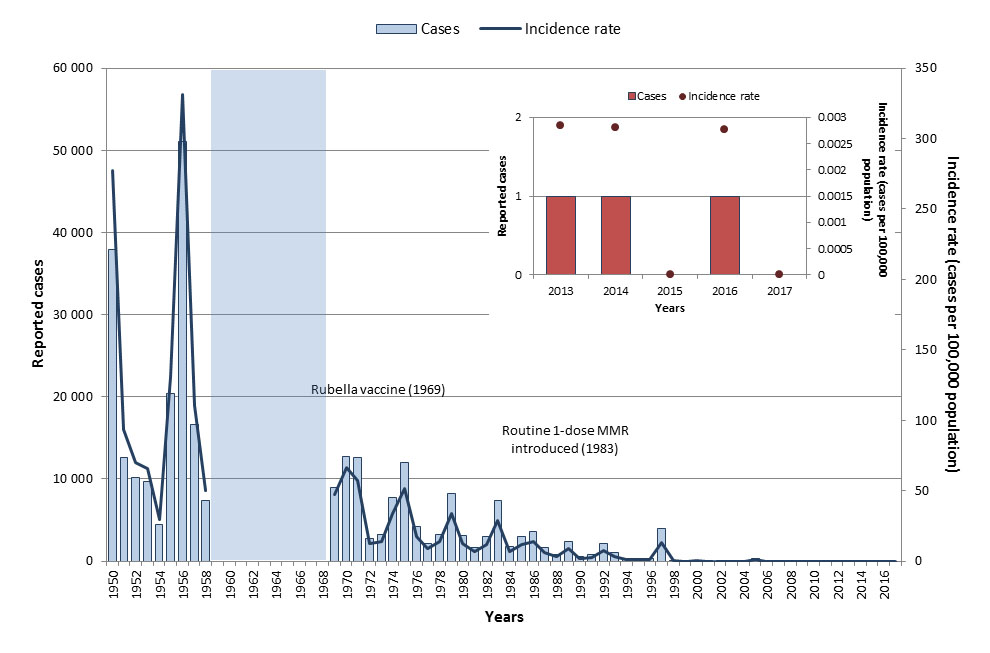
Figure 4: Text Description
| Year | Cases | Incidence rate (per 100,000 population) |
|---|---|---|
| 1950 | 37,917 | 277.0 |
| 1951 | 12,624 | 93.7 |
| 1952 | 10,116 | 70.1 |
| 1953 | 9,745 | 65.8 |
| 1954 | 4,468 | 29.5 |
| 1955 | 20,409 | 131.1 |
| 1956 | 51,036 | 331.2 |
| 1957 | 16,652 | 110.6 |
| 1958 | 7,431 | 50.3 |
| 1959 | - | - |
| 1960 | - | - |
| 1961 | - | - |
| 1962 | - | - |
| 1963 | - | - |
| 1964 | - | - |
| 1965 | - | - |
| 1966 | - | - |
| 1967 | - | - |
| 1968 | - | - |
| 1969 | 8,934 | 47.4 |
| 1970 | 12,710 | 66.7 |
| 1971 | 12,567 | 57.5 |
| 1972 | 2,808 | 12.7 |
| 1973 | 3,189 | 14.3 |
| 1974 | 7,732 | 34.1 |
| 1975 | 12,032 | 52.3 |
| 1976 | 4,167 | 17.9 |
| 1977 | 2,159 | 9.1 |
| 1978 | 3,270 | 13.7 |
| 1979 | 8,201 | 33.9 |
| 1980 | 3,138 | 12.8 |
| 1981 | 1,719 | 6.9 |
| 1982 | 2,973 | 11.8 |
| 1983 | 7,420 | 29.2 |
| 1984 | 1,831 | 7.1 |
| 1985 | 2,989 | 11.5 |
| 1986 | 3,570 | 13.6 |
| 1987 | 1,634 | 6.2 |
| 1988 | 801 | 3.0 |
| 1989 | 2,440 | 8.9 |
| 1990 | 506 | 1.8 |
| 1991 | 765 | 2.7 |
| 1992 | 2,201 | 7.7 |
| 1993 | 1,018 | 3.5 |
| 1994 | 241 | 0.8 |
| 1995 | 287 | 1.0 |
| 1996 | 272 | 0.9 |
| 1997 | 4,003 | 13.3 |
| 1998 | 63 | 0.2 |
| 1999 | 24 | 0.1 |
| 2000 | 29 | 0.1 |
| 2001 | 27 | 0.1 |
| 2002 | 15 | <0.1 |
| 2003 | 14 | <0.1 |
| 2004 | 9 | <0.1 |
| 2005 | 319 | 1.0 |
| 2006 | 9 | <0.1 |
| 2007 | 8 | <0.1 |
| 2008 | 5 | <0.1 |
| 2009 | 7 | <0.1 |
| 2010 | 13 | <0.1 |
| 2011 | 1 | <0.1 |
| 2012 | 2 | <0.1 |
| 2013 | 1 | <0.1 |
| 2014 | 1 | <0.1 |
| 2015 | 0 | 0 |
| 2016 | 1 | <0.1 |
| 2017 | 0 | 0 |
Epidemiology between 2013 and 2017
As rubella has been eliminated in Canada, disease activity generally results from imported cases. From 2013 to 2017, a total of three rubella cases were reported, ranging between zero and one case annually (Figure 4). The average incidence rate was 0.002 cases per 100,000 population for this time period. None of the cases reported hospitalization. All three cases were imported and were in adults between 25 and 59 years of age. No cases of rubella were reported in Canada in 2017. Based on the data for this period, Canada is on track to meet its disease reduction target of zero endemic rubella cases by 2025.
Rubella vaccination coverage
Based on the 2017 cNICS, 90% of children in Canada received the recommended one dose of rubella-containing vaccine by two years of age and 94.5% received the recommended doses by seven years of ageReference 11. In recent seroprevalence studies of cohorts of pregnant women in Canada, the percentage of study participants immune to rubella ranged from 84% to 92% Reference 13Reference 14Reference 15.
Further reading
- PHAC rubella and CRS webpage
- Canadian Immunization Guide rubella vaccine chapter
- National Advisory Committee on Immunization rubella vaccine guidance
- Measles and Rubella weekly reports
- Vaccination Coverage Goals and Vaccine Preventable Disease Reduction Targets by 2025
Congenital rubella syndrome and congenital rubella infection
Key points:
- With routine vaccination, the incidence of CRS/CRI in Canada has declined by 98% from an average incidence rate of 3.0 cases per 100,000 live births in the pre-vaccine era to 0.1 cases per 100,000 live births from 2013 to 2017.
- There have been no reported cases of CRS/CRI due to a rubella exposure in Canada since 2000, thus maintaining Canada's elimination status for CRS/CRI.
- Canada is on track to meet the disease reduction target of zero CRS/CRI cases by 2025.
With routine rubella vaccination, CRS/CRI has declined by 98%. The average incidence rate of CRS/CRI decreased from 3.0 cases per 100,000 live births in the pre-vaccine era (1950 to 1954)Footnote l to 0.1 cases per 100,000 live births from 2013 to 2017.
Epidemiology between 2013 and 2017
From 2013 to 2017, one case of CRS/CRI was reported in Canada in 2015, resulting in an incidence rate of 0.3 cases per 100,000 live births for that year. The case reported hospitalization and resulted from maternal exposure to rubella outside of Canada. There have been no reported cases of CRS/CRI due to rubella exposure within Canada since 2000. Since 2013, one case of CRS/CRI was reported, indicating that Canada is on track to meet its disease reduction target of zero cases of CRS/CRI by year 2025.
Rubella vaccination coverage
CRS/CRI is prevented by ensuring that women of childbearing age are vaccinated against rubella. Currently, no vaccine coverage estimates are available for this group. In recent seroprevalence studies of cohorts of pregnant women in Canada, the percentage of study participants immune to rubella ranged from 84% to 92%Reference 13Reference 14Reference 15.
Further reading
- PHAC rubella and CRS webpage
- Canadian Immunization Guide rubella vaccine chapter
- National Advisory Committee on Immunization rubella vaccine guidance
- Measles and Rubella weekly reports
- Vaccination Coverage Goals and Vaccine Preventable Disease Reduction Targets by 2025
Polio and acute flaccid paralysis
Key points:
- With routine vaccination, endemic polio has been eliminated in Canada. Incidence has declined from an average incidence rate of 17.5 cases per 100,000 population in the pre-vaccine era to zero cases reported from 2013 to 2017. Therefore, Canada is on track to meet its reduction target of zero cases of polio by 2025.
- Until polio eradication has been achieved globally, active surveillance of acute flaccid paralysis (AFP) remains critical given the continued risk of polio importation.
- Vaccination rates should be improved to reach the national goal of 95%. Based on the 2017 cNICS, 91% of children in Canada received the recommended doses of polio-containing vaccine by two years of age.
In Canada, polio vaccine was introduced in 1955. Vaccine programs switched from oral poliovirus vaccine (OPV) to inactivated poliomyelitis vaccines (IPV) exclusively in 1995/1996. Although Canada was certified polio-free in 1994, surveillance of poliomyelitis through systems monitoring for polio-like illness is essential due to the risk of importation from polio-endemic regions, vaccine-derived poliovirus importation from countries using the OPV and the existence of non-immunized populations in Canada. In Canada, between 2004 and 2012, four cases of vaccine-derived poliovirus were detected in infants who had travelled to, and were vaccinated in, countries using OPVReference 6. The incidence of polio in Canada was dramatically reduced with the introduction of vaccination programs across Canada in the 1950s. The average incidence rate of polio decreased from 17.5 cases per 100,000 population in the pre-vaccine era (1950 to 1954)Footnote m to zero from 2013 to 2017. Based on data for this period, Canada is on track to meet its disease reduction target of zero cases of polio by 2025. Until polio eradication has been achieved globally, active surveillance of AFP remains critical. As recommended by the WHO, Canada conducts AFP surveillance in children and youth less than 15 years of age to monitor for polio. Incidence rates for AFP appear to show a cyclical pattern, with increases observed every two to five years.
AFP epidemiology between 2013 and 2017
From 2013 to 2017, a total of 197 AFP cases were reported in Canada in those less than 15 years of age. The annual number of reported cases ranged from 27 to 52, with an average of 40 cases per year. Annual incidence rates ranged from 0.5 to 0.9 cases per 100,000 in the under 15 population, with slight increases observed in 2014 and 2016 (Figure 5). Fifty-six percent of cases were males (ranged from 33% to 67% annually). All cases were adjudicated against the polio case definition, and none were assessed to be polio. The majority of reported cases were diagnosed with either Guillain-Barré syndrome (58%) or transverse myelitis (22%).
In 2017, 32 AFP cases were reported in Canada in children less than 15 years old, for an incidence rate of 0.5 cases per 100,000 population, and none were due to polio. The mean age of the cases was 6.4 years and the median age was 4.5 years.
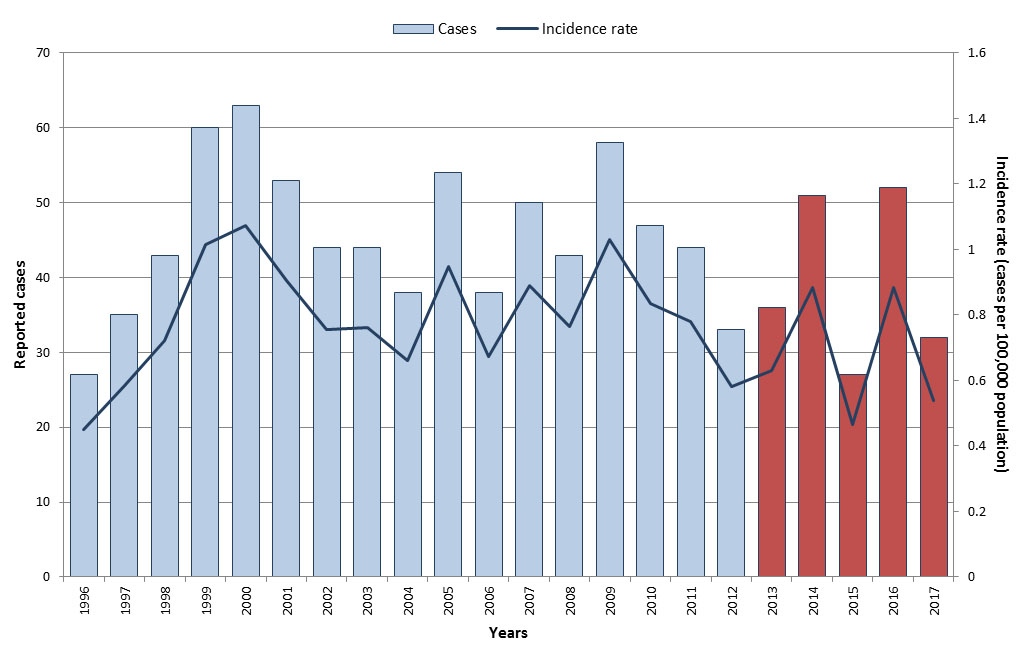
Figure 5: Text equivalent
| Year | Cases | Incidence rate (per 100,000 population) |
|---|---|---|
| 1996 | 27 | 0.5 |
| 1997 | 35 | 0.6 |
| 1998 | 43 | 0.7 |
| 1999 | 60 | 1.0 |
| 2000 | 63 | 1.1 |
| 2001 | 53 | 0.9 |
| 2002 | 44 | 0.8 |
| 2003 | 44 | 0.8 |
| 2004 | 38 | 0.7 |
| 2005 | 54 | 0.9 |
| 2006 | 38 | 0.7 |
| 2007 | 50 | 0.9 |
| 2008 | 43 | 0.8 |
| 2009 | 58 | 1.0 |
| 2010 | 47 | 0.8 |
| 2011 | 44 | 0.8 |
| 2012 | 33 | 0.6 |
| 2013 | 36 | 0.6 |
| 2014 | 50 | 0.9 |
| 2015 | 27 | 0.5 |
| 2016 | 52 | 0.9 |
| 2017 | 32 | 0.5 |
Polio vaccination coverage
Based on the 2017 cNICS, 91% of children in Canada received the recommended doses of polio-containing vaccine by two years of ageReference 11.
Further reading
- PHAC polio website
- PHAC AFP website
- Canadian Immunization Guide polio vaccine chapter
- National Advisory Committee on Immunization polio guidance
- Annual CPSP report: AFP in Canada
- The polio eradication endgame: Why immunization and continued surveillance is critical
- Global Polio Eradication Initiative
- Vaccination Coverage Goals and Vaccine Preventable Disease Reduction Targets by 2025
Vaccine preventable diseases with low-level incidence in Canada
Diphtheria
Key points:
- Routine vaccination has had a profound effect in reducing the incidence of diphtheria in Canada. The average incidence rate has declined by over 99% from 84.2 cases per 100,000 population in the pre-vaccine era to an average incidence rate of 0.005 cases per 100,000 population from 2013 to 2017.
- Surveillance data is currently not available to assess national reduction target of zero annual cases of respiratory diphtheria resulting from exposure by 2025.
- Despite the success of vaccination in reducing diphtheria disease burden, vaccination coverage rates remain low. Based on the 2017 cNICS, only 76% of children in Canada received the recommended doses of diphtheria-containing vaccine by two years of age and 81% received the recommended doses by seven years of age.
Vaccination against diphtheria has reduced the mortality and morbidity of diphtheria dramatically. With routine vaccination, the incidence of diphtheria has declined by over 99% from an average incidence rate of 84.2 cases per 100,000 population in the pre-vaccine era (1925 to 1929)Footnote o to 0.005 cases per 100,000 population from 2013 to 2017 (Figure 6).
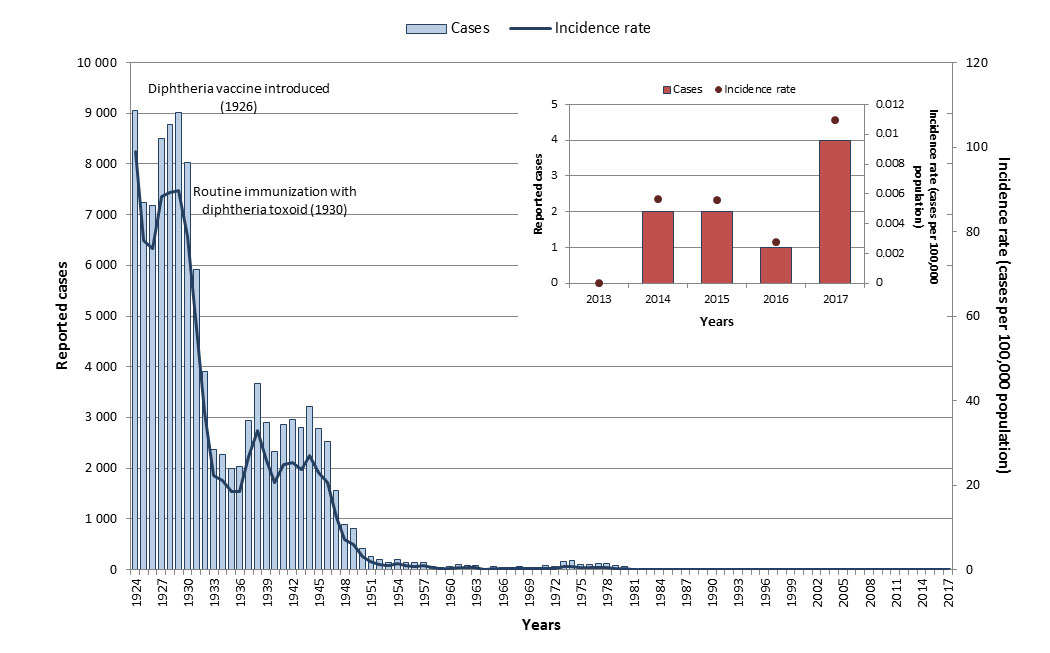
Figure 6: Text equivalent
| Year | Cases | Incidence rate (per 100,000 population) |
|---|---|---|
| 1924 | 9,057 | 99.1 |
| 1925 | 7,244 | 77.9 |
| 1926 | 7,175 | 75.9 |
| 1927 | 8,501 | 88.2 |
| 1928 | 8,781 | 89.3 |
| 1929 | 9,010 | 89.8 |
| 1930 | 8,036 | 78.7 |
| 1931 | 5,914 | 57.0 |
| 1932 | 3,912 | 37.2 |
| 1933 | 2,377 | 22.4 |
| 1934 | 2,267 | 21.1 |
| 1935 | 1,999 | 18.4 |
| 1936 | 2,031 | 18.5 |
| 1937 | 2,945 | 26.7 |
| 1938 | 3,676 | 33.0 |
| 1939 | 2,897 | 25.7 |
| 1940 | 2,335 | 20.5 |
| 1941 | 2,866 | 24.9 |
| 1942 | 2,955 | 25.4 |
| 1943 | 2,804 | 23.8 |
| 1944 | 3,223 | 27.0 |
| 1945 | 2,786 | 23.1 |
| 1946 | 2,535 | 20.6 |
| 1947 | 1,550 | 12.3 |
| 1948 | 898 | 7.0 |
| 1949 | 806 | 6.0 |
| 1950 | 421 | 3.1 |
| 1951 | 253 | 1.8 |
| 1952 | 190 | 1.3 |
| 1953 | 132 | 0.9 |
| 1954 | 208 | 1.4 |
| 1955 | 139 | 0.9 |
| 1956 | 135 | 0.8 |
| 1957 | 142 | 0.9 |
| 1958 | 66 | 0.4 |
| 1959 | 38 | 0.2 |
| 1960 | 55 | 0.3 |
| 1961 | 91 | 0.5 |
| 1962 | 71 | 0.4 |
| 1963 | 75 | 0.4 |
| 1964 | 23 | 0.1 |
| 1965 | 51 | 0.3 |
| 1966 | 38 | 0.2 |
| 1967 | 41 | 0.2 |
| 1968 | 61 | 0.3 |
| 1969 | 48 | 0.2 |
| 1970 | 47 | 0.2 |
| 1971 | 75 | 0.3 |
| 1972 | 68 | 0.3 |
| 1973 | 169 | 0.8 |
| 1974 | 173 | 0.8 |
| 1975 | 103 | 0.4 |
| 1976 | 109 | 0.5 |
| 1977 | 124 | 0.5 |
| 1978 | 119 | 0.5 |
| 1979 | 84 | 0.3 |
| 1980 | 55 | 0.2 |
| 1981 | 7 | <0.1 |
| 1982 | 11 | <0.1 |
| 1983 | 11 | <0.1 |
| 1984 | 8 | <0.1 |
| 1985 | 9 | <0.1 |
| 1986 | 6 | <0.1 |
| 1987 | 4 | <0.1 |
| 1988 | 4 | <0.1 |
| 1989 | 9 | <0.1 |
| 1990 | 7 | <0.1 |
| 1991 | 5 | <0.1 |
| 1992 | 1 | <0.1 |
| 1993 | 1 | <0.1 |
| 1994 | 3 | <0.1 |
| 1995 | 2 | <0.1 |
| 1996 | 0 | 0 |
| 1997 | 1 | <0.1 |
| 1998 | 0 | 0 |
| 1999 | 1 | <0.1 |
| 2000 | 0 | 0 |
| 2001 | 0 | 0 |
| 2002 | 1 | <0.1 |
| 2003 | 1 | <0.1 |
| 2004 | 0 | 0 |
| 2005 | 0 | 0 |
| 2006 | 0 | 0 |
| 2007 | 4 | <0.1 |
| 2008 | 2 | 0 |
| 2009 | 2 | 0 |
| 2010 | 2 | 0 |
| 2011 | 1 | 0 |
| 2012 | 0 | 0 |
| 2013 | 0 | 0 |
| 2014 | 2 | <0.1 |
| 2015 | 2 | <0.1 |
| 2016 | 1 | <0.1 |
| 2017 | 4 | <0.1 |
Epidemiology between 2013 and 2017
From 2013 to 2017, a total of nine diphtheria cases were reported in Canada, resulting in an overall incidence rate of 0.005 cases per 100,000 population during this time period. All ages were affected; however, the highest incidence rate was among those 10 to 14 years old (0.05 cases per 100,000 population). The current national case definition for diphtheria captures both respiratory and cutaneous diphtheria, with no distinction between the types of infection. Therefore, surveillance data is not available to assess the reduction target of zero annual cases of respiratory diphtheria resulting from exposure by 2025 in Canada. Work is currently underway to allow for surveillance of cases of respiratory diphtheria.
In 2017, four cases of diphtheria were reported resulting in an incidence rate of 0.01 cases per 100,000 population. Of the four cases, one was less than 15 years of age, one was between 30 and 39 years old and two were 60 years of age or over.
Diphtheria vaccination coverage
Based on the 2017 cNICS, 76% of children in Canada received the recommended doses of diphtheria-containing vaccine by two years of age, 81% received the recommended doses by seven years of age and 89% received a booster dose during adolescenceReference 11.
Further reading
- PHAC diphtheria website
- Canadian Immunization Guide diphtheria vaccine chapter
- National Advisory Committee on Immunization diphtheria vaccine guidance
- Vaccination Coverage Goals and Vaccine Preventable Disease Reduction Targets by 2025
Tetanus
Key points:
- With routine vaccination, the incidence of tetanus has declined by 95% from an average incidence rate of 0.21 cases per 100,000 population in the pre-vaccine era to 0.01 cases per 100,000 population from 2013 to 2017.
- Canada is on track to meet its reduction target of less than five cases of tetanus annually by 2025. However, surveillance data is currently not available to assess reduction targets of zero cases of maternal/neonatal tetanus by 2025.
- Maternal and neonatal tetanus was eliminated in the Regions of the Americas in 2017.
- Vaccination rates should be improved as they fall below the national goal of 95%. Based on the 2017 cNICS, 76% of children in Canada received the recommended doses of tetanus-containing vaccine by two years of age and 81% received the recommended doses by seven years of age.
Unlike other VPDs, tetanus is not transmitted from person to person and while cases have always been relatively rare in Canada, they are generally severe. As tetanus is not communicable, vaccination programs were introduced with a focus on individual protection instead of herd immunity and all provinces and territories had routine tetanus vaccination programs by the 1940sReference 10. With routine vaccination, the incidence of tetanus has declined by 95% from an average incidence rate of 0.2 cases per 100,000 population in the pre-vaccine era (1935 to 1939)Footnote p to 0.01 cases per 100,000 population from 2013 to 2017 (Figure 7).

Figure 7: Text equivalent
| Year | Cases | Incidence rate (per 100,000 population) |
|---|---|---|
| 1935 | 43 | 0.4 |
| 1936 | 38 | 0.3 |
| 1937 | 33 | 0.3 |
| 1938 | 26 | 0.2 |
| 1939 | 41 | 0.4 |
| 1940 | 25 | 0.2 |
| 1941 | 22 | 0.2 |
| 1942 | 20 | 0.2 |
| 1943 | 15 | 0.1 |
| 1944 | 16 | 0.1 |
| 1945 | 8 | 0.1 |
| 1946 | 9 | 0.1 |
| 1947 | 9 | 0.1 |
| 1948 | 13 | 0.1 |
| 1949 | 25 | 0.2 |
| 1950 | 22 | 0.2 |
| 1951 | 14 | 0.1 |
| 1952 | 12 | 0.1 |
| 1953 | 12 | 0.1 |
| 1954 | 12 | 0.1 |
| 1955 | 14 | 0.1 |
| 1956 | 5 | <0.1 |
| 1957 | 9 | 0.1 |
| 1958 | 10 | 0.1 |
| 1959 | 10 | 0.1 |
| 1960 | 12 | 0.1 |
| 1961 | 19 | 0.1 |
| 1962 | 9 | 0.0 |
| 1963 | 11 | 0.1 |
| 1964 | 15 | 0.1 |
| 1965 | 9 | <0.1 |
| 1966 | 5 | <0.1 |
| 1967 | 12 | 0.1 |
| 1968 | 9 | <0.1 |
| 1969 | 7 | <0.1 |
| 1970 | 11 | 0.1 |
| 1971 | 6 | <0.1 |
| 1972 | 3 | <0.1 |
| 1973 | 3 | <0.1 |
| 1974 | 8 | <0.1 |
| 1975 | 1 | <0.1 |
| 1976 | 7 | <0.1 |
| 1977 | 9 | <0.1 |
| 1978 | 5 | <0.1 |
| 1979 | 0 | 0 |
| 1980 | 0 | 0 |
| 1981 | 0 | 0 |
| 1982 | 0 | 0 |
| 1983 | 6 | <0.1 |
| 1984 | 2 | <0.1 |
| 1985 | 9 | <0.1 |
| 1986 | 4 | <0.1 |
| 1987 | 7 | <0.1 |
| 1988 | 3 | <0.1 |
| 1989 | 4 | <0.1 |
| 1990 | 6 | <0.1 |
| 1991 | 4 | <0.1 |
| 1992 | 4 | <0.1 |
| 1993 | 10 | <0.1 |
| 1994 | 4 | <0.1 |
| 1995 | 7 | <0.1 |
| 1996 | 3 | <0.1 |
| 1997 | 4 | <0.1 |
| 1998 | 2 | <0.1 |
| 1999 | 6 | <0.1 |
| 2000 | 4 | <0.1 |
| 2001 | 8 | <0.1 |
| 2002 | 1 | <0.1 |
| 2003 | 1 | <0.1 |
| 2004 | 3 | <0.1 |
| 2005 | 4 | <0.1 |
| 2006 | 2 | <0.1 |
| 2007 | 6 | <0.1 |
| 2008 | 1 | <0.1 |
| 2009 | 2 | <0.1 |
| 2010 | 4 | <0.1 |
| 2011 | 2 | <0.1 |
| 2012 | 4 | <0.1 |
| 2013 | 2 | <0.1 |
| 2014 | 6 | <0.1 |
| 2015 | 4 | <0.1 |
| 2016 | 5 | <0.1 |
| 2017 | 4 | <0.1 |
Epidemiology between 2013 and 2017
From 2013 to 2017, a total of 21 cases of tetanus were reported in Canada. The annual number of reported cases ranged from two to six, with an average of four cases reported per year. The overall incidence rate during this time period was 0.01 cases per 100,000 population. The large majority of the cases (86%) were in adults 20 years of age and older. Based on the data for this period, Canada is on track to meet its reduction target of less than five cases of tetanus annually by 2025. However, surveillance data is currently not available to assess reduction targets of zero cases of maternal/neonatal tetanus by 2025. Maternal and neonatal tetanus was eliminated in the Region of the Americas in 2017Reference 16. Work is currently underway to allow for surveillance of cases of maternal and neonatal tetanus at the national level.
Four tetanus cases were reported in 2017, of which three were adults and one was a child.
Tetanus vaccination coverage
Based on the 2017 cNICS, only 76% of children in Canada received the recommended doses of tetanus-containing vaccine by two years of age and only 81% received the recommended doses by seven years of ageReference 11. Based on the 2016 adult National Immunization Coverage Survey (aNICS), only 54% of adults received a tetanus-containing vaccine and only 46% of Canadians more than 65 years old received the vaccineReference 17.
Further reading
- PHAC tetanus webpage
- Canadian Immunization Guide tetanus vaccine chapter
- National Advisory Committee on Immunization tetanus vaccine guidance
- Vaccination Coverage Goals and Vaccine Preventable Disease Reduction Targets by 2025
Invasive disease due to Haemophilus influenza serotype b (Hib)
Key points:
- With routine vaccination, the incidence of invasive disease due to Hib has declined by 99% in children less than five years of age, decreasing from an average incidence rate of 34.6 cases per 100,000 population in the pre-vaccine era to 0.1 cases per 100,000 population from 2013 to 2017.
- Based on IMPACT data, Canada is on track to meet its disease reduction target of less than five cases of preventable Hib annually in children less than five years of age by 2025.
- Vaccine coverage remains low, particularly among infants. Based on the 2017 cNICS, only 73% of children in Canada received the recommended doses of Hib-containing vaccine by two years of age and 84% received the recommended doses by seven years of age.
Prior to the introduction of the Hib vaccine into provincial and territorial routine childhood vaccination schedules in 1988, Hib was the most common cause of bacterial meningitis in CanadaReference 10, particularly among infants. With routine vaccination, the incidence of invasive disease due to Hib has declined by 99% in children less than five years of age, from 34.6 cases per 100,000 population in the pre-vaccine era (1986 to 1987)Footnote r to 0.4 cases per 100,000 population from 2013 to 2017. In the general population, it has declined by 97% from 2.6 cases per 100,000 population in the pre-vaccine era (1986 to 1987) to 0.07 cases per 100,000 population from 2013 to 2017 (Figure 8). However, average rates between 2001 and 2015 were 14.5 times higher in northern Canada than the rest of CanadaFootnote sReference 18.

Figure 8: Text equivalent
| Year | Cases | Incidence rate (per 100,000 population) |
|---|---|---|
| 1986 | 694 | 2.7 |
| 1987 | 670 | 2.5 |
| 1988 | 798 | 3.0 |
| 1989 | 979 | 3.6 |
| 1990 | 529 | 1.9 |
| 1991 | 353 | 1.3 |
| 1992 | 284 | 1.0 |
| 1993 | 130 | 0.5 |
| 1994 | 72 | 0.2 |
| 1995 | 62 | 0.2 |
| 1996 | 69 | 0.2 |
| 1997 | 71 | 0.2 |
| 1998 | 56 | 0.2 |
| 1999 | 21 | 0.1 |
| 2000 | 33 | 0.1 |
| 2001 | 46 | 0.1 |
| 2002 | 50 | 0.2 |
| 2003 | 44 | 0.1 |
| 2004 | 38 | 0.1 |
| 2005 | 30 | 0.1 |
| 2006 | 32 | 0.1 |
| 2007 | 27 | 0.1 |
| 2008 | 45 | 0.1 |
| 2009 | 18 | 0.1 |
| 2010 | 17 | <0.1 |
| 2011 | 27 | 0.1 |
| 2012 | 24 | 0.1 |
| 2013 | 33 | 0.1 |
| 2014 | 26 | 0.1 |
| 2015 | 27 | 0.1 |
| 2016 | 12 | <0.1 |
| 2017 | 19 | 0.1 |
Epidemiology between 2013 and 2017
From 2013 to 2017, a total of 117 cases of invasive Hib were reported in Canada. The annual number of reported cases ranged from 12 to 33, with an average of 23 cases reported per year. Annual incidence rates ranged from 0.03 to 0.09 cases per 100,000 population (Figure 8). Cases were reported in every age group; however, the highest incidence rates were reported in children under five years of age and in adults 60 years of age and over (Figure 9). Males accounted for 61% of cases overall (range: 42% to 67%).
Based on data obtained through IMPACT, a total of 27 cases were hospitalized due to Hib in children 16 years of age and less from 2013 to 2017, averaging five cases per year (ranged from 2 to 11). Of those, 74% were male and 56% were in infants under one year of age. A total of two cases of preventable HibFootnote t were reported among children less than five years of age between 2013 and 2017. One death due to Hib was reported by IMPACT during this time period. Based on data for this period, Canada is on track to meet its disease reduction target of less than five cases of preventable Hib annually in children less than five years of age by 2025.
In 2017, 19 cases of invasive disease due to Hib were reported, with a corresponding incidence rate of 0.05 cases per 100,000 population. Incidence rates were highest among infants less than one year old (1.3 cases per 100,000 population) and in children one to four years old (0.3 cases per 100,000 population).

Figure 9: Text equivalent
| Age groups | Total number of cases | Overall incidence rate (per 100,000 population) |
|---|---|---|
| < 1 | 20 | 1.0 |
| 1 to 4 | 16 | 0.2 |
| 5 to 9 | 4 | <0.1 |
| 10 to 14 | 2 | <0.1 |
| 15 to 19 | 1 | <0.1 |
| 20 to 24 | 0 | 0 |
| 25 to 29 | 2 | <0.1 |
| 30 to 39 | 10 | <0.1 |
| 40 to 59 | 26 | 0.1 |
| ≥ 60 | 36 | 0.1 |
Haemophilus influenzae serotype b vaccination coverage
Based on the 2017 cNICS, only 73% of children in Canada received the recommended doses of Hib-containing vaccine by two years of age and 84% received the recommended doses by seven years of ageReference 11.
Further reading
- PHAC invasive Haemophilus influenzae disease webpage
- Canadian Immunization guide Haemophilus influenzae serotype b vaccine chapter
- National Advisory Committee on Immunization Haemophilus influenzae serotype b vaccine guidance
- Vaccination Coverage Goals and Vaccine Preventable Disease Reduction Targets by 2025
Invasive meningococcal disease
Key points:
- With routine vaccination, the incidence of IMD due to serogroup C in Canada has declined by 93% from an average incidence of 0.30 cases per 100,000 population in the pre-vaccine era to 0.02 cases per 100,000 population from 2013 to 2017. Overall IMD incidence has declined by 57% from an average incidence rate of 0.8 cases per 100,000 population in the pre-vaccine era to 0.31 cases per 100,000 population from 2013 to 2017.
- Canada is on track to meet its reduction target of less than five cases of IMD serogroup C annually in children less than 18 years of age by 2025.
- Serogroup B now accounts for the majority of reported IMD cases in Canada at 53% compared to only 6% for serogroup C. While vaccines targeting IMD serogroup B are not currently part of routine vaccination programs in Canada, meningococcal B vaccines have been used during outbreaks.
- Vaccination rates should be improved to reach the national goal of 95%. Based on the 2017 cNICS, 88% of children in Canada received the recommended dose of meningococcal C vaccine by two years of age.
Between 2002 and 2007, a variety of routine childhood and adolescent meningococcal vaccination programs using monovalent (targeting serogroup C) and quadrivalent (targeting serogroups A, C, W, and Y) conjugate vaccines were implemented in Canadian provinces and territoriesReference 19. The incidence of IMD overall decreased by 57% from an average incidence rate of 0.8 cases per 100,000 population in the pre-vaccine era (1997 to 2001)Footnote u to 0.32 cases per 100,000 population from 2013 to 2017 (Figure 10). With routine vaccination, the incidence of IMD serogroup C has declined by 93%, from an average incidence rate of 0.3 cases per 100,000 population in the pre-vaccine era (1997 to 2001) to 0.02 cases per 100,000 population from 2013 to 2017 (Figure 11). However, the average rate for all IMD serogroup between 2001 and 2005 was 1.7 times higher in northern Canada than the rest of CanadaFootnote vReference 18.
Although serogroup B is responsible for the majority of IMD cases, the incidence rate has been declining overall since it peaked in 2007. Although vaccines targeting IMD serogroup B are not currently part of routine vaccination programs in Canada, meningococcal B vaccines have been used during outbreaks.
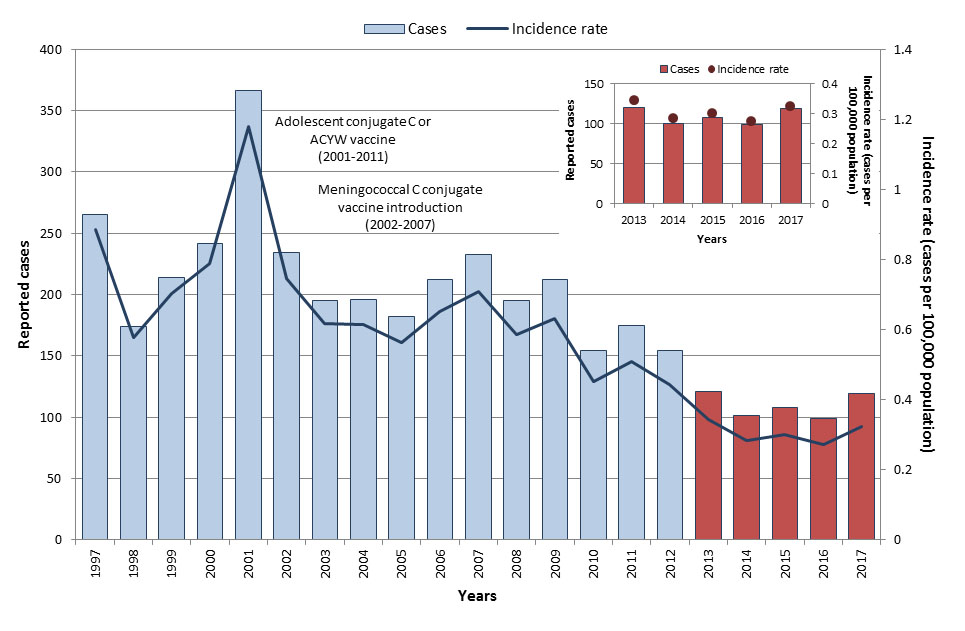
Figure 10: Text equivalent
| Year | Cases | Incidence rate (per 100,000 population) |
|---|---|---|
| 1997 | 265 | 0.9 |
| 1998 | 174 | 0.6 |
| 1999 | 214 | 0.7 |
| 2000 | 242 | 0.8 |
| 2001 | 366 | 1.2 |
| 2002 | 234 | 0.7 |
| 2003 | 195 | 0.6 |
| 2004 | 196 | 0.6 |
| 2005 | 182 | 0.6 |
| 2006 | 212 | 0.7 |
| 2007 | 233 | 0.7 |
| 2008 | 195 | 0.6 |
| 2009 | 212 | 0.6 |
| 2010 | 154 | 0.5 |
| 2011 | 175 | 0.5 |
| 2012 | 154 | 0.4 |
| 2013 | 121 | 0.3 |
| 2014 | 101 | 0.3 |
| 2015 | 108 | 0.3 |
| 2016 | 99 | 0.3 |
| 2017 | 119 | 0.3 |
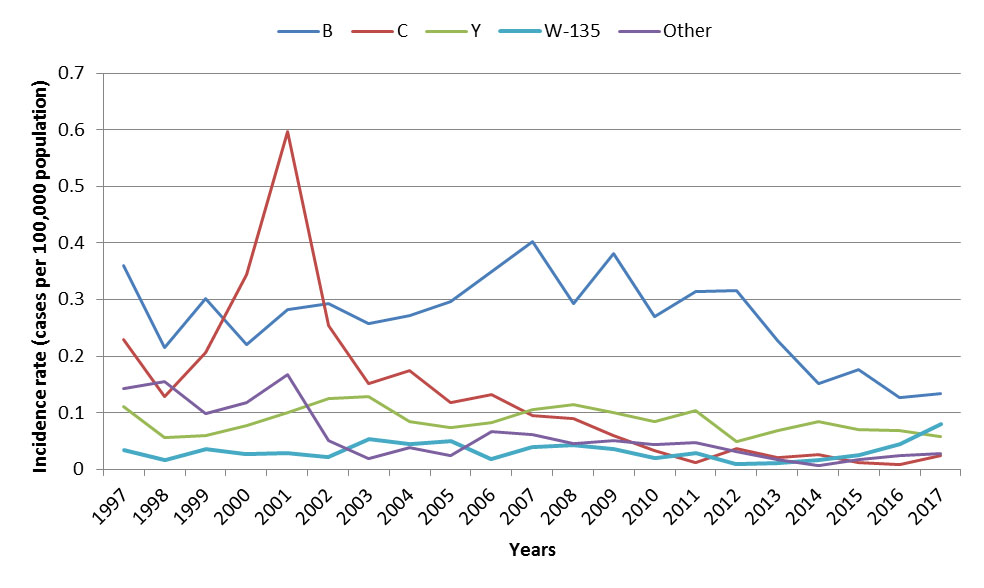
Figure 11: Text equivalent
| Year | Incidence rate by serogroup (per 100,000 population) | ||||
|---|---|---|---|---|---|
| B | C | Y | W-135 | Other | |
| 1997 | 0.36 | 0.23 | 0.11 | 0.03 | 0.14 |
| 1998 | 0.22 | 0.13 | 0.06 | 0.02 | 0.16 |
| 1999 | 0.30 | 0.21 | 0.06 | 0.04 | 0.10 |
| 2000 | 0.22 | 0.34 | 0.08 | 0.03 | 0.12 |
| 2001 | 0.28 | 0.60 | 0.10 | 0.03 | 0.17 |
| 2002 | 0.29 | 0.25 | 0.12 | 0.02 | 0.05 |
| 2003 | 0.26 | 0.15 | 0.13 | 0.05 | 0.02 |
| 2004 | 0.27 | 0.17 | 0.08 | 0.04 | 0.04 |
| 2005 | 0.30 | 0.12 | 0.07 | 0.05 | 0.02 |
| 2006 | 0.35 | 0.13 | 0.08 | 0.02 | 0.07 |
| 2007 | 0.40 | 0.09 | 0.11 | 0.04 | 0.06 |
| 2008 | 0.29 | 0.09 | 0.11 | 0.04 | 0.04 |
| 2009 | 0.38 | 0.06 | 0.10 | 0.04 | 0.05 |
| 2010 | 0.27 | 0.03 | 0.08 | 0.02 | 0.04 |
| 2011 | 0.31 | 0.01 | 0.10 | 0.03 | 0.05 |
| 2012 | 0.32 | 0.04 | 0.05 | 0.01 | 0.03 |
| 2013 | 0.23 | 0.02 | 0.07 | 0.01 | 0.02 |
| 2014 | 0.15 | 0.03 | 0.08 | 0.02 | 0.01 |
| 2015 | 0.18 | 0.01 | 0.07 | 0.03 | 0.02 |
| 2016 | 0.13 | 0.01 | 0.07 | 0.04 | 0.02 |
| 2017 | 0.13 | 0.02 | 0.06 | 0.08 | 0.03 |
Epidemiology between 2013 and 2017
From 2013 to 2017, a total of 548 IMD cases were reported in Canada. The annual number of reported cases ranged from 99 to 121, with an average of 110 cases reported per year. Annual incidence rates ranged from 0.27 to 0.34 cases per 100,000 population (Figure 10). Though cases were reported in every age group, the highest incidence rates were observed in infants less than one year of age followed by children from one to four years old (3.2 cases and 0.9 cases per 100,000 population respectively). The lowest overall incidence rate was reported among 30 to 39-year-olds (0.1 cases per 100,000 population, (Figure 12). Cases were relatively evenly distributed across the sexes. During this time, 55 IMD-associated deaths were reported to the eIMDSS, for a case-fatality rate of 10%.
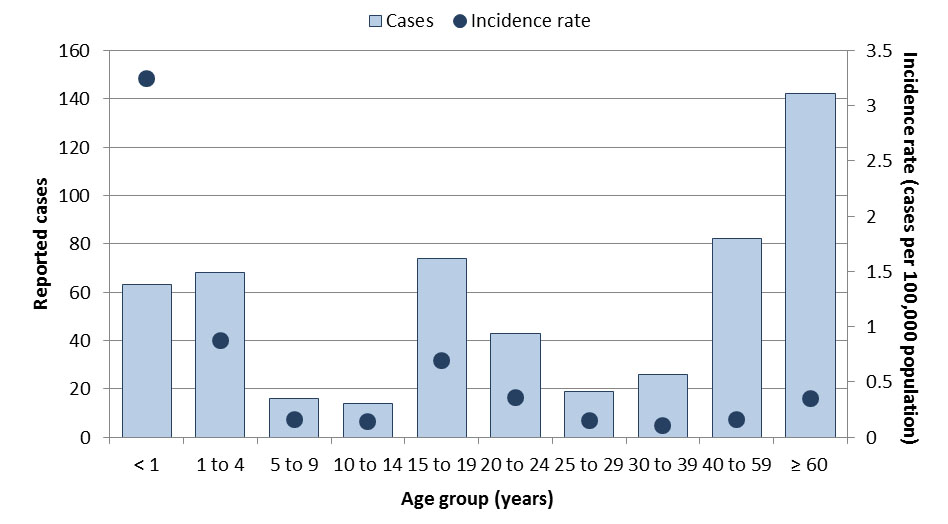
Figure 12: Text equivalent
| Age groups | Total number of cases | Overall incidence rate (per 100,000 population) |
|---|---|---|
| < 1 | 63 | 3.2 |
| 1 to 4 | 68 | 0.9 |
| 5 to 9 | 16 | 0.2 |
| 10 to 14 | 14 | 0.1 |
| 15 to 19 | 74 | 0.7 |
| 20 to 24 | 43 | 0.4 |
| 25 to 29 | 19 | 0.2 |
| 30 to 39 | 26 | 0.1 |
| 40 to 59 | 82 | 0.2 |
| ≥ 60 | 142 | 0.4 |
Since 2013, a decline in incidence rates for serogroups B and Y was observed. However, incidence rates for serogroup W-135 have been increasing since 2014, and other serogroups remained stable (Figure 11). From 2013 to 2017, IMD serogroup B was responsible for the majority of cases in all age groups (overall 53% of cases), and the highest incidence rates were observed in infants less than one year old followed by children from one to four years of age (2.5 cases and 0.8 cases per 100,000 population respectively). Disease caused by serogroup Y accounted for 23% of cases. Serogroup Y affected mostly adolescents between 15 and 19 years old with an incidence rate of 0.2 cases per 100,000 population, although 42% of all serogroup Y cases were individuals 60 years old and over (incidence rate of 0.1 cases per 100,000 population). IMD serogroup W accounted for 12% of cases and infants less than one year of age were most affected with an incidence rate of 0.4 cases per 100,000 population. Disease caused by serogroup C remained rare, accounting for only 6% of IMD cases. From 2013 to 2017, four cases of IMD caused by serogroup C were reported among those 18 years old and under, with an average 0.8 cases per year. Based on data for this period, Canada is on track to meet its reduction target of less than five cases of IMD serogroup C annually in children less than 18 years of age by 2025.
In 2017, 119 IMD cases were reported with a corresponding incidence rate of 0.32 cases per 100,000 population. Incidence rates were highest among infants less than one year of age, followed by those between 20 and 24 years old and those between 15 and 19 years old (3.34, 0.79 and 0.71 cases per 100,000 population respectively). Serogroup B accounted for the majority of the cases (41%), followed by serogroup W-135 (24%) and serogroup Y (18%). Serogroup C accounted for only 8% of cases.
Invasive meningococcal disease vaccination coverage
Based on the 2017 cNICS, 88% of children in Canada received the recommended dose of meningococcal C vaccine by two years of ageReference 11.
Further reading
- PHAC invasive meningococcal disease webpage
- Canadian Immunization Guide meningococcal vaccine chapter
- National Advisory Committee on Immunization meningococcal vaccine guidance
- Enhance surveillance of invasive meningococcal disease in Canada: 2006-2011
- Guidelines for the prevention and control of meningococcal disease (2005)
- Vaccination Coverage Goals and Vaccine Preventable Disease Reduction Targets by 2025
Mumps
Key points:
- With routine vaccination, the incidence of mumps in Canada has declined by over 99% from an average incidence rate of 251.2 cases per 100,000 population in the pre-vaccine era to 1.5 cases per 100,000 population from 2013 to 2017.
- Mumps outbreaks continue to occur every two to five years underscoring the need for ongoing vigilance and improving vaccination coverage. Several mumps outbreaks occurred in some provinces in late 2016 and 2017, resulting in significant increase in the number of reported cases. Therefore, Canada is not currently on track to meet its reduction target of maintaining less than 100 mumps cases annually (based on a five-year average) by 2025.
- Vaccination rates should be improved to reach the national goal of 95%. Based on the 2017 cNICS, 90% of children in Canada received the recommended doses of mumps-containing vaccine by two years of age and 86% received the recommended doses by seven years of age.
Routine one-dose vaccination against mumps was implemented across provinces and territories between 1969 and 1983, with the second dose programs implemented between 1996 and 2001Reference 20. With routine vaccination, the incidence rate of mumps declined from 251.2 cases per 100,000 population during the pre-vaccine era (1950 to 1954)Footnote y to 1.5 cases per 100,000 population between 2013 and 2017 (Figure 13). However, mumps continues to be a cyclical disease in Canada, with outbreaks occurring every few years.
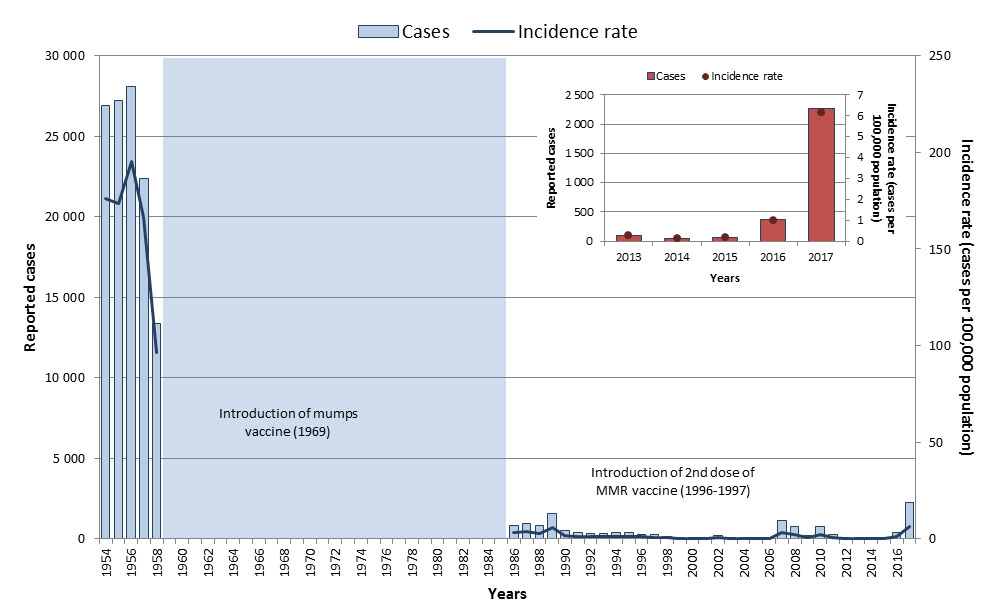
Figure 13: Text equivalent
| Year | Cases | Incidence rate (per 100,000 population) |
|---|---|---|
| 1950 | 43,671 | 318.5 |
| 1951 | 35,189 | 251.2 |
| 1952 | 38,439 | 265.8 |
| 1953 | 36,297 | 244.5 |
| 1954 | 26,908 | 176.0 |
| 1955 | 27,193 | 173.2 |
| 1956 | 28,112 | 195.2 |
| 1957 | 22,386 | 166.1 |
| 1958 | 13,360 | 96.3 |
| 1959 | - | - |
| 1960 | - | - |
| 1961 | - | - |
| 1962 | - | - |
| 1963 | - | - |
| 1964 | - | - |
| 1965 | - | - |
| 1966 | - | - |
| 1967 | - | - |
| 1968 | - | - |
| 1969 | - | - |
| 1970 | - | - |
| 1971 | - | - |
| 1972 | - | - |
| 1973 | - | - |
| 1974 | - | - |
| 1975 | - | - |
| 1976 | - | - |
| 1977 | - | - |
| 1978 | - | - |
| 1979 | - | - |
| 1980 | - | - |
| 1981 | - | - |
| 1982 | - | - |
| 1983 | - | - |
| 1984 | - | - |
| 1985 | - | - |
| 1986 | 836 | 3.2 |
| 1987 | 949 | 3.6 |
| 1988 | 792 | 3.0 |
| 1989 | 1,550 | 5.7 |
| 1990 | 535 | 1.9 |
| 1991 | 390 | 1.4 |
| 1992 | 330 | 1.2 |
| 1993 | 325 | 1.1 |
| 1994 | 356 | 1.2 |
| 1995 | 397 | 1.4 |
| 1996 | 290 | 1.0 |
| 1997 | 254 | 0.8 |
| 1998 | 114 | 0.4 |
| 1999 | 92 | 0.3 |
| 2000 | 81 | 0.3 |
| 2001 | 102 | 0.3 |
| 2002 | 200 | 0.6 |
| 2003 | 28 | 0.1 |
| 2004 | 33 | 0.1 |
| 2005 | 79 | 0.2 |
| 2006 | 42 | 0.1 |
| 2007 | 1,110 | 3.4 |
| 2008 | 748 | 2.2 |
| 2009 | 187 | 0.6 |
| 2010 | 768 | 2.3 |
| 2011 | 273 | 0.8 |
| 2012 | 48 | 0.1 |
| 2013 | 96 | 0.3 |
| 2014 | 40 | 0.1 |
| 2015 | 59 | 0.2 |
| 2016 | 365 | 1.0 |
| 2017 | 2 263 | 6.2 |
Epidemiology between 2013 and 2017
From 2013 to 2017, a total of 2,823 cases of mumps were reported nationally; however, 80% of the cases occurred in 2017 and were likely a result of various outbreaks that occurred in late 2016 and continued into 2017. This resulted in a five-year average of 565 cases per year (ranged from 40-2,263 cases with a median of 96). The overall incidence for this period was 1.5 cases per 100,000 population, ranging from 0.1 to 6.2 cases per 100,000 population (Figure 13). Adults aged 20 to 39 years old accounted for 53% of all mumps cases, with the highest incidence rates among those aged 20 to 24 years old (3.8 cases per 100,000 population). Due to large mumps outbreaks occurring in several provinces in late 2016 and 2017, Canada is not currently on track to meet its reduction target of maintaining less than 100 cases of mumps annually (based on a five-year average), by 2025.
In 2017, a total of 2,263 cases were reported in Canada, with a corresponding incidence rate of 6.2 cases per 100,000 population. Although cases were observed in all age groups, incidence rates were highest in the adolescent and young adult population (between 15 and 29 years of age) (Figure 14). Fifty-three percent of the cases were male.
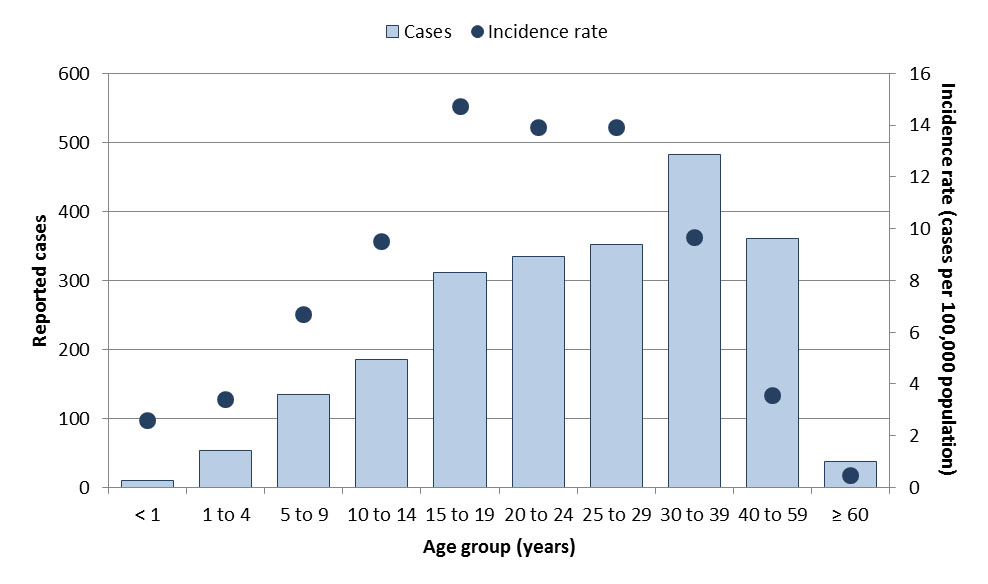
Figure 14: Text equivalent
| Age groups | Total number of cases | Overall incidence rate (per 100,000 population) |
|---|---|---|
| < 1 | 10 | 0.8 |
| 1 to 4 | 53 | 0.9 |
| 5 to 9 | 135 | 1.6 |
| 10 to 14 | 186 | 2.2 |
| 15 to 19 | 311 | 3.7 |
| 20 to 24 | 335 | 3.8 |
| 25 to 29 | 352 | 3.5 |
| 30 to 39 | 482 | 2.4 |
| 40 to 59 | 361 | 0.9 |
| ≥ 60 | 38 | 0.1 |
Mumps vaccination coverage
Based on the 2017 cNICS, 90% of children in Canada received the recommended doses of mumps-containing vaccine by two years of age and 86% received the recommended doses by seven years of ageReference 11.
Further reading
- PHAC mumps webpage
- Canadian Immunization Guide mumps vaccine chapter
- National Advisory Committee on Immunization mumps vaccine guidance
- Vaccination Coverage Goals and Vaccine Preventable Disease Reduction Targets by 2025
Vaccine preventable diseases with moderate-level incidence in Canada
Pertussis
Key points:
- With routine vaccination, the incidence of pertussis has declined by 96% in Canada from an average incidence rate of 156.3 cases per 100,000 population in the pre-vaccine era to an average incidence of 7.7 cases per 100,000 population from 2013 to 2017.
- However, continued vigilance is imperative as pertussis remains endemic in Canada with peaks in incidence rates observed every two to five years, and may last several years.
- Four deaths of infants under six months of age were reported from 2013 and 2017.
- Based on data from IMPACT from 2015 to 2017, Canada is on track to meet its reduction target of less than three deaths annually in infants less than six months of age (based on a three-year rolling average) by 2025.
- Based on the 2017 cNICS, only 76% of children in Canada received the recommended doses of pertussis-containing vaccine by two years of age, 81% by seven years of age, and 89% by 17 years of age. Based on the 2016 aNICS, 10% of adults in Canada received one dose of pertussis-containing vaccine.
Pertussis is an endemic and cyclical disease in Canada, with peaks at two to five-year intervals, and increased case counts may be observed over several years. Despite this, Canada has experienced an overall decline in pertussis incidence since the introduction of the whole-cell pertussis vaccine in 1943, acellular vaccines in 1997/1998, and the addition of an adolescent acellular dose to provincial and territorial vaccine programs between 1999 and 2004 Reference 21Reference 22. With routine vaccination, the incidence of pertussis has declined by 96% from an average incidence rate of 156.3 cases per 100,000 population in the pre-vaccine era (1938 to 1942)Footnote aa to 7.7 cases per 100,000 population from 2013 to 2017 (Figure 15). In 2013, the National Advisory Committee on Immunization (NACI) recommended that immunization with the tetanus, diphtheria, pertussis vaccine (Tdap) may be offered during pertussis outbreaks (as defined by a jurisdiction) to pregnant women who are 26 weeks of gestation or greater irrespective of their immunization history, and pregnant women who have not been immunized with Tdap in adulthood should be offered a pertussis vaccineReference 23. This report summarizes data and references NACI recommendations up until 2017. More recent recommendations on pertussis can be found in the National Advisory Committee on Immunization pertussis vaccine guidance document.
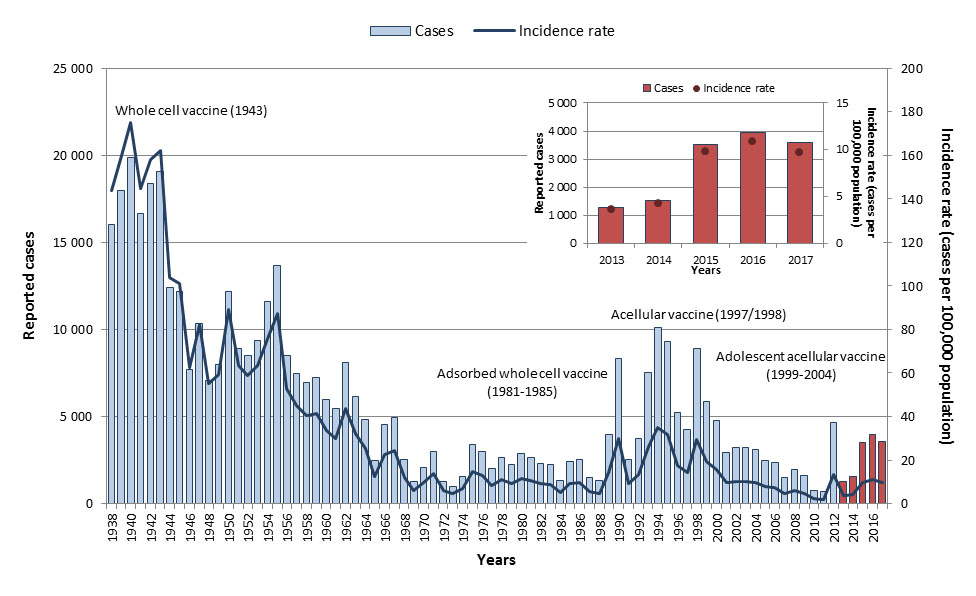
Figure 15: Text equivalent
| Year | Cases | Incidence rate (per 100,000 population) |
|---|---|---|
| 1938 | 16,003 | 143.7 |
| 1939 | 17,972 | 159.8 |
| 1940 | 19,878 | 174.9 |
| 1941 | 16,647 | 144.9 |
| 1942 | 18,384 | 158.0 |
| 1943 | 19,082 | 162.0 |
| 1944 | 12,384 | 103.8 |
| 1945 | 12,192 | 101.1 |
| 1946 | 7,671 | 62.5 |
| 1947 | 10,324 | 82.4 |
| 1948 | 7,084 | 55.3 |
| 1949 | 7,961 | 59.3 |
| 1950 | 12,182 | 89.0 |
| 1951 | 8,889 | 63.6 |
| 1952 | 8,520 | 59.0 |
| 1953 | 9,387 | 63.3 |
| 1954 | 11,600 | 76.0 |
| 1955 | 13,682 | 87.3 |
| 1956 | 8,513 | 52.9 |
| 1957 | 7,459 | 44.9 |
| 1958 | 6,932 | 40.6 |
| 1959 | 7,259 | 41.5 |
| 1960 | 5,993 | 33.6 |
| 1961 | 5,476 | 30.1 |
| 1962 | 8,076 | 43.5 |
| 1963 | 6,134 | 32.4 |
| 1964 | 4,844 | 25.1 |
| 1965 | 2,472 | 12.6 |
| 1966 | 4,555 | 22.8 |
| 1967 | 4,949 | 24.3 |
| 1968 | 2,505 | 12.1 |
| 1969 | 1,242 | 5.9 |
| 1970 | 2,098 | 9.9 |
| 1971 | 3,002 | 13.7 |
| 1972 | 1,297 | 5.8 |
| 1973 | 997 | 4.4 |
| 1974 | 1,579 | 6.9 |
| 1975 | 3,387 | 14.6 |
| 1976 | 3,002 | 12.8 |
| 1977 | 1,988 | 8.4 |
| 1978 | 2,666 | 11.1 |
| 1979 | 2,227 | 9.2 |
| 1980 | 2,873 | 11.7 |
| 1981 | 2,632 | 10.6 |
| 1982 | 2,314 | 9.2 |
| 1983 | 2,232 | 8.8 |
| 1984 | 1,353 | 5.3 |
| 1985 | 2,433 | 9.4 |
| 1986 | 2,557 | 9.8 |
| 1987 | 1,483 | 5.6 |
| 1988 | 1,301 | 4.9 |
| 1989 | 3,943 | 14.5 |
| 1990 | 8,330 | 30.1 |
| 1991 | 2,534 | 9.0 |
| 1992 | 3,763 | 13.3 |
| 1993 | 7,537 | 26.3 |
| 1994 | 10,116 | 34.9 |
| 1995 | 9,308 | 31.8 |
| 1996 | 5,230 | 17.7 |
| 1997 | 4,281 | 14.3 |
| 1998 | 8,896 | 29.5 |
| 1999 | 5,862 | 19.3 |
| 2000 | 4,748 | 15.5 |
| 2001 | 2,945 | 9.5 |
| 2002 | 3,199 | 10.2 |
| 2003 | 3,239 | 10.2 |
| 2004 | 3,104 | 9.7 |
| 2005 | 2,492 | 7.7 |
| 2006 | 2,346 | 7.2 |
| 2007 | 1,493 | 4.5 |
| 2008 | 1,967 | 5.9 |
| 2009 | 1,628 | 4.8 |
| 2010 | 750 | 2.2 |
| 2011 | 694 | 2.0 |
| 2012 | 4,652 | 13.4 |
| 2013 | 1,277 | 3.6 |
| 2014 | 1,528 | 4.3 |
| 2015 | 3,515 | 9.8 |
| 2016 | 3,944 | 10.9 |
| 2017 | 3,583 | 9.8 |
Epidemiology between 2013 and 2017
From 2013 to 2017, a total of 13,847 cases of pertussis were reported, averaging 2,769 cases per year (ranging from 1,277 to 3,944 cases). Annual incidence rates ranged from 3.6 to 10.9 cases per 100,000 population, with higher incidence rates observed between 2015 and 2017 (Figure 15). Although cases were reported across all age groups, incidence rates were highest in children under 15 years of age, especially in infants less than one year of age (Figure 16). Overall, 55% of the cases were female.
Based on data obtained through IMPACT, a total of 312 cases were hospitalized due to pertussis in children 16 years of age and less from 2013 to 2017, averaging 62 cases per year (ranged from 49 to 78). Of those, 52% were female. The large majority of the cases (87%) were in infants under six months of age; of those, half were in infants less than two months of age. A total of four deaths due to pertussis were reported between 2013 and 2017; all were in infants under six months of age, and averaging one or fewer deaths per year for that time period. Based on surveillance data from 2015 to 2017, Canada is on track to meet its disease reduction target of less than three deaths annually in infants less than six months of age, based on a three-year rolling average, by 2025.
In 2017, 3,583 pertussis cases were reported, with a corresponding incidence rate of 9.8 cases per 100,000 population. Incidence rates were highest among infants less than one year of age (72.5 cases per 100,000 population), followed by children one to four years old, 10 to 14 years old and five to nine years old (40.0, 37.9 and 35.4 cases per 100,000 population respectively). Based on data obtained through IMPACT, one death was reported in an infant under six months old.
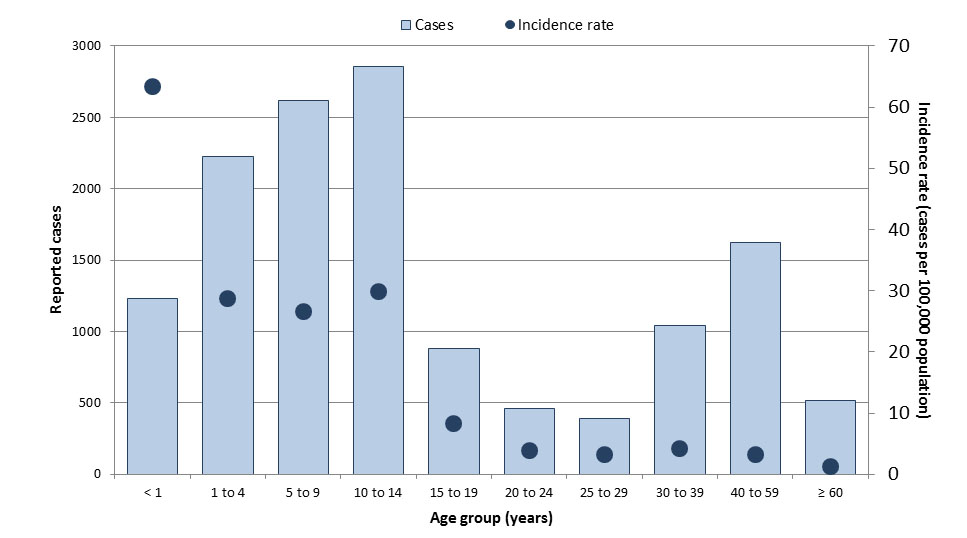
Figure 16: Text equivalent
| Age groups | Total number of cases | Overall incidence rate (per 100,000 population) |
|---|---|---|
| < 1 | 1,229 | 63.3 |
| 1 to 4 | 2,226 | 28.7 |
| 5 to 9 | 2,620 | 26.6 |
| 10 to 14 | 2,856 | 29.8 |
| 15 to 19 | 884 | 8.3 |
| 20 to 24 | 462 | 3.8 |
| 25 to 29 | 387 | 3.2 |
| 30 to 39 | 1,040 | 4.3 |
| 40 to 59 | 1,620 | 3.2 |
| ≥ 60 | 514 | 1.3 |
Pertussis vaccination coverage
Based on the 2017 cNICS, only 76% of children in Canada received the recommended doses of pertussis-containing vaccine by two years of age, 81% received the recommended doses by seven years of age, and 89% received the recommended doses by 17 years of ageReference 11. Based on the 2016 aNICS, 10% of adults in Canada received one dose of the pertussis-containing vaccine in adulthoodReference 17.
Further reading
- PHAC pertussis webpage
- Canadian Immunization Guide pertussis vaccine chapter
- National Advisory Committee on Immunization pertussis vaccine guidance
- Vaccination Coverage Goals and Vaccine Preventable Disease Reduction Targets by 2025
Invasive pneumococcal disease
Key points:
- With the implementation of routine childhood pneumococcal vaccination between 2002 and 2006, invasive pneumococcal disease (IPD) incidence among children less than two years of age has decreased substantially from a peak of 73.0 cases per 100,000 population in 2003 to an average of 16.0 cases per 100,000 population from 2013 to 2017. Conversely, incidence rates among adults 65 years of age and older have remained relatively unchanged since the early 2000s; therefore, Canada is not currently on track to meet its target of a 5% reduction in the overall incidence of IPD among adults 65 years and older by 2025.
- Based on the 2017 cNICS, 81% of children in Canada received the recommended doses of pneumococcal vaccine by two years of age. Based on the 2016 aNICS, 42% of adults 65 years and older in Canada received a pneumococcal vaccine.
Streptococcus pneumoniae (pneumococcus) is the leading cause of invasive bacterial infections, bacterial pneumonia and acute otitis media in young children. IPD became nationally notifiable in 2000; before this time, only cases of pneumococcal meningitis were notifiable nationally. Following a period of instability in incidence rates due to this change in reporting practice, overall annual incidence rates of IPD have remained relatively stable since 2003, ranging between 8.9 and 9.5 cases per 100,000 population per year (Figure 17). However, average rates between 2001 and 2015 were 2.8 times higher in northern Canada than the rest of CanadaFootnote acReference 18.
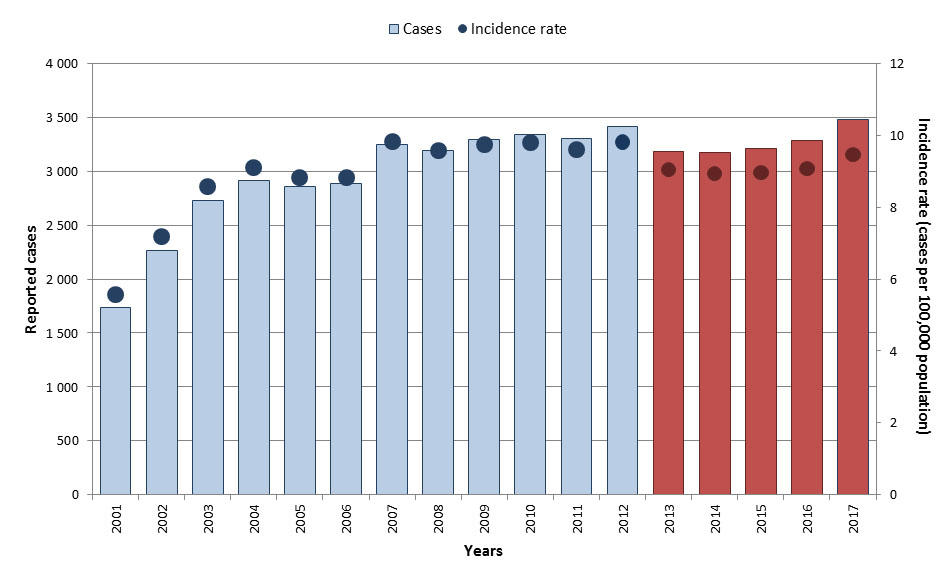
Figure 17: Text equivalent
| Year | Cases | Incidence rate (per 100,000 population) |
|---|---|---|
| 2000 | 1,357 | 4.4 |
| 2001 | 1,733 | 5.6 |
| 2002 | 2,261 | 7.2 |
| 2003 | 2,725 | 8.6 |
| 2004 | 2,914 | 9.1 |
| 2005 | 2,857 | 8.9 |
| 2006 | 2,883 | 8.9 |
| 2007 | 3,249 | 9.9 |
| 2008 | 3,192 | 9.6 |
| 2009 | 3,291 | 9.8 |
| 2010 | 3,344 | 9.8 |
| 2011 | 3,307 | 9.6 |
| 2012 | 3,418 | 9.8 |
| 2013 | 3,185 | 9.0 |
| 2014 | 3,177 | 8.9 |
| 2015 | 3,212 | 9.0 |
| 2016 | 3,290 | 9.1 |
| 2017 | 3,477 | 9.5 |
NACI recommends routine immunization against IPD for those aged two years and under and those aged 65 years and older. In the absence of national surveillance data prior to 2000, incidence rates for children less than two years of age (between 1994 and 1999) were estimated by various studies and ranged from 58.8 cases to 112.2 cases per 100,000 populationReference 24. Following the implementation of routine pneumococcal childhood vaccination between 2002 and 2006, IPD incidence among children less than two years of age decreased to an average of 16.0 cases per 100,000 population from 2013 to 2017 (Figure 18). The proportion of IPD due to serotypes covered by the PCV7 vaccine decreased considerably following its introduction in all provinces and territories by 2006 Reference 25Reference 26Reference 27Reference 28. By 2010, serotypes covered by the PCV7 vaccine represented 6% of all IPD cases in children 14 years of age and under, while responsible for over 80% of invasive disease in children during the pre-conjugate vaccine eraReference 26Reference 29. Following the introduction of the PCV13 vaccine in all provinces and territories by 2011, PCV13 specific serotype cases have declined in all ages from 45.5% in 2010 to 20% in 2016Reference29Reference 30. Although the 23-valent pneumococcal polysaccharide vaccine has been licensed for use in Canada since 1983 and included in routine vaccination programs for those 65 years of age and older in all provinces and territories by 2000Reference 31, the average incidence in this age group has remained relatively unchanged since the early 2000s.
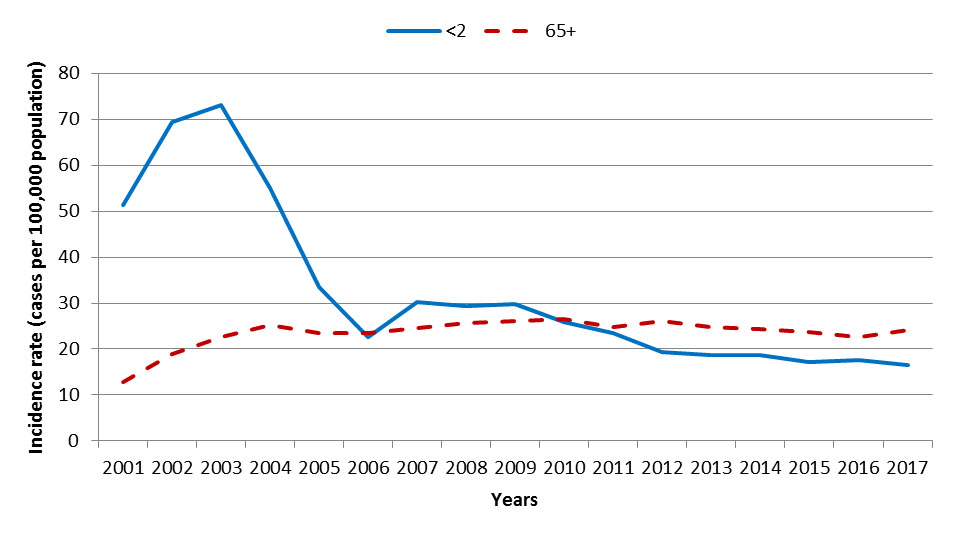
Figure 18: Text equivalent
| Year | Incidence rate per age groups (per 100,000 population) | |
|---|---|---|
| <2 | 65+ | |
| 2001 | 51.4 | 12.9 |
| 2002 | 69.4 | 18.9 |
| 2003 | 73.0 | 22.5 |
| 2004 | 55.1 | 25.1 |
| 2005 | 33.6 | 23.5 |
| 2006 | 22.7 | 23.5 |
| 2007 | 30.2 | 24.6 |
| 2008 | 29.3 | 25.5 |
| 2009 | 29.7 | 26.1 |
| 2010 | 25.9 | 26.5 |
| 2011 | 23.4 | 24.8 |
| 2012 | 19.3 | 26.0 |
| 2013 | 18.8 | 24.7 |
| 2014 | 18.7 | 24.4 |
| 2015 | 17.1 | 23.6 |
| 2016 | 17.6 | 22.7 |
| 2017 | 16.4 | 24.0 |
Epidemiology between 2013 and 2017
From 2013 to 2017, a total of 16,341 IPD cases were reported in Canada. The annual number of reported cases ranged from 3,177 to 3,477, with an average of 3,268 cases per year. Annual incidence rates ranged from 8.9 and 9.5 cases per 100,000 population (Figure 17). Although cases were reported across all age groups, the highest incidence rates were in seniors (aged 60 years and older), in infants less than one year and young children under five years of age (Figure 19). Males accounted for 55% of cases overall. Based on data for this period, Canada is not currently on track to meet the 5% disease reduction target for IPD in adults 65 years and older by 2025.
Based on data obtained through IMPACT, a total of 750 cases were hospitalized due to IPD in children 16 years of age and less from 2013 to 2017, averaging 150 cases per year (ranged from 132 to 164). Of those, 55% were male. The majority of the cases (67%) were in children less than five years of age. Approximately 80% of the cases had information on IPD serotypes. Of these, approximately 74% were due to serotypes not included in the pneumococcal conjugate 13-valent (Pneu-C-13) vaccine. A total of 18 deaths due to IPD were reported between 2013 and 2017 through IMPACT, ranging from two to five deaths per year, and the majority (83%) were in children under five years of age.
In 2017, 3,477 IPD cases were reported, with a corresponding incidence rate of 9.5 cases per 100,000 population. Incidence rates were highest among adults 60 years of age and older (21.2 cases per 100,000 population) and infants less than one year of age (15.2 cases per 100,000 population).
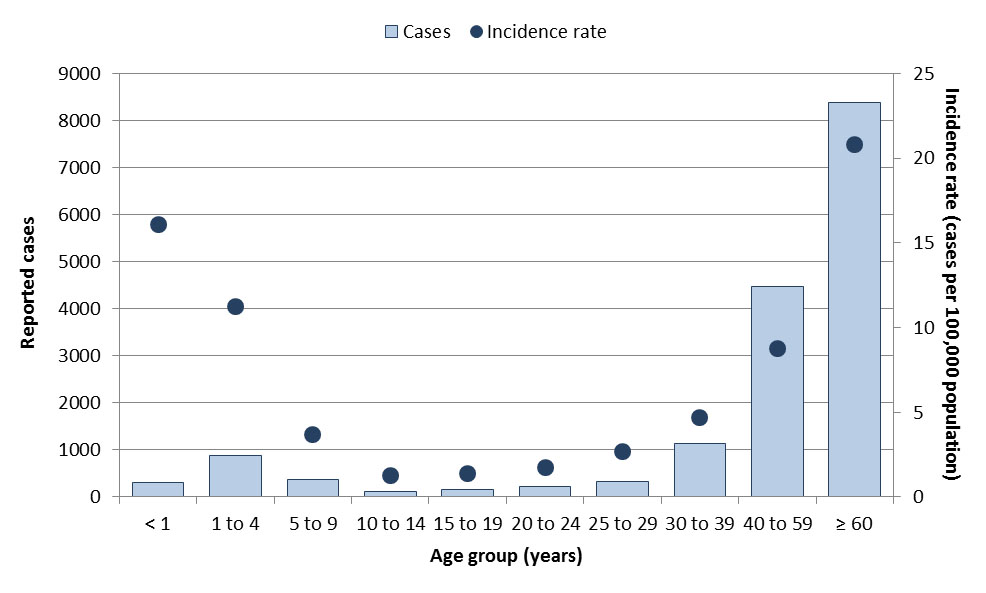
Figure 19: Text equivalent
| Age groups | Total number of cases | Overall incidence rate (per 100,000 population) |
|---|---|---|
| < 1 | 312 | 16.1 |
| 1 to 4 | 874 | 11.3 |
| 5 to 9 | 361 | 3.7 |
| 10 to 14 | 121 | 1.3 |
| 15 to 19 | 146 | 1.4 |
| 20 to 24 | 210 | 1.7 |
| 25 to 29 | 330 | 2.7 |
| 30 to 39 | 1,142 | 4.7 |
| 40 to 59 | 4,472 | 8.8 |
| ≥ 60 | 8,373 | 20.8 |
IPD vaccination coverage
Based on the 2017 cNICS, only 81% of children in Canada received the recommended doses of pneumococcal vaccine by two years of ageFootnote afReference 11. Based on the 2016 aNICS, 42% of adults 65 years of age and older in Canada received a pneumococcal vaccineReference 17.
Further reading
- PHAC invasive pneumococcal disease webpage
- Canadian Immunization Guide pneumococcal vaccine chapter
- National Advisory Committee on Immunization pneumococcal vaccine guidance
- Serotype distribution of invasive Streptococcus pneumoniae in Canada after the introduction of the 13-valent pneumococcal conjugate vaccine, 2010-2012
- National Laboratory Surveillance of Invasive Streptococcal disease in Canada - Annual Summary 2016
- National Laboratory Surveillance of Invasive Streptococcal Disease in Canada - Annual Summary 2017 (executive summary)
- Vaccination Coverage Goals and Vaccine Preventable Disease Reduction Targets by 2025
Varicella
Key points:
- Although nationally notifiable, varicella is not reportable in all jurisdictions. Data presented is therefore an underestimate of the true burden of varicella in Canada.
- With routine vaccination, the incidence of varicella in Canada has declined by 99% from an average incidence rate of 213.3 cases per 100,000 population in the pre-vaccine era to 2.9 cases per 100,000 population from 2013 to 2017. Data from IMPACT also suggests an overall decline in hospitalizations associated with serious varicella infections.
- Based on data from IMPACT, Canada is on track to meet its reduction target of less than 50 hospitalizations annually for varicella in vaccine-eligible children less than 18 years of age, by 2025.
- Vaccination rates should be improved to reach the national goal of 95%. Based on the 2017 cNICS, only 83% of children in Canada received the recommended doses of varicella-containing vaccine by two years of age.
The varicella vaccine was first approved in Canada in 1998, and routine varicella vaccination programs were implemented in Canadian provinces and territories between 2000 and 2007Reference 32. Based on data from reporting jurisdictions, the average incidence of varicella has declined by approximately 99% from 213.3 cases per 100,000 population in the pre-vaccine era (1993 to 1997)Footnote ag to an average incidence of 2.9 cases per 100,000 population between 2013 and 2017 (Figure 20).
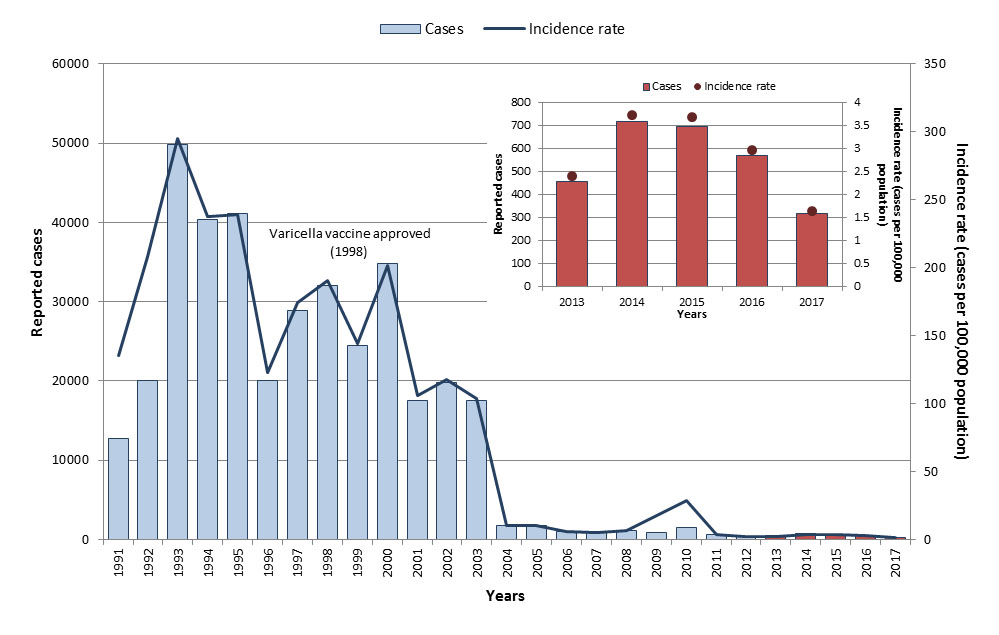
Figure 20: Text equivalent
| Year | Cases | Incidence rate (per 100,000 population) |
|---|---|---|
| 1993 | 49,779 | 296.0 |
| 1994 | 40,416 | 238.0 |
| 1995 | 41,087 | 239.6 |
| 1996 | 20,077 | 123.1 |
| 1997 | 28,866 | 174.9 |
| 1998 | 32,024 | 190.8 |
| 1999 | 24,509 | 144.5 |
| 2000 | 34,866 | 202.6 |
| 2001 | 17,515 | 106.4 |
| 2002 | 19,761 | 118.1 |
| 2003 | 17,572 | 103.8 |
| 2004 | 1,734 | 10.1 |
| 2005 | 1,750 | 10.1 |
| 2006 | 1,041 | 5.9 |
| 2007 | 870 | 4.9 |
| 2008 | 1,138 | 6.3 |
| 2009 | 933 | 18.1 |
| 2010 | 1,511 | 15.9 |
| 2011 | 681 | 3.7 |
| 2012 | 355 | 1.9 |
| 2013 | 456 | 2.4 |
| 2014 | 719 | 3.7 |
| 2015 | 694 | 3.7 |
| 2016 | 568 | 3.0 |
| 2017 | 315 | 1.6 |
Epidemiology between 2013 and 2017
Based on data from reporting jurisdictions, 2,752 varicella cases were reported in Canada from 2013 to 2017. The annual number of reported cases ranged from 315 to 719, with an average of 550 cases per year. Annual incidence rates ranged from 1.6 to 3.7 cases per 100,000 population (Figure 20). Cases were reported in every age group; however, the highest overall incidence rate was reported among infants less than one year old (11.8 cases per 100,000 population) and children aged five to fourteen years old (11.0 and 10.6 cases per 100,000 population for five to nine years old and for ten to fourteen years old respectively (Figure 21). Males accounted for 54% of cases overall.

Figure 21: Text equivalent
| Age groups | Total number of cases | Incidence rate (per 100,000 population) |
|---|---|---|
| < 1 | 124 | 11.8 |
| 1 to 4 | 280 | 6.6 |
| 5 to 9 | 597 | 11.0 |
| 10 to 14 | 567 | 10.6 |
| 15 to 19 | 283 | 4.8 |
| 20 to 24 | 178 | 2.7 |
| 25 to 29 | 158 | 2.3 |
| 30 to 39 | 248 | 1.9 |
| 40 to 59 | 231 | 0.8 |
| ≥ 60 | 84 | 0.4 |
Data from IMPACT demonstrate an overall decline in paediatric hospitalizations associated with serious varicella infections in children 16 years of age and younger, since the introduction of routine vaccination programs; decreasing from 398 hospitalizations reported in 2000 to an annual average of 59 hospitalizations (ranged from 42 to 73) from 2013 to 2017 (Figure 22). Fifty-seven percent of the cases from 2013 to 2017 were male. In that time period, the distribution of cases through age groups were similar between those aged one to four and five to nine (each accounting for 32% of cases) and was lowest in infants under one year of age (15%). Between 2013 and 2017, the majority of cases (87%) occurred among children who were immunocompromised, not eligible for vaccination, or not vaccinated. One death associated with varicella was reported through IMPACT during that time period. Among children eligible for vaccination Reference aj, an average of 19 hospitalizations were reported annually from 2013 to 2017. Based on the data for this period, Canada is on track to meet its vaccine preventable disease target of less than 50 hospitalizations annually due to varicella in vaccine-eligible children less than 18 years of age, by 2025.
In 2017, 315 varicella cases were reported, with a corresponding incidence rate of 1.6 cases per 100,000 population. Incidence rates were highest among infants less than one year old (6.6 cases per 100,000 population), 10 to 14-year-olds (4.6 cases per 100,000 population), and 15 to 19-year-olds (3.5 cases per 100,000 population).
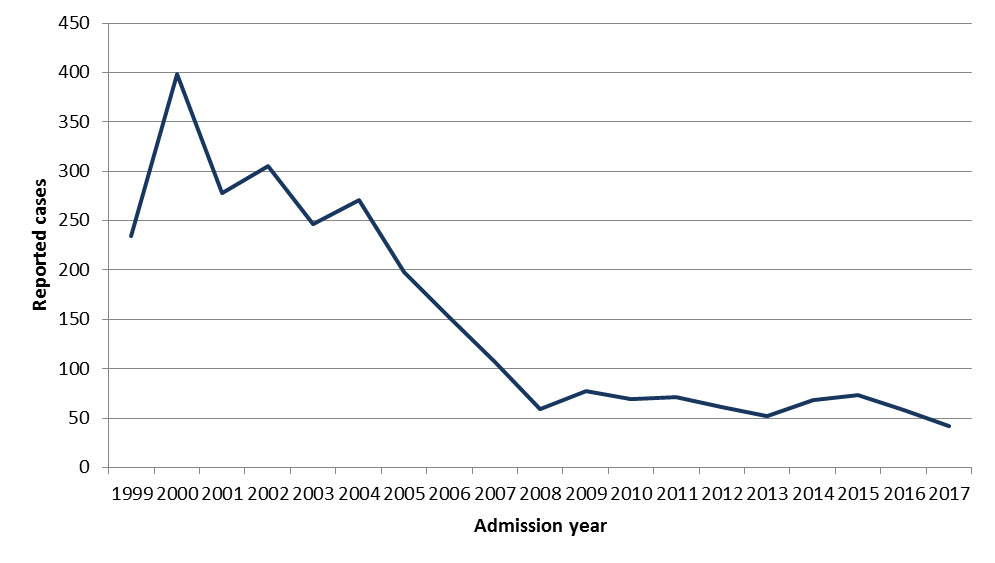
Figure 22: Text equivalent
| Year | Number of pediatric varicella hospitalizations |
|---|---|
| 1999 | 234 |
| 2000 | 398 |
| 2001 | 278 |
| 2002 | 305 |
| 2003 | 247 |
| 2004 | 271 |
| 2005 | 198 |
| 2006 | 152 |
| 2007 | 107 |
| 2008 | 59 |
| 2009 | 77 |
| 2010 | 69 |
| 2011 | 71 |
| 2012 | 61 |
| 2013 | 52 |
| 2014 | 68 |
| 2015 | 73 |
| 2016 | 58 |
| 2017 | 42 |
Varicella vaccination coverage
Based on the 2017 cNICS, only 83% of children in Canada received the recommended dose of varicella vaccine by two years of ageReference 11.
Further reading
- PHAC varicella webpage
- Canadian Immunization Guide varicella vaccine chapter
- National Advisory Committee on Immunization varicella vaccine guidance
- Vaccination Coverage Goals and Vaccine Preventable Disease Reduction Targets by 2025
Conclusion
The findings of this report underscore the pivotal role of publicly funded infant and childhood vaccination programs in reducing the burden of VPDs. For many VPDs, incidence rates in Canada have declined drastically since the pre-vaccine era. And although Canada is on track to meeting national VPD reduction targets for most VPD's presented in this report, surveillance data from 2013 to 2017 suggest that Canada is at risk of not meeting the reduction targets for some diseases, such as for mumps and IPD, by 2025. Enhancing vaccination coverage rates is therefore key to reducing the burden of VPDs in Canada, and worldwide.
Canada continues to maintain its elimination status for measles, rubella, CRS/CRI and polio. The Pan American Health Organization officially certified the Region of the Americas free of endemic measles in 2016 and free of rubella and congenital rubella syndrome in 2015. Certification of elimination of polio occurred in 1994. Despite the large number of measles cases due to imported cases, ongoing endemic transmission of the measles virus was not re-established in Canada. Between 2013 and 2017, low-level incidence rates of less than one case per 100,000 population were reported for diphtheria, tetanus, invasive disease due to Hib, and IMD. However, reported outbreaks of mumps occurred during that time, illustrating the importance of achieving the national vaccine coverage goals. Moderate annual incidence rates of greater than or equal tone case per 100,000 population were reported for pertussis, IPD, and varicella.
Given that an increase in cases of mumps and pertussis were observed every two to five years (of which increased case counts may be observed over several years), that trends in IMD serogroup distribution change overtime, that preventable cases of Hib among infants continue to be reported, and that imported cases of measles continue to occur with risks of secondary spread within Canada, ongoing vigilance is needed to maintain national vaccine coverage levels sufficient to ensure herd immunity.
Strong surveillance systems are important to provide data for ongoing monitoring and will continue to provide important information in support of ongoing national vaccination recommendations. Added health benefits could be achieved by increasing rates of vaccination with currently recommended vaccines. The greatest additional gains can come from understanding the characteristics of the under-immunized and unimmunized populations and improving vaccination coverage among these populations. History demonstrates that the importation of disease into under - or unimmunized populations can result in outbreaks. Rates of vaccination need to be enhanced through clear, understandable and continuing public communication about the risks and benefits of vaccination, especially when disease rates are low. Vaccines are one of the greatest achievements of biomedical science and public health. Continued commitment to vaccine programs is essential to advance their public health benefits.
Acknowledgements
We are grateful to local, provincial, and territorial public health staff for their continued support and tireless efforts in communicable disease surveillance and control as well as outbreak investigations. We also thank the healthcare providers and laboratorians who diligently reported case information to their local health authorities. Finally, we thank IMPACT researchers and nurse monitors and the Canadian Pediatric Society for their work in elucidating the burden of vaccine preventable diseases in the hospitalized pediatric populations.
Appendix A: Methods and limitations
Surveillance data sources
Canadian Notifiable Disease Surveillance System
National surveillance data for polio, diphtheria, tetanus, invasive disease due to Haemophilus influenzae serotype b (Hib), mumps, pertussis, invasive pneumococcal disease (IPD), varicella, and historical data for measles (1950-2011) and rubella (1950-2012) were obtained through the Canadian Notifiable Disease Surveillance System (CNDSS), a surveillance system coordinated by the Public Health Agency of Canada (PHAC). Data aggregated by year, sex, province or territory, and age group are voluntarily provided by provincial and territorial partners on an annual basis. Age groups include infants less than one year old, one to four-year-olds, five to nine-year-olds, ten to 14-year-olds, 15 to 19-year-olds, 20 to 24-year-olds, 25 to 29-year-olds, 30 to 39-year-olds, 40 to 59-year-olds, and adults 60 years of age and older. In addition, eight jurisdictions (British Columbia, Alberta, Saskatchewan, Ontario, Quebec, Prince Edward Island, the Yukon, and Nunavut), provide case-level data to CNDSS. These jurisdictions accounted for approximately 90% of the Canadian population between 2013 and 2017. Data in this report are current as of April 2018.
Canadian Measles and Rubella Surveillance System
National enhanced surveillance data for measles (2013-2017), rubella (2013-2017), and CRS/CRI were obtained through the Canadian Measles and Rubella Surveillance System (CMRSS). Provincial and territorial departments of health submit case-level, non-nominal epidemiologic data weekly to PHAC on all cases that meet the national case definitions, including zero reporting. The National Microbiology Laboratory (NML) provides genotype results for confirmed cases.
Enhanced Invasive Meningococcal Disease Surveillance System
National surveillance data for invasive meningococcal disease (IMD) were obtained through the enhanced Invasive Meningococcal Disease Surveillance System (eIMDSS). Provincial and territorial departments of health submit case-level, non-nominal epidemiologic and laboratory data annually to PHAC on all cases of IMD that meet the national case definitionReference 27. Provincial and territorial public health and/or hospital laboratories send all Neisseria meningitidis isolates to the NML for confirmation and organism characterization. Probabilistic matching on province/territory, date of birth or age, sex, onset date, and serogroup is conducted to link epidemiologic and laboratory data for cases with incomplete information.
Canada's Immunization Monitoring Program, ACTive
The Canadian Immunization Monitoring Program, Active (IMPACT) is a national surveillance initiative monitoring adverse events following immunization, vaccine failures and selected infectious diseases that are, or will be, vaccine preventable. IMPACT is managed by the Canadian Paediatric Society (CPS) and conducted by the IMPACT network of paediatric investigators at 12 tertiary-care paediatric hospitals across Canada, which represent 90% of all tertiary care paediatric beds in Canada. Funding is provided by PHAC to the CPS for IMPACT. The IMPACT Data Monitoring Centre submits case-level, non-nominal epidemiologic and laboratory data quarterly to PHAC on hospitalizations in children 16 years of age and younger due to pertussis, varicella, IPD and Hib.
Canadian Acute Flaccid Paralysis Surveillance System
National surveillance data for acute flaccid paralysis (AFP) in children less than 15 years of age is a WHO recommended strategy for detecting poliovirus circulation. National AFP surveillance data were obtained through the Canadian Acute Flaccid Paralysis Surveillance System (CAFPSS). Data are voluntarily provided by participating physicians and IMPACT nurse monitors who submit completed case report forms on an ongoing basis to the Canadian Paediatric Surveillance Program. The forms are then forwarded to PHAC for medical adjudication in order to rule out polio as the cause of AFP, and to ensure that cases meet the national AFP case definition.
Vaccination coverage data sources
2017 Childhood National Immunization Coverage Survey
In Canada, national immunization coverage for childhood vaccines is monitored by surveys conducted by Statistics Canada on behalf of the Public Health Agency of Canada every two years through the childhood National Immunization Coverage Survey (cNICS). The cNICS is intended to determine if children are immunized in accordance with recommended immunization schedules for publicly funded vaccines, to report vaccination coverage estimates to international organizations, and to develop appropriately targeted public education strategies. Note that these reported numbers are most likely underestimates as data were collected primarily from parent-held vaccination records, in which some doses may be missing or recorded with incomplete information such as missing or illegible dates. In addition, in jurisdictions where vaccinations are recorded by vaccine and where the measles-mumps-rubella-varicella (MMRV) vaccine is in use, some doses of this vaccine may be recorded as MMR, thus leading to an under-counting of varicella vaccination.
2016 Adult National Immunization Coverage Survey
Since 1991, the Public Health Agency of Canada has been monitoring national vaccination coverage for selected adult vaccines. The adult National Immunization Coverage Survey (aNICS) was first conducted in 2001, and has been routinely administered every two years since 2006. Results from aNICS are used to monitor coverage at the national level for vaccines recommended by the National Advisory Committee on Immunization (NACI), to report vaccination coverage estimates against national coverage goals, and to inform vaccination programs and public education strategies. Target populations include adults with or without chronic medical conditions and health care workers.
Population data sources
Population estimates
For all VPDs except CRS/CRI, denominator data for incidence rate calculations were obtained from Statistics Canada population estimates in October 1, 2018Reference 33.
Live births
For CRS/CRI, incidence rate by live births were obtained from CNDSS Notifiable disease chartsReference 34.
Analyses
Analyses performed for this report include frequency counts, crude and age-specific incidence rates, and age and sex distributions as appropriate. Numerator data are from CNDSS, CMRSS, eIMDSS, IMPACT, and CAFPSS. Denominators are from population data, and populations of those provinces and territories that did not submit case-level data were removed from the denominators of incidence rate calculations. Case-fatality rate for IMD represents the percentage of reported deaths due to IMD among the reported IMD cases. Case-level CNDSS data were used to calculate IPD incidence rates for children less than two years of age and for adults 65 years of age and older. Exclusion of non-vaccine preventable serotypes was not possible for IPD in this analysis.
Limitations
General limitations associated with data collected from passive surveillance systems should be considered in the interpretation of the results presented in this report, including differences in reporting practices across jurisdictions, reporting delays, missing or incomplete data, duplicate reports and under-reporting. As surveillance activities are ongoing, all data are subject to change. With the exception of VPDs under elimination in Canada, cases reported to the national level are not reviewed to ensure that they meet national case definitions. Because of the unreliability of results based on small numbers, caution should be used when interpreting results such as incidence rates and sex distribution based on less than 20 cases.
Due to the passive nature of many of the surveillance systems used to provide data for this report, reported cases are expected to be underestimates of the true burden of disease. Under-reporting is also likely among adolescents and adults (who may be less likely to be seen by a health care professional) and for milder or asymptomatic illness or those diseases where laboratory confirmation of disease is infrequent. However, under-reporting of diseases is less likely to be a concern for those diseases under elimination (i.e., polio, measles, rubella and CRS/CRI) due in part to the high profile of these diseases and strong laboratory and healthcare reporting to public health.
Data for most of the surveillance systems are not received from provinces and territories in real time, nor are most cases reported at the national level linked with laboratory and epidemiological data. Outbreak surveillance data are not available nationally for any of the VPDs (with the exception of measles, rubella, and IMD). Detailed case vaccination history, manifestations, and mortality information is not available for VPDs where data were obtained through CNDSS.
Case-level data available from CNDSS was not available for Prince Edward Island from 2001 to 2009, and for Northwest Territories, Nova Scotia, Newfoundland, New Brunswick, and Manitoba from 2001 to 2017. The populations of these jurisdictions were removed from the IPD incidence rate calculations where case-level data were used exclusively. Data from the remaining provinces and territories represents approximately 90% of the Canadian population.
As death data available through Statistics Canada has not been validated, this information was not presented in this report.
The limitations of the coverage data obtained from cNICS and aNICS have been documented elsewhereReference 17Reference 35.
References
- Reference 1
-
Public Health Agency of Canada. Brief Report: Hepatitis B Infection in Canada. 2011; Available at: http://www.phac-aspc.gc.ca/id-mi/pdf/hepB-eng.pdf. Accessed February 20, 2017.
- Reference 2
-
Ehreth J. The value of vaccination: a global perspective. Vaccine 2003;21:4105.
- Reference 3
-
Centers for Disease Control and Prevention (CDC). Appendix: Methods for the cost-benefit analyses presented in "Benefits from Immunization during the Vaccines for Children Program Era — United States, 1994–2013". Morbidity and Mortality Weekly Report 2014;63:352.
- Reference 4
-
Public Health Agency of Canada. Poliomyelitis (polio) surveillance. 2014; Available at: http://www.phac-aspc.gc.ca/im/vpd-mev/poliomyelitis/surveillance-eng.php.
- Reference 5
-
Public Health Agency of Canada. Elimination of Measles, Rubella and Congenital Rubella Syndrome in Canada, Documentation and Verification Report. 2011.
- Reference 6
-
Rotondo J, Desai S, Pless R, Ahmad R, Squires S, Booth TF. Acute flaccid paralysis surveillance: The need for ruling out polio infection. Paediatrics & child health 2015;6:309.
- Reference 7
-
Public Health Agency of Canada. Vaccination Coverage Goals and Vaccine Preventable Disease Reduction Targets by 2025. 2019; Available at: https://www.canada.ca/en/public-health/services/immunization-vaccine-priorities/national-immunization-strategy/vaccination-coverage-goals-vaccine-preventable-diseases-reduction-targets-2025.html. Accessed 07/16, 2019.
- Reference 8
-
Varughese PV, Acres SE. Measles in Canada: surveillance summary. Canada diseases weekly report 1979;5:121.
- Reference 9
-
Varughese PV, Acres SE. Measles in Canada - 1986. Canadian Medical Association journal 1987;136(11):1183.
- Reference 10
-
Public Health Agency of Canada. Canadian Immunization Guide, 7th Edition. Ottawa, ON: Government of Canada; 2006.
- Reference 11
-
Public Health Agency of Canada. Preliminary results from the 2017 childhood National Immunization Coverage Survey (cNICS). 2019; Available at: https://www.canada.ca/en/services/health/publications/vaccines-immunization/vaccine-uptake-canadian-children-preliminary-results-2017-childhood-national-immunization-coverage-survey.html. Accessed 06/14, 2019.
- Reference 12
-
Macey JF, Tam T, Lipskie T, Tipples G, EisBrenner T. Rubella Elimination, the Canadian Experience. The Journal of infectious diseases 2011;204(suppl_2):S585.
- Reference 13
-
Lim G, Harris T, Desai S, Crowcroft N, Mazzulli T, Kozlowski T, et al. Rubella immunity among prenatal women in Ontario, 2006-2010. BMC Infectious Diseases 2013 2 August 2013;13(362).
- Reference 14
-
Lai FY, Dover DC, Lee B, Fonseca K, Solomon N, Plitt SS, et al. Determining rubella immunity in pregnant Alberta women 2009-2012. Vaccine 2015;33(5):635-641.
- Reference 15
-
Gilbert N, Rotondo J, Shapiro J, Sherrard L, Fraser W, Ward B. Seroprevalence of rubella antibodies and determinants of susceptibility to rubella in a cohort of pregnant women in Canada, 2008-2011. Vaccine 2017 29 April 2017.
- Reference 16
-
Pan American Health Organization (PAHO). Region of the Americas eliminates maternal and neonatal tetanus. 2017; Available at: https://www.paho.org/hq/index.php?option=com_content&view=article&id=13696:americas-eliminates-maternal-neonatal-tetanus&Itemid=1926&lang=en. Accessed 07/16, 2019.
- Reference 17
-
Public Health Agency of Canada. Vaccine uptake in Canadian adults. Results from the 2016 adult National Immunization Coverage Survey (aNICS). 2018 July.
- Reference 18
-
Epidemiology of invasive Haemophilus influenzae (Hi), invasive pneumococccal disease (IPD), and invasive meningococcal disease (IMD) in northern Canada, 2001-2015. ; 2018; ; 2018.
- Reference 19
-
National Advisory Committee on Immunization (NACI). Update on the Invasive Meningococcal Disease and Meningococcal Vaccine Conjugate Recommendations. Canada Communicable Disease Report 2009;35(ACS-3).
- Reference 20
-
Katz SL, King K, Varughese P, De Serres G, Tipples G, Waters J, et al. Measles elimination in Canada. J Infect Dis 2004;189(Supplement_1):S236-S242.
- Reference 21
-
Barreto L, Van Exan R, Rutty C. The Challenge of Whooping Cough: Canada's Role in the Development of Pertussis Vaccines. 2006.
- Reference 22
-
Cutcliffe N. Building on the Legacy of Vaccines in Canada: Value, Opportunities, and Challenges. 2010.
- Reference 23
-
Public Health Agency of Canada. An Advisory Committee Statement (ACS) National Advisory Committee on Immunization (NACI). Update on Pertussis Vaccination in Pregnancy. 2015; Available at: https://www.canada.ca/en/public-health/services/publications/healthy-living/update-pertussis-vaccination-pregnancy.html#naci. Accessed 07/15, 2019.
- Reference 24
-
National Advisory Committee on Immunization (NACI). Statement on the Recommended Use of Pneumococcal Conjugate Vaccine. Canada Communicable Disease Report 2002;28(ACS-2).
- Reference 25
-
Kellner JD, Vanderkooi OG, MacDonald J, Church DL, Tyrrell GJ, Scheifele DW. Changing Epidemiology of Invasive Pneumococcal Disease in Canada, 1998-2007: Update from the Calgary-Area Streptococcus pneumoniae Research (CASPER) Study. Clinical Infectious Diseases 2009;49(2):205-212.
- Reference 26
-
Bettinger JA, Scheifele DW, Kellner JD, Halperin SA, Vaudry W, Law B, et al. The effect of routine vaccination on invasive pneumococcal infections in Canadian children, Immunization Monitoring Program, Active 2000–2007. Vaccine 2010 25 February 2010;28(9):2130-2136.
- Reference 27
-
Weinberger DM, Malley R, Lipsitch M. Serotype replacement in disease after pneumococcal vaccination. The Lancet 2011 3–9 December 2011;378(9807):1962-1973.
- Reference 28
-
Tyrrell GJ, Lovgren M, Chui N, Minion J, Garg S, Kellner JD, et al. Serotypes and antimicrobial susceptibilities of invasive Streptococcus pneumoniae pre- and post-seven valent pneumococcal conjugate vaccine introduction in Alberta, Canada, 2000–2006. Vaccine 2009 2 June 2009;27(27):3553-3560.
- Reference 29
-
Demczuk W, Griffith A, Singh R, Martin I, Gilmour M. National Laboratory Surveillance of Streptococcus pneumoniae and Streptococcus pyogenes In Canada Annual Summary 2010. 2010.
- Reference 30
-
Public Health Agency of Canada (PHAC). National Laboratory Surveillance of Invasive Streptococcal Disease in Canada - Annual Summary 2016. 2018.
- Reference 31
-
Squires SG, Pelletier L. Publicly-funded influenza and pneumococcal immunization programs in Canada: a progress report. Canada Communicable Disease Report 2000;26(17):141.
- Reference 32
-
Waye A, Jacobs P, Tan B. The impact of the universal infant varicella immunization strategy on Canadian varicella-related hospitalization rates. Vaccine 2013;31(42):4744.
- Reference 33
-
Statistics Canada. Population estimates 0-100+ October Canada - Province-Territory 1971-2018. 2018.
- Reference 34
-
Public Health Agency of Canada. Notifiable diseases online. 2018; Available at: https://diseases.canada.ca/notifiable/. Accessed 06/14, 2019.
- Reference 35
-
Public Health Agency of Canada. Childhood National Immunization Coverage Survey, 2017. 2019; Available at: https://www150.statcan.gc.ca/n1/daily-quotidien/190326/dq190326d-eng.htm. Accessed 06/07, 2019.
- Reference 36
-
Canadian Medical Association. Association Notes. Public Health: A new look in communicable disease reporting. Canadian Medical Association journal 1959;80:478.
Endnotes
- Footnote a
-
This includes measles, rubella, congenital rubella syndrome/congenital rubella infection, and polio.
- Footnote b
-
This includes diphtheria, tetanus, invasive disease due to Haemophilus influenzae serotype b, invasive meningococcal disease, and mumps.
- Footnote c
-
This includes pertussis, IPD, and varicella.
- Footnote d
-
Ages were unknown for twelve cases, therefore they were not included.
- Footnote e
-
Hospitalization data are provided through Immunization Monitoring Program ACTive (IMPACT), therefore hospitalizations include children 16 years of age and younger.
- Footnote f
-
Based on data from 2015 to 2017.
- Footnote g
-
The pre-vaccine era was defined as the five years before vaccine introduction, or the closest possible five years where stable reporting was occurring. For measles, this was 1950 to 1954. The measles live vaccine was authorized in Canada in 1963 and all provinces and territories had a measles vaccine program by 1983. Measles was taken off the notifiable diseases list from 1959 to 1968 with decreased physician reporting in the years leading up to 1959, thus 1954 was chosen as the last year with reliable data that could be used in comparisons.
- Footnote h
-
Measles was removed from the list of national notifiable diseases for the years 1959 to 1968 with decreased physician reporting in the years leading up to 1959.
- Footnote i
-
The difference in coverage estimates in seven-year-old children, between rubella, measles and mumps is due to the number of doses required to be considered vaccinated. One dose of rubella is required by seven years of age compared to two doses of measles and mumps.
- Footnote j
-
The pre-vaccine era was defined as the five years before vaccine introduction, or the closest possible five years where stable reporting was occurring. For rubella, this was 1950 to 1954. The rubella vaccine was authorized in Canada in 1969 and all provinces and territories had a rubella vaccine program by 1983. Rubella was taken off the notifiable disease list from 1959 to 1968 with decreased physician reporting in the years leading up to 1959, thus 1954 was chosen as the last year with reliable data that could be used in comparisons.
- Footnote k
-
Rubella was removed from the list of national notifiable diseases for the years 1959 to 1968 (36).
- Footnote l
-
The pre-vaccine era was defined as the five years before vaccine introduction, or the closest possible five years where stable reporting was occurring. For rubella, this was 1950 to 1954. The rubella vaccine was authorized in Canada in 1969 and all provinces and territories had a rubella vaccine program by 1983. Rubella was taken off the notifiable disease list from 1959 to 1968 with decreased physician reporting in the years leading up to 1959, thus 1954 was chosen as the last year with reliable data that could be used in comparisons.
- Footnote m
-
The pre-vaccine era was defined as the five years before vaccine introduction, or the closest possible five years where stable reporting was occurring. For polio, this was 1950 to 1954, as the inactivated polio vaccine was authorized in Canada in 1955.
- Footnote n
-
AFP has been nationally notifiable in Canada since 1996.
- Footnote o
-
The pre-vaccine era was defined as the five years before vaccine introduction, or the closest possible five years where stable reporting was occurring. For diphtheria, this was 1925 to 1929. Although the diphtheria toxoid was introduced in 1926, routine immunization began in 1930.
- Footnote p
-
The pre-vaccine era was defined as the five years before vaccine introduction, or the closest possible five years where stable reporting was occurring. For tetanus, this was 1935 to 1939. Tetanus toxoid was introduced in Canada in 1940 but national reporting began in 1957. Thus reported tetanus deaths were used instead of cases for the years preceding vaccine introduction.
- Footnote q
-
Tetanus was added to the list of nationally notifiable diseases in 1957. Reported tetanus deaths were used instead of cases for the years 1935 to 1956.
- Footnote r
-
The pre-vaccine era used for invasive disease due to Hib was 1986 to 1987. Although Hib vaccines were first introduced in 1986 and the Hib conjugate vaccine was introduced in 1992, national notifiable disease reporting of invasive Hib disease only began in 1986.
- Footnote s
-
Northern Canada includes Yukon, Northwest Territories, Nunavut, Quebec Cree, Quebec Nunavik and northern Labrador. Rates for the rest of Canada exclude cases reported in those six regions.
- Footnote t
-
A Hib case is considered preventable if it occurs in an infant who was age-eligible to have completed the primary Hib vaccination schedule (3 doses) but who was unvaccinated or under-vaccinated for age. Vaccine failures are not considered preventable.
- Footnote u
-
The pre-vaccine era was defined as the five years before vaccine introduction, or the closest possible five years where stable reporting was occurring. For IMD, this was 1997 to 2001, as the meningococcal C conjungate vaccine was introduced in all provinces and territories between 2002 and 2007.
- Footnote v
-
Northern Canada includes Yukon, Northwest Territories, Nunavut, Quebec Cree, Quebec Nunavik and northern Labrador. Rates for the rest of Canada exclude cases reported in those six regions.
- Footnote w
-
Other includes serogroup A, 29E, X, Z, non-groupable and unknown serogroup.
- Footnote x
-
Age was unknown for one case, therefore it was not included.
- Footnote y
-
The pre-vaccine era was defined as the five years before vaccine introduction, or the closest possible five years where stable reporting was occurring. For mumps, this was 1950 to 1954. The mumps vaccine was authorized in Canada in 1969 and all provinces and territories had a mumps vaccine program by 1983. Mumps was taken off the notifiable disease list from 1959 to 1985 with decreased physician reporting in the years leading up to 1959, thus 1954 was chosen as the last year with reliable data that could be used in comparisons.
- Footnote z
-
Mumps was removed from the list of national notifiable diseases for the years 1959 to 1985.
- Footnote aa
-
The pre-vaccine era was defined as the five years before vaccine introduction, or the closest possible five years where stable reporting was occurring. For pertussis, this was 1938 to 1942, as the whole cell pertussis vaccine was authorized in Canada in 1943.
- Footnote ab
-
Ages were unknown for nine cases, therefore they were not included.
- Footnote ac
-
Northern Canada includes Yukon, Northwest Territories, Nunavut, Quebec Cree, Quebec Nunavik and northern Labrador. Rates for the rest of Canada exclude cases reported in those six regions.
- Footnote ad
-
Excluded 2000 because ON started reporting in 2001.
- Footnote ae
-
Data was not available for Prince Edward Island from 2001 to 2009, and for Northwest Territories, Nova Scotia, Newfoundland, New-Brunswick, and Manitoba from 2001 to 2017. Therefore, the population for these provinces and territories were excluded in the calculation on incidences rates for children less than two years of age and older adults 65 years and over, depending on the corresponding year.
- Footnote af
-
Indicated by four doses for the Northwest Territories and Nunavut; three doses in other provinces/territories.
- Footnote ag
-
The pre-vaccine era was defined as the five years before vaccine introduction, or the closest possible five years where stable reporting was occurring. For varicella, this was 1993 to 1997, as the first varicella vaccine was approved for use in Canada in 1998.
- Footnote ah
-
Data was not available for British Columbia (1993 to 2017), Saskatchewan (1996 to 1997, 2001 to 2015), Manitoba (1991 to 2017), Ontario (1991 to 1992, 2009 to 2010), Quebec (1991 to 2017), Newfoundland and Labrador (2015 to 2017), Nova Scotia (1998 to 2017) and Yukon (2009 to 2012). Reporting of cases in Nunavut began in 2000. Under-reporting of varicella was noted by Ontario for their jurisdiction.
- Footnote ai
-
Ages were unknown for two cases, therefore they were not included.
- Footnote aj
-
Vaccine eligible children include children aged one to 17 who are not immunocompromised, and are either not vaccinated or have an unknown vaccination status for varicella.
Page details
- Date modified: