
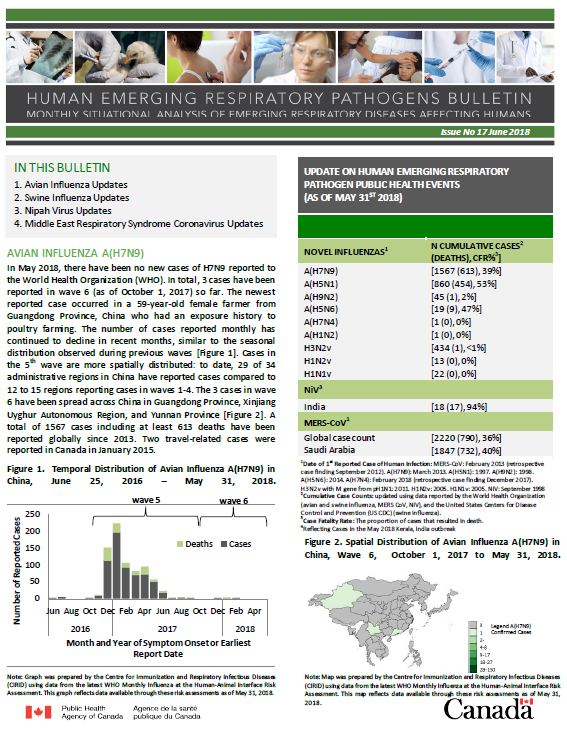
Human Emerging Respiratory Pathogens Bulletin: Issue 017 June 2018
Monthly situational analysis of emerging respiratory diseases affecting humans
Update on Human Emerging Respiratory Pathogen Public Health Events (as of May 31, 2018)
Novel influenzaFootnote 1 |
Cumulative Case CountFootnote 2 |
Deaths |
Case Fatality Rate %Footnote 3 |
A(H7N9) |
1,567 |
613 |
39% |
A(H5N1) |
860 |
454 |
53% |
A(H9N2) |
45 |
1 |
2% |
A(H5N6) |
19 |
9 |
47% |
A(H7N4) |
1 |
0 |
0% |
A(H1N2) |
1 |
0 |
0% |
H3N2v |
434 |
1 |
<1% |
H1N2v |
13 |
0 |
0% |
H1N1v |
22 |
0 |
0% |
NiVFootnote 3 |
Cumulative Case CountFootnote 2 |
Deaths |
Case Fatality Rate %Footnote 3 |
India |
18 |
17 |
94% |
MERS-CoVFootnote 1 |
Cumulative Case CountFootnote 2 |
Deaths |
Case Fatality Rate %Footnote 3 |
Global Case Count |
2,220 |
790 |
36% |
Saudi Arabia |
1,847 |
732 |
40% |
- Footnote 1
Date of 1st Reported Case of Human Infection: MERS-CoV: February 2013 (retrospective case finding September 2012). A(H7N9): March 2013. A(H5N1): 1997. A(H9N2): 1998. A(H5N6): 2014. A(H7N4): February 2018 (retrospective case finding December 2017). H3N2v with M gene from pH1N1: 2011. H1N2v: 2005. H1N1v: 2005. NiV: September 1998.
- Footnote 2
Cumulative Case Counts: updated using data reported by the World Health Organization (avian and swine influenza, MERS CoV, NiV), and the United States Centers for Disease Control and Prevention (US CDC) (swine influenza).
- Footnote 3
Case Fatality Rate: The proportion of cases that resulted in death.
- Footnote 4
Reflecting Cases in the May 2018 Kerala, India outbreak.
Download the alternative format
(PDF format, 700 KB, 2 pages)
Organization: Public Health Agency of Canada
Published: 2018-08-25
In This Bulletin
- Avian Influenza A(H7N9)
- Avian Influenza A(H7N4)
- Avian Influenza A(H9N2)
- Avian Influenza A(H5N1)
- Avian Influenza A(H5N6)
- Swine Origin Influenza A(H3N2)v
- Swine Origin Influenza A(H1N2)v
- Swine Origin Influenza A(H1N1)v
- Nipah Virus (NiV)
- Middle East Respiratory Syndrome - Coronavirus (MERS-CoV)
Avian Influenza A(H7N9)
In May 2018, there have been no new cases of H7N9 reported to the World Health Organization (WHO). In total, 3 cases have been reported in wave 6 (as of October 1, 2017) so far. The newest reported case occurred in a 59-year-old female farmer from Guangdong Province, China who had an exposure history to poultry farming. The number of cases reported monthly has continued to decline in recent months, similar to the seasonal distribution observed during previous waves [Figure 1]. Cases in the 5th wave are more spatially distributed: to date, 29 of 34 administrative regions in China have reported cases compared to 12 to 15 regions reporting cases in waves 1-4. The 3 cases in wave 6 have been spread across China in Guangdong Province, Xinjiang Uyghur Autonomous Region, and Yunnan Province [Figure 2]. A total of 1567 cases including at least 613 deaths have been reported globally since 2013. Two travel-related cases were reported in Canada in January 2015.

Note: Graph was prepared by the Centre for Immunization and Respiratory Infectious Diseases (CIRID) using data from the latest WHO Monthly Influenza at the Human-Animal Interface Risk Assessment. This graph reflects data available through these risk assessments as of May 31, 2018.
Figure 1 - Text description
|
|
|
|
2016 |
Jun |
2 |
0 |
Jul |
4 |
0 |
|
Aug |
0 |
0 |
|
Sep |
0 |
0 |
|
Oct |
2 |
0 |
|
Nov |
10 |
2 |
|
Dec |
114 |
39 |
|
2017
|
Jan |
197 |
29 |
Feb |
93 |
13 |
|
Mar |
70 |
12 |
|
Apr |
72 |
24 |
|
May |
50 |
6 |
|
| Jun | 19 | 4 | |
| Jul | 2 | 0 | |
| Aug | 3 | 2 | |
| Sep | 1 | 0 | |
| Oct | 0 | 0 | |
| Nov | 0 | 0 | |
| Dec | 1 | 0 | |
| 2018 | Jan | 1 | 1 |
| Feb | 1 | 0 | |
| Mar | 0 | 0 | |
| Apr | 0 | 0 | |
| May | 0 | 0 | |
Figure 2. Spatial Distribution of Avian Influenza A(H7N9) in China, Wave 6, October 1, 2017 to May 31, 2018.
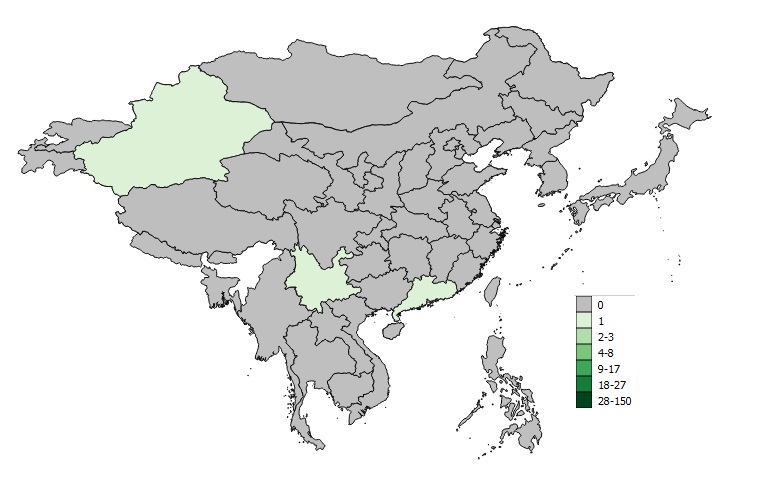
Note: Map was prepared by the Centre for Immunization and Respiratory Infectious Diseases (CIRID) using data from the latest WHO Monthly Influenza at the Human-Animal Interface Risk Assessment. This map reflects data available through these risk assessments as of May 31, 2018.
Figure 2 - Text description
The spatial distribution of reported avian influenza A(H7N9) cases in wave 6 from October 1, 2018 to May 31, 2018 has been displayed in Figure 2. Throughout October 1, 2018 to May 31, 2018, a total of 3 cases have been reported. The 3 cases in wave 6 were spread across China in Guangdong Province, Xinjiang Uyghur Autonomous Region, and Yunnan Province.
Avian Influenza A(H7N4)
On February 14, 2018, the WHO was notified of the first known human case of Avian Influenza A(H7N4). The authorities in China have not yet released the genetic sequence through the Global Initiative on Sharing All Influenza Data (GISAID). No new cases have been reported since.
Avian Influenza A(H9N2)
In May 2018, no new cases of H9N2 were reported to the WHO. A total of 45 cases, including 1 death, have been reported globally since 1998. No cases have been reported from Canada.
Avian Influenza A(H5N1)
In May 2018, no new cases of H5N1 were reported to the WHO. A total of 860 cases including 454 deaths have been reported globally since 1997. One fatal travel-related case of A(H5N1) was reported in Canada in January 2014.
Avian Influenza A(H5N6)
In May 2018, no new cases of H5N6 were reported to the WHO. There have been a total of 19 cases, including 9 deaths, reported globally since 2014, with all cases occurring in China.
Swine Origin Influenza A(H3N2)v
In May 2018, there have been no new cases of H3N2v.The latest H3N2v infection reported to the CDC was a case from Iowa whose onset of symptoms began in November 2017 following exposure to swine one week prior to symptoms. One locally-acquired case of H3N2v was reported in Canada in December 2016.
Swine Origin Influenza A(H1N2)v
In May 2018, there have been no new cases of H1N2v. Since 2005, there have been a total of 13 confirmed cases of H1N2v in the United States, with four cases occurring in 2017. Most of the reported cases resulted in mild illness.
Swine Origin Influenza A(H1N1)v
In May 2018, no new cases of H1N1v were reported to the WHO. There have been a total of 22 cases reported since 2005 and only one case reported in 2018.
Nipah Virus (NiV)
In May 2018, an outbreak of Nipah Virus (NiV) occurred in the southern state of Kerala, India. A total of 18 cases and 17 deaths were attributed to the NiV outbreak. The index case was apparently a 62 year old man from Kozhikode, Kerala, who died of NiV infection. The possible route of transmission for the outbreak included consumption of fruits partially eaten by bats and person-to-person transmission.
Middle East Respiratory Syndrome - Coronavirus (MERS-CoV)
From May 1st 2018 to May 31st 2018, 12 new cases of MERS-CoV, including 1 death, were reported by the Saudi Arabian Ministry of Health [Figure 3], with cases originating from Saudi Arabia (11) and the United Arab Emirates (1) [Figure 4]. These cases include a household cluster of 8 laboratory-confirmed MERS-CoV cases in Saudi Arabia, reported in the Najran region. Currently, sociodemographic data for most of the new cases is not available and will be added as in update in an upcoming HERP Bulletin issue. The WHO states that a total of 2220 laboratory-confirmed cases of MERS-CoV cases, including 790 deaths, have been reported globally since 2012. No cases have been reported in Canada.
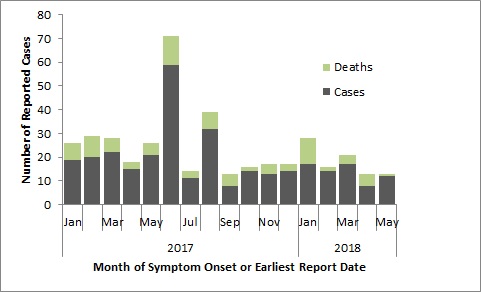
Note: Graph was prepared by the Centre for Immunization and Respiratory Infectious Diseases (CIRID) using data from the WHO Disease Outbreak News and Saudi Arabia’s Ministry of Health. This graph reflects data available as of May 31, 2018.
Figure 3 - Text description
|
|
|
|
2017
|
Jan |
19 |
7 |
Feb |
20 |
9 |
|
Mar |
22 |
6 |
|
Apr |
15 |
3 |
|
May |
21 |
5 |
|
| Jun | 59 | 12 | |
| Jul | 11 | 3 | |
| Aug | 32 | 7 | |
| Sep | 8 | 5 | |
| Oct | 14 | 2 | |
| Nov | 13 | 4 | |
| Dec | 14 | 3 | |
| 2018 | Jan | 17 | 11 |
| Feb | 14 | 2 | |
| Mar | 17 | 4 | |
| Apr | 8 | 5 | |
| May | 12 | 1 | |
Figure 4. Spatial Distribution of MERS-CoV, January 1, 2018 to May 31, 2018.
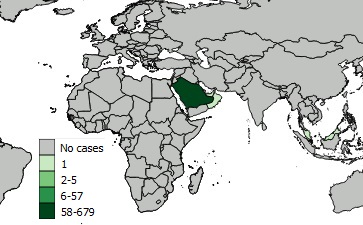
Note: Map was prepared by the Centre for Immunization and Respiratory Infectious Diseases (CIRID) using data from the latest WHO Monthly Influenza at the Human-Animal Interface Risk Assessment. This map reflects data available through these risk assessments as of May 31, 2018.
Figure 4 - Text description
The spatial distribution of reported MERS cases from January 1, 2018 to May 31, 2018 has been displayed in Figure 4. Throughout January 1, 2018 to May 31, 2018, the greatest number of cases have always been reported from Saudi Arabia. In 2018, up until May 31, Saudi Arabia has reported 58-679 cases so far.
Page details
- Date modified: