
Human Emerging Respiratory Pathogens Bulletin – Issue 20 September 2018
Monthly situational analysis of emerging respiratory diseases affecting humans
| Novel influenza1 | Cumulative Case Count 2 | Deaths | Case Fatality Rate %3 |
|---|---|---|---|
| A(H7N9) | 1,567 | 613 | 39% |
| A(H5N1) | 860 | 454 | 53% |
| A(H9N2) | 45 | 1 | 2% |
| A(H5N6) | 20 | 9 | 47% |
| A(H7N4) | 1 | 0 | 0% |
| A(H1N2) | 1 | 0 | 0% |
| H3N2v | 435 | 1 | <1% |
| H1N2v | 26 | 0 | 0% |
| H1N1v | 22 | 0 | 0% |
| MERS-CoV1 | Cumulative Case Count 2 | Deaths | Case Fatality Rate %3 |
| Global Case Count | 2,243 | 796 | 35% |
| Saudi Arabia | 1,869 | 738 | 39% |
-
Date of 1st Reported Case of Human Infection: MERS-CoV: February 2013 (retrospective case finding September 2012). A(H7N9): March 2013. A(H5N1): 1997. A(H9N2): 1998. A(H5N6): 2014. A(H7N4): February 2018 (retrospective case finding December 2017). H3N2v with M gene from pH1N1: 2011. H1N2v: 2005. H1N1v: 2005. NiV: September 1998
-
Cumulative Case Counts: updated using data reported by the World Health Organization (avian and swine influenza, MERS CoV, NiV), and the United States Centers for Disease Control and Prevention (US CDC) (swine influenza).
-
Case Fatality Rate: The proportion of cases that resulted in death.

Download the alternative format
(PDF format, 717 KB, 2 pages)
Organization: Public Health Agency of Canada
Published: 2018-12-28
In this bulletin
- Avian Influenza Updates
- Swine Influenza Updates
- Middle East Respiratory Syndrome Coronavirus Updates
Avian Influenza A(H7N9)
In August 2018, there have been no new cases of H7N9 reported to the World Health Organization (WHO). In total, 3 cases have been reported in wave 6 (as of October 1, 2017). The newest reported case occurred in a 59-year-old female farmer from Guangdong Province, China who had an exposure history to poultry farming. The number of cases reported monthly has continued to decline in recent months, similar to the seasonal distribution observed during previous waves [Figure 1]. Cases since the 5th wave are more spatially distributed: to date, 29 of 34 administrative regions in China have reported cases in wave 5 compared to 12 to 15 regions reporting cases in waves 1-4. The 3 cases in wave 6 have been spread across China in Guangdong Province, Xinjiang Uyghur Autonomous Region, and Yunnan Province [Figure 2]. A total of 1567 cases including at least 613 deaths have been reported globally since 2013. Two travel-related cases were reported in Canada in January 2015.
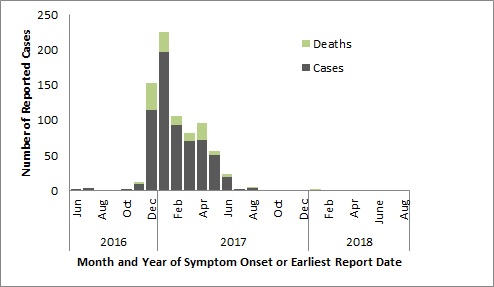
Figure 1 - Text description
| Cases | Deaths | ||
|---|---|---|---|
| 2016 | Jun | 2 | 0 |
| Jul | 4 | 0 | |
| Aug | 0 | 0 | |
| Sep | 0 | 0 | |
| Oct | 2 | 0 | |
| Nov | 10 | 2 | |
| Dec | 114 | 39 | |
| 2017 | Jan | 197 | 29 |
| Feb | 93 | 13 | |
| Mar | 70 | 12 | |
| Apr | 72 | 24 | |
| May | 50 | 6 | |
| Jun | 19 | 4 | |
| Jul | 2 | 0 | |
| Aug | 3 | 2 | |
| Sep | 1 | 0 | |
| Oct | 0 | 0 | |
| Nov | 0 | 0 | |
| Dec | 1 | 0 | |
| 2018 | Jan | 1 | 1 |
| Feb | 1 | 0 | |
| Mar | 0 | 0 | |
| Apr | 0 | 0 | |
| May | 0 | 0 | |
| June | 0 | 0 | |
| July | 0 | 0 | |
| Aug | 0 | 0 |
A figure indicating the temporal distribution of avian influenza A(H7N9) in China, June 25, 2016 - August 31, 2018. The fifth wave started on October 1, 2016 and ended in September 2017. Eight cases were reported between October 1 and November 30 2016. The sixth wave began on October 1, 2017 and is ongoing.
Note: Graph was prepared by the Centre for Immunization and Respiratory Infectious Diseases (CIRID) using data from the latest WHO Monthly Influenza at the Human-Animal Interface Risk Assessment. This graph reflects data available through these risk assessments as of August 31, 2018.
Figure 2. Spatial Distribution of Avian Influenza A(H7N9) in China, Wave 6, October 1, 2017 to August 31, 2018.
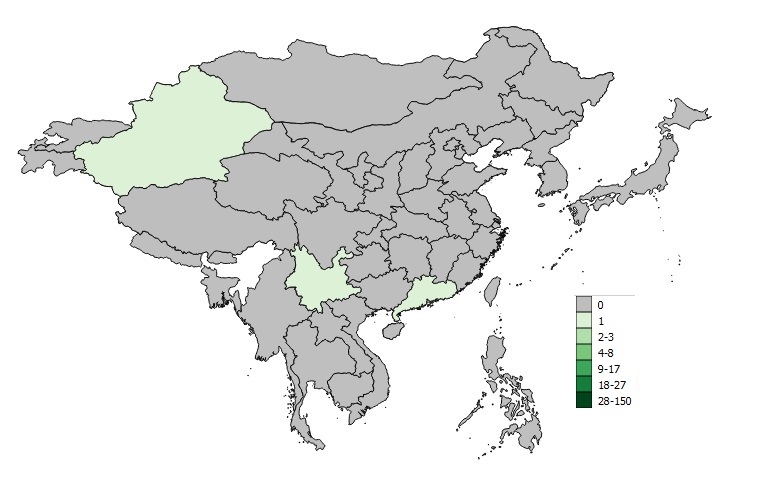
Figure 2 - Text Equivalent
The spatial distribution of reported avian influenza A(H7N9) cases in wave 6 from October 1, 2018 to August 31, 2018 has been displayed in Figure 2. Throughout October 1, 2018 to August 31, 2018, a total of 3 cases have been reported. The 3 cases in wave 6 were spread across China in Guangdong Province, Xinjiang Uyghur Autonomous Region, and Yunnan Province.
Note: Map was prepared by the Centre for Immunization and Respiratory Infectious Diseases (CIRID) using data from the latest WHO Monthly Influenza at the Human-Animal Interface Risk Assessment. This map reflects data available through these risk assessments as of August 31, 2018.
Avian Influenza A(H7N4)
On February 14, 2018, the WHO was notified of the first known human case of Avian Influenza A(H7N4). No new cases have been reported since.
Avian Influenza A(H9N2)
In August 2018, no new cases of H9N2 were reported to the WHO. A total of 45 cases, including 1 death, have been reported globally since 1998. No cases have been reported from Canada.
Avian Influenza A(H5N1)
In August 2018, no new cases of H5N1 were reported to the WHO. A total of 860 cases including 454 deaths have been reported globally since 1997. One fatal travel-related case of A(H5N1) was reported in Canada in January 2014.
Avian Influenza A(H5N6)
In August 2018, one new case of H5N6 was reported to the WHO. There have been a total of 20 cases, including 9 deaths, reported globally since 2014, with all cases occurring in China.
Swine Origin Influenza A(H3N2)v
One new case of H3N2v occurred in June 2018, but no new cases have been reported since. The Indiana State Department of Health reported the first case of H3N2v this year in the United States in a county fairgoer who had been in close proximity to swine. The case is a child (<12 years old) who developed symptoms on June 18 and has since fully recovered. One locally-acquired case of H3N2v was reported in Canada in December 2016.
Swine Origin Influenza A(H1N2)v
In August 2018, there have been thirteen new cases of H1N2v, all reported from the United States [California (6), Michigan (3), Ohio (4)]. Since 2005, there have been a total of 26 confirmed cases of H1N2v in the United States, with four cases occurring in 2017. Most of the reported cases resulted in mild illness.
Swine Origin Influenza A(H1N1)v
In August 2018, no new cases of H1N1v were reported to the WHO. There have been a total of 22 cases reported since 2005 and only one case reported in 2018.
Middle East Respiratory Syndrome - Coronavirus (MERS-CoV)
From August 1st 2018 to August 31st 2018, 6 new cases of MERS-CoV, including 2 deaths, were reported by the Saudi Arabian Ministry of Health and the WHO [Figure 3], with all cases originating from Saudi Arabia [Figure 4]. These cases include a travel-associated case of a Saudi Arabian national who travelled to the United Kingdom and was diagnosed and is undergoing treatment there. Of the cases reported in August 2018, 4/6 (66.7%) were male and the median age was 67.5 years old (age range of 41-84 years old). A total of 2243 laboratory-confirmed cases of MERS-CoV cases, including 796 deaths, have been reported globally since 2012. No cases have been reported in Canada.
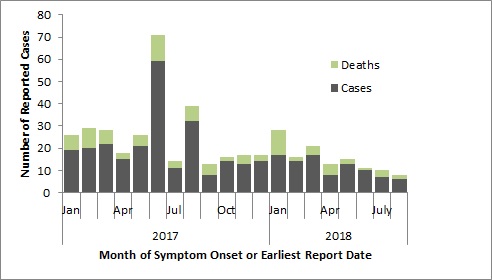
Figure 3 - Text description
| Cases | Deaths | ||
|---|---|---|---|
| 2017 | Jan | 19 | 7 |
| Feb | 20 | 9 | |
| Mar | 22 | 6 | |
| Apr | 15 | 3 | |
| May | 21 | 5 | |
| Jun | 59 | 12 | |
| Jul | 11 | 3 | |
| Aug | 32 | 7 | |
| Sep | 8 | 5 | |
| Oct | 14 | 2 | |
| Nov | 13 | 4 | |
| Dec | 14 | 3 | |
| 2018 | Jan | 17 | 11 |
| Feb | 14 | 2 | |
| Mar | 17 | 4 | |
| Apr | 8 | 5 | |
| May | 13 | 2 | |
| June | 10 | 1 | |
| July | 7 | 3 | |
| August | 6 | 2 |
Note: Graph was prepared by the Centre for Immunization and Respiratory Infectious Diseases (CIRID) using data from the WHO Disease Outbreak News and Saudi Arabia's Ministry of Health. This graph reflects data available as of August 31, 2018.
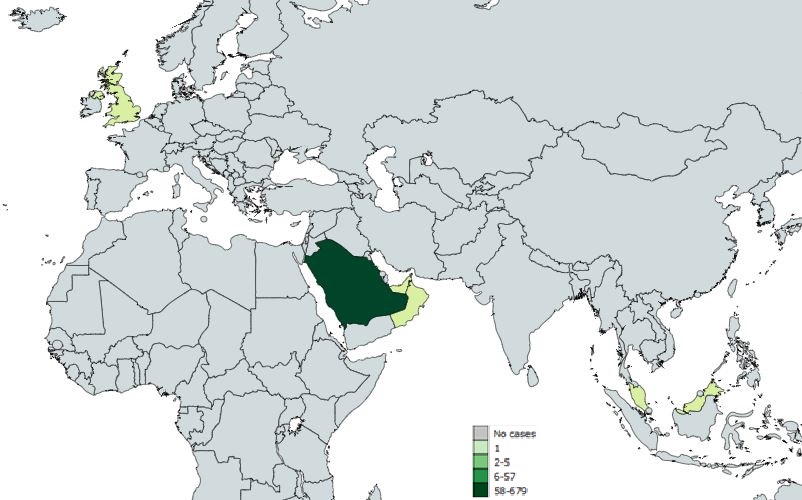
Figure 4 - Text description
The spatial distribution of reported MERS cases from January 1, 2018 to August 31, 2018 has been displayed in Figure 4. Throughout January 1, 2018 to August 31, 2018, the greatest number of cases have always been reported from Saudi Arabia. In 2018, up until August 31, Saudi Arabia has reported 58-679 cases so far.
Note: Map was prepared by the Centre for Immunization and Respiratory Infectious Diseases (CIRID) using data from the latest WHO Monthly Influenza at the Human-Animal Interface Risk Assessment. This map reflects data available through these risk assessments as of August 31, 2018.
Page details
- Date modified: