
Human Emerging Respiratory Pathogens Bulletin - Issue 26, February 2019
Download the alternative format
(PDF format, 645 KB)
Organization: Public Health Agency of Canada
Published: 2019-03-12
Monthly situational analysis of emerging respiratory diseases affecting humans (data to February 28, 2019)
In this bulletin
- Avian Influenza Updates
- Swine Influenza Updates
- Middle East Respiratory Syndrome Coronavirus Updates (MERS-CoV)
| Novel influenzaFootnote 1 | Cumulative Case CountFootnote 2 | Deaths | Case Fatality Rate %Footnote 3 |
|---|---|---|---|
| A(H7N9) | 1,567 | 615 | 39% |
| A(H5N1) | 860 | 454 | 53% |
| A(H9N2) | 50 | 1 | 2% |
| A(H5N6) | 23 | 15 | 65% |
| A(H7N4) | 1 | 0 | 0% |
| H3N2v | 435 | 1 | <1% |
| H1N2v | 26 | 0 | 0% |
| H1N1v | 22 | 0 | 0% |
| A(H1N2)Footnote 4 | 2 | 0 | 0% |
| MERS-CoVFootnote 1 | Cumulative Case CountFootnote 2 | Deaths | Case Fatality Rate %Footnote 3 |
| Global Case Count | 2,374 | 825 | 35% |
| Saudi Arabia | 1,983 | 748 | 38% |
|
|||
Avian Influenza Updates
Avian influenza A(H7N9)
The most recent H7N9 case occurred in a 59-year-old woman in February 2018 in China. After emergence in 2013, and until 2017, case increases occurred annually, peaking in December/January of each year. However, H7N9 activity has remained low since the end of the fifth wave (September 2017). Only three cases were reported during wave 6 (October 2017 to September 2018), with no cases reported since [Figure 1]. This decrease in cases may be attributable to China's introduction of a bivalent vaccine against influenza H5 and H7 in poultry, which was deployed after the large number of human cases observed during wave 5. Globally, since 2013, a total of 1567 cases including at least 615 deaths have been reported. Two travel-related cases were reported in Canada in January 2015.
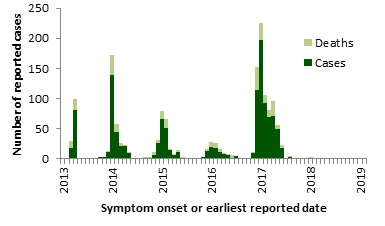
Figure 1 - Text description
| Cases | Deaths | ||
|---|---|---|---|
| 2016 | Jun | 2 | 0 |
| Jul | 4 | 0 | |
| Aug | 0 | 0 | |
| Sep | 0 | 0 | |
| Oct | 2 | 0 | |
| Nov | 10 | 2 | |
| Dec | 114 | 39 | |
| 2017 | Jan | 197 | 29 |
| Feb | 93 | 13 | |
| Mar | 70 | 12 | |
| Apr | 72 | 24 | |
| May | 50 | 6 | |
| Jun | 19 | 4 | |
| Jul | 2 | 0 | |
| Aug | 3 | 2 | |
| Sep | 1 | 0 | |
| Oct | 0 | 0 | |
| Nov | 0 | 0 | |
| Dec | 1 | 0 | |
| 2018 | Jan | 1 | 1 |
| Feb | 1 | 0 | |
| Mar | 0 | 0 | |
| Apr | 0 | 0 | |
| May | 0 | 0 | |
| June | 0 | 0 | |
| July | 0 | 0 | |
| Aug | 0 | 0 | |
| Sep | 0 | 0 | |
| Oct | 0 | 0 | |
| Nov | 0 | 0 | |
| Dec | 0 | 0 | |
| 2019 | Jan | 0 | 0 |
| Feb | 0 | 0 |
The temporal distribution of avian influenza A(H7N9), globally, January 1st, 2013 - February 28, 2019, has been displayed in Figure 1. The highest number of reports occured in 2017, with a peak in January. Three cases were reported in 2018 with the last one in February 2018. No cases have been reported in 2019 so far.
Note: Graph was prepared by the Centre for Immunization and Respiratory Infectious Diseases (CIRID) using data from the latest WHO Monthly Influenza at the Human-Animal Interface Risk Assessment. This graph reflects data available through these risk assessments as of February 28, 2019.
Avian influenza A(H5N1)
The most recent case of H5N1 was reported in September 2017 in Indonesia. A total of 860 cases including 454 deaths have been reported globally since 1997. One fatal travel-related case of H5N1 was reported in Canada in January 2014.
Avian influenza A(H5N6)
The most recent case of H5N6 was reported in November 2018 in China. There have been a total of 23 cases, including 15 deaths, reported globally since 2014, all in China.
Avian influenza A(H7N4)
On February 14, 2018, the WHO was notified of the first known human case of H7N4. No cases have been reported since.Avian influenza A(H9N2)
In February 2019, China reported two new cases of H9N2. The first case was a 2-year-old boy from Changde, Hunan Province, who had symptom onset on November 27, 2018 and the second case was an 8-year-old girl from Lushui, Yunnan Province, whose symptoms began on January 27, 2019 [Figure 2]. Both had mild illness and reported no history of exposure to live poultry. A total of 50 cases, including one death, have been reported worldwide since 1998.
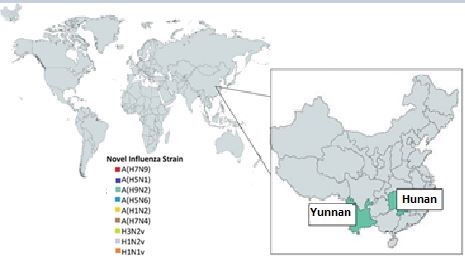
Figure 2 - Text description
The spatial distribution of avian and swine influenza human cases in February 2019 has been displayed in Figure 2. In February 2019, two H9N2 cases have been reported in China, one in Yunnan Province and the other in Hunan Province.
Note: Map was prepared by the Centre for Immunization and Respiratory Infectious Diseases (CIRID) using data from the latest WHO Monthly Influenza at the Human-Animal Interface Risk Assessment. This map reflects data available through these risk assessments as of February 28, 2019.
Swine Influenza Updates
Swine origin influenza A(H3N2)v
The most recent case of swine origin influenza H3N2v was reported in June 2018 in the United States. A total of 435 cases, including 1 death, have been reported globally since 2011. One locally-acquired case of H3N2v was reported in Canada in December 2016.
Swine origin influenza A(H1N2)v
The most recent case of swine origin influenza H1N2v was reported in August 2018 in the United States. A total of 26 confirmed cases of H1N2v have been reported in the United States since 2005. Most of the reported cases resulted in mild illness.
Swine origin influenza A(H1N1)v
The most recent case of swine origin influenza H1N1v was reported in January 2018 in Switzerland. A total of 22 cases have been reported globally since 2005. H1N1v infection is associated with mild illness.
Middle East Respiratory Syndrome Coronavirus Updates
Middle east respiratory syndrome coronavirus (MERS-CoV)
In February 2019, 76 new cases of MERS-CoV were reported in Saudi Arabia and Oman [Figure 3], with 89% (68/76) of cases originating from Saudi Arabia [Figure 4]. This case increase has occurred earlier than previous years: MERS cases typically peak in the spring, coinciding temporally with the camel calving season. Approximately 79% (60/76) of these cases were male and the median age was 45 years (range: 16-96 years). At least 36 (53%) of the Saudi Arabian cases reported in February are associated with an ongoing outbreak in a hospital in Wadi Aldawasir city, which was first reported to the WHO on February 6. The Saudi Arabian Ministry of Health is conducting case and contact management (n=350 contacts), enhanced infection prevention and control strategies in healthcare facilities, and initiated an awareness campaign in Wadi Aldawasir. The Ministry of Agriculture is testing camels in the outbreak-affected city. A total of 2374 laboratory-confirmed cases of MERS-CoV, including 825 deaths, have been reported globally since 2012 by the WHO and the Kingdom of Saudi Arabia. No cases have been reported in Canada.
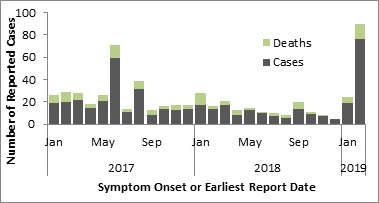
Figure 3 - Text description
| Cases | Deaths | ||
|---|---|---|---|
| 2017 | Jan | 19 | 7 |
| Feb | 20 | 9 | |
| Mar | 22 | 6 | |
| Apr | 15 | 3 | |
| May | 21 | 5 | |
| Jun | 59 | 12 | |
| Jul | 11 | 3 | |
| Aug | 32 | 7 | |
| Sep | 8 | 5 | |
| Oct | 14 | 2 | |
| Nov | 13 | 4 | |
| Dec | 14 | 3 | |
| 2018 | Jan | 17 | 11 |
| Feb | 14 | 2 | |
| Mar | 17 | 4 | |
| Apr | 8 | 5 | |
| May | 13 | 2 | |
| June | 10 | 1 | |
| July | 7 | 3 | |
| August | 6 | 2 | |
| Sep | 14 | 6 | |
| Oct | 9 | 2 | |
| Nov | 7 | 1 | |
| Dec | 5 | 0 | |
| 2019 | Jan | 19 | 5 |
| Feb | 76 | 14 |
Note: Graph was prepared by the Centre for Immunization and Respiratory Infectious Diseases (CIRID) using data from the WHO Disease Outbreak News and Saudi Arabia's Ministry of Health. This graph reflects data available as of February 28, 2019.
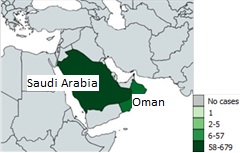
Figure 4 - Text description
The spatial distribution of reported MERS cases from January 1, 2019 to February 28, 2019 has been displayed in Figure 4. Throughout January 1, 2019 to February 28, 2019, the greatest number of cases have always been reported from Saudi Arabia with 58-679 cases reported so far this year.
Note: Map was prepared by the Centre for Immunization and Respiratory Infectious Diseases (CIRID) using data from the latest WHO Monthly Influenza at the Human-Animal Interface Risk Assessment. This map reflects data available through these risk assessments as of February 28, 2019.
Page details
- Date modified: