
Quarterly Financial Report
For the quarter ended December 31, 2018 (unaudited)
1. Introduction
This quarterly financial report should be read in conjunction with the Main Estimates and Supplementary Estimates for fiscal year 2018-19. It has been prepared by management, as required by section 65.1 of the Financial Administration Act and in the form and manner prescribed by the Directive on Accounting Standards, GC 4400 Departmental Quarterly Financial Report. It has been reviewed by the Internal Audit Committee of the Public Service Commission of Canada.
This quarterly report has not been subject to an external audit or review.
1.1 Authority and objectives
The Public Service Commission (the agency) is an independent agency established under the Public Service Employment Act and listed in schedules I.1 and IV of the Financial Administration Act.
A summary description of the agency’s programs can be found in its 2018-19 Departmental Plan.
1.2 Basis of presentation
This quarterly report has been prepared by management using an expenditure basis of accounting. The accompanying Statement of Authorities includes the agency’s spending authorities granted by Parliament and those used by the agency consistent with the Main Estimates for the 2018-19 fiscal year. This quarterly report has been prepared using a special purpose financial reporting framework designed to meet financial information needs with respect to the use of spending authorities.
The authority of Parliament is required before money can be spent by the Government. Approvals are given in the form of annually approved limits through appropriation acts or through legislation in the form of statutory spending authority for specific purposes.
The agency uses the full accrual method of accounting to prepare and present its annual departmental financial statements that are part of the departmental results reporting process. However, the spending authorities voted by Parliament remain on an expenditure basis.
1.3 Financial structure
The agency has a financial structure comprised of voted budgetary authorities for program expenditures and statutory authorities for contributions to employee benefit plans.
In addition, the agency has the authority to re-spend certain revenues received from other government departments and agencies in a fiscal year to offset expenditures incurred in that same year, for the provision of assessment and counselling products and services.
2. Highlights of fiscal quarter and fiscal year-to-date results
This section highlights the significant items that contributed to the change in resources available for the current year and in the actual expenditures for the quarter ended December 31, 2018.
The following graph provides a comparison of the net budgetary authorities available for spending and the expenditures for the quarters ended December 31, 2018, and December 31, 2017, for the agency’s combined Vote 1 – Program Expenditures and Statutory Authorities.
Comparison of Net Budgetary Authorities and Expenditures as of December 31, 2018 and December 31, 2017
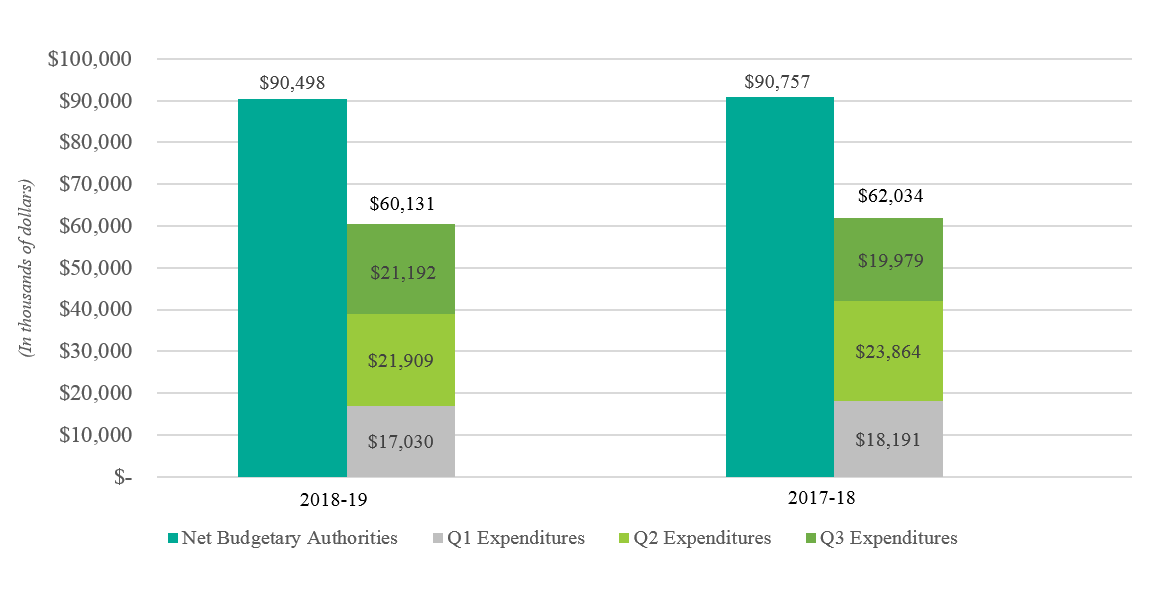
Text Alternative
| Net Budgetary Authorities | Q1 Expenditures | Q2 Expenditures | Q3 Expenditures | Total | |
|---|---|---|---|---|---|
| 2018-19 | $90,498 | $17,030 | $21,909 | $21,192 | $60,131 |
| 2017-18 | $90,757 | $18,191 | $23,864 | $19,979 | $62,034 |
2.1 Significant changes to authorities
As shown in Section 6: Statement of Authorities, at December 31, 2018, there has been a decrease of $259,000 in authorities available for use in the current year, as compared to the previous year.
This variance is explained by a decrease in the additional funding received from the Treasury Board to cover higher current salary rates and retroactive salary payments following the implementation of new collective agreements.
2.2 Significant variances in expenditures from prior year
As shown in Section 7: Budgetary expenditures by standard object, total net budgetary expenditures during the quarter increased from $19,979,000 in 2017-18 to $21,192,000 in 2018-19; a variance of $1,213,000 or 6.1%.
The variance is due mainly to the following:
- an increase of $1,786,000 in personnel mainly due to a timing difference in the payment of employee benefit plan contributions
- an increase of $219,000 in rentals mainly due to timing differences in the payment cycle for various software licences
- an increase of $808,000 in revenues netted against expenditures due mainly to a price increase and a higher demand for assessment products and services
3. Risks and uncertainties
The agency operates in a dynamic and complex environment that requires it to be efficient, adaptive and innovative. It uses integrated risk management, including a Corporate Risk Profile that is updated annually, to identify and respond to challenges and opportunities.
The agency’s key risks and the corresponding mitigation strategies are outlined in its Corporate Risk Profile 2018-19.
4. Significant changes in relation to operations, personnel and programs
There were no significant changes to operations, personnel or programs during the third quarter of 2018-19.
5. Approved by senior officials
Approved by:
Patrick Borbey
President
Philip Morton, CPA, CGA
Chief Financial Officer
Gatineau, Canada
February 27, 2019
6. Statement of Authorities (unaudited)
| Total available for use for the year ending March 31, 2019* | Used during the quarter ended December 31, 2018 | Year-to-date used at quarter-end | |
|---|---|---|---|
| Vote 1 – Program Expenditures | 79,176 | 17,420 | 51,638 |
| Statutory – Refund of Previous Year Revenue | 6 | 0 | 6 |
| Statutory – Employer Contributions to Employee Benefit Plans | 11,316 | 3,772 | 8,487 |
| Total Budgetary Authorities | 90,498 | 21,192 | 60,131 |
* Includes only Authorities available for use and granted by Parliament at quarter-end. |
|||
| Total available for use for the year ending March 31, 2018* | Used during the quarter ended December 31, 2017 | Year-to-date used at quarter-end | |
|---|---|---|---|
| Vote 1 – Program Expenditures | 79,381 | 18,082 | 54,449 |
| Statutory – Refund of Previous Year Revenue | 3 | 1 | 3 |
| Statutory – Employer Contributions to Employee Benefit Plans | 11,373 | 1,896 | 7,582 |
| Total Budgetary Authorities | 90,757 | 19,979 | 62,034 |
* Includes only Authorities available for use and granted by Parliament at quarter-end. |
|||
7. Budgetary expenditures by standard object (unaudited)
| Planned expenditures for the year ending March 31, 2019 | Expended during the quarter ended December 31, 2018 | Year-to-date used at quarter-end | |
|---|---|---|---|
| Personnel | 86,357 | 20,627 | 57,821 |
| Transportation and telecommunications | 951 | 278 | 593 |
| Information | 269 | 96 | 185 |
| Professional and special services | 12,733 | 2,074 | 4,180 |
| Rentals | 1,325 | 336 | 1,077 |
| Repair and maintenance | 138 | 13 | 41 |
| Utilities, materials and supplies | 250 | 107 | 228 |
| Acquisition of machinery and equipment | 2,127 | 69 | 441 |
| Other subsidies and payments | 600 | 199 | 583 |
| Total gross budgetary expenditures | 104,750 | 23,799 | 65,149 |
| Less: Revenues netted against expenditures | (14,252) | (2,607) | (5,018) |
| Total net budgetary expenditures | 90,498 | 21,192 | 60,131 |
| Planned expenditures for the year ending March 31, 2018 | Expended during the quarter ended December 31, 2017 | Year-to-date used at quarter-end | |
|---|---|---|---|
| Personnel | 86,702 | 18,841 | 57,907 |
| Transportation and telecommunications | 725 | 176 | 360 |
| Information | 303 | 78 | 185 |
| Professional and special services | 13,096 | 2,353 | 4,883 |
| Rentals | 2,762 | 117 | 1,226 |
| Repair and maintenance | 249 | 3 | 19 |
| Utilities, materials and supplies | 185 | 45 | 128 |
| Acquisition of machinery and equipment | 829 | 76 | 331 |
| Other subsidies and payments | 158 | 89 | 1,020 |
| Total gross budgetary expenditures | 105,009 | 21,778 | 66,059 |
| Less: Revenues netted against expenditures | (14,252) | (1,799) | (4,025) |
| Total net budgetary expenditures | 90,757 | 19,979 | 62,034 |
Page details
- Date modified: