
Evaluation of the Canada – Northwest Territories Labour Market Development Agreement
From: Employment and Social Development Canada
Alternate formats

Evaluation of the Canada-Northwest Territories Labour Market Development Agreement Synthesis Report [PDF - 755 KB]
Large print, braille, MP3 (audio), e-text and DAISY formats are available on demand by ordering online or calling 1 800 O-Canada (1-800-622-6232). If you use a teletypewriter (TTY), call 1-800-926-9105.
Executive summary
Introduction
Employment and Social Development Canada (ESDC) worked jointly with Northwest Territories (NWT) and 11 other provinces and territories (P/Ts) to undertake the 2012 to 2017 second cycle for the Labour Market Development Agreement (LMDA) evaluation. The first cycle of LMDA evaluation was carried out between 1998 and 2012 and involved the conduct of bilateral formative and summative evaluations in all P/Ts. Under the second cycle, the evaluation work consisted of conducting two to three studies per year on the Employment Benefits and Support Measures (EBSMs) similar programming delivered under these agreements. The studies generated evaluation evidence on the effectiveness, efficiency and design/delivery of EBSMs for Canada overall, for NWT, and for the 11 other P/Ts that opted for a joint evaluation process with Canada.
Under LMDAs, Canada transfers $2.14B in Employment Insurance (EI) Part II funds to P/Ts for the design and delivery of programs and services to help unemployed individuals, mainly those eligible under EI, to find and maintain employment.
Programs and services delivered by NWT have to correspond to the EBSM categories defined under the EI act. The following is a short description of the five categories of programs and services examined in the evaluation:
- Skills Development (Building Essential Skills) helps participants obtain employment skills by giving them financial assistance in order to attend classroom training. This program also includes apprenticeship training.
- Targeted Wage Subsidies (Training-on-the-Job) help participants obtain on-the-job work experience by providing employers with a wage subsidy.
- Self-Employment (Self Employment Option) provides financial assistance and business planning advice to participants to help them start their own business.
- Employment Assistance Services such as counselling, job search skills, job placement services, provision of labour market information and case management.
Four additional programs and services are available under the LMDAs: Job Creation Partnerships, Labour Market Partnerships, Research and Innovation and Targeted Earnings Supplements. They were not evaluated as part of this evaluation. The Job Creation Partnerships and Targeted Earnings Supplements programs are not used in NWT, and Labour Market Partnerships and Research and Innovation will be evaluated at a later stage.
Table i provides an overview of the share of funding allocated to the five EBSMs examined under the second cycle for LMDA evaluation and the average cost per intervention.
| Program and service | Share of funding 2014 to 2015 | Average cost per intervention 2002 to 2005 |
|---|---|---|
| Building Essential Skills (including Apprenticeship) |
40% | $5,486 |
| Employment Assistance Services | 44%s | $1,655 |
| Training-on-the-Job | 5% | $4,932 |
| Self-Employment Option | 5% | n/a |
| Total | 94% | n/a |
Sources: EI Monitoring and Assessment Reports 2002 to 2003 to 2014 to 2015.
Note: Labour Market Partnerships and Research and Innovation represented about 6% of EBSM expenditures in 2014 to 2015.
This report presents a summary of the findings from four studies produced on NWT LMDA interventions and participants. Results are presented for active and former EI claimants as well as for long-tenured workersFootnote 1, youth (under 30 years old) and older workers (55 years old and over) when the number of participants was sufficient to conduct quantitative analyses. Active EI claimants are classified as those who were receiving EI benefits at the time of their EBSM participation. Former EI claimants received EI up to three years before starting their EBSM participation.
Key findings
Overall, incremental impacts, cost-benefit analysis, and labour market outcomes provide some indications that LMDA-funded programs and services delivered in NWT are generally helping participants to improve their labour market attachment after participation.
With some exceptions, the labour market outcomes demonstrate that participants in LMDA programs and services showed higher average earnings and lower average proportions on EI and social assistance during the five years after program participation when compared to five years prior. Incremental impacts demonstrate that active EI claimants who participated in Employment Assistance Services had gains in earnings and reductions in EI use compared to similar non-participants after program participation, and the social benefits of participation exceeded the cost of the intervention over time.
Some participants do not appear to be benefiting from EBSM participation, as reflected in the general decrease in the proportion of participants employed between the pre- and post-participation periods. Additional explanations for this decrease may include retirement decisions and other reasons for leaving the labour force.
Incremental impacts and cost-benefit analysis
Employment Assistance Services are effective at improving earnings and reducing EI use among Active EI claimant participants
In comparison to similar EI claimants who did not participate in the program, active EI claimants who participated exclusively in Employment Assistance Services had higher earnings from employment/self-employment over the five years post-program participation (cumulative of $12,767). As well, these participants reduced their use of EI by a cumulative of $2,282 or 7.5 weeks after program participation. Incremental impacts on the incidence of employment, the use of social assistance and the level of dependence on government income support were overall not statistically significant. From the social perspective (that is the sum of participant and government costs or benefits), the benefits of participation in Employment Assistance Services exceeded the related costs in 3.3 years after participation.
Labour Market outcomes
Most program participants have higher average earnings after program participation
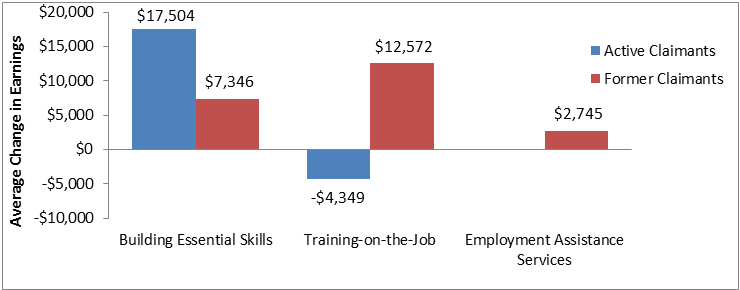
As shown in Figure i, active and former EI claimants who participated in Building Essential Skills showed higher average employment earnings during the five years after their participation when compared to five years prior. As well, former claimants who participated in Training-on-the-Job and Employment Assistance Services also showed higher average employment earnings after program participation when compared to average earnings in the five years before participation. Active claimants who participated in Training-on-the-Job had lower average employment earnings during the five years after their participation. Considering the small number of participants in Training-on-the-Job, the figures should be interpreted with caution.
Text description of Figure i
| Average Change in Earnings | ||
| Active Claimants | Former Claimants | |
| Building Essential Skills | $17,504 | $7,346 |
| Training-on-the-Job | -$4,349 | $12,572 |
| Employment Assistance Services | n/a | $2,745 |
Note: outcomes for participants in Training-on-the-Job should be interpreted with caution given the small number of participants (62 for active claimants and 64 for former claimants).
The average proportion of participants on Employment Insurance and social assistance is generally lower after program participation
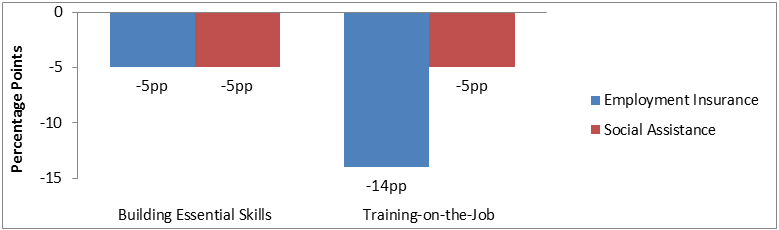
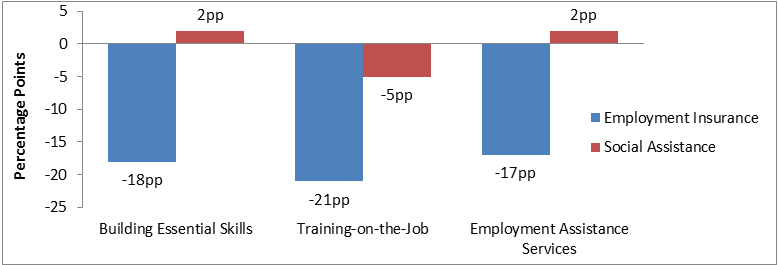
As shown in Figures ii and iii, the average proportion of participants who use EI is shown to be lower in the post-participation period for active and former EI claimants who participated in Building Essential Skills and Training-on-the-Job. As well, the average proportion of former claimants who use EI is also shown to be lower in the five years after program participation for those who participated in Employment Assistance Services (when compared to five years prior). These decreases were accompanied by decreased proportions of participants on social assistance for all active claimant participants and for former claimants who participated in Training-on-the-Job.
Text description of Figure ii
| Percentage Points | ||
|---|---|---|
| Employment Insurance | Social Assistance | |
| Building Essential Skills | -5 | -5 |
| Training-on-the-Job | -14 | -5 |
Note: outcomes for participants in Training-on-the-Job should be interpreted with caution given the small number of participants (62 for active claimants and 64 for former claimants).
Text description of Figure iii
| Percentage Points | ||
|---|---|---|
| Employment Insurance | Social Assistance | |
| Building Essential Skills | -18 | 2 |
| Training-on-the-Job | -21 | -5 |
| Employment Assistance Services | -17 | 2 |
Note: outcomes for participants in Training-on-the-Job should be interpreted with caution given the small number of participants (62 for active claimants and 64 for former claimants).
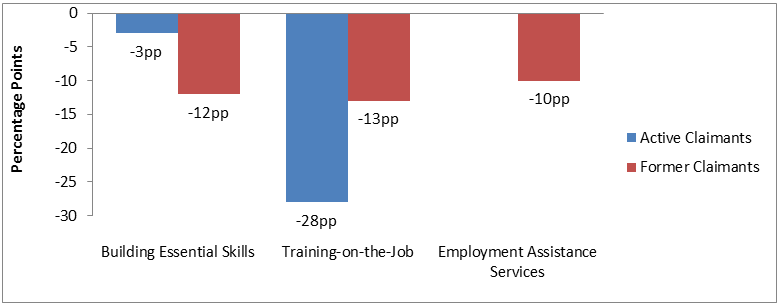
The average proportion of participants employed is lower after program participation when compared to before program participation for all EBSMs
Some participants do not appear to be benefiting from EBSM participation, as reflected in the general decrease in the proportion of participants employed between the pre- and post-participation periods (see Figure iv). This decrease can be partially explained by retirement decisions considering the proportion of participants aged 55 years and older, while others may have left the labour force for other reasons.
Text description of Figure iii
| Percentage Points | ||
|---|---|---|
| Active Claimants | Former Claimants | |
| Building Essential Skills | -3 | -12 |
| Training-on-the-Job | -28 | -13 |
| Employment Assistance Services | n/a | -10 |
Note: outcomes for participants in Training-on-the-Job should be interpreted with caution given the small number of participants (62 for active claimants and 64 for former claimants).
Lessons learned about program design and delivery
Key informants interviews with service providers and program managers, as well as the documents reviewed and the questionnaires filled by provincial and territorial representatives, revealed specific challenges and lessons learned about program design and delivery. Though NWT did not participate in these qualitative studies, the information that was produced at the national level is included in this report with the objective of sharing best practices and lessons learned.
Skills Development (Building Essential Skills)
Key informants confirmed that most P/Ts take steps to direct Skills Development funding towards training for occupations in demand in the labour market. In particular, as part of the application process, prospective participants have to justify their choice of training program by demonstrating that labour market demand exists. Five provinces/territories may not approve applications for training leading to employment in low demand occupations.
According to key informants, the main challenges related to Skills Development included:
- Lack of capacity to case manage and monitor individuals facing multiple barriers to employment.
- Access to the program is limited due to the EI eligibility criteria.
- Participant's ability to access and complete training is often limited by a lack of essential skills, learning disabilities, literacy issues and other factors such as living in remote locations and lack of transportation.
- Unemployed individuals lack awareness about the program and early engagement of EI claimants is difficult since Service Canada does not refer recent claimants to provincial/territorial offices.
Skills development for apprentices (Building Essential Skills – Apprenticeship)
- Existing Canadian literature showed that there is a fairly high non-completion rate among apprentices (40-50%)Footnote 2. Furthermore, subject matter literature revealed that despite the growth in apprenticeship registrations in Canada, there has not been a corresponding increase in completion ratesFootnote 3. While it is not possible with available data to generate a reliable estimation of the completion rate of Skills Development-Apprentices participants, key informants involved in apprenticeship delivery confirmed the stagnation in completion rates.
- According to key informants, apprenticeship drop-out is due to factors such as low level of essential skills, financial difficulties (for example not being able to live on EI benefits while on training) and delays in getting EI benefits (for example EI eligibility is not confirmed until training is almost complete).
Targeted Wage Subsidies (Training-on-the-job)
Key informants confirmed that participation in Targeted Wage Subsidies can be driven by either unemployed individuals or employers looking to fill a new position. Key informants also confirmed that in most P/Ts covered by the evaluation, the subsidized employers are generally hiring those they would not have otherwise hired without the help of the program.
While evaluation results have demonstrated the effectiveness of Targeted Wage Subsidies, its use has been falling in recent years. According to the EI Monitoring and Assessment Reports, the proportion of new Targeted Wage Subsidies interventions across Canada decreased from 3% to 1% of all new interventions between 2002 to 2003 and 2014 to 2015. Reasons identified by key informants to explain this decline included:
- The frequent and time consuming reporting requirements for the employers.
- Lack of awareness about the program among employers.
- Employers having a negative perception of the quality of the candidates.
- Difficulty in matching employers' needs to the skills of available candidates.
Employment Assistance Services
According to key informants, challenges with the design and delivery of Employment Assistance Services included:
- Lack of awareness about Employment Assistance Services among potential participants.
- Current budget allocation is not enough to support the delivery of Employment Assistance Services and has led some service providers to eliminate services.
- Service providers cannot provide all the services needed for participants facing multiple barriers to employment. They have to refer these individuals to other organizations.
Recommendations
A total of 10 recommendations emerge from the evaluation findings. They are as follows:
The report presents challenges and lessons learned about the design and delivery of Building Essential Skills (including the apprenticeship program), Training-on-the-Job and Employment Assistance Services. These challenges and lessons learned were gathered from EBSM managers and case workers across eight to ten provinces and territories. NWT did not participate in those studies and qualitative information was not collected in NWT.
Recommendation 1: Consideration should be given by NWT to examine to what extent challenges and lessons learned identified at the national level are applicable to the unique context in NWT.
Recommendation 2: Taking into consideration the future labour market needs in the Territory and the existing skills gaps, consideration should be given by NWT to examine the extent to which the caps on the length of financial assistance under Building Essential Skills are appropriate.
A study carried out across Canada regarding the timing of participation in Employment Assistance Services showed that receiving assistance early after starting an EI claim can lead to better labour market impacts.
Recommendation 3: Consideration should be given by NWT to request timely access to data on new EI recipients for targeting purposes, especially if awareness about Employment Assistance Services is also an issue in the territory.
As detailed in section 2.1 of this report, Aboriginal peoples represent 50% of the population in NWT and they are mainly located outside Yellowknife, the main urban centre. Labour market statistics demonstrate that Aboriginal peoples in NWT experience significantly higher unemployment rates and lower levels of education compared to non-Aboriginals. Furthermore, a report entitled Northwest Territories Labour Market Forecast and Needs Assessment completed in 2016 forecasted that there will be 28,500 to 36,700 job openings in the Territory over the next 15 years. The report estimated that approximately 98% of these job openings will be to replace workers who have retired or moved (mainly non-Aboriginals), and 78% of these jobs will typically require some form of postsecondary education and/or extensive work experience. The report also specified that high levels of education and occupational skills will be critical for meeting the future needs of the labour market. Finally, the profile of LMDA participants between 2001 and 2008 demonstrate that the number of self-identified Aboriginal participants is well below 50% for most interventions. It is not clear from the LMDA data whether Aboriginal persons are underrepresented in EBSMs and whether this is due to self-identification or missing data, or due to low EI eligibility among unemployed Aboriginal persons.
Recommendation 4: It is recommended that the self-identification of Aboriginal participants be encouraged under the LMDA in order to properly account for the efforts dedicated by NWT to upskill Aboriginal participants and to assist them in returning to work.
Recommendation 5: With only 22% of the Aboriginal population living in Yellowknife, consideration should be given to examine whether the level of service available across the 32 other communities is not a barrier to access and participation in LMDA programs and services.
Recommendation 6: With the focus on assisting Aboriginal participants with lower levels of education, consideration should be given to providing additional measures to remove barriers to accessing and completing training such as literacy/essential skills training and learning disability assessments. These measures would help individuals with multiple barriers and those distant from the labour market in preparing for vocational training and eventually reintegrating the labour market. These measures should be reported separately from other Building Essential Skills interventions given their unique objectives.
Recommendation 7: Consideration should be given to examine to what extent the level of funding (from EI or other sources) and the level of service available under the LMDA, the Canada Job Fund, the Aboriginal Skills and Employment Training Strategy and other territorial programs is coordinated and sufficient to meet the future labour market needs of NWT.
Given the small number of program participants, labour market outcomes provided some indications that participation in Training-on-the-Job in the 2001 to 2007 period is not leading to favourable labour market outcomes for active claimants in terms of earnings and employment. Some participants were not able to maintain their subsidized jobs and/or to reintegrate into the labour market. At the national level, incremental impacts show that Targeted Wage Subsidies are improving the earnings and employment of participants.
Recommendation 8: It is important to understand how the program is designed and delivered currently in NWT compared to the 2001 to 2007 period and to explore steps aiming to increase retention and use of the program given the future labour market needs in NWT.
With the exception of producing incremental impacts for the participation in Employment Assistance Services, the LMDA evaluation was only able to produce labour market outcomes for participants in other EBSMs given the small number of participants. Labour market outcomes were produced over five years and for the entire population of participants using rich data on EI claimants, EBSM participation data and Canada Revenue Agency taxation files. Some data gaps were identified in order to support future evaluation activities. For example:
- Having access to data on whether participants are members of designated groups including Aboriginal peoples, persons with disabilities and recent immigrants would be useful to inform policy development and program design.
- Having access to data on the cost of programming per participant would also provide a refined assessment of how much participation costs for active claimants as compared to former claimants.
- It is not currently possible to distinguish between different types of training funded under Building Essential Skills (for example literacy, essential skills, adult basic education and vocational training). These various types of training lead to very different labour market outcomes and can help explain the observed outcomes.
- Data assessment revealed the presence of high number of interventions that are classified under the categories of miscellaneous, ambiguous or undocumented.
- Little is also known about the various types of Employment Assistance Services provided under the LMDA in NWT. These services can be very different in nature and it is possible that some may be more effective than others at helping participants return to employment. For example, having access to a computer for researching jobs on its own may yield different impacts than receiving counselling and assistance to develop a return-to-work action plan.
Recommendation 9: Improvements in the data collection process are recommended to address key program and policy questions of interest to Canada and NWT. Specifically:
- Collect data on whether participants are members of designated groups including Aboriginal peoples, persons with disabilities and recent immigrants.
- Collect data on the type of training funded under Building Essential Skills and the type of assistance provided under Employment Assistance Services. NWT, ESDC and other provinces and territories should work together to define common categories for both EBSMs.
- Collect detailed data on the cost of EBSM interventions.
- ESDC and NWT should carry out a data assessment regarding the integrity of data uploads and the standardization process of NWT data within ESDC.
The evaluation was not able to produce with confidence labour market outcomes for the Self-Employment Option since the data used to assess impacts on earnings may not be the best source of information available to reflect the financial wellbeing of the participants. As well, little is known about the design and delivery of this program. Overall, it is not clear whether participant’s success in improving their labour market attachment through self-employment is more closely associated with their business idea and their entrepreneurship skills rather than the assistance provided under Self-Employment.
Recommendation 10: Consideration should be given to examine in more detail the design and delivery of Self-Employment Option and whether the performance indicators for this program are appropriate.
Management response
Introduction
Employment and Social Development Canada (ESDC) worked jointly with Northwest Territories (NWT) and 11 other provinces and territories to undertake the 2012 to 2017 second cycle for the Labour Market Development Agreement (LMDA) evaluation.
Background
The main objective of Employment Insurance (EI) Part II is to maintain a sustainable EI system by getting clients back to work quickly. Part II allows the federal government to sign agreements (that is LMDAs) with provinces and territories to design, deliver and manage their own active employment programs for unemployed Canadians, particularly for those who are eligible for EI.
The LMDAs transfer $2.14B annually ($1.95 billion in program funding and $190 million in administrative funding) to provinces and territories for the design and management of programs. The Northwest Territories’ annual allocation is approximately $4.6 million.
Building on lessons learned and best practices from previous LMDA evaluations, the second cycle for LMDA evaluation produced high quality evaluation evidence on the effectiveness and efficiency of the Employment Benefits and Support Measures (EBSMs) designed and delivered by provinces and territories.
Cycle II evaluation confirms that:
- With some exceptions, participants in most EBSMs experienced an increase in employment earnings and a reduction in the use of Employment Insurance and Social Assistance over the five years' post-program period.
- Overall, there are indications that LMDA-funded programs (EBSMs) and services delivered in the NWT are generally helping participants to improve their labour market experience after participation. As such, evaluation evidence suggests that LMDA-funded programs are aligned with and can contribute to achieving the vision of Skills 4 Success 10-Year Strategic Framework by ensuring that "NWT residents have the skills, knowledge and attitudes for employment success".
Response to ESDC recommendations
The Labour Development and Standards division, Department of Education, Culture and Employment (ECE) identified the following actions in relation to the recommendations coming out of the evaluation:
Recommendation 1: Consideration should be given by NWT to examine to what extent challenges and lessons learned identified at the national level are applicable to the unique context in NWT.
Recommendation 2: Taking into consideration the future labour market needs in NWT and the existing skills gaps, consideration should be given by NWT to examine the extent to which the caps on the length of financial assistance under Building Essential Skills are appropriate.
Context from NWT synthesis report:
The report presents challenges and lessons learned about the design and delivery of Building Essential Skills (including the apprenticeship program), Training-on-the-Job and Employment Assistance Services. These challenges and lessons learned were gathered from EBSM managers and case workers across eight to ten provinces and territories. NWT did not participate in those studies and qualitative information was not collected in NWT.
GNWT response:
ECE is implementing the 4-year action plan of Skills 4 Success, which has been built on extensive consultation with labour market stakeholders. Within this context, ECE will examine the challenges and lessons learned identified at the national level to enhance the strategic actions applied. ECE will also examine the LMDA programs and consider whether extending the maximum duration of financial assistance under Skills Development is appropriate.
Recommendation 3: Consideration should be given by NWT to request timely access to data on new EI recipients for targeting purposes, especially if awareness about Employment Assistance Services is also an issue in the territory.
Context from NWT synthesis report:
A study carried out across Canada regarding the timing of participation in Employment Assistance Services showed that receiving assistance early after starting an EI claim can lead to better labour market impacts.
GNWT response:
Finalizing the Information and Data Sharing Arrangement (Annex 5) is a priority for ECE, recognizing adequate data on EI recipients will provide evidence to guide ECE in providing more effective and coordinated levels of resources and supports, to populations experiencing multiple barriers to sustained labour market participation.
Recommendation 4: It is recommended that the self-identification of Aboriginal participants be encouraged under the LMDA in order to properly account for the efforts dedicated by NWT to upskill Aboriginal participants and to assist them in returning to work.
Recommendation 5: With only 22% of the Aboriginal population living in Yellowknife, considerations should be given to examine whether the level of service available across the 32 other communities is not a barrier to access and participation in LMDA programs and services.
Recommendation 6: With the focus on assisting Aboriginal participants with lower levels of education, consideration should be given about providing additional measures to remove barriers to accessing and completing training such as literacy/essential skills training and learning disability assessments. These measures would help individuals with multiple barriers and those distant from the labour market in preparing for vocational training and eventually reintegrating the labour market. These measures should be reported separately from other Skills Development interventions given their unique objectives.
Recommendation 7: Consideration should be given to examine to what extent the level of funding (from EI or other sources) and the level of service available under the LMDA, the Canada Job Fund, the Aboriginal Skills and Employment Training Strategy and other territorial programs is coordinated and sufficient to meet the future labour market needs of NWT.
Context from NWT synthesis report:
As detailed in section 2.1 of the report, Aboriginal peoples represent 50% of the population in NWT and they are mainly located outside Yellowknife, the main urban centre. Labour market statistics demonstrate that Aboriginal peoples in NWT experience significantly higher unemployment rates and lower levels of education compared to non-Aboriginals. Furthermore, a report entitled Northwest Territories Labour Market Forecast and Needs Assessment completed in 2016 forecasted that there will be 28,500 to 36,700 job openings in the Territory over the next 15 years. The report estimated that approximately 98% of these job openings will be to replace workers who have retired or moved (mainly non-Aboriginals), and 78% of these jobs will typically require some form of postsecondary education and/or extensive work experience. The report also specified that high levels of education and occupational skills will be critical for meeting the future needs of the labour market. Finally, the profile of LMDA participants between 2001 and 2008 demonstrate that the number of self-identified Aboriginal participants is well below 50% for most interventions. It is not clear from the LMDA data whether Aboriginal persons are underrepresented in EBSMs and whether this is due to self-identification or missing data, or due to low EI eligibility among unemployed Aboriginal persons, or a combination thereof.
GNWT response:
ECE will continue to encourage self-identification of Aboriginals clients to support assessment of labour market programs accessed, outcomes, and effectiveness.
In order to improve the integrity and granularity of LMDA data, ECE will work with ESDC under renewed Labour Market Development Agreements to update the data exchange agreement, where possible, specifically in terms of relevant, effective and administratively supported data collection and data sharing between ECE and ESDC. To the extent possible, this administrative data could include client characteristics, as well as interventions and costs, as recommended in the evaluation report.
ECE will consider expanding EBSMs, to increase focus on programs that support strategic removal of barriers such as literacy/essential skills and learning disabilities. ECE will examine the costs and benefits of gathering and reporting additional measures and will explore with ESDC the possibility of collecting more detailed intervention types under the Skills Development program.
ECE will work with ESDC to provide more flexibility under the LMDA programs, to better target unemployed Canadians who need access to skills and training programs, given the commitment to modernize labour market transfer agreements.
Recommendation 8: It is important to understand how the Targeted Wage Subsidies/Training-on-the-Job program is designed and delivered currently in NWT compared to the 2001 to 2007 period and to explore steps aiming to increase retention and use of the program given the future labour market needs in NWT.
Context from NWT synthesis report:
Given the small number of program participants, labour market outcomes provided some indications that participation in Training-on-the-Job in the 2001 to 2007 period is not leading to favourable labour market outcomes for active claimants in terms of earnings and employment. Some participants were not able to maintain their subsidized jobs and/or to reintegrate the labour market. At the national level, incremental impacts show that Targeted Wage Subsidies are improving the earnings and employment of participants.
GNWT response:
The amount of data available limits the ability to assess influences on decreased usage of the programs. ECE will monitor program usage and consider conducting internal consultation to identify impacts, including EI eligibility and promotion of programming or potential barriers to employer participation.
Recommendation 9: Improvements in the data collection process are recommended to address key program and policy questions of interest to Canada and NWT. Specifically:
- Collect data on whether participants are members of designated groups including Aboriginal peoples, persons with disabilities and recent immigrants.
- Collect data on the type of training funded under Building Essential Skills and the type of assistance provided under Employment Assistance Services. NWT, ESDC and other provinces and territories should work together to define common categories for both EBSMs.
- Collect detailed data on the cost of EBSM interventions.
- ESDC and NWT should carry out a data assessment regarding the integrity of data uploads and the standardization process of NWT data within ESDC.
Context from NWT synthesis report:
With the exception of producing incremental impacts for the participation in Employment Assistance Services, the LMDA evaluation was only able to produce labour market outcomes for participants in other EBSMs given the small number of participants. Labour market outcomes were produced over five years and for the entire population of participants using rich data on EI claimants, EBSM participation data and Canada Revenue Agency taxation files. Some data gaps were identified in order to support future evaluation activities. For example:
- Having access to data on whether participants are members of designated groups including Aboriginal peoples, persons with disabilities and recent immigrants would be useful to inform policy development and program design.
- Having access to data on the cost of programming per participant would also provide a refined assessment of how much participation costs for active claimants as compared to former claimants.
- It is not currently possible to distinguish between different types of training funded under Building Essential Skills (for example literacy, essential skills, adult basic education and vocational training). These various types of training lead to very different labour market outcomes and can help explain the observed outcomes.
- Data assessment revealed the presence of a high number of interventions that are classified under the categories of miscellaneous, ambiguous or undocumented.
- Little is also known about the various types of Employment Assistance Services provided under the LMDA in NWT. These services can be very different in nature and it is possible that some may be more effective than others at helping participants return to employment. For example, having access to a computer for researching jobs on its own may yield different impacts than receiving counselling and assistance to develop a return-to-work action plan.
GNWT response:
In order to improve the integrity and granularity of LMDA data, ECE will work with ESDC under renewed Labour Market Development Agreements to update the data exchange agreement, where possible, specifically in terms of relevant, effective and administratively supported data collection and data sharing between ECE and ESDC. To the extent possible, this administrative data could include client characteristics, as well as interventions and costs, as recommended in the evaluation report.
Recommendation 10: Consideration should be given to examine in more detail the design and delivery of Self-Employment Option and whether the performance indicators for this program are appropriate.
Context from NWT synthesis report:
The evaluation was not able to produce with confidence labour market outcomes for the Self-Employment Option since the data used to assess impacts on earnings may not be the best source of information available to reflect the financial wellbeing of the participants. As well, little is known about the design and delivery of this program. Overall, it is not clear whether participant’s success in improving their labour market attachment through self-employment is more closely associated with their business idea and their entrepreneurship skills rather than the assistance provided under Self-Employment.
GNWT response:
ECE will work with ESDC, provinces, and territories, through the Evaluation Steering Committee, to consider other available indicators and outcomes.
1. Introduction
Employment and Social Development Canada (ESDC) worked jointly with Northwest Territories (NWT) and 11 other Provinces and Territories (P/Ts) to undertake the 2012 to 2017 second cycle for the Labour Market Development Agreement (LMDA) evaluations. The first cycle of LMDA evaluation was carried out between 1998 and 2012 and involved the conduct of bilateral formative and summative evaluations in all P/Ts. Under the second cycle, the evaluation work consisted of conducting two to three studies per year on the Employment Benefits and Support Measures (EBSMs) similar programming delivered under these agreements. The studies generated evaluation evidence on the effectiveness, efficiency and design/delivery of LMDA programs and services for Canada overall, for NWT, and for the 11 other P/Ts that opted for a joint evaluation process with the Government of Canada.
This report presents a summary of the findings from the studies conducted for NWT and it is organised as follows:
- Introduction with an overview of the studies summarized in this report including their scope and methodology, and contextual information on the LMDAs.
- Findings section with a discussion around the unique labour market context in NWT and a summary of evaluation evidence for the five EBSMs examined in the LMDA evaluation studies.
- Conclusions and lessons learned.
- Recommendations that emerge from the evaluation findings and areas for future investigation.
1.1 Labour Market Development Agreement background
LMDAs are bilateral agreements between Canada and each P/T and were established under Part II of the 1996 Employment Insurance (EI) Act. As part of these agreements, Canada transfers $2.14B annually to P/Ts (including $190M in administration funds) in order to design and deliver programs and services to help individuals prepare for, obtain and maintain employment.
The Canada – NWT LMDA was signed on February 27, 1998. The agreement transferred responsibility to NWT for the design and delivery of programs and services. The NWT’s Department of Education, Culture, and Employment administers these programs, which are classified under two categories: 1) Employment Benefits and 2) Support Measures.
Employment Benefits
Employment Benefits funded under the LMDA are offered to unemployed individuals who 1) are actively on EI (active claimants); 2) ended their benefit period within three years before participating (former claimants); or 3) established a claim for maternity or parental benefits within the past five years and are returning to the labour force for the first time (former claimants)Footnote 4. Employment Benefits include the following categories:
- Skills Development (Building Essential Skills) helps participants obtain employment skills by giving them financial assistance that enables them to select, arrange and pay for classroom training. This program also includes apprenticeship training.
- Targeted Wage Subsidies (Training-on-the-Job) help participants obtain on-the-job work experience by providing employers with financial assistance to help with the wages of participants.
- Self-Employment (Self-Employment Option) provides financial assistance and business planning advice to EI-eligible participants to help them start their own business. This financial assistance is intended to cover personal living expenses and other expenses during the initial stages of the business.
- Job Creation Partnerships provide participants with opportunities to gain work experience that will lead to ongoing employment. Employment opportunities are provided by projects that contribute to developing the community and the local economy. This EBSM was not offered in NWT during the period observed.
- Targeted Earnings Supplements encourage unemployed persons to accept employment by offering them financial incentives. This EBSM was not offered in NWT during the period observed.
Support measures
Support Measures are available to all unemployed individuals including those not eligible to receive EI and include:
- Employment Assistance Services such as individual counselling, action planning, help with job search skills, job-finding clubs, job placement services, the provision of Labour Market Information, case management and follow-up.
- Labour Market Partnerships provide funding to help employers, employee and employer associations, and communities improve their capacity to deal with human resource requirements and implement labour force adjustments. These partnerships involve developing plans and strategies, and implementing labour force adjustment measures.
- Research and Innovation supports activities that identify better ways of helping people prepare for or keep employment and be productive participants in the labour force. Funds are provided to eligible recipients to enable them to carry out demonstration projects and research for this purpose.
Job Creation Partnerships, Targeted Earnings Supplements, Labour Market Partnerships, and Research and Innovation were not covered under the second cycle of this LMDA evaluation.
Table 1 provides an overview of the share of funding allocated to the five programs and services examined under the second cycle for LMDA evaluation and the average cost per intervention. It is noted that the average cost per intervention was calculated based on the 2002 to 2005 data from the EI Monitoring and Assessment Reports. The 2002 to 2005 period corresponds to the cohort of participants originally selected for incremental impacts and cost-benefit analysis in the LMDA evaluation (the cohort was widened to include 2001 to 2007 participants in the case of NWT to allow sufficient sample size for analysis).
| Program and service | Share of funding 2014 to 2015 |
Average cost per intervention 2002 to 2005 |
|---|---|---|
| Building Essential Skills (including Apprenticeship) |
40% | $5,486 |
| Employment Assistance Services | 44% | $1,655 |
| Training-on-the-Job | 5% | $4,932 |
| Self-Employment Option | 5% | n/a |
| Total | 94% | n/a |
Sources: EI Monitoring and Assessment Reports 2002 to 2003 to 2014 to 2015.
Note: Labour Market Partnerships and Research and Innovation represented about 6% of EBSM expenditures in 2014 to 2015.
1.2 Methodology
This section presents key aspects of the quantitative analyses carried out as part of the LMDA studies, while a more detailed description of the methodology is provided in Appendix A.
All quantitative analyses were based on EI Part I (EI claim data) and Part II (EBSM participation data) administrative data that was linked to T1 and T4 taxation files from the Canada Revenue Agency. Incremental impact analyses and the cost-benefit analyses were based on 100% of participants in the reference period selected.
Incremental impacts analysis
One study assessed program effectiveness by estimating incremental impacts from participation in Employment Assistance Services on participants' labour market experience (for example earnings from employment/self-employment, incidence of employment, use of EI and Social Assistance and dependence on income support) after participation. The role of the incremental impact analysis is to isolate the effects of participation from other factors such as the economic cycle. In order to achieve this, the incremental impact analyses compared the labour market experience of participants before and after their participation with that of non-participants (see the example of incremental impact calculation in Figure 1).
The matching of participants and comparison group members used up to 75 socio-demographic and labour market variables observed over five years before participation. For active claimants, the incremental impacts were measured relative to a comparison group of active claimants who were eligible to, but did not, participate in EBSMs during the reference period.Footnote 5
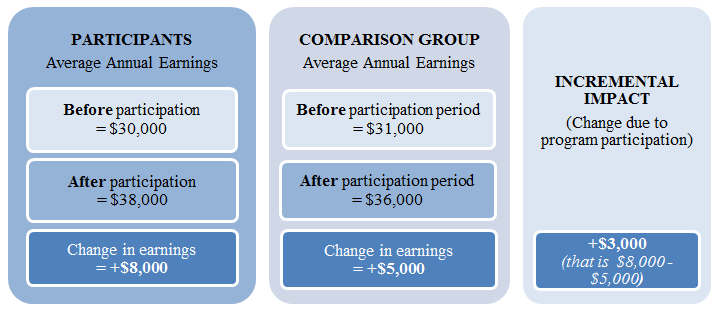
Text description of Figure 1
Figure 1 presents an example of the approach used to estimate the incremental impacts on earnings.
Factors accounted for in the cost-benefit analysis
Program efficiency was assessed through a cost-benefit analysis which compared the cost of participating in Employment Assistance Services for the participants and the cost of delivering the program for the government to the benefits generated by the program. Overall, this analysis provided insight on the extent to which participation exclusively in Employment Assistance Services interventions is efficient for society (that is, for both the participants and the government). The costs and benefits accounted for in the calculations were as follows (see detailed definitions in Appendix A):
- Program cost: includes program and administration costs paid by the government.
- Marginal social cost of public funds: represents the loss incurred by society when raising additional revenues such as taxes to fund government programs.
- Employment earnings: consist of incremental impacts on participants' earnings during and after participation. The calculation accounts for the participant's forgone earnings during participation (that is, opportunity cost). Employment earnings were also increased by 15% to account for fringe benefits such as employer-paid health, life insurance and pensions contributions.
Labour Market Outcomes
The analysis of outcomes provides descriptive statistics on the labour market experience of participants before, during and after participation. For example, it shows the average annual earnings of active claimants before, during and after participation, and presents what changes were observed from before to after participation. Overall, the analyses were conducted over a period of 9 to 12 years (five years before participation, one or two years during participation, and three or five years after participation).
The outcome analyses provide an assessment of how the labour market situation of participants evolved over time, but does not permit inference regarding the extent to which those changes were due to EBSM participation. For example, increases in employment earnings over the period examined could be partly due to inflation or normal wage increases.
When the number of participants was sufficient, outcomes were examined for active and former EI claimants who were youth (under 30 years old), older workers (55 years old and over) and long-tenured workers. Long-tenured workers refer to individuals who had long-term attachment to the labour market but not necessarily a long tenure with the same employer.
Strengths and limitations of the studies
One of the key strengths of the studies is that all quantitative analyses were based on administrative data rather than survey responses. Compared to survey data, administrative data are not subject to recall errors or response bias.
The propensity score models used to match Employment Assistance Services participants and non-participants for the incremental impact analysis are judged to be robust in part because they were based on five years of pre-participation data and on a vast array of variables including socio-demographic characteristics, location, skills level related to last occupation and indicators of labour market attachment. Sensitivity analysis and the use of alternative estimation methods have increased confidence in the incremental impact estimates. However, one limitation of the propensity score matching technique is that one cannot be fully certain that the impacts were not influenced by factors not captured in the data.
The cost-benefit analysis accounted for all quantifiable costs and benefits that are directly attributable to Employment Assistance Services and could be estimated with the available administrative data. The analysis did not account for non-quantifiable benefits, such as improvements in the participant’s well-being or the multiplier effect of increased spending on the economy.
In the case of NWT, we were only able to produce incremental impacts for active EI claimants who participated exclusively in Employment Assistance Services interventions and this is mainly due to the small number of participants in the Territory. Incremental impacts were produced for active claimants who participated in Building Essential Skills but balancing tests were not satisfied. As a consequence, the estimates were not considered to be robust enough to be presented in this report.
The report presents the labour market outcomes for the participation in various programs and services over a twelve year period (that is, 5 years pre-program, 1 to 2 years in-program and 5 years post-program). Readers should be careful to note, when interpreting these outcomes, that changes may be due to external factors (for example inflation, youth maturation process, etc.) and not EBSM participation. In the case of youth, improvement in their labour market outcomes is in part due to the normal maturation process during the period under examination. When compared to individuals in other age groups, youth are often those with the lowest earnings and incidence of employment before participation and the highest levels after participation.
Under the second cycle of LMDA evaluation, four studies of qualitative nature were carried out addressing issues and questions related to program design and delivery, challenges and lessons learned. The studies covered Employment Assistance Services, Skills Development, Skills Development - Apprentices and Targeted Wage Subsidies. NWT did not participate in these studies. This report, therefore, will summarize information that was produced at the national level with the objective of sharing lessons learned and best practices with NWT. When interpreting the qualitative findings from the national level evaluation, readers should keep in mind that those are based on the perception of key informants who are directly involved in the design or delivery of the program. Their perception may be representative of their own region or community but not necessarily of the entire country, and may not be generalizable in this way to NWT.
1.3 Overview of the studies summarized in this report
Findings presented in this report were drawn from four separate studies produced on NWT LMDA interventions and participants. These studies examined issues related to program effectiveness, efficiency, design/delivery and used a mix of qualitative and quantitative methods. Each study examined evaluation issues in relation to active and former EI claimants.
Table F1 in Appendix F presents an overview of these studies, including the type of evidence generated, the methods used, the reference period and the length of the post-program period over which program effects were observed.
2. Evaluation findings
2.1 Rationale and Labour Market context
Labour market contextFootnote 6
NWT covers an area of approximately 1,346,106 km. The Territory had a total population of 44,088 as of July 2015, with almost half of individuals residing in Yellowknife (20,637) and only five (of 33) communities in total with populations in excess of 2,000 (Inuvik, Hay River, Fort Smith, Behchoko and Yellowknife). The population is equally split between Aboriginal (22,050) and non-Aboriginal population (22,038). The majority (78%) of Aboriginal peoples live in the smaller communities and only 4,901 (22%) live in Yellowknife.
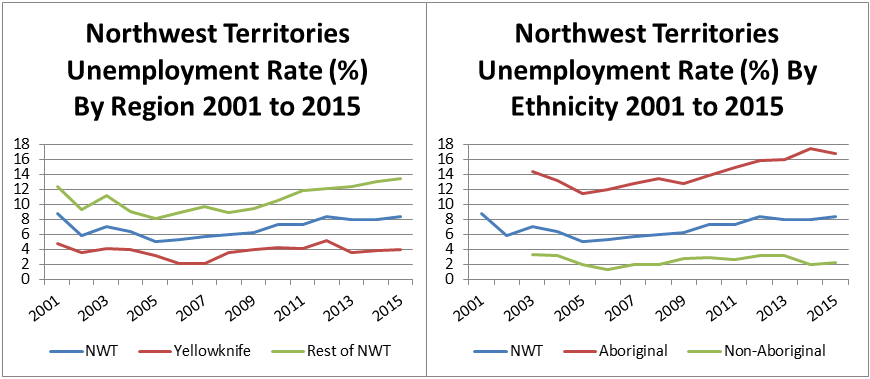
As shown in Figure 2, Aboriginal peoples experience significantly high unemployment compared to the non-Aboriginal population. In 2015, 16.8% of the Aboriginal population was unemployed compared to 2.2% for non-Aboriginals. Data also demonstrate notable differences in the unemployment rate between urban (Yellowknife) and rural populations.
Text description of Figure 2
Figure 2. Unemployment Rate by Region and by Ethnicity between 2001 and 2015
| Year | NWT | Yellowknife | Rest of NWT |
|---|---|---|---|
| 2001 | 8.7 | 4.7 | 12.4 |
| 2002 | 5.8 | 3.5 | 9.3 |
| 2003 | 7.0 | 4.1 | 11.1 |
| 2004 | 6.4 | 4.0 | 9.0 |
| 2005 | 5.0 | 3.1 | 8.1 |
| 2006 | 5.3 | 2.1 | 8.9 |
| 2007 | 5.7 | 2.1 | 9.7 |
| 2008 | 5.9 | 3.6 | 8.9 |
| 2009 | 6.2 | 3.9 | 9.4 |
| 2010 | 7.3 | 4.2 | 10.5 |
| 2011 | 7.3 | 4.1 | 11.8 |
| 2012 | 8.4 | 5.2 | 12.1 |
| 2013 | 8.0 | 3.6 | 12.3 |
| 2014 | 7.9 | 3.8 | 13.0 |
| 2015 | 8.3 | 3.9 | 13.4 |
| Year | NWT | Aboriginal | Non-Aboriginal |
|---|---|---|---|
| 2001 | 8.7 | n/a | n/a |
| 2002 | 5.8 | n/a | n/a |
| 2003 | 7.0 | 14.3 | 3.3 |
| 2004 | 6.4 | 13.2 | 3.1 |
| 2005 | 5.0 | 11.4 | 1.9 |
| 2006 | 5.3 | 11.9 | 1.3 |
| 2007 | 5.7 | 12.8 | 1.9 |
| 2008 | 5.9 | 13.4 | 1.9 |
| 2009 | 6.2 | 12.7 | 2.7 |
| 2010 | 7.3 | 13.8 | 2.9 |
| 2011 | 7.3 | 14.9 | 2.6 |
| 2012 | 8.4 | 15.8 | 3.2 |
| 2013 | 8.0 | 16.0 | 3.2 |
| 2014 | 7.9 | 17.4 | 2.0 |
| 2015 | 8.3 | 16.8 | 2.2 |
Source: Statistics Canada Labour Force Survey as prepared by the NWT Bureau of Statistics.
Note: Unemployment data by ethnicity (Aboriginal and Non-Aboriginal) was not available prior to 2003.
Similar disparities can also be observed with respect to levels of education. Figure 3 illustrates the educational levels of working-age (over 15 years old) residents in NWT. Data show that 42.7% of working-age Aboriginals lack a High School diploma, compared to only 7.8% for non-Aboriginals. As well, only 4.7% of working-age Aboriginals have a university degree compared to 34.2% for non-Aboriginals.
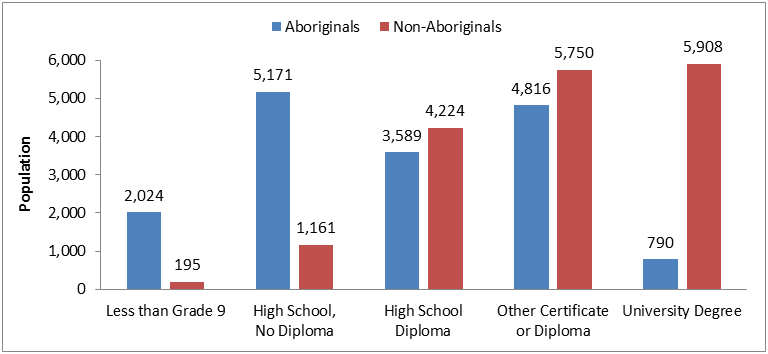
Text description of Figure 3
| Aboriginals | Non-Aboriginals | |
|---|---|---|
| Less than Grade 9 | 2,024 | 195 |
| High School, No Diploma | 5,171 | 1,161 |
| High School Diploma | 3,589 | 4,224 |
| Other Certificate or Diploma | 4,816 | 5,750 |
| University Degree | 790 | 5,908 |
Source: NWT 2014 Community Survey as prepared by the NWT Bureau of Statistics.
The NWT government partnered with the Conference Board of Canada to produce a report entitled Northwest Territories Labour Market Forecast and Needs Assessment in April 2016. The report forecasted that there will be 28,500 to 36,700 job openings in the Territory over the next 15 years. The report estimated that approximately 98% of these job openings will be to replace workers who have retired or moved, and 78% of these jobs will typically require some form of postsecondary education and/or extensive work experience.
Data presented above from the 2014 Community Survey conducted by the NWT Bureau of Statistics shows that the lack of post-secondary education particularly among the Aboriginal population will impact the economy, as it is the non-Aboriginal population who are most likely to retire and move away. As such, high levels of education and occupational skills will be critical for meeting the future needs of the labour market.
LMDA investments align with territorial government priorities
Active labour market programs aim to help unemployed or underemployed individuals find and maintain employment. They are fairly similar across the Organization for Economic Co-operation and Development countries and consist of skills training in a classroom setting, work experience with employers (often subsidized) or in the public/non-profit sector, return-to-employment assistance and self-employment assistance.
In NWT, the Department of Education, Culture, and Employment administers a range of active labour market programming targeted at various groups of individuals. Programs and services offered to active and former EI claimants are mainly funded under the LMDA.
The Department of Education, Culture, and Employment developed the Skills 4 Success 10-Year Strategic FrameworkFootnote 7 with the vision that "NWT residents have the skills, knowledge and attitudes for employment success". The Framework identifies four fundamental goals with detailed priorities designed to "develop NWT residents' skills through education and training, close education and employment gaps through streamlined supports, address recruitment and retention challenges, and provide reliable labour market data for informed decision making".
The NWT government outlined its priorities in its Mandate of the Government of the Northwest Territories 2016 to 2019Footnote 8. The document specified that "Economic development must be supported by improved and intensified skills development for the labour market, so that NWT residents can take advantage of current and future job opportunities". Detailed activities to pursue included:
- "We will get more 18 to 24 year olds into the labour market by using a better mix of improved educational attainment and skill development, while matching skills with employer needs through improved career development supports.
- We will take steps to close the skills gap using the Skills 4 Success strategic framework, and by working with Aurora College on a renewed strategic plan, refocusing support for post-secondary institutions in NWT, improving outcomes from our Community Learning Centres, strengthening the apprenticeship program, and improving our career development services."
Investments under the LMDA in 2014 to 2015 were mainly targeted toward Employment Assistance Services and Building Essential Skills with 44% and 40% of total budget respectively. As well, 864 individuals participated in Employment Assistance Services, followed by 155 in Apprenticeship training, 44 in Building Essential Skills training and 64 participated in Training-on-the-Job.
Overall, incremental impacts for Employment Assistance Services participants and gross outcomes reported in this report for Building Essential Skills, Training-on-the-Job and Self-Employment Option participants provide some indications that LMDA funded programs and services delivered in NWT are generally helping participants improve their labour market experience after participation. Some participants do not appear to be benefiting from participation and remain unemployed following participation. As such, evaluation evidence suggests that LMDA funded programs are aligned with and can contribute to achieving the vision of Skills 4 Success 10-Year Strategic Framework by ensuring that "NWT residents have the skills, knowledge and attitudes for employment success".
2.2 Building essential skills
2.2.1 Program description
Based on information submitted by the Department of Education, Culture, and Employment and supplemented with information from the Department's Internet siteFootnote 9
The Skills Development program in NWT is called Building Essential Skills. The program provides financial assistance to active and former EI claimants for training opportunities that will assist them in returning to work. Short-term financial assistance is provided with the objective of reducing participants’ dependency on EI and social/income assistance, and increasing employment or self-employment through a cost-shared approach to training. Participants are provided with financial assistance to offset training expenses and are also expected to make a minimum financial contribution toward these costs depending on their needs.
Eligible training activities can include (but are not limited to):
- Workplace essential skills.
- Employment readiness programs.
- Pre-employment training courses.
- Skill-specific training programs.
- Academic upgrading and life skills.
The program will cover only one semester of academic upgrading and life skills training, which mustlead to further skills training. Eligible training activities must be for full-time studies at an approved institution or training provider. While in training, clients can still access EI benefits. Financial assistance is available for training programs that run for 1 week to a maximum of 52 weeks, and may cover:
- Tuition/course costs.
- Books/materials and special equipment costs.
- Living expenses.
- Childcare and transportation costs.
- Special support for disability.
2.2.2 Program delivery
Based on information submitted by the Department of Education, Culture, and Employment
The program is delivered through Service Centres in six regional hubs: Inuvik, Norman Wells, Fort Simpson, Hay River, Fort Smith, and Yellowknife. Career Development Officers meet with and counsel clients to determine the most suitable program or training for them.
2.2.3 Profile of program participants
Table B1 in Appendix B presents the socio-demographic characteristics for two cohorts of active and former EI claimants who started a Building Essential Skills intervention in 2001 to 2007 and 2006 to 2008.
The majority of active claimants who started program participation in the 2001 to 2007 and 2006 to 2008 periods were male (65% and 72% respectively), and between 25 and 44 years old (62% and 63% respectively). Additionally, 34% of the 2001 to 2007 participants and 41% of the 2006 to 2008 participants self-identified as Aboriginal individuals. Participants in both cohorts most frequently held occupations requiring college or apprenticeship training in the last job they held prior to participation (38% and 46% respectively).
Similarly, former claimants who started program participation in the 2001 to 2007 and 2006 to 2008 periods were predominantly male (61% and 84% respectively), and between the age of 25 and 44 years old (72% and 61% respectively). Additionally, 44% of 2001 to 2007 participants and 55% of 2006 to 2008 participants self-identified as Aboriginal individuals. While participants in the 2001 to 2007 cohort most frequently held occupations requiring secondary or occupational training (36%), former claimants in the 2006 to 2008 cohort held most frequently occupations requiring college or apprenticeship training (45%) in the last job they held prior to participation.
2.2.4 Labour Market Outcomes
Active claimants
As shown in Table B2 in Appendix B, active EI claimants who started program participation between 2001 and 2007 earned, on average, $17,504 more annually in the five years after participation compared to the five years before participation. Figure 4 depicts the growth in average annual earnings for these participants from $16,417 in the 5th pre-program year to $41,979 in the 5th post-program year. It is noted that average earnings were not adjusted for inflation using the Consumer Price Index given the fact that the program start year varied between 2001 and 2007.
The average annual proportion of participants employed decreased from 89% to 86% from before to after participation. Possible explanations for this decrease include retirement decisions (with 4% of participants aged 55 and over), and the fact that some participants did not benefit from program participation while others simply left the labour force for various reasons.
The average annual proportions of program participants claiming EI and social assistance benefits declined by 5 percentage points each between the pre-and-post program periods, from 35% to 30% and 10% to 5% respectively. This was reflected in a small decrease of 1 percentage point in the level of dependence on income support.
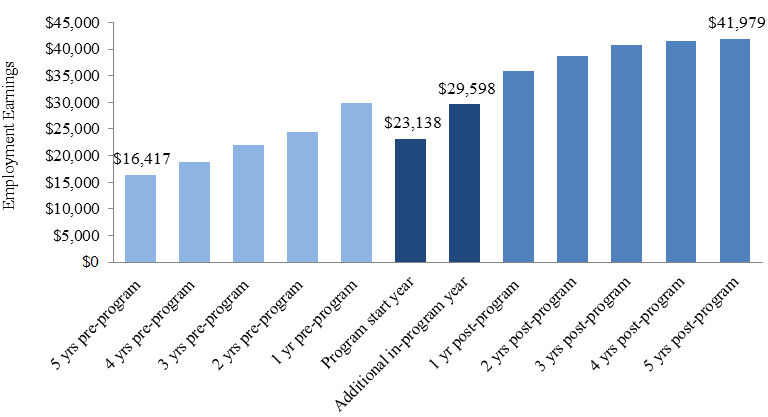
Text description of Figure 4
| Employment Earnings | |
|---|---|
| 5 yrs pre-program | $16,417 |
| 4 yrs pre-program | $18,848 |
| 3 yrs pre-program | $21,920 |
| 2 yrs pre-program | $24,500 |
| 1 yr pre-program | $29,795 |
| Program start year | $23,138 |
| Additional in-program year | $29,598 |
| 1 yr post-program | $35,969 |
| 2 yrs post-program | $38,705 |
| 3 yrs post-program | $40,757 |
| 4 yrs post-program | $41,590 |
| 5 yrs post-program | $41,979 |
Note: Average earnings include participants with zero earnings in a specific year. As well, earnings were not adjusted for inflation given the fact that the program start year varied between 2001 and 2007.
Active claimants who started Building Essential Skills participation between 2006 and 2008 followed similar outcome trends compared to the 2001 to 2007 participants. They experienced increase in average annual earnings ($19,756), decrease in the proportion of participants employed (5 percentage points) and decrease in the average annual proportion of participants claiming EI (5 percentage points) between the pre- and post-program periods. Possible explanations for the decrease in the proportion of participants employed include retirement decisions (with 3% of participants aged 55 and over), and the fact that some participants did not benefit from program participation while others simply left the labour force for various reasons.
There was, however, a slight increase of the average annual proportion of program participants on social assistance (2 percentage points). The average annual dependence on income support did not change between the pre-and-post program periods.
Labour market outcomes for sub-groups of interest were as follows:
- Youth (under 30 years old) who started program participation between 2001 and 2007 experienced a large increase in the average annual earningsFootnote 10 ($28,709) from before to after participation. They also experienced slight increases in the proportion employed and claiming EI (1 percentage point each). Furthermore, the average annual proportion of youth claiming social assistance decreased by 4 percentage points. This was reflected in a small decrease of 1 percentage point in the dependence on income support.
- Long-tenured workers who started program participation between 2007 and 2009 had higher earnings on average ($12,188) in the 3 years following participation compared to the 5 years prior. The average annual proportion of participants claiming EI decreased by 6 percentage points, but so did the proportion of participants employed (8 percentage points). As well, social assistance use and dependence on income support increased, on average, from before to after participation (4 percentage points each). Possible explanations for the decrease in the proportion of participants employed include retirement decisions (with 7% of participants aged 55 and over), and the fact that some participants did not benefit from program participation while others simply left the labour force for various reasons. It is noted that Long-tenured workers were by definition employed in the 5 years pre-program participation.
Former claimants
As shown in Table B3 in Appendix B and illustrated in Figure 5, average annual earnings for former EI claimants who started program participation in 2001 to 2007 did not follow a steady growth path over the pre- and post-participation periods. Overall, average annual earnings of former claimants were $7,346 higher after participation compared to their annual average over the five years before participation.
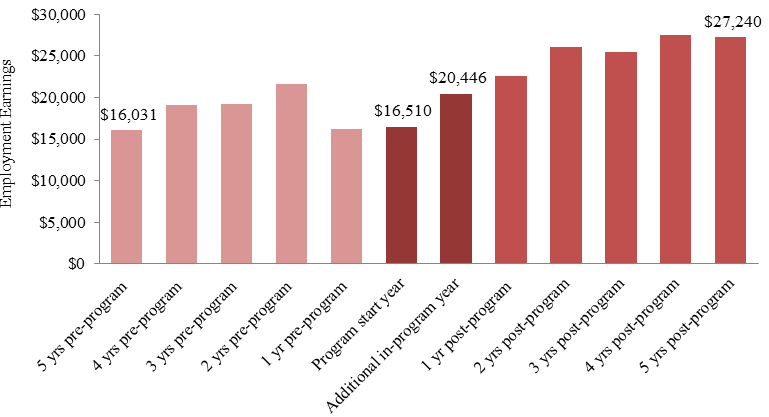
Text description of Figure 5
| Employment Earnings | |
|---|---|
| 5 yrs pre-program | $16,031 |
| 4 yrs pre-program | $19,088 |
| 3 yrs pre-program | $19,257 |
| 2 yrs pre-program | $21,577 |
| 1 yr pre-program | $16,249 |
| Program start year | $16,510 |
| Additional in-program year | $20,446 |
| 1 yr post-program | $22,609 |
| 2 yrs post-program | $26,065 |
| 3 yrs post-program | $25,514 |
| 4 yrs post-program | $27,509 |
| 5 yrs post-program | $27,240 |
Note: Average earnings include participants with zero earnings in a specific year. As well, earnings were not adjusted for inflation given the fact that the program start year varied between 2001 and 2007.
While the average proportion of former claimants who claimed EI decreased from 42% to 24% between the pre- and post-participation periods (18 percentage points decrease), the average annual proportion of participants employed decreased by 12 percentage points between the same periods. As well, the average annual proportion of participants who collected social assistance increased by 2 percentage points and the level of dependence on income support did not change. Possible explanations for the decrease in the proportion of participants employed include retirement decisions (with 7% of participants aged 55 and over), and the fact that some participants did not benefit from program participation while others simply left the labour force for various reasons.
Former claimants who started program participation between 2006 and 2008 followed similar outcome trends compared to the 2001 to 2007 participants. Their average annual earnings were $14,768 higher after participation compared to their annual average earnings over the five years before participation. They also experienced decreases (6 percentage points) in the proportion of participants employed and in the average annual proportion of participants claiming EI (5 percentage points). The average annual proportion of former claimants who collected social assistance increased by 7 percentage points and the level of dependence on government income support increased by 3 percentage points. Possible explanations for the decrease in the proportion of participants employed include retirement decisions (with 10% of participants aged 55 and over), and the fact that some participants did not benefit from program participation while others simply left the labour force for various reasons.
2.2.5 Challenges and Lessons Learned about Program Design and Delivery
Based on a document review and 53 key informant interviews in 9 provinces and territories (P/Ts) completed in summer 2015
Managers and caseworkers from 9 P/Ts involved in the delivery of Skills Development were interviewed during the summer of 2015. These interviews, in addition to document reviews, provided insight into the challenges and lessons learned related to program design and delivery. National-level qualitative findings are included in this report with the perspective of sharing lessons learned and best practices with NWT. Challenged related to program delivery included:
- Geographic locations and remoteness pose barriers to accessing training due to factors such as lack of training options in certain areas or lack of transportation (9 P/Ts).
- Caseworkers need extra time and resources to case manage participants with multiple barriers to employment (8 P/Ts). As well, they may not be fully equipped to assist participants who face significant challenges or mental health issues (3 P/Ts).
- The lack of essential skills (5 P/Ts), learning disabilities and literacy issues (3 P/Ts) are barriers to accessing and completing training. Individuals lacking the pre-requisite skills needed to succeed in occupational-specific training may drop out of more advanced training.
- Some participants face financial constraints during the application process or the waiting period prior to the start of training and this may cause some to drop out (4 P/Ts).
- There is a lack of awareness about the program (4 P/Ts) by potential participants.
Key informants provided some best practices and lessons learned, including:
- Requesting prospective participants to undertake labour market research and interviews with employers and training institutions helps them to take ownership of their return-to-work process and to make an informed decision about training (8 P/Ts)
- Regular coordination and communication among caseworkers, training providers and other stakeholders are important (7 P/Ts)
- Financial assistance to cover child care expenses (7 P/Ts), living allowance (4 P/Ts), transportation and tuition (3 P/Ts) can be increased to improve access/completion of training
- Flexible/multi-stage training plans that consider life and essential skills along with occupational training is beneficial for those with multiple barriers to employment (6 P/Ts)
- Regular monitoring of participants during and after training is beneficial particularly for individuals with multiple barriers to employment. It allows for the identification of additional supports that can be offered if participants encounter challenges while in training (6 P/Ts)
- Conducting more learning disability and skills assessments at the outset of participation allows for the identification of supports needed by participants to succeed in training (4 P/Ts)
- Extending financial assistance beyond the training period would help participants while they undertake job search (4 P/Ts)
2.3 Building essential skills - Apprenticeship
2.3.1 Program description and delivery
Based on information submitted by the Department of Education, Culture, and Employment and supplemented with information from the Department’s Internet site
The Skills Development - Apprentices program in NWT is called Building Essential Skills – Apprenticeship. The program description and delivery approach are identical to those of the Building Essential Skills program presented in Section 2.2. Participants are provided with financial assistance to offset expenses related to apprenticeship training and are also expected to make a minimum financial contribution toward these costs depending on their needs.
As of March 31, 2016, data from the NWT Client Management and Administration System shows that there were 391 registered apprentices in NWT working for 80 employers. The EI Monitoring and Assessment Reports specified that there were 155 new apprenticeship interventions in 2014 to 2015, 181 in 2013 to 2014 and 122 in 2012 to 2013.
Under the second cycle for LMDA evaluation, a study on Building Essential Skills – Apprenticeship included a component to produce a profile of participants in the 2003 to 2005 and the 2013 to 2014 periods as well as labour market outcomes for the 2003 to 2005 participants. In the 2003 to 2004 and 2004 to 2005, a total of 298 interventions were recorded in the LMDA database. Another 203 interventions were recorded in 2013 to 2014. However, after the creation of Action Plan Equivalents as the unit of analysisFootnote 11 for apprentices, only 36 participants in the 2003 to 2005 period and 5 participants in 2013 to 2014 received a Building Essential Skills - Apprenticeship intervention as the main EBSM category. Data anomalies related to miscoding of interventions were identified and this contributed to reducing the number of Action Plan Equivalents for program participants.
2.3.2 Challenges and lessons learned about program design and delivery
Based on a document review and 53 key informant interviews in 10 P/Ts completed in summer 2015
Existing literature has shown that there is a fairly high non-completion rate among apprentices in Canada (40 to 50%)Footnote 12. Furthermore, subject matter literature revealed that despite the growth in apprenticeship registrations in Canada, there has not been a corresponding increase in completionsFootnote 13. Key informants from 6 P/Ts confirmed this trend.
Interviews across 10 P/Ts, in addition to document reviews, provided insight into the challenges and lessons learned related to program design and delivery. National-level qualitative findings are included in this report with the perspective of sharing lessons learned and best practices with NWT.
Key informants suggested some factors that could lead the apprentices to drop out, including:
- Financial difficulties (for example, not being able to live on EI benefits while on training) (10 P/Ts).
- Apprentices leaving the trade (7 P/Ts).
- Employers were unwilling or unable to release their apprentices for training (7 P/Ts).
- Lack of training opportunities in local communities (7 P/Ts).
- Labour market fluctuations and/or low demand for certain trades (6 P/Ts).
- Lack of or low level of essential skills (6 P/Ts).
- Delays in getting EI benefits (for example, EI eligibility is not confirmed until training is almost complete) (5 P/Ts).
Key informants also highlighted lessons learned related to program design and delivery or apprenticeship in general. These include:
- Providing more financial supports for apprentices (6 P/Ts).
- Providing essential skills training to individuals facing multiple barriers to employment prior to the technical training sessions (6 P/Ts).
- Conducting needs assessments to identify all potential barriers to training at the beginning of the apprenticeship process (4 P/Ts).
- Providing apprentices with training on how to create and maintain a budget (3 P/Ts).
2.4 Training-on-the-Job
2.4.1 Program description and delivery
Based on information submitted by the Department of Education, Culture, and Employment and supplemented with information from the Department’s Internet site
The Targeted Wage Subsidies program in NWT is called Training-on-the-Job. The program is designed to financially assist employers in training a northern workforce (particularly EI-eligible clients) to obtain the necessary skills to get and keep meaningful work. This training is intended to result in permanent employment for the trainee within that organization.
Employers must submit a detailed training plan and exhibit good standing and compliance with respect to territorial and federal employment standards and labour laws. They must provide training that meets the terms of the agreement and monitor, evaluate, and report on the trainee's progress. Employers must also provide a reasonable guarantee of employment at the end of training.
Financial assistance is only available for full-time positions (minimum 30 hours per week) that pay at least minimum wage, and employers must contribute at least 20% of the trainee's wage. In addition to the wage subsidy, financial assistance may also include course costs (tuition, materials) and special equipment (tools, clothing). Financial assistance is available for up to 52 weeks.
NWT has a specific wage subsidy program targeted to apprentices called Apprenticeship Training-on-the-Job. The program is designed to offset employer costs specifically related to training apprentices in a designated trade.
These programs are delivered through the Department of Education, Culture, and Employment Service Centres in six regional hubs: Inuvik, Norman Wells, Fort Simpson, Hay River, Fort Smith, and Yellowknife. Career Development Officers meet with and counsel clients to determine if the program is suited for them.
Data from EI Monitoring and Assessment Reports reveal that the number of participants was 77 in 2013 to 2014 and 67 in 2014 to 2015.
2.4.2 Profile of program participants
Table C1 in Appendix C presents the socio-demographic characteristics of active and former EI claimants who started an intervention between 2001 and 2007.
Active claimants who started program participation in 2001 to 2007 were mainly male (61%) and between 25 and 44 years old (64%). More than one-third (35%) of these participants self-identified as Aboriginal individuals, and just over half most frequently held occupations requiring college or apprenticeship training (52%) in the last job they held prior to participation. In the year preceding the start of their intervention, active claimants had average annual earnings of $34,941.
Former claimants who started program participation in 2001 to 2007 were mainly female (58%) and between 25 and 44 years old (61%). A greater proportion of former claimant participants were under 25 years old (16% vs 8% of active claimants). As well, 45% of former claimants self-identified as Aboriginal individuals. These participants mainly held occupations requiring secondary or occupational training (44%) in the last job they held prior to participation. Former claimants had significantly lower average earnings in their year before participation ($15,284) compared to active claimants.
The profile and outcomes of program participants in the 2006 to 2008 cohort could not be examined because the number of participants was too small to produce reliable statistics.
2.4.3 Labour market outcomes
Active claimants
As shown in Table C2 in Appendix C and illustrated in Figure 6 below, active claimants who started an intervention between 2001 and 2007 earned $4,349 less annually (on average) in the five years after participation compared to the five years before participation. Earnings data also demonstrate that individuals who managed to find and keep an employment experienced $7,575 increase in annual average earnings in the five years after participation compared to the five years before participation.
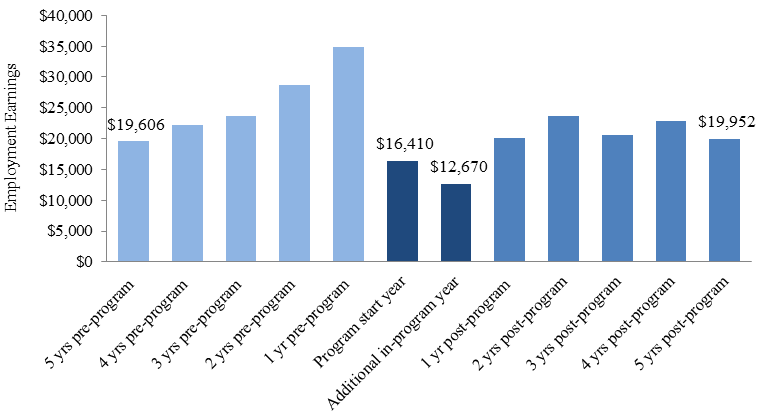
Text description of Figure 6
| Employment Earnings | |
|---|---|
| 5 yrs pre-program | $19,606 |
| 4 yrs pre-program | $22,165 |
| 3 yrs pre-program | $23,623 |
| 2 yrs pre-program | $28,753 |
| 1 yr pre-program | $34,941 |
| Program start year | $16,410 |
| Additional in-program year | $12,670 |
| 1 yr post-program | $20,152 |
| 2 yrs post-program | $23,735 |
| 3 yrs post-program | $20,573 |
| 4 yrs post-program | $22,936 |
| 5 yrs post-program | $19,952 |
Notes: Average earnings include participants with zero earnings in a specific year. As well, earnings were not adjusted for inflation given the fact that the program start year varied between 2001 and 2007.
The decrease in earnings was accompanied by a 28 percentage-point decrease in the proportion of participants employed. At 62%, the average proportion of active claimants employed is substantially lower in the post-program period compared to the pre-program period (90%). With a total of 62 program participants in the 2001 to 2007 period, the 28 percentage-point decrease in the proportion of participants employed is equivalent to 18 participants. Compared to the five years before the program period, the average annual proportion of participants claiming EI benefits decreased from 32% to 18% while average social assistance benefit use decreased from 7% to 2% over the five years post-program. Correspondingly, active claimants also exhibited a reduced dependence on income support in the 5 years observed following their program participation (from 13% to 9%).
Possible explanations for the decrease in the proportion of participants employed include retirement decisions (with 3% of participants aged 55 and over), and the fact that some participants did not benefit from program participation while others simply left the labour force for various reasons.
Former claimants
As shown in Table C3 in Appendix C and illustrated in Figure 7 below, former claimants who started an intervention between 2001 and 2007 earned $12,572 more annually (on average) in the five years after participation compared to the five years before participation.
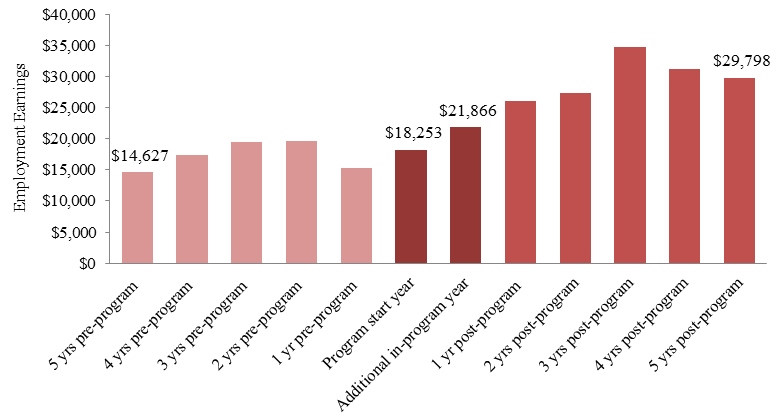
Text description of Figure 7
| Employment Earnings | |
|---|---|
| 5 yrs pre-program | $14,627 |
| 4 yrs pre-program | $17,367 |
| 3 yrs pre-program | $19,422 |
| 2 yrs pre-program | $19,589 |
| 1 yr pre-program | $15,284 |
| Program start year | $18,253 |
| Additional in-program year | $21,866 |
| 1 yr post-program | $26,090 |
| 2 yrs post-program | $27,280 |
| 3 yrs post-program | $34,725 |
| 4 yrs post-program | $31,256 |
| 5 yrs post-program | $29,798 |
Notes: Average earnings include participants with zero earnings in a specific year. As well, earnings were not adjusted for inflation given the fact that the program start year varied between 2001 and 2007.
Similar to active claimants, there was 13 percentage points decrease in the proportion of participants employed. At 79%, the average proportion of former claimants employed is lower in the post-program period compared to the pre-program period (92%). Compared to the five years before program participation, the average annual proportion of participants claiming EI benefits decreased from 43% to 22% while average use of social assistance benefits decreased from 12% to 7% over the five years post-program. Correspondingly, former claimants exhibited a reduced dependence on income support in the 5 years following their program participation (from 17% to 12%). Possible explanations for the decrease in the proportion of participants employed include retirement decisions (with 8% of participants aged 55 and over), and the fact that some participants did not benefit from program participation while others simply left the labour force for various reasons.
2.4.4 Challenges and lessons learned about program design and delivery
Based on document review and 44 key informant interviews in 8 P/Ts completed in summer 2015
Managers and caseworkers from 8 P/Ts involved in the delivery of Targeted Wage Subsidies were interviewed during the summer of 2015. These interviews, in addition to document reviews, provided insight into the challenges and lessons learned related to program design and delivery. National-level qualitative findings are included in this report with the perspective of sharing lessons learned and best practices with NWT.
In general, program participation improved the labour market attachment of participants. However, the use of the program has been falling in recent years. According to the EI Monitoring and Assessment Reports, the proportion of new interventions decreased from 3% to 1% of total EBSM interventions between 2002 to 2003 and 2014 to 2015. Key informants from 7 P/Ts confirmed the decline and identified some potential reasons for this trend:
- The reporting requirements for the employers make the subsidy less appealing (7 P/Ts).
- Employers are unaware of the program due to the lack of marketing or outreach (5 P/Ts).
- The subsidy and the self-marketing letter given to participants to promote the program create a negative perception of the quality of program candidates among employers (5 P/Ts).
- Mismatches between employers' needs and the skills of available candidates (4 P/Ts).
- Some employers hesitate to work with the government due to negative experiences (3 P/Ts).
- Local economic conditions impact on the use of the program by employers (3 P/Ts).
- The length of time to secure program approval is an issue for employers (2 P/Ts) who want the participant to start working immediately.
Key informants identified the following lessons learned related to program design and delivery:
- Matching participants' skills with employer needs in order to enhance retention (5 P/Ts).
- There is a need to increase the awareness of the program. For example, there is a need to have job developers responsible for conducting outreach with employers and matching employers and more difficult-to-employ participants (3 P/Ts).
- Have a simple, easy to use application process for employers and ensure timely approval. Using electronic systems can help reduce the processing time for employers when they have to submit monthly and quarterly updates (3 P/Ts).
- Have sufficient flexibility to adjust the program in order to meet the needs of persons with disabilities (for example level of subsidy and hours of work requirements) (3 P/Ts).
- Ongoing monitoring is important. For example, conducting regular monitoring and site visits helps to ensure that employers respect the training provisions established in the Targeted Wage Subsidies contract (3 P/Ts). As well, having ongoing contacts with employers and participants helps to resolve issues during the subsidy period (2 P/Ts).
2.5 Self-Employment Option
2.5.1 Program description and delivery
Based on information submitted by the Department of Education, Culture, and Employment and supplemented with information from the Department’s Internet site
The Self-Employment program is called Self-Employment Option in NWT. It is designed to provide EI eligible clients the opportunity to start a small business. The program requires a viable business idea, personal suitability and financial resources. Participants are expected to develop a detailed business plan with the help of a business expert assigned to them.
The program assists participants in assessing their business idea, their personal suitability, family issues, financial risks, and the resources available or required to be successful. Financial assistance may include travel costs, tuition and/or course costs, childcare costs, special equipment costs and special supports costs in the case of persons with disabilities. Participants continue to receive EI benefits throughout the program and financial assistance is available up to 52 weeks.
These programs are delivered through the Department of Education, Culture, and Employment Service Centres in six regional hubs: Inuvik, Norman Wells, Fort Simpson, Hay River, Fort Smith, and Yellowknife. Career Development Officers meet with and counsel clients to determine if the program is suited for them.
Data from EI Monitoring and Assessment Reports reveal that the number of participants was 22 in 2013 to 2014 and 14 in 2014 to 2015.
2.5.2 Profile of program participants
Table D1 in Appendix D presents the socio-demographic characteristics of active claimants who started a Self-Employment Option intervention between 2001 and 2007. Active claimants were more often male (60%) and between 25 and 44 years old (64%). Under one-fifth of these participants self-identified as Aboriginal individuals (19%).
While participants more often held occupations requiring college or apprenticeship training (35%) in the last job they held prior to participation, they also exhibited the highest frequencies of Managerial (15%) and University (15%) skills-level occupations of all EBSM participants.
The profile and outcomes of former claimants, who started program participation in 2001 to 2007, as well as all participants in the 2006-2008 period, could not be examined because the number of participants was too small to produce reliable statistics.
2.5.3 Challenges in reporting on program outcomes
Like other EBSMs, outcomes for active claimants who started Self-Employment Option participation in the 2001 to 2007 period were calculated and are reported in Table D2 in Appendix D. Results show some increase in employment/self-employment earnings and decrease in the proportion of participants employed. As well, participants decreased their use of EI and social assistance and reduced their dependence on government income support. Readers should note that the small increase in earnings may be partially explained by inflation.
Readers should be cautioned that the calculated outcomes may not provide an accurate depiction of the financial well-being of self-employed participants in the post-program period. Outcomes were calculated using individual earnings reported in the T1 and T4 taxation files from Canada Revenue Agency. According to a study from Statistics Canada, self-employed individuals in Canada have a lower average annual income than paid employees ($46,200 versus $52,400 in 2009), but the average net worth of their households is 2.7 times greater than that of the paid employee households, which indicates that some self-employed individuals may leave funds within their business for reinvestment purposesFootnote 14. Overall, this suggests that looking at individual earnings alone, without taking the net worth into consideration, may not provide a fair assessment of how well program participants are doing financially after participation.
Finally, readers should also be aware that little is currently known about the design and delivery of this program. In particular, there is a lack of understanding around the role played by this program in helping future entrepreneurs to implement viable business plans and to develop their entrepreneurship skills. Overall, it is not clear whether participant's success in improving their labour market attachment through self-employment is more closely associated with their business idea and their entrepreneurship skills or the assistance provided under the program.
2.6 Employment Assistance Services
2.6.1 Program description and delivery
Based on information submitted by the Department of Education, Culture, and Employment
Employment Assistance Services interventions aim to assist individuals to prepare for, obtain and maintain employment. In NWT, these services are delivered by career development officers through the six Service Centres located in Inuvik, Norman Wells, Fort Simpson, Hay River, Fort Smith, and Yellowknife. Services can be extended to other geographic areas and may be delivered by third party organizations or employers. Employment Assistance Services are available to all unemployed individuals in need of assistance regardless of their EI eligibility.
Data from EI Monitoring and Assessment Reports reveal that the number of participants was 973 in 2013 to 2014 and 864 in 2014 to 2015.
2.6.2 Profile of program participants
The socio-demographic profile was produced for individuals who exclusively received Employment Assistance Services without participating in other Employment Benefits.
As shown in Table E1 in Appendix E, active claimants who started an intervention between 2001 and 2007 were mainly male (62%) and this proportion was lower among the 2006 to 2008 participants with 57%. Participants in both cohorts were relatively evenly distributed across the different adult age groups, with the highest concentration of participants aged 35 to 44 (34% for the 2001 to 2007 cohort and 35% for the 2006 to 2008 cohort). They also most frequently held jobs that required either secondary or occupational training (33% for the 2001 to 2007 cohort and 31% for 2006 to 2008 cohort) or college/apprenticeship training (32% for the 2001 to 2007 cohort and 34% for the 2006 to 2008 cohort) before program participation.
Former claimants were more predominantly male (56%) for the 2001 to 2007 cohort compared to 48% for the 2006 to 2008 cohort. Both cohorts were also nearly-evenly split across adult age groups. Former claimants were slightly more concentrated in occupations that required secondary or occupational training (35% for the 2001 to 2007 cohort and 33% for the 2006 to 2008 cohort) skills in the last job they held before program participation.
Labour market barriers faced by program participants in general
Based on 81 key informant interviews completed in 10 P/Ts in summer 2013
According to key informants, the main labour market barriers faced by individuals who access Employment Assistance Services, with or without participating in Employment Benefits, include:
- Lack of work experience or skills mismatches (9 P/Ts).
- Low essential and foundational skills (8 P/Ts).
- Access and affordability of transportation (8 P/Ts).
- Access and affordability of childcare (8 P/Ts).
- Criminal records and addictions (8 P/Ts).
- Being a person with disability or having mental health issues (7 P/Ts).
- Working in temporary, seasonal or part-time employment (7 P/Ts).
- Lack of marketable skills (outdated skills, inability to network) (7 P/Ts).
- Employers' perception toward individuals in some groups (visible minorities, persons with disabilities, new immigrants, Aboriginal peoples, etc.) (7 P/Ts).
- Lack of employment opportunities, particularly in rural and remote areas (6 P/Ts).
- Language barriers (6 P/Ts).
- Low self-esteem, lack of motivation and negative attitude (6 P/Ts).
- Lack of job search/interview skills (5 P/Ts).
- Homelessness and lack of affordable housing (4 P/Ts).
2.6.3 Incremental impacts for active claimants
As shown in Table E2 in Appendix E, active claimants who started an intervention between 2001 and 2007 had incremental increases in employment earnings for a cumulative amount of $12,767 over the five years post-program period. A reminder that incremental impacts are estimated using a comparison group of active claimants who did not participate in EBSMs during the 2001 to 2007 period (see Figure 1). As well, active claimants reduced the use of EI in the post program period by a cumulative of $2,282 or 7.5 weeks. Incremental impacts on the incidence of employment, the use of social assistance and the level of dependence on government income support were overall not statistically significant.
Employment Assistance Services interventions are relatively modest activities such as counselling, job search assistance and case management focused on assisting participants to return to work. By themselves, they are not expected to lead to substantial incremental impacts on participants. In NWT, these interventions are leading to an increase in employment earnings and a decline in EI use. While incremental impacts on the incidence of employment are not statistically significant, labour market outcomes indicate a decrease of 6 percentage points in the proportion of employed participants in the post-program period. Possible explanations for the decrease in the proportion of participants employed include retirement decisions (with 10% of participants aged 55 and over), and the fact that some participants did not benefit from program participation while others simply left the labour force for various reasons.
2.6.4 Cost-benefit analysis for active claimants
Six years after participation, the benefits from Employment Assistance Services interventions from the society perspective exceeded the cost by $10,568 (as shown in Table E3 in Appendix E). It took 3.3 years after the end of participation to recover the costs.
2.6.5 Labour market outcomes
Labour market outcomes are different and not comparable to incremental impacts
As explained in Section 1.2, labour market outcomes provide descriptive statistics on the labour market experience of participants before, during and after participation. For example, it shows the average annual earnings of participants before, during and after participation, and presents what changes were observed from before to after participation. For Employment Assistance Services, the analysis was conducted over a period of 9 to 12 years (five years before participation, one year during participation, and three or five years after participation depending on the reference period used).
The outcome analysis provides an assessment of how the labour market situation of participants evolved over time, but does not permit inference regarding the extent to which those changes were due to program participation. For example, increases in employment earnings over the period examined could be partly due to inflation or normal wage increases.
When the number of participants was sufficient, outcomes were examined for active and former EI claimants who were youth (under 30 years old), older workers (55 years old and over) and long-tenured workers. Long-tenured workers refer to individuals who had long-term attachment to the labour market but not necessarily a long tenure with the same employer.
Active claimants
Table E4 in Appendix E presents the labour market outcomes for active claimants who started an intervention in the 2001 to 2007 and the 2006 to 2008 periods. Outcomes were also produced for youth (under 30 years old) and older workers (55 years old and over) who participated in the program in the 2001 to 2007 period. As well, labour market outcomes were produced for long tenured workers who started an intervention in the 2007 to 2009 period. These outcomes are included in Appendix E but not discussed in the report given the availability of incremental impacts presented in Section 2.6.3.
Former claimants
As shown in Table E5 in Appendix E, and illustrated below in Figure 8 below, average annual earnings of former claimants who started an intervention in the 2001 to 2007 period did not increase steadily over time across the pre-and-post participation periods. However, earnings grew or held steady across the in-and-post program periods, from $14,593 in the program start year to $22,274 in the 5th year post-program. Overall, average annual employment earnings of former claimants were $2,745 higher after participation compared to the annual average five years before participation.
While the average proportion of former claimants in receipt of EI benefits decreased by 17 percentage points (from 40% to 23%) between the pre-and-post participation periods, the average proportion of claimants employed also declined by 10 percentage points between the same periods. The proportion of former claimants on social assistance increased slightly (by 2 percentage points) and dependence on income support decreased slightly (by 1 percentage point), on average, over the five years after participation. Possible explanations for the decrease in the proportion of participants employed include retirement decisions (with 8% of participants aged 55 and over), and the fact that some participants did not benefit from program participation while others simply left the labour force for various reasons.
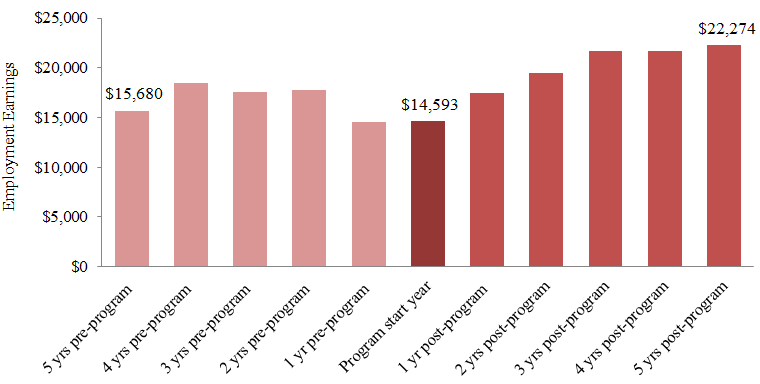
Text description of Figure 8
| Employment Earnings | |
|---|---|
| 5 yrs pre-program | $15,680 |
| 4 yrs pre-program | $18,458 |
| 3 yrs pre-program | $17,540 |
| 2 yrs pre-program | $17,745 |
| 1 yr pre-program | $14,502 |
| Program start year | $14,593 |
| 1 yr post-program | $17,421 |
| 2 yrs post-program | $19,460 |
| 3 yrs post-program | $21,717 |
| 4 yrs post-program | $21,718 |
| 5 yrs post-program | $22,274 |
Notes: Average earnings include participants with zero earnings in a specific year. As well, earnings were not adjusted for inflation given the fact that the program start year varied between 2001 and 2007.
Former claimants who started an intervention between 2006 and 2008 also experienced an increase in earnings ($5,665), and decreases in EI use (18 percentage points) and the proportion employed (4 percentage points) between the averaged pre-and-post program periods. However, they experienced a greater increase in social assistance use (15 percentage points) compared to the 2001 to 2007 participants, as well as an increase in their dependence on government income support by 5 percentage points. Possible explanations for the decrease in the proportion of participants employed include retirement decisions (with 9% of participants aged 55 and over), and the fact that some participants did not benefit from program participation while others simply left the labour force for various reasons.
Labour market outcomes for sub-groups of interest were as follows:
- Youth who started an intervention between 2001 and 2007 experienced an increase in their average annual earnings ($7,908) and a decrease in the proportion employed (4 percentage points) from before to after participation. The average proportion on EI also decreased by 7 percentage points, while the proportion on social assistance and dependence on income support showed negligible change.
- Older workers who started an intervention between 2001 and 2007 experienced a decrease in their average annual earnings ($7,843), as well as large decreases in EI use (35 percentage points) and in the proportion employed (31 percentage points from before to after participation). The average annual proportions of older workers on social assistance benefits increased by 3 percentage points, while dependence on income support decreased by 4 percentage points.
- Long-tenured workers who started an intervention in the 2007 to 2009 period experienced a decrease in their average annual earnings ($1,427) and a decrease in the proportion employed (6 percentage points) from before to after participation. The average proportion on EI also decreased by 17 percentage points. Social assistance use and dependence on income support increased, on average, from before to after participation (16 percentage points and 6 percentage points respectively). These outcomes should be interpreted with caution given the small number of long-tenured workers participants (47).
2.6.6 Challenges and lessons learned about program design and delivery
Based on a document review and 81 key informant interviews in 10 P/Ts completed in summer 2013
Managers and caseworkers from 10 P/Ts involved in the delivery of Employment Assistance Services were interviewed during the summer of 2013. These interviews, in addition to document reviews, provided insight into the challenges and lessons learned related to program design and delivery. National-level qualitative findings are included in this report with the perspective of sharing lessons learned and best practices with NWT.
Key informants identified the following challenges related to program design and delivery:
- Participants in some regions face issues with limited access to services, mobility and transportation (7 P/Ts).
- There is a lack of awareness about Employment Assistance Services among potential participants (6 P/Ts).
- The current budget allocation is not enough to support the delivery of Employment Assistance Services. This led some service providers to eliminate services and reduce the number of participants served (5 P/Ts).
- Service providers cannot necessarily provide all the services required by participants facing multiple barriers to employment. They have to refer these individuals to other organizations and sometimes, one individual can be referred to more than one organization. This may lead some participants to give up on their return-to-work process (5 P/Ts).
- The current performance measurement strategy does not capture the various outcomes achieved over time when assisting people with multiple barriers to employment (3 P/Ts).
- Service providers have difficulties in hiring skilled and knowledgeable staff (2 P/Ts). As well, some service providers have a high turn-over of staff and staff training is very costly (2 P/Ts).
- Service providers lack capacity to follow up with each participant in order to provide job maintenance support (2 P/Ts).
Key informants also provided examples of best practices and lessons leared with respect to program design and delivery. These include:
- It is important to case manage participants and to provide a client-centered holistic approach through counselling, motivation, building self-esteem and assisting them in choosing a career path (9 P/Ts).
- It is important for service providers to be engaged in their community and well connected to other service providers (for information sharing and referral purposes), particularly for those dealing with persons with disabilities and mental health issues. As well, partnerships and ongoing communication with employers can facilitate the labour market integration of participants through job placements and subsidy) (8 P/Ts).
- Since participants with multiple barriers to employment often require more intensive interventions, it is important to conduct a strong needs assessment in order to make the best training decision (7 P/Ts).
- Having a one-stop shop for services and streamlining services (co-location, no wrong-door approach, offering a comprehensive suite of services from self-serve to workshops, employability assessment, career orientation, need determination and ongoing case management), as well as removing barriers to access and participation (7 P/Ts).
- It is important to keep a long-term perspective when assisting participants facing multiple barriers to employment (6 P/Ts).
- Providing long-term follow-up with participants for employment retention support is seen as a best practice (6 P/Ts).
- Giving service providers increased flexibility when assisting participants with multiple barriers to employment, particularly in terms of the length of services and the type of financial support that can be made available to participants (6 P/Ts).
- It is important for service providers to have dedicated workers, specialized teams to deal with participants facing multiple barriers to employment, and job coaches/developers that are dedicated and committed to support these participants (6 P/Ts).
- Service providers need to make appropriate referrals, when available, to specialized community organizations for program participants dealing with disabilities, mental health issues, addictions and criminal records (5 P/Ts).
- Providing participants with help to contact employers (for example assistance in handing out resumes) and networking opportunities (5 P/Ts).
- Providing participants with an opportunity to try and test prospective jobs (5 P/Ts).
- It is important for provincial/territorial governments to have strong partnerships with third-party service providers and employers in order to be able to mobilize the service delivery network in cases of emerging labour market challenges (major lay-offs, downturn, etc.) and to organize job fairs and joint group workshops (5 P/Ts).
- There is a need to enhance the promotion of programs and services (5 P/Ts).
- There is a need to provide services in an innovative way depending on local needs and reality (for example online resources and training) (3 P/Ts).
- There is a need to change the way success is measured under the program. For example, the progress of a participant with multiple barriers to employment should be measured through small steps from securing adequate housing to dealing with addictions, improving life skills and integrating into the labour market (3 P/Ts).
- Service providers need additional resources in order to maintain the level and quality of services and to train staff, particularly those operating in rural areas (3 P/Ts).
3. Comparison of key findings by program type
This section provides an overview of the key findings from the incremental impact analysis, cost-benefit analysis, and labour market outcome analyses for Building Essential Skills, Training-on-the-Job, and Employment Assistance Services for active and former EI claimant participants who started participation in the 2001 to 2007 period.
Overall, incremental impacts, cost-benefit analysis, and labour market outcomes provide some indications that LMDA-funded programs and services delivered in NWT are generally helping participants to improve their labour market attachment after participation.
With some exceptions, the labour market outcomes demonstrate that participants in LMDA programs and services showed higher average earnings and lower average proportions on EI and social assistance during the five years after program participation when compared to five years prior. Incremental impacts demonstrate that active EI claimants who participated in Employment Assistance Services had gains in earnings and reductions in EI use compared to similar non-participants after program participation, and the social benefits of participation exceeded the cost of the intervention over time.
Some participants do not appear to be benefiting from EBSM participation, as reflected in the general decrease in the proportion of participants employed between the pre- and post-participation periods. Additional explanations for this decrease may include retirement decisions and other reasons for leaving the labour force.
3.1 Incremental impacts and cost bets analysis
Employment Assistance Services are effective at improving earnings and reducing EI use among active EI claimant participants
In comparison to similar EI claimants who did not participate in the program, active EI claimants who participated exclusively in Employment Assistance Services had higher earnings from employment/self-employment over the five years post-program participation (cumulative of $12,767). As well, these participants reduced their use of EI by a cumulative of $2,282 or 7.5 weeks after program participation. Incremental impacts on the incidence of employment, the use of social assistance and the level of dependence on government income support were overall not statistically significant. From the social perspective (that is the sum of participant and government costs or benefits), the benefits of participation in Employment Assistance Services exceeded the related costs in 3.3 years after participation.
3.2 Labour market outcomes
Most program participants have higher average earnings after program participation
As shown in Figure 9, active and former EI claimants who participated in Building Essential Skills showed higher average employment earnings during the five years after their participation when compared to five years prior. As well, former claimants who participated in Training-on-the-Job and Employment Assistance Services also showed higher average employment earnings after program participation when compared to average earnings in the five years before participation. Active claimants who participated in Training-on-the-Job had lower average employment earnings during the five years after their participation. Considering the small number of participants in Training-on-the-Job, the figures should be interpreted with caution.
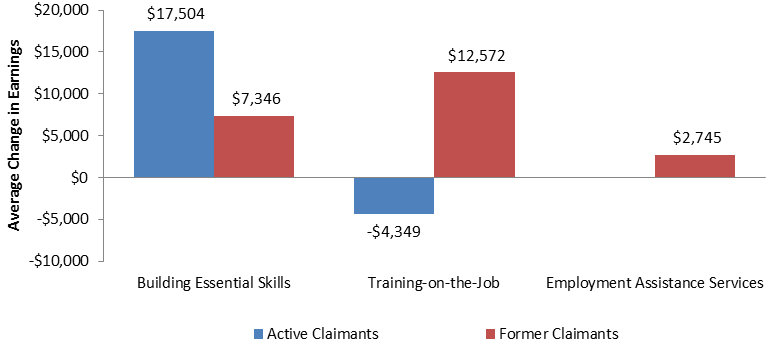
Text description of Figure 9
| Average Change in Earnings | ||
|---|---|---|
| Active Claimants | Former Claimants | |
| Building Essential Skills | $17,504 | $7,346 |
| Training-on-the-Job | -$4,349 | $12,572 |
| Employment Assistance Services | n/a | $2,745 |
Note: outcomes for participants in Training-on-the-Job should be interpreted with caution given the small number of participants (62 for active claimants and 64 for former claimants).
The average proportion of participants on Employment Insurance and social assistance is generally lower after program participation
As shown in Figures 10 and 11, the average proportion of participants who use EI is shown to be lower in the post-participation period for active and former EI claimants who participated in Building Essential Skills and Training-on-the-Job. As well, the average proportion of former claimants who use EI is also shown to be lower in the five years after program participation for those who participated in Employment Assistance Services (when compared to five years prior). These decreases were accompanied by decreased proportions of participants on social assistance for all active claimant participants and for former claimants who participated in Training-on-the-Job.
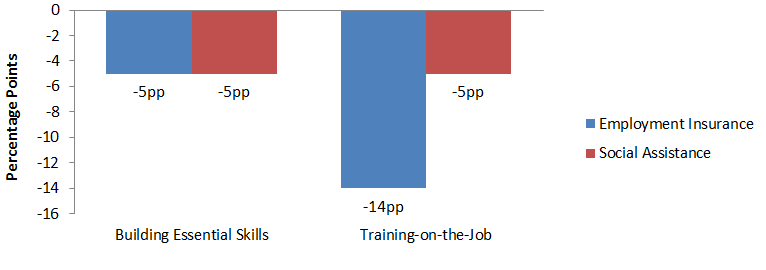
Text description of Figure 10
| Percentage Points | ||
|---|---|---|
| Employment Insurance | Social Assistance | |
| Building Essential Skills | -5 | -5 |
| Training-on-the-Job | -14 | -5 |
Note: outcomes for participants in Training-on-the-Job should be interpreted with caution given the small number of participants (62 for active claimants and 64 for former claimants).
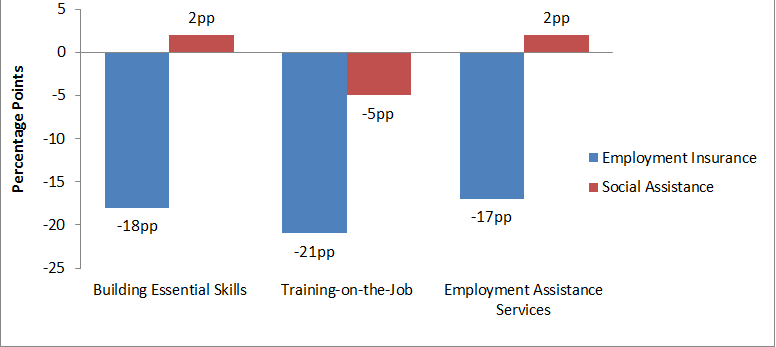
Text description of Figure 11
| Percentage Points | ||
|---|---|---|
| Employment Insurance | Social Assistance | |
| Building Essential Skills | -18 | 2 |
| Training-on-the-Job | -21 | -5 |
| Employment Assistance Services | -17 | 2 |
Note: outcomes for participants in Training-on-the-Job should be interpreted with caution given the small number of participants (62 for active claimants and 64 for former claimants).
The average proportion of participants employed is lower after program participation when compared to before program participation for all EBSMs
Some participants do not appear to be benefiting from EBSM participation, as reflected in the general decrease in the proportion of participants employed between the pre- and post-participation periods (see Figure 12). This decrease can be partially explained by retirement decisions considering the proportion of participants aged 55 years and older, while others may have left the labour force for other reasons.
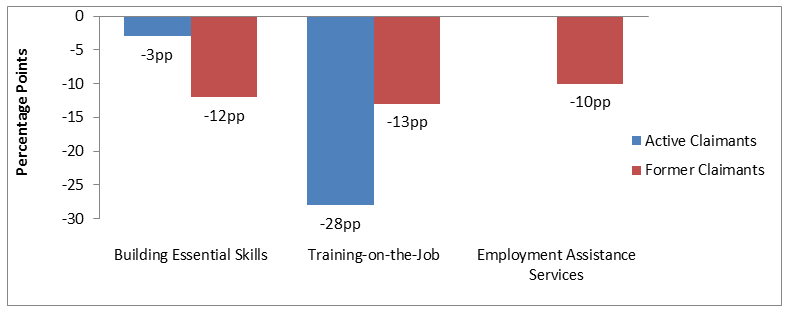
Text description of Figure 12
| Percentage Points | ||
| Active Claimants | Former Claimants | |
| Building Essential Skills | -3 | -12 |
| Training-on-the-Job | -28 | -13 |
| Employment Assistance Services | n/a | -10 |
Note: outcomes for participants in Training-on-the-Job should be interpreted with caution given the small number of participants (62 for active claimants and 64 for former claimants).
4. Conclusions
Overall, incremental impacts, cost-benefit analysis, and labour market outcomes provide some indications that LMDA-funded programs and services delivered in NWT are generally helping participants to improve their labour market attachment after participation. As such, evaluation evidence suggests that LMDA-funded programs are aligned with and can contribute to achieving the vision of Skills 4 Success 10-Year Strategic Framework by ensuring that "NWT residents have the skills, knowledge and attitudes for employment success"
With some exceptions, the labour market outcomes demonstrate that participants in LMDA programs and services showed higher average earnings and lower average proportions on EI and social assistance during the five years after program participation when compared to five years prior. Incremental impacts demonstrate that active EI claimants who participated in Employment Assistance Services had gains in earnings and reductions in EI use compared to similar non-participants after program participation, and the social benefits of participation exceeded the cost of the intervention over time.
Some participants do not appear to be benefiting from EBSM participation, as reflected in the general decrease in the proportion of participants employed between the pre- and post-participation periods. Additional explanations for this decrease may include retirement decisions and other reasons for leaving the labour force.
Key informants interviews with service providers and program managers, as well as the documents reviewed and the questionnaires filled by P/T representatives, revealed specific challenges and lessons learned about program design and delivery at the national level. Though NWT did not participate in these qualitative studies, the information that was produced at the national level is included in this report with the objective of sharing best practices and lessons learned.
Skills Development (Building Essential Skills)
Key informants confirmed that most P/Ts take steps to direct Skills Development funding towards training for occupations in demand in the labour market. In particular, as part of the application process, prospective participants have to justify their choice of training program by demonstrating that labour market demand exists. Five provinces/territories may not approve applications for training leading to employment in low demand occupations.
According to key informants, the main challenges related to Skills Development included:
- Lack of capacity to case manage and monitor individuals facing multiple barriers to employment.
- Access to the program is limited due to the EI eligibility criteria.
- Participant's ability to access and complete training is often limited by a lack of essential skills, learning disabilities, literacy issues and other factors such as living in remote locations and lack of transportation.
- Unemployed individuals lack awareness about the program and early engagement of EI claimants is difficult since Service Canada does not refer recent claimants to P/T offices.
Skills Development – Apprentices (Building Essential Skills – Apprenticeship)
- Existing Canadian literature showed that there is a fairly high non-completion rate among apprentices (40 to 50%)Footnote 15. Furthermore, subject matter literature revealed that despite the growth in apprenticeship registrations in Canada, there has not been a corresponding increase in completion ratesFootnote 16. While it is not possible with available data to generate a reliable estimation of the completion rate of Skills Development-Apprentices participants, key informants involved in apprenticeship delivery confirmed the stagnation in completion rates.
- According to key informants, apprenticeship drop-out is due to factors such as low level of essential skills, financial difficulties (for example not being able to live on EI benefits while on training) and delays in getting EI benefits (for example EI eligibility is not confirmed until training is almost complete).
Targeted Wage Subsidies (Training-on-the-Job)
Key informants confirmed that participation in Targeted Wage Subsidies can be driven by either unemployed individuals or employers looking to fill a new position. Key informants also confirmed that in most P/Ts covered by the evaluation, the subsidized employers are generally hiring those they would not have otherwise hired without the help of the program.
While evaluation results have demonstrated the effectiveness of Targeted Wage Subsidies, its use has been falling in recent years. According to the EI Monitoring and Assessment Reports, the proportion of new Targeted Wage Subsidies interventions across Canada decreased from 3% to 1% of all new interventions between 2002 to 2003 and 2014 to 2015. Reasons identified by key informants to explain this decline included:
- The frequent and time consuming reporting requirements for the employers.
- Lack of awareness about the program among employers.
- Employers having a negative perception of the quality of the candidates.
- Difficulty in matching employers' needs to the skills of available candidates.
Employment Assistance Services
According to key informants, challenges with the design and delivery of Employment Assistance Services included:
- Lack of awareness about Employment Assistance Services among potential participants.
- Current budget allocation is not enough to support the delivery of Employment Assistance Services and has led some service providers to eliminate services.
- Service providers cannot provide all the services needed for participants facing multiple barriers to employment. They have to refer these individuals to other organizations.
5. Recommendations
Recommendations that emerge from the evaluation findings presented in this report are as follows:
The report presents challenges and lessons learned about the design and delivery of Building Essential Skills (including the apprenticeship program), Training-on-the-Job and Employment Assistance Services. These challenges and lessons learned were gathered from EBSM managers and case workers across eight to ten provinces and territories. NWT did not participate in those studies and qualitative information was not collected in NWT.
Recommendation 1: Consideration should be given by NWT to examine to what extent challenges and lessons learned identified at the national level are applicable to the unique context in NWT.
Recommendation 2: Taking into consideration the future labour market needs in NWT and the existing skills gaps, consideration should be given by NWT to examine the extent to which the caps on the length of financial assistance under Building Essential Skills are appropriate.
A study carried out across Canada regarding the timing of participation in Employment Assistance Services showed that receiving assistance early after starting an EI claim can lead to better labour market impacts.
Recommendation 3: Consideration should be given by NWT to request timely access to data on new EI recipients for targeting purposes, especially if awareness about Employment Assistance Services is also an issue in the territory.
As detailed in section 2.1 of this report, Aboriginal peoples represent 50% of the population in NWT and they are mainly located outside Yellowknife, the main urban centre. Labour market statistics demonstrate that Aboriginal peoples in NWT experience significantly higher unemployment rates and lower levels of education compared to non-Aboriginals. Furthermore, a report entitled Northwest Territories Labour Market Forecast and Needs Assessment completed in 2016 forecasted that there will be 28,500 to 36,700 job openings in the Territory over the next 15 years. The report estimated that approximately 98% of these job openings will be to replace workers who have retired or moved (mainly non-Aboriginals), and 78% of these jobs will typically require some form of postsecondary education and/or extensive work experience. The report also specified that high levels of education and occupational skills will be critical for meeting the future needs of the labour market. Finally, the profile of LMDA participants between 2001 and 2008 demonstrate that the number of self-identified Aboriginal participants is well below 50% for most interventions. It is not clear from the LMDA data whether Aboriginal persons are underrepresented in EBSM and whether this is due to self-identification or missing data, or due to low EI eligibility among unemployed Aboriginal persons.
Recommendation 4: It is recommended that the self-identification of Aboriginal participants be encouraged under the LMDA in order to properly account for the efforts dedicated by NWT to upskill Aboriginal participants and to assist them in returning to work.
Recommendation 5: With only 22% of the Aboriginal population living in Yellowknife, consideration should be given to examine whether the level of service available across the 32 other communities is not a barrier to access and participation in LMDA programs and services.
Recommendation 6: With the focus on assisting Aboriginal participants with lower levels of education, consideration should be given to providing additional measures to remove barriers to accessing and completing training such as literacy/essential skills training and learning disability assessments. These measures would help individuals with multiple barriers and those distant from the labour market preparing for vocational training and eventually reintegrating the labour market. These measures should be reported separately from other Skills Development interventions given their unique objectives.
Recommendation 7: Consideration should be given to examine to what extent the level of funding (from EI or other sources) and the level of service available under the LMDA, the Canada Job Fund, the Aboriginal Skills and Employment Training Strategy and other territorial programs is coordinated and sufficient to meet the future labour market needs of NWT.
Given the small number of program participants, labour market outcomes provided some indications that participation in Training-on-the-Job in the 2001 to 2007 period is not leading to favourable labour market outcomes for active claimants in terms of earnings and employment. Some participants were not able to maintain their subsidized jobs and/or to reintegrate into the labour market. At the national level, incremental impacts show that Targeted Wage Subsidies are improving the earnings and employment of participants.
Recommendation 8: It is important to understand how the program is designed and delivered currently in NWT compared to the 2001 to 2007 period and to explore steps aiming to increase retention and use of the program given the future labour market needs in NWT.
With the exception of producing incremental impacts for the participation in Employment Assistance Services, the LMDA evaluation was only able to produce labour market outcomes for participants in other EBSMs given the small number of participants. Labour market outcomes were produced over five years and for the entire population of participants using rich data on EI claimants, EBSM participation data and Canada Revenue Agency taxation files. Some data gaps were identified in order to support future evaluation activities. For example:
- Having access to data on whether participants are members of designated groups including Aboriginal peoples, persons with disabilities and recent immigrants would be useful to inform policy development and program design.
- Having access to data on the cost of programming per participant would also provide a refined assessment of how much participation cost for active claimants as compared to former claimants.
- It is not currently possible to distinguish between different types of training funded under Skills Development (for example, literacy, essential skills, adult basic education and vocational training). These various types of training lead to very different labour market outcomes and can help explain the observed outcomes.
- Data assessment revealed the presence of a high number of interventions that are classified under the categories of miscellaneous, ambiguous or undocumented.
- Little is also known about the various types of Employment Assistance Services provided under the LMDA in NWT. These services can be very different in nature and it is possible that some may be more effective than others at helping participants return to employment. For example, having access to a computer for researching jobs on its own may yield different impacts than receiving counselling and assistance to develop a return-to-work action plan.
Recommendation 9: Improvements in the data collection process are recommended to address key program and policy questions of interest to Canada and NWT. Specifically:
- Collect data on whether participants are members of designated groups including Aboriginal peoples, persons with disabilities and recent immigrants.
- Collect data on the type of training funded under Skills Development and the type of assistance provided under Employment Assistance Services. NWT, ESDC and other provinces and territories should work together to define common categories for both EBSMs.
- Collect detailed data on the cost of EBSM interventions.
- ESDC and NWT should carry out a data assessment regarding the integrity of data uploads and the standardization process of NWT data within ESDC.
The evaluation was not able to produce with confidence labour market outcomes for the Self-Employment Option since the data used to assess impacts on earnings may not be the best source of information available to reflect the financial wellbeing of the participants. As well, little is known about the design and delivery of this program. Overall, it is not clear whether participant’s success in improving their labour market attachment through self-employment is more closely associated with their business idea and their entrepreneurship skills rather than the assistance provided under Self-Employment.
Recommendation 10: Consideration should be given to examine in more detail the design and delivery of Self-Employment Option and whether the performance indicators for this program are appropriate.
References
Canada Employment Insurance Commission. Employment Insurance Monitoring and Assessment Reports. 2003 to 2004 to 2013 to 2014.
Coe, Patrick. "Apprenticeship programme requirements and apprenticeship completion rates in Canada.” Journal of Vocational Education and Training. 2013. 65(4): 575 to 605.
Government of Northwest Territories. Mandate of the Government of the Northwest Territories, 2016 to 2019. Accessed November 4, 2016.
Government of Northwest Territories. Skills 4 Success, 4-year Action Plan 2016 to 2020. Department of Education, Culture and Employment, 2016. Accessed November 4, 2016.
Employment and Social Development Canada. Analysis of Employment Benefits and Support Measures Profile and Outcomes for the EI Claimant Category Long-Tenured Workers in Northwest Territories: Technical Report. Evaluation Directorate. March 9, 2016.
Employment and Social Development Canada. Analysis of Employment Benefits and Support Measures Profile and Outcomes for 2006 to 2008 Participants in Northwest Territories: Technical Report. Evaluation Directorate. March 3, 2015.
Employment and Social Development Canada. Cost-Benefit Analysis of Employment Benefits and Support Measures in the Northwest Territories: Technical Report. Evaluation Directorate. May 26, 2016.
Employment and Social Development Canada. Profile, Outcomes and Net Impacts of Employment Benefits and Support Measures Participants in the Northwest Territories: Technical Report. Evaluation Directorate. April 2014.
LaRochelle-Côté, Sébastien and Sharanjit Uppal, "The Financial Well-Being of the Self-Employed", Perspectives on Labour and Income, vol. 23, no. 4, Winter 2011
Red Seal. Apprenticeship Completion, Certification and Outcomes. Ottawa: Red Seal, 2014.
The Conference Board of Canada. Northwest Territories Labour Market Forecast and Needs Assessment. April 2016. Accessed November 5, 2016.
Acronyms
- EBSM
- Employment Benefits and Support Measures
- EI
- Employment Insurance
- ESDC
- Employment and Social Development Canada
- LMDA
- Labour Market Development Agreements
- NWT
- Northwest Territories
- P/T
- Province/Territory
Appendix A - Methodology
Qualitative data
Qualitative information regarding challenges and lessons learned for the participation in Building Essential Skills (BES), Building Essential Skills – Apprentices (BES-A), Training-on-the-Job (TOJ) and Employment Assistance Services (EAS) studies were collected from key informant interviews with managers and service providers across Canada and a document/ literature review. As well, questionnaires were completed by P/T representatives for the BES, BES-A and TOJ studies. Table A1 provides the number of key informants interviewed by province and territory.
Key informant interviews for the EAS study were conducted in 2013 while those for the BES, BES-A and TOJ studies were conducted in 2015.
| Number of key informant interviews | Studies | |||
|---|---|---|---|---|
| BES | BES-A | TOJ | EAS | |
| Managers | 25 | 30 | 21 | 33 |
| Service providers | 28 | 23 | 23 | 44 |
| Total number of key informants | 53 | 53 | 44 | 77 |
| Number of participating province/Territory | 10 | 10 | 9 | 9 |
Quantitative methods
All quantitative analyses were conducted using linked administrative data from EI Part I (EI claim), EI Part II (EBSM participation data) and T1 and T4 taxation files on up to 100% of participants in NWT.
The profiles, labour market outcomes, and incremental impacts for active and former claimants were examined separately for each EBSM:
- BES (excluding apprentices)
- TOJ
- Self-Employment Option
- EAS
The Job Creation Partnerships program was not covered in any study and the program was not offered in the NWT during the period observed.
Outcomes and incremental impacts were measured relative to the following indicators:
- Employment/self-employment earnings: the total earnings an individual had from paid employment and/or self-employment. (This information is available by calendar year and is obtained from T1 and T4 tax return records.)
- Incidence of employment/self-employment: the incidence of having earnings from employment and/or self-employment.
- Amount of EI benefits collected: the average amount of EI benefits received.
- Weeks in receipt of EI benefits: the average number of weeks during which EI benefits were received.
- Social Assistance benefits: the average amount of Social Assistance (SA) benefits received. (This information is available by calendar year and is obtained from T1 tax return records.)
- Dependence on income support: the ratio of participant’s income that came from EI and SA benefits (that is, EI benefits + SA benefits / (EI benefits + SA benefits + earnings from employment/self/employment)).
The outcomes of participants also included an assessment of the proportion of participants in receipt of EI and SA benefits before, during and after participation.
Outcomes and incremental impacts were analyzed for all active and former claimants, as well as the following sub-groups of participants, when the number of observations included more than 50 individuals for outcomes and 300 individuals for incremental impacts:
- Youth: individuals under 30 years old.
- Older Workers: individuals 55 years old and over.
- Long-tenured workers: individuals who have established an EI regular or fishing benefit claimants and who had paid at least 30% of the annual maximum employee EI premiums in seven of the ten years preceding their EI claim and who had collected 35 or fewer weeks of EI regular or fishing benefits in the five years preceding their claim. This definition is similar to the EI claimant category long-tenured workers introduced under Connecting Canadians with Available Jobs.
All analyses were conducted using a unit of analysis called the Action Plan Equivalent, which combines all EBSMs given to an individual within no more than six months of each other. Incremental impacts for EAS were calculated for Action Plan Equivalent that contained only EAS with no Employment Benefits.
Incremental impacts
The incremental impact analysis compared the labour market experience of participants before and after their participation with that of a comparison group. The goal was to determine the direct effect of program participation on key labour market indicators (see Figure 1).
This report presents incremental impacts only for active claimants who participated exclusively in EAS. With the exception of active claimants in BES, the number of active claimants in other intervention types as well as the number of former claimants in all EBSMs was not large enough to allow an examination of the incremental impacts (that is, there were less than 300 participants). Impacts were produced for active claimants in BES but balancing tests were not satisfied. As a consequence, the estimates were not considered to be robust enough to be presented in this report.
The incremental impacts for active claimants in EAS-only were measured relative to a comparison group of active claimants who were eligible to participate in EBSMs between April 1, 2001 and March 31, 2007 but who did not participate in any EBSM during this period. The comparison groups include individuals who may have participated in EBSMs before or after the reference period as well as individuals who never had participated in any EBSMs. Such selection criteria were used to avoid conditioning the average treatment effect on future outcomes. For former claimants, it was not possible to produce a comparison group of non-participants using the administrative data.
Participants and non-participants were matched based on a wide array of variables including age, sex, location, skill level required by the last occupation held prior to participation, reason for separation from employment, industry in which they were previously employed as well as employment earnings and use of EI and SA for each of the five years before participation. The participant and comparison groups excluded individuals who had earnings higher than $75,000 in each of the five years preceding the start of participation. These represent a small number of individuals with high earnings compared to the average. Since the analysis examines the average outcomes and impacts, the inclusion of these individuals in the participant and comparison groups would have inflated the results.
The incremental impact estimates were produced using non-experimental methods - namely propensity score matching - using the Kernel Matching method, along with Difference-in-Differences method to estimate program impacts. Alternative matching techniques (that is, Nearest Neighbour and Inverse Propensity Weighting) were also used for validation purposes.
Cost-benefit analysis
The cost-benefit analysis compared how much it cost for individuals to participate in EAS services and how much it cost the government to deliver those programs with the benefits both the participants and the government drew from those programs. The analysis was carried out from the social perspective, which combines the costs and the benefits for both the participants and the government.
Costs and benefits included in the calculations were as follows:
- Program costs included the administration cost and the direct cost of the EAS-only EBSMs. The cost was calculated at the Action Plan Equivalent level and was determined based on the average composition of the Action Plan Equivalent.
- The Marginal Social Cost of Public Funds represented the loss incurred by society when raising additional revenues such as taxes to fund government spending. The value was estimated as 20% of the program cost, sales taxes, income taxes, impacts on EI and impacts on SA paid or collected by the government.
- Employment earnings consisted of incremental impacts on participants’ earnings during and after participation. The calculation accounts for the participant’s forgone earnings during participation (that is, opportunity cost). These are based on incremental impacts for the 2001 to 2007 participants.
- Fringe benefits included benefits such as employer-paid health and life insurance as well as pension contributions. The rate used to calculate the fringe benefits was 15% of the incremental impact on earnings.
The program effects on EI and SA use, and the sale and income tax revenues were not included in the calculations since these costs and benefits cancel each other out from the social perspective by definition. For example, while EI and SA are benefits received by participants, they represent a cost for the government. However, as indicated above, these effects are accounted for in the calculation of the Marginal Social Cost of Public Funds.
When producing the results, to bring all costs and benefits to a common base and to account for inflation and interest on foregone government investment, the estimates for the second year of participation and up to the sixth year post-program were discounted by 5% per year. As well, when the benefits were still lower than the costs six years after program end, the payback period was calculated by assuming that the average benefit or cost measured over the fifth and six year post-program would persist over time (discounted at a 5% annual rate).
Strengths and limitations from the studies
Overall, the number of key informants interviewed was relatively small in some P/Ts. The key informants’ responses were representative of their own experience and their own region but it is unclear if they were fully representative of the entire province and territory.
The matching process led to the creation of comparison groups closely matched to the LMDA participants in terms of their background characteristics. Results obtained with Kernel Matching were validated with the use of two other techniques (that is, Inverse Propensity Weighting and Nearest Neighbour), increasing the level of confidence in the results. However, readers should be aware that incremental impacts may be affected by factors not captured by the matching process. For example, the motivation to seek employment was not directly measured except to the extent that it was captured in prior income and labour market attachment patterns.
This definition of long-tenured workers differs from the definition used in the literature as it does not consider the number of years the worker remained employed with the same employer.
The cost-benefit analysis was limited in the sense that it only took into account the quantifiable benefits and costs that were directly linked to EBSM delivery and participation and that could be estimated using available administrative data and the EI Monitoring and Assessment Report. The analysis did not capture “intangible”, non-pecuniary and indirect benefits. It did not consider the multiplier effect that improving participant’s income may have on the economy and did not account for the effect of EI Part II investment on sustaining a service delivery infrastructure and creating jobs among the governmental program service providers. As well, this analysis did not consider the displacement effect where participants may take away jobs that would otherwise be filled by other unemployed individuals. Finally, this analysis did not consider the possible effect of EBSMs on increasing skill prices.
Appendix B – Detailed results Building Essential Skills
| Active claimants | Former claimants | |||
|---|---|---|---|---|
| 2001 to 2007 | 2006 to 2008 | 2001 to 2007 | 2006 to 2008 | |
| Number of observations | 494 | 189 | 129 | 92 |
| Gender | ||||
| Male | 65% | 72% | 61% | 84% |
| Female | 35% | 27% | 38% | 14% |
| Age | ||||
| Under 25 | 15% | 22% | 6% | 12% |
| 25 to 34 | 33% | 37% | 39% | 33% |
| 35 to 44 | 29% | 26% | 33% | 28% |
| 45 to 54 | 20% | 12% | 13% | 14% |
| 55 and over | 4% | 3% | 7% | 10% |
| Socio-demographic group | ||||
| Aboriginal individual1 | 34% | 41% | 44% | 55% |
| Person with disability1 | 2% | 2% | 5% | 4% |
| Visible minority1 | 6% | 8% | 7% | 3% |
| Immigrant1 | 3% | 4% | 1% | 0% |
| Marital status | ||||
| Married or common-law | 45% | 48% | 36% | 41% |
| Widow / divorced or separated | 10% | 3% | 12% | 9% |
| Single | 42% | 46% | 46% | 45% |
| Missing data / Unknown | 3% | 4% | 5% | 5% |
| Skills level related to National Occupation Code associated with the last EI claim opened before program participation2 | ||||
| Managerial | 5% | 4% | 3% | 4% |
| University | 4% | 3% | 2% | 3% |
| College or apprenticeship training | 38% | 46% | 33% | 45% |
| Secondary or occupational training | 31% | 28% | 36% | 24% |
| On-the-job training | 22% | 20% | 25% | 24% |
| Key labour market indicators in the year preceding the start of participation | ||||
| Earnings | $29,795 | $31,7963 | $16,249 | $24,6343 |
| Proportion employed | 98% | 99% | 90% | 94% |
| Proportion on EI | 55% | 58% | 63% | 59% |
| Proportion on SA | 7% | 2% | 16% | 7% |
Proportions may not add up to 100% due to rounding or missing values
1Status self-reported by participants
2Skill level corresponds to the type and/or amount of training or education typically required to work in the last occupation participants had before opening the last EI claim prior to participating in EBSMs:
- -Managerial: Management occupations
- -University: Occupations usually requiring university education at the bachelor's, master's or doctorate level.
- -College or apprenticeship training: Occupations usually requiring college or vocational education or apprenticeship training such as 2 to 3 years of post-secondary education at a community college, institute of technology or CEGEP or 2 to 5 years of apprenticeship training or 3 to 4 years of secondary school and more than 2 years of on-the-job training, specialized training courses or specific work experience and/or occupations with supervisory responsibilities and occupations with significant health and safety responsibilities, such as firefighters, police officers and registered nursing assistants.
- - Secondary or occupational training: Occupations usually requiring secondary school and/or occupation-specific training such as one to four years of secondary school education or up to 2 years of on-the-job training specialized training courses or specific work experience.
- -On-the-job training: On-the-job training is usually provided for occupations (that is, short work demonstration or on-the-job training or no formal educational requirements).
3 Average earnings for all participants, including those reporting zero earnings. Earnings for 2006 to 2008 participants have been adjusted by the Consumer Price Index published by Statistics Canada, using 2002 as the base year.
| Average outcomes | Pre-program period | In-program period | Post-program period | Average annual outcomes pre-1 | Average annual outcomes post-2 | Change3 | |||||||||
|---|---|---|---|---|---|---|---|---|---|---|---|---|---|---|---|
| 5 yrs pre | 4 yrs pre | 3 yrs pre | 2 yrs pre | 1 yr pre | Program start year | 1 yr post start year | 1 yr post | 2 yrs post | 3 yrs post | 4 yrs post | 5 yrs post | ||||
| All active claimants | |||||||||||||||
| 2001 to 2007 participants (n= 494) | |||||||||||||||
| Earnings including $04 | $16,417 | $18,848 | $21,920 | $24,500 | $29,795 | $23,138 | $29,598 | $35,969 | $38,705 | $40,757 | $41,590 | $41,979 | $22,296 | $39,800 | $17,504 |
| Earnings excluding $05 | $19,303 | $22,066 | $24,295 | $26,380 | $30,474 | $25,344 | $32,710 | $40,201 | $43,954 | $48,869 | $49,929 | $52,243 | $24,503 | $47,039 | $22,536 |
| Proportion employed | 82% | 83% | 90% | 93% | 98% | 91% | 91% | 90% | 88% | 83% | 84% | 84% | 89% | 86% | -3pp |
| Proportion on EI | 25% | 24% | 32% | 41% | 55% | 98% | 62% | 40% | 34% | 32% | 25% | 22% | 35% | 30% | -5pp |
| EI benefits | $1,511 | $1,390 | $1,825 | $2,213 | $2,955 | $7,759 | $3,776 | $2,507 | $2,486 | $2,177 | $2,049 | $1,727 | $1,979 | $2,189 | $210 |
| Number of weeks on EI | 4.6 | 4.3 | 5.5 | 6.5 | 8.5 | 21.4 | 10.2 | 6.7 | 6.4 | 5.6 | 5 | 4.1 | 5.9 | 5.6 | -0.3 |
| Proportion on SA | 13% | 10% | 10% | 9% | 7% | 4% | 5% | 3% | 4% | 5% | 4% | 8% | 10% | 5% | -5pp |
| SA benefits | $382 | $345 | $363 | $272 | $182 | $117 | $127 | $160 | $187 | $217 | $261 | $338 | $309 | $233 | -$76 |
| Dependence on income support | 13% | 11% | 12% | 14% | 13% | 36% | 19% | 12% | 12% | 11% | 11% | 13% | 13% | 12% | -1pp |
| 2006 to 2008 participants (n= 189) | |||||||||||||||
| Earnings including $04 | $18,097 | $21,717 | $26,561 | $31,183 | $34,851 | $30,224 | $38,592 | $42,486 | $44,987 | $51,241 | - | - | $26,482 | $46,238 | $19,756 |
| Earnings excluding $05 | $19,288 | $22,512 | $27,029 | $31,699 | $35,040 | $32,169 | $41,525 | $45,774 | $48,279 | $56,168 | - | - | $27,114 | $50,074 | $22,960 |
| Proportion employed | 94% | 97% | 98% | 98% | 100% | 94% | 93% | 93% | 93% | 91% | - | - | 97% | 92% | -5pp |
| Proportion on EI | 32% | 27% | 31% | 41% | 58% | 99% | 56% | 39% | 34% | 28% | - | - | 38% | 33% | -5pp |
| EI benefits | $2,160 | $1,344 | $1,581 | $2,199 | $3,254 | $7,276 | $3,259 | $2,516 | $2,538 | $1,848 | - | - | $2,108 | $2,301 | $193 |
| Number of weeks on EI | 5 | 3 | 4 | 6 | 9 | 19 | 8 | 6 | 6 | 5 | - | - | 6 | 5 | -1 |
| Proportion on SA | 6% | 3% | 5% | 2% | 2% | 6% | 4% | 4% | 6% | 6% | - | - | 4% | 6% | 2pp |
| SA benefits | $156 | $83 | $101 | $30 | $63 | $164 | $83 | $173 | $294 | $293 | - | - | $87 | $253 | $166 |
| Dependence on income support | 12% | 8% | 7% | 9% | 13% | 29% | 17% | 10% | 11% | 8% | - | - | 10% | 10% | 0pp |
| Sub-groups of active claimants | |||||||||||||||
| Youth (under 30 years old) – 2001 to 2007 participants (n= 175) | |||||||||||||||
| Earnings including $04 | $10,967 | $13,201 | $16,574 | $21,357 | $28,042 | $26,743 | $34,232 | $38,886 | $43,890 | $48,459 | $51,471 | $50,979 | $18,028 | $46,737 | $28,709 |
| Earnings excluding $05 | $12,357 | $15,261 | $18,618 | $22,667 | $28,531 | $28,890 | $36,529 | $42,006 | $49,553 | $56,915 | $59,334 | $59,476 | $19,487 | $53,457 | $33,970 |
| Proportion employed | 81% | 81% | 88% | 94% | 98% | 93% | 94% | 93% | 89% | 85% | 87% | 90% | 88% | 89% | 1pp |
| Proportion on EI | 13% | 17% | 25% | 33% | 52% | 97% | 62% | 44% | 33% | 29% | 21% | 15% | 28% | 29% | 1pp |
| EI benefits | $459 | $768 | $1,009 | $1,321 | $2,393 | $6,099 | $3,217 | $2,406 | $1,976 | $1,644 | $1,502 | $986 | $1,190 | $1,703 | $513 |
| Number of weeks on EI | 1.5 | 2.6 | 3.2 | 4.2 | 7.3 | 17 | 8.8 | 6.2 | 5.1 | 4.1 | 3.6 | 2.4 | 3.8 | 4.3 | 0.5 |
| Proportion on SA | 11% | 9% | 7% | 8% | 3% | 5% | 4% | 2% | 3% | 5% | 2% | 6% | 8% | 4% | -4pp |
| SA benefits | $293 | $251 | $252 | $197 | $109 | $52 | $120 | $143 | $148 | $182 | $113 | $186 | $221 | $154 | -$67 |
| Dependence on income support | 7% | 10% | 9% | 9% | 12% | 28% | 16% | 11% | 10% | 10% | 7% | 7% | 10% | 9% | -1pp |
| Long-Tenured Workers – 2007 to 2009 participants (n= 72) | |||||||||||||||
| Earnings including $0 | $33,900 | $40,289 | $41,178 | $45,684 | $45,301 | $34,100 | $40,194 | $47,522 | $53,666 | $59,188 | - | - | $41,271 | $53,459 | $12,188 |
| Earnings excluding $04 | $33,900 | $40,289 | $41,178 | $45,684 | $45,301 | $35,103 | $43,334 | $52,048 | $57,020 | $65,208 | - | - | $41,271 | $58,092 | $16,821 |
| Proportion employed | 100% | 100% | 100% | 100% | 100% | 97% | 93% | 91% | 94% | 91% | - | - | 100% | 92% | -8pp |
| Proportion on EI | 31% | 17% | 28% | 35% | 46% | 99% | 62% | 32% | 21% | 22% | - | - | 31% | 25% | -6pp |
| EI benefits | $1,439 | $557 | $1,151 | $1,476 | $1,882 | $7,684 | $4,085 | $1,779 | $1,679 | $1,452 | - | - | $1,301 | $1,637 | $336 |
| Number of weeks on EI | 4 | 2 | 3 | 4 | 5 | 19 | 11 | 4 | 5 | 3 | - | - | 4 | 4 | 0 |
| Proportion on SA | 0% | 1% | 1% | 3% | 3% | 3% | 6% | 6% | 7% | 5% | - | - | 2% | 6% | 4pp |
| SA benefits | $0 | $24 | $54 | $46 | $57 | $97 | $239 | $357 | $464 | $401 | - | - | $36 | $407 | $371 |
| Dependence on income support | 6% | 2% | 3% | 4% | 6% | 26% | 20% | 6% | 10% | 9% | - | - | 4% | 8% | 4pp |
- 1Average annual outcome pre-: Represents the average annual outcomes over the pre-participation period
- 2Average annual outcome post-: Represents the average annual outcomes over the post-participation period
- 3Change between pre- and post-: Represents the difference between the average annual outcomes calculated over the pre-/post-participation periods.
- 4Earnings outcome for all individuals covered by the study.
- 5Earnings outcomes excluding individuals who reported no earnings in a given year.
- pp = percentage points.
| Average outcomes | Pre-program period | Program period | Post-program period | Average annual outcomes pre-1 | Average annual outcomes post-2 | Change between pre- and post-3 | |||||||||
|---|---|---|---|---|---|---|---|---|---|---|---|---|---|---|---|
| 5 yrs pre | 4 yrs pre | 3 yrs pre | 2 yrs pre | 1 yr pre | Program start year | 1 yr post start year | 1 yr post | 2 yrs post | 3 yrs post | 4 yrs post | 5 yrs post | ||||
| All former claimant | |||||||||||||||
| 2001 to 2007 participants (n=129) | |||||||||||||||
| Earnings including $04 | $16,031 | $19,088 | $19,257 | $21,577 | $16,249 | $16,510 | $20,446 | $22,609 | $26,065 | $25,514 | $27,509 | $27,240 | $18,441 | $25,787 | $7,346 |
| Earnings excluding $05 | $18,197 | $20,733 | $20,540 | $22,274 | $18,070 | $19,720 | $25,361 | $28,876 | $32,022 | $32,913 | $35,118 | $37,047 | $19,963 | $33,195 | $13,232 |
| Proportion employed | 86% | 90% | 93% | 97% | 90% | 84% | 81% | 78% | 81% | 78% | 80% | 79% | 91% | 79% | -12pp |
| Proportion on EI | 27% | 33% | 42% | 47% | 63% | 43% | 27% | 26% | 23% | 29% | 24% | 19% | 42% | 24% | -18pp |
| EI benefits | $1,469 | $1,399 | $1,859 | $2,562 | $4,126 | $1,974 | $1,956 | $1,646 | $1,604 | $2,185 | $1,375 | $1,430 | $2,283 | $1,648 | -$635 |
| Number of weeks on EI | 4.8 | 4.4 | 6.4 | 7.9 | 13.4 | 6.1 | 5.4 | 4.6 | 4.2 | 5.7 | 3.6 | 3.6 | 7.4 | 4.3 | -3.1 |
| Proportion on SA | 18% | 19% | 13% | 14% | 16% | 14% | 15% | 23% | 18% | 16% | 18% | 16% | 16% | 18% | 2pp |
| SA benefits | $632 | $550 | $354 | $364 | $537 | $537 | $656 | $1,063 | $803 | $702 | $903 | $1,094 | $487 | $913 | $426 |
| Dependence on income support | 16% | 15% | 14% | 15% | 31% | 21% | 16% | 22% | 16% | 19% | 15% | 16% | 18% | 18% | 0pp |
| 2006 to 2008 participants (n=92) | |||||||||||||||
| Earnings including $04 | $20,506 | $21,485 | $25,101 | $29,638 | $27,001 | $31,837 | $35,225 | $36,494 | $39,515 | $42,533 | - | - | $24,746 | $39,514 | $14,768 |
| Earnings excluding $05 | $20,753 | $22,003 | $25,383 | $30,305 | $28,589 | $32,961 | $38,269 | $40,189 | $42,516 | $45,446 | - | - | $25,406 | $42,717 | $17,311 |
| Proportion employed | 99% | 98% | 99% | 98% | 94% | 97% | 92% | 91% | 93% | 94% | - | - | 98% | 92% | -6pp |
| Proportion on EI | 23% | 29% | 40% | 55% | 59% | 52% | 49% | 44% | 33% | 32% | - | - | 41% | 36% | -5pp |
| EI benefits | $1,158 | $1,518 | $2,305 | $3,665 | $4,078 | $2,149 | $3,232 | $3,231 | $2,456 | $3,012 | - | - | $2,545 | $2,900 | $355 |
| Number of weeks on EI | 3 | 5 | 7 | 10 | 11 | 5 | 8 | 7 | 6 | 6 | - | - | 7 | 6 | -1 |
| Proportion on SA | 7% | 9% | 2% | 4% | 7% | 6% | 10% | 13% | 14% | 12% | - | - | 6% | 13% | 7pp |
| SA benefits | $151 | $82 | $57 | $38 | $81 | $139 | $349 | $443 | $746 | $324 | - | - | $82 | $504 | $422 |
| Dependence on income support | 6% | 7% | 10% | 14% | 19% | 11% | 13% | 18% | 11% | 13% | - | - | 11% | 14% | 3pp |
- 1Average annual outcome pre-: Represents the average annual outcomes over the pre-participation period
- 2Average annual outcome post-: Represents the average annual outcomes over the post-participation period
- 3Change between pre- and post-: Represents the difference between the average annual outcomes calculated over the pre-/post-participation periods
- 4Earnings outcome for all individuals covered by the study.
- 5Earnings outcomes excluding individuals who reported no earnings in a given year.
- pp = percentage points.
Appendix C – Detailed results Training-on-the-Job
| Active claimants | Former claimants | |
|---|---|---|
| 2001 to 2007 | 2001 to 2007 | |
| Number of observations | 62 | 64 |
| Gender | ||
| Male | 61% | 42% |
| Female | 39% | 58% |
| Age | ||
| Under 25 | 8% | 16% |
| 25 to 34 | 29% | 25% |
| 35 to 44 | 35% | 36% |
| 45 to 54 | 24% | 16% |
| 55 and over | 3% | 8% |
| Socio-demographic group | ||
| Aboriginal individual1 | 35% | 45% |
| Person with disability1 | 5% | 5% |
| Visible minority1 | 3% | 9% |
| Immigrant1 | 0% | 2% |
| Marital status | ||
| Married or common-law | 52% | 56% |
| Widow / divorced or separated | 6% | 8% |
| Single | 37% | 36% |
| Missing data / Unknown | 5% | 0% |
| Skills level related to National Occupation Code associated with the last EI claim opened before program participation2 | ||
| Managerial | 10% | 8% |
| University | 8% | 5% |
| College or apprenticeship training | 52% | 25% |
| Secondary or occupational training | 21% | 44% |
| On-the-job training | 10% | 19% |
| Key labour market indicators in the year preceding the start of participation | ||
| Earnings3 | $34,941 | $15,284 |
| Proportion employed | 95% | 89% |
| Proportion on EI | 39% | 63% |
| Proportion on SA | 3% | 16% |
- Proportions may not add up to 100% due to rounding or missing values
- 1Status self-reported by participants
- 2Skill level corresponds to the type and/or amount of training or education typically required to work in the last occupation participants had before opening the last EI claim they had before participating in EBSMs. For detailed definition, see Table B1.
- 3Average earnings for all participants including those who reported zero earnings during that year.
| Average outcomes | Pre-program period | Program period | Post-program period | Average annual outcomes pre-1 | Average annual outcomes post-2 | Change between pre- and post-3 | |||||||||
|---|---|---|---|---|---|---|---|---|---|---|---|---|---|---|---|
| 5 yrs pre | 4 yrs pre | 3 yrs pre | 2 yrs pre | 1 yr pre | Program start year | 1 yr post start year | 1 yr post | 2 yrs post | 3 yrs post | 4 yrs post | 5 yrs post | ||||
| All active claimants (n=62) | |||||||||||||||
| Earnings including $04 | $19,606 | $22,165 | $23,623 | $28,753 | $34,941 | $16,410 | $12,670 | $20,152 | $23,735 | $20,573 | $22,936 | $19,952 | $25,818 | $21,469 | -$4,349 |
| Earnings excluding $05 | $22,935 | $24,540 | $26,629 | $31,834 | $36,718 | $19,566 | $22,445 | $31,235 | $34,222 | $34,473 | $43,652 | $36,947 | $28,531 | $36,106 | $7,575 |
| Proportion employed | 86% | 90% | 89% | 90% | 95% | 84% | 57% | 65% | 69% | 60% | 55% | 63% | 90% | 62% | -28pp |
| Proportion on EI | 27% | 32% | 32% | 29% | 39% | 100% | 60% | 13% | 23% | 24% | 18% | 11% | 32% | 18% | -14pp |
| EI benefits | $1,539 | $1,848 | $1,851 | $2,086 | $2,021 | $10,938 | $3,855 | $612 | $1,543 | $1,854 | $868 | $554 | $1,869 | $1,086 | -$783 |
| Number of weeks on EI | 4.9 | 6 | 5.2 | 6 | 5.4 | 28.3 | 10.2 | 1.7 | 4.1 | 4.8 | 2.4 | 1.8 | 5.5 | 3 | -2.5 |
| Proportion on SA | 8% | 10% | 7% | 7% | 3% | 3% | 2% | 0% | 2% | 2% | 2% | 4% | 7% | 2% | -5pp |
| SA benefits | $493 | $491 | $157 | $91 | $167 | $70 | $32 | $0 | $14 | $18 | $30 | $123 | $280 | $37 | -$243 |
| Dependence on income support | 12% | 17% | 13% | 12% | 10% | 50% | 39% | 3% | 7% | 12% | 11% | 11% | 13% | 9% | -4pp |
- 1Average annual outcome pre-: Represents the average annual outcomes over the pre-participation period
- 2Average annual outcome post-: Represents the average annual outcomes over the post-participation period
- 3Change between pre- and post-: Represents the difference between the average annual outcomes calculated over the pre-/post participation periods.
- 4Earnings outcome for all individuals covered by the study.
- 5Earnings outcomes excluding individuals who reported no earnings in a given year.
- pp = percentage points.
| Average outcomes | Pre-program period | Program period | Post-program period | Average annual outcomes pre-1 | Average annual outcomes post-2 | Change between pre- and post-3 | |||||||||
|---|---|---|---|---|---|---|---|---|---|---|---|---|---|---|---|
| 5 yrs pre | 4 yrs pre | 3 yrs pre | 2 yrs pre | 1 yr pre | Program start year | 1 yr post start year | 1 yr post | 2 yrs post | 3 yrs post | 4 yrs post | 5 yrs post | ||||
| All former claimants (n=64) | |||||||||||||||
| Earnings including $04 | $14,627 | $17,367 | $19,422 | $19,589 | $15,284 | $18,253 | $21,866 | $26,090 | $27,280 | $34,725 | $31,256 | $29,798 | $17,258 | $29,830 | $12,572 |
| Earnings excluding $05 | $16,559 | $17,937 | $19,735 | $20,231 | $17,161 | $19,151 | $24,128 | $28,789 | $32,331 | $49,387 | $43,333 | $40,494 | $18,325 | $38,867 | $20,542 |
| Proportion employed | 83% | 95% | 97% | 97% | 89% | 95% | 91% | 91% | 84% | 70% | 73% | 78% | 92% | 79% | -13pp |
| Proportion on EI | 25% | 27% | 44% | 58% | 63% | 34% | 22% | 27% | 30% | 25% | 14% | 16% | 43% | 22% | -21pp |
| EI benefits | $1,141 | $1,236 | $2,247 | $2,709 | $3,893 | $1,532 | $1,179 | $1,696 | $2,148 | $1,853 | $878 | $925 | $2,245 | $1,500 | -$745 |
| Number of weeks on EI | 4.7 | 4.3 | 7.7 | 9.6 | 13.1 | 4.6 | 4.3 | 5.3 | 5.9 | 4.8 | 2.2 | 2.3 | 7.9 | 4.1 | -3.8 |
| Proportion on SA | 11% | 9% | 13% | 9% | 16% | 16% | 8% | 5% | 6% | 5% | 10% | 9% | 12% | 7% | -5pp |
| SA benefits | $334 | $282 | $257 | $212 | $528 | $447 | $126 | $108 | $270 | $223 | $520 | $466 | $322 | $317 | -$5 |
| Dependence on income support | 9% | 11% | 15% | 19% | 31% | 15% | 10% | 11% | 15% | 12% | 13% | 10% | 17% | 12% | -5pp |
- 1Average annual outcome pre-: Represents the average annual outcomes over the pre-participation period
- 2Average annual outcome post-: Represents the average annual outcomes over the post-participation period
- 3Change between pre- and post-: Represents the difference between the average annual outcomes calculated over the pre-/post-participation periods.
- 4Earnings outcome for all individuals covered by the study.
- 5Earnings outcomes excluding individuals who reported no earnings in a given year.
- pp = percentage points.
Appendix D – Detailed results Self-Employment Option
| Active claimants 2001 to 2007 |
|
|---|---|
| Number of observations | 48 |
| Gender | |
| Male | 60% |
| Female | 40% |
| Age | |
| Under 25 | 8% |
| 25 to 34 | 29% |
| 35 to 44 | 35% |
| 45 to 54 | 21% |
| 55 and over | 6% |
| Socio-demographic group | |
| Aboriginal individual1 | 19% |
| Person with disability1 | 6% |
| Visible minority1 | 0% |
| Immigrant1 | 2% |
| Marital status | |
| Married or common-law | 58% |
| Widow / divorced or separated | 10% |
| Single | 27% |
| Missing data / Unknown | 4% |
| Skills level related to National Occupation Code associated with the last EI claim opened before program participation2 | |
| Managerial | 15% |
| University | 15% |
| College or apprenticeship training | 35% |
| Secondary or occupational training | 23% |
| On-the-job training | 13% |
| Key labour market indicators in the year preceding the start of participation | |
| Earnings3 | $38,490 |
| Proportion employed | 100% |
| Proportion on EI | 38% |
| Proportion on SA | 2% |
- Proportions may not add up to 100% due to rounding or missing values
- 1Status self-reported by participants
- 2Skill level corresponds to the type and/or amount of training or education typically required to work in the last occupation participants had before opening the last EI claim they had before participating in EBSMs. For detailed definition, see Table B1.
- 3Average earnings for all participants included in the study including those reported zero earnings during that year.
| Average outcomes | Pre-program period | Program period | Post-program period | Average annual outcomes pre-1 | Average annual outcomes post-2 | Change3 | |||||||||
|---|---|---|---|---|---|---|---|---|---|---|---|---|---|---|---|
| 5 yrs pre | 4 yrs pre | 3 yrs pre | 2 yrs pre | 1 yr pre | Program start year | 1 yr post start year | 1 yr post | 2 yrs post | 3 yrs post | 4 yrs post | 5 yrs post | ||||
| All active claimants (n=48) | |||||||||||||||
| Earnings including $04 | $21,955 | $25,758 | $28,081 | $36,379 | $38,490 | $20,422 | $14,660 | $23,962 | $29,668 | $36,258 | $38,392 | $39,030 | $30,132 | $33,462 | $3,330 |
| Earnings excluding $05 | $25,168 | $30,909 | $29,953 | $36,379 | $38,490 | $22,797 | $26,062 | $31,949 | $36,514 | $44,625 | $46,475 | $54,139 | $32,180 | $42,740 | $10,560 |
| Proportion employed | 85% | 83% | 94% | 100% | 100% | 90% | 56% | 75% | 81% | 81% | 83% | 75% | 93% | 79% | -14pp |
| Proportion on EI | 23% | 25% | 29% | 19% | 38% | 100% | 83% | 6% | 13% | 15% | 15% | 19% | 27% | 13% | -14pp |
| EI benefits | $938 | $1,298 | $1,806 | $1,651 | $2,353 | $10,725 | $5,477 | $578 | $772 | $978 | $1,186 | $1,133 | $1,609 | $929 | -$680 |
| Number of weeks on EI | 2.7 | 3.7 | 5.1 | 4.9 | 6.1 | 27.5 | 13.8 | 1.8 | 2.2 | 2.5 | 3.2 | 3.3 | 4.5 | 2.6 | -1.9 |
| Proportion on SA | 6% | 4% | 4% | 2% | 2% | 0% | 6% | 4% | 2% | 0% | 0% | 2% | 4% | 2% | -2pp |
| SA benefits | $184 | $73 | $113 | $54 | $13 | $0 | $91 | $111 | $74 | $0 | $0 | $68 | $87 | $51 | -$36 |
| Dependence on income support | 8% | 8% | 8% | 7% | 8% | 45% | 50% | 4% | 3% | 4% | 5% | 9% | 8% | 5% | -3pp |
- 1Average annual outcome pre-: Represents the average annual outcomes over the pre-participation period
- 2Average annual outcome post-: Represents the average annual outcomes over the post-participation period
- 3Change between pre- and post-: Represents the difference between the average annual outcomes calculated over the pre-/post-participation periods.
- 4Earnings outcome for all individuals covered by the study.
- 5Earnings outcomes excluding individuals who reported no earnings in a given year.
- pp = percentage points.
Appendix E – Detailed results Employment Assistance Services
| Active claimants | Former claimants | |||
|---|---|---|---|---|
| 2001 to 2007 | 2006 to 2008 | 2001 to 2007 | 2006 to2008 | |
| Number of observations | 582 | 256 | 679 | 255 |
| Gender | ||||
| Male | 62% | 57% | 56% | 48% |
| Female | 38% | 43% | 44% | 51% |
| Age | ||||
| Under 25 | 10% | 11% | 10% | 10% |
| 25 to 34 | 27% | 25% | 30% | 32% |
| 35 to 44 | 34% | 35% | 32% | 29% |
| 45 to 54 | 19% | 17% | 20% | 19% |
| 55 and over | 10% | 12% | 8% | 9% |
| Socio-demographic group | ||||
| Aboriginal individual1 | 37% | 46% | 37% | 55% |
| Person with disability1 | 4% | 4% | 7% | 5% |
| Visible minority1 | 8% | 10% | 6% | 7% |
| Immigrant1 | 2% | 4% | 3% | 1% |
| Marital status | ||||
| Married or common-law | 41% | 38% | 39% | 37% |
| Widow / divorced or separated | 13% | 9% | 17% | 13% |
| Single | 41% | 48% | 39% | 47% |
| Missing data / Unknown | 5% | 5% | 5% | 4% |
| Skills level related to National Occupation Code associated with the last EI claim opened before Employment Assistance Services participation2 | ||||
| Managerial | 5% | 5% | 3% | 4% |
| University | 9% | 7% | 8% | 10% |
| College or apprenticeship training | 32% | 34% | 28% | 27% |
| Secondary or occupational training | 33% | 31% | 35% | 33% |
| On-the-job training | 21% | 23% | 26% | 26% |
| Key labour market indicators in the year preceding the start of participation | ||||
| Earnings3 | $28,340 | $27,7743 | $14,502 | $15,9743 |
| Proportion employed | 96% | 99% | 84% | 91% |
| Proportion on EI | 52% | 53% | 49% | 55% |
| Proportion on SA | 6% | 7% | 20% | 14% |
- Proportions may not add up to 100% due to rounding or missing values
- 1Status self-reported by participants
- 2Skill level corresponds to the type and/or amount of training or education typically required to work in the last occupation participants had before opening the last EI claim they had before participating in EBSMs. For detailed definition, see Table B1.
- 3Average earnings for all participants including those who reported zero earnings during that year. Earnings for 2006 to 2008 participants have been adjusted by the Consumer Price Index published by Statistics Canada, using 2002 as the base year.
| Indicators | In-program period | Post-program period | Total in- and post-program | |||||
|---|---|---|---|---|---|---|---|---|
| 1st year | 2nd year | 3rd year | 4th year | 5th year | Total post | |||
| All active claimants (n=582) | ||||||||
| Employment earnings ($) | -2,133** | -394 | 1,301 | 2,183 | 5,327*** | 4,348** | 12,767** | 10,517 |
| Incidence of employment (percentage points) |
-2.5* | -1.7 | -2.6 | -2.6 | 0.2 | -2.6 | n/a | n/a |
| EI benefits ($) | 825** | -928*** | -398** | -475** | -480** | -1 | -2,282*** | -1,457* |
| EI weeks (weeks) | 1.3* | -1.9*** | -1.3* | -1.5** | -2.2*** | -0.6 | -7.5*** | -6.1** |
| SA benefits ($) | $7 | -$33 | $68 | $20 | $40 | -$134 | -39 | -32 |
| Dependence on income support (percentage points) | 9.4*** | -2.9** | 0.7 | 0.2 | -1.9 | 0.8 | n/a | n/a |
- Significance level *** 1%; ** 5%; * 10%
| Total costs and benefits over participation (1 to 2 years) and 6 years post-program | Active claimants (n=582) |
|---|---|
| Program cost | -$2,009 |
| Marginal social costs of public funds | $217 |
| Employment earnings (including participant’s forgone earnings) | $10,747 |
| Fringe benefit | $1,612 |
| Net present value (By how much do the benefits exceed the costs within 6 years after participation?) |
$10,568 |
| Cost-benefit ratio (How much does it cost in EI part II funds to achieve $1 in benefit 6 years after participation?) |
$0.20 |
| Payback period (How many years after participation would it take for the benefits to recover the costs?) |
3.3 years after participation |
| Average outcomes | Pre-program period | Participation year | Post-program period | Average annual outcomes pre-1 | Average annual outcomes post-2 | Change3 | ||||||||
|---|---|---|---|---|---|---|---|---|---|---|---|---|---|---|
| 5 yrs pre | 4 yrs pre | 3 yrs pre | 2 yrs pre | 1 yr pre | 1 yr post start year | 2 yrs post start year | 3 yrs post start year | 4 yrs post start year | 5 yrs post start year | |||||
| All active claimants | ||||||||||||||
| 2001 to 2007 participants (n=582) | ||||||||||||||
| Earnings including $04 | $16,776 | $18,236 | $21,157 | $23,787 | $28,340 | $19,212 | $23,812 | $27,586 | $29,991 | $33,116 | $32,535 | $21,659 | $27,709 | $6,050 |
| Earnings excluding $05 | $19,310 | $21,164 | $23,612 | $25,702 | $29,665 | $21,380 | $27,828 | $33,171 | $37,138 | $41,449 | $43,253 | $23,891 | $34,037 | $10,146 |
| Proportion employed | 84% | 85% | 89% | 92% | 96% | 90% | 86% | 83% | 81% | 80% | 76% | 89% | 83% | -6pp |
| Proportion on EI | 31% | 32% | 32% | 34% | 52% | 97% | 56% | 34% | 30% | 26% | 26% | 36% | 45% | 9pp |
| EI benefits | $1,736 | $1,935 | $1,827 | $2,250 | $2,837 | $7,682 | $3,426 | $2,400 | $2,059 | $1,759 | $2,129 | $2,117 | $3,242 | $1,125 |
| Number of weeks on EI | 5.4 | 5.9 | 5.4 | 6.5 | 7.9 | 21.4 | 9.4 | 6.6 | 5.5 | 4.5 | 5.3 | 6.2 | 8.8 | 2.6 |
| Proportion on SA | 13% | 13% | 12% | 7% | 6% | 7% | 9% | 11% | 10% | 12% | 9% | 10% | 10% | 0pp |
| SA benefits | $527 | $456 | $389 | $239 | $112 | $214 | $247 | $426 | $466 | $552 | $508 | $344 | $402 | $58 |
| Dependence on income support | 15% | 15% | 12% | 12% | 12% | 40% | 21% | 16% | 15% | 12% | 15% | 13% | 20% | 7pp |
| 2006 to 2008 participants (n=256) | ||||||||||||||
| Earnings including $04 | $19,328 | $19,736 | $22,323 | $26,665 | $30,443 | $22,148 | $27,613 | $29,024 | $30,247 | - | - | $23,699 | $28,961 | $5,262 |
| Earnings excluding $05 | $21,234 | $21,425 | $23,391 | $27,805 | $30,693 | $24,126 | $30,854 | $32,583 | $34,358 | - | - | $24,909 | $32,599 | $7,690 |
| Proportion employed | 91% | 92% | 95% | 96% | 99% | 92% | 90% | 89% | 88% | - | - | 95% | 89% | -6pp |
| Proportion on EI | 30% | 32% | 30% | 33% | 53% | 95% | 53% | 34% | 31% | - | - | 36% | 39% | 3pp |
| EI benefits | $1,666 | $2,203 | $1,851 | $2,100 | $2,728 | $8,168 | $3,768 | $2,615 | $2,582 | - | - | $2,110 | $2,989 | $879 |
| Number of weeks on EI | 5 | 6 | 5 | 6 | 8 | 21 | 9 | 7 | 6 | - | - | 6 | 7 | 1w |
| Proportion on SA | 10% | 12% | 12% | 7% | 7% | 11% | 12% | 16% | 14% | - | - | 10% | 14% | 4pp |
| SA benefits | $475 | $391 | $538 | $303 | $245 | $203 | $507 | $585 | $601 | - | - | $390 | $564 | $174 |
| Dependence on income support | 13% | 15% | 14% | 11% | 12% | 37% | 22% | 18% | 17% | - | - | 13% | 16% | 3pp |
| Sub-groups of active claimants | ||||||||||||||
| Youth (under 30 years old) – 2001 to 2007 participants (n=127) | ||||||||||||||
| Earnings including $04 | $9,960 | $12,329 | $15,378 | $20,460 | $25,119 | $18,912 | $22,949 | $28,652 | $34,280 | $38,907 | $40,484 | $16,649 | $30,697 | $14,048 |
| Earnings excluding $05 | $10,741 | $13,609 | $16,029 | $21,147 | $26,148 | $20,354 | $25,566 | $32,201 | $40,311 | $44,516 | $47,672 | $17,535 | $35,103 | $17,568 |
| Proportion employed | 80% | 84% | 93% | 96% | 96% | 93% | 90% | 89% | 85% | 87% | 85% | 90% | 88% | -2pp |
| Proportion on EI | 19% | 15% | 21% | 24% | 46% | 98% | 58% | 32% | 28% | 25% | 26% | 25% | 44% | 19ppv |
| EI benefits | $785 | $1,050 | $1,070 | $1,512 | $2,144 | $7,281 | $3,195 | $2,268 | $1,633 | $1,812 | $1,768 | $1,312 | $2,993 | $1,681 |
| Number of weeks on EI |
2.8 | 3.4 | 3.4 | 4.6 | 6.3 | 21 | 9.1 | 6.4 | 4.4 | 4.6 | 4.6 | 4.1 | 8.3 | 4.2 |
| Proportion on SA | 9% | 6% | 6% | 3% | 2% | 6% | 5% | 7% | 6% | 6% | 6% | 6% | 6% | 0pp |
| SA benefits | $302 | $255 | $250 | $107 | $99 | $245 | $133 | $256 | $172 | $193 | $271 | $203 | $212 | $9 |
| Dependence on income support | 8% | 8% | 8% | 7% | 10% | 37% | 21% | 13% | 10% | 7% | 12% | 8% | 17% | 9pp |
| Older workers (55 years old and above) – 2001 to 2007 participants (n=60) | ||||||||||||||
| Earnings including $04 | $24,976 | $25,533 | $27,836 | $29,886 | $32,457 | $17,583 | $20,977 | $21,726 | $21,523 | $24,410 | $22,052 | $28,138 | $21,378 | -$6,760 |
| Earnings excluding $05 | $28,275 | $28,906 | $32,749 | $33,833 | $34,776 | $22,447 | $27,361 | $29,626 | $30,747 | $38,543 | $35,528 | $31,708 | $30,709 | -$999 |
| Proportion employed | 88% | 88% | 85% | 88% | 93% | 78% | 77% | 73% | 70% | 63% | 63% | 89% | 71% | -18pp |
| Proportion on EI | 38% | 35% | 33% | 33% | 52% | 97% | 45% | 25% | 20% | 22% | 23% | 38% | 39% | 1pp |
| EI benefits | $1,951 | $2,365 | $2,296 | $2,228 | $2,802 | $8,309 | $3,107 | $1,991 | $1,619 | $1,802 | $1,613 | $2,328 | $3,074 | $746 |
| Number of weeks on EI | 5.7 | 6.8 | 6.9 | 6.2 | 7.8 | 23.1 | 8.3 | 5.3 | 4.5 | 4.8 | 4 | 6.7 | 8.3 | 1.6 |
| Proportion on SA | 10% | 10% | 10% | 5% | 3% | 5% | 8% | 7% | 12% | 13% | 17% | 8% | 10% | 2pp |
| SA benefits | $430 | $376 | $474 | $187 | $77 | $51 | $248 | $220 | $584 | $622 | $595 | $309 | $387 | $78 |
| Dependence on income support | 15% | 17% | 15% | 13% | 13% | 46% | 19% | 12% | 20% | 19% | 22% | 15% | 23% | 8pp |
| "Long-Tenured Workers" – 2007 to 2009 participants (n=58) | ||||||||||||||
| Earnings including $0 | $35,663 | $37,338 | $41,986 | $44,634 | $44,194 | $25,342 | $30,920 | $36,100 | $35,866 | - | - | $40,763 | $34,295 | -$6,468 |
| Earnings excluding $04 | $38,354 | $37,994 | $41,986 | $44,634 | $44,194 | $27,329 | $33,609 | $39,239 | $43,551 | - | - | $41,432 | $38,800 | -$2,632 |
| Proportion employed | 93% | 98% | 100% | 100% | 100% | 93% | 92% | 92% | 82% | - | - | 98% | 89% | -9pp |
| Proportion on EI | 16% | 21% | 25% | 19% | 38% | 91% | 54% | 26% | 35% | - | - | 24% | 38% | 14pp |
| EI benefits | $813 | $1,206 | $1,035 | $754 | $1,962 | $8,357 | $3,358 | $2,162 | $3,478 | - | - | $1,154 | $3,000 | $1,846 |
| Number of weeks on EI | 2 | 3 | 3 | 2 | 5 | 21 | 10 | 6 | 8w | - | - | 3 | 8 | 5 |
| Proportion on SA | 5% | 7% | 5% | 3% | 9% | 7% | 12% | 16% | 8% | - | - | 6% | 12% | 6pp |
| SA benefits | $211 | $285 | $74 | $80 | $391 | $390 | $403 | $318 | $119 | - | - | $208 | $280 | $72 |
| Dependence on income support | 6% | 5% | 3% | 3% | 7% | 35% | 19% | 14% | 18% | - | - | 5% | 17% | 12pp |
- 1Average annual outcome pre-: Represents the average annual outcomes over the pre-participation period
- 2Average annual outcome post-: Represents the average annual outcomes over the post-participation period
- 3Change between pre- and post-: Represents the difference between the average annual outcomes calculated over the pre-/post-participation periods.
- 4Earnings outcome for all individuals covered by the study.
- 5Earnings outcomes excluding individuals who reported no earnings in a given year.
- pp = percentage points.
| Average outcomes | Pre-program period | Participation year | Post-program period | Average annual outcomes pre-1 | Average annual outcomes post-2 | Change3 | ||||||||
|---|---|---|---|---|---|---|---|---|---|---|---|---|---|---|
| 5 yrs pre | 4 yrs pre | 3 yrs pre | 2 yrs pre | 1 yr pre | 1 yr post start year | 2 yrs post start year | 3 yrs post start year | 4 yrs post start year | 5 yrs post start year | |||||
| All former claimants | ||||||||||||||
| 2001 to 2007 participants (n=679) | ||||||||||||||
| Earnings including $04 | $15,680 | $18,458 | $17,540 | $17,745 | $14,502 | $14,593 | $17,421 | $19,460 | $21,717 | $21,718 | $22,274 | $16,785 | $19,530 | $2,745 |
| Earnings excluding $05 | $18,511 | $20,455 | $19,314 | $20,029 | $17,336 | $18,081 | $21,429 | $24,931 | $28,302 | $29,973 | $32,345 | $19,129 | $25,844 | $6,715 |
| Proportion employed | 82% | 89% | 90% | 89% | 84% | 81% | 81% | 78% | 77% | 73% | 70% | 87% | 77% | -10pp |
| Proportion on EI | 23% | 27% | 47% | 52% | 49% | 26% | 21% | 23% | 23% | 24% | 20% | 40% | 23% | -17pp |
| EI benefits | $1,204 | $1,389 | $2,708 | $2,839 | $3,116 | $1,124 | $1,112 | $1,243 | $1,220 | $1,460 | $1,404 | $2,251 | $1,260 | -$991 |
| Number of weeks on EI | 3.9 | 4.5 | 8.8 | 9.2 | 9.6 | 3.4 | 3.4 | 3.8 | 3.5 | 4 | 3.8 | 7.2 | 3.7 | -3.5 |
| Proportion on SA | 19% | 19% | 16% | 17% | 20% | 26% | 23% | 19% | 18% | 17% | 17% | 18% | 20% | 2pp |
| SA benefits | $677 | $625 | $493 | $531 | $690 | $1,113 | $992 | $897 | $922 | $885 | $930 | $603 | $956 | $353 |
| Dependence on income support | 16% | 15% | 21% | 24% | 28% | 22% | 18% | 18% | 17% | 18% | 18% | 21% | 20% | -1pp |
| 2006 to 2008 participants (n=255) | ||||||||||||||
| Earnings including $04 | $18,583 | $21,430 | $20,278 | $20,403 | $17,509 | $19,371 | $23,049 | $26,083 | $26,788 | - | - | $19,641 | $25,306 | $5,665 |
| Earnings excluding $05 | $20,341 | $22,153 | $21,486 | $22,416 | $19,244 | $21,770 | $26,706 | $29,560 | $30,711 | - | - | $21,128 | $28,992 | $7,864 |
| Proportion employed | 91% | 97% | 94% | 91% | 91% | 89% | 86% | 88% | 87% | - | - | 93% | 87% | -6pp |
| Proportion on EI | 24% | 34% | 51% | 53% | 55% | 29% | 22% | 27% | 26% | - | - | 43% | 25% | -18pp |
| EI benefits | $1,638 | $1,902 | $3,509 | $3,055 | $3,968 | $1,528 | $1,785 | $1,835 | $2,408 | - | - | $2,815 | $2,009 | -$806 |
| Number of weeks on EI | 5 | 6 | 10 | 10 | 11 | 4 | 5 | 5 | 6 | - | - | 8 | 5 | -3 |
| Proportion on SA | 16% | 13% | 12% | 8% | 14% | 26% | 26% | 31% | 26% | - | - | 13% | 28% | 15pp |
| SA benefits | $372 | $430 | $483 | $302 | $405 | $970 | $1,102 | $1,415 | $1,467 | - | - | $398 | $1,328 | $930 |
| Dependence on income support | 14% | 14% | 21% | 22% | 25% | 21% | 18% | 23% | 23% | - | - | 19% | 24% | 5pp |
| Sub-groups of former claimants | ||||||||||||||
| Youth (below 30 years old) – 2001 to 2007 participants (n=161) | ||||||||||||||
| Earnings including $04 | $8,942 | $11,919 | $14,112 | $15,824 | $14,562 | $15,298 | $18,221 | $20,513 | $22,757 | $22,773 | $26,320 | $13,072 | $20,980 | $7,908 |
| Earnings excluding $05 | $10,609 | $13,042 | $15,386 | $17,134 | $15,735 | $17,978 | $20,515 | $24,283 | $27,548 | $28,644 | $34,216 | $14,381 | $25,531 | $11,150 |
| Proportion employed | 73% | 86% | 89% | 92% | 93% | 85% | 89% | 85% | 83% | 80% | 78% | 87% | 83% | -4pp |
| Proportion on EI | 14% | 18% | 38% | 37% | 48% | 32% | 21% | 22% | 24% | 24% | 22% | 31% | 24% | -7pp |
| EI benefits | $486 | $581 | $1,646 | $1,452 | $2,886 | $1,171 | $1,092 | $1,283 | $1,012 | $1,325 | $1,227 | $1,410 | $1,185 | -$225 |
| Number of weeks on EI | 1.72 | 2.5 | 6.5 | 5.5 | 9.6 | 3.9 | 3.4 | 3.9 | 3.2 | 3.8 | 3.7 | 5.2 | 3.7 | -1.5 |
| Proportion on SA | 16% | 16% | 11% | 17% | 14% | 21% | 19% | 12% | 12% | 11% | 11% | 15% | 14% | -1pp |
| SA benefits | $381 | $468 | $337 | $519 | $490 | $816 | $659 | $391 | $542 | $586 | $649 | $439 | $607 | $168 |
| Dependence on income support | 12% | 11% | 17% | 18% | 24% | 19% | 16% | 14% | 12% | 13% | 14% | 16% | 16% | 0pp |
| Older workers (55 years old and over) – 2001 to 2007 participants (n=51) | ||||||||||||||
| Earnings including $04 | $24,692 | $25,385 | $18,865 | $19,370 | $13,812 | $13,878 | $12,594 | $14,207 | $13,231 | $11,692 | $9,891 | $20,425 | $12,582 | -$7,843 |
| Earnings excluding $05 | $26,236 | $25,892 | $20,044 | $21,019 | $17,611 | $18,626 | $20,071 | $22,643 | $23,269 | $22,085 | $22,030 | $22,160 | $21,454 | -$706 |
| Proportion employed | 94% | 98% | 94% | 92% | 78% | 75% | 63% | 63% | 57% | 53% | 47% | 91% | 60% | -31pp |
| Proportion on EI | 31% | 37% | 65% | 61% | 49% | 16% | 14% | 14% | 16% | 16% | 12% | 49% | 14% | -35pp |
| EI benefits | $2,029 | $2,537 | $4,007 | $4,055 | $2,952 | $877 | $1,156 | $898 | $465 | $1,064 | $669 | $3,116 | $855 | -$2,261 |
| Number of weeks on EI | 5.98 | 7.3 | 12.5 | 14.1 | 9.5 | 2.5 | 3.3 | 2.8 | 1.4 | 2.8 | 1.7 | 9.9 | 2.4 | -7.5 |
| Proportion on SA | 18% | 14% | 8% | 8% | 16% | 16% | 22% | 20% | 16% | 14% | 12% | 13% | 16% | 3pp |
| SA benefits | $1,004 | $488 | $237 | $273 | $629 | $781 | $902 | $1,267 | $1,198 | $954 | $714 | $526 | $969 | $443 |
| Dependence on income support | 18% | 16% | 25% | 28% | 29% | 15% | 21% | 23% | 16% | 17% | 16% | 23% | 19% | -4pp |
| Long-Tenured Workers – 2007 to 2009 participants (n=47) | ||||||||||||||
| Earnings including $0 | $31,469 | $33,590 | $32,652 | $29,704 | $28,707 | $26,335 | $28,782 | $28,703 | $31,906 | - | - | $31,224 | $29,797 | -$1,427 |
| Earnings excluding $04 | $32,153 | $33,590 | $34,878 | $30,364 | $30,042 | $26,920 | $30,790 | $33,009 | $34,565 | - | - | $32,206 | $32,788 | $582 |
| Proportion employed | 98% | 100% | 94% | 98% | 96% | 98% | 94% | 87% | 92% | - | - | 97% | 91% | -6pp |
| Proportion on EI | 21% | 28% | 53% | 57% | 58% | 33% | 26% | 26% | 26% | - | - | 43% | 26% | -17pp |
| EI benefits | $969 | $1,603 | $3,491 | $2,959 | $4,012 | $1,289 | $1,636 | $2,373 | $2,558 | - | - | $2,607 | $2,189 | -$418 |
| Number of weeks on EI | 3 | 4 | 9 | 8 | 10 | 3 | 4 | 6 | 8 | - | - | 7 | 6 | -1 |
| Proportion on SA | 11% | 9% | 9% | 9% | 18% | 30% | 26% | 28% | 26% | - | - | 11% | 27% | 16pp |
| SA benefits | $437 | $107 | $270 | $209 | $482 | $1,015 | $1,406 | $1,176 | $1,243 | - | - | $301 | $1,275 | $974 |
| Dependence on income support | 8% | 7% | 18% | 13% | 22% | 17% | 18% | 23% | 20% | - | - | 14% | 20% | 6pp |
- 1Average annual outcome pre-: Represents the average annual outcomes over the pre-participation period
- 2Average annual outcome post-: Represents the average annual outcomes over the post-participation period
- 3Change between pre- and post-: Represents the difference between the average annual outcomes calculated over the pre-/post -participation periods.
- 4Earnings outcome for all individuals covered by the study.
- 5Earnings outcomes excluding individuals who reported no earnings in a given year.
- pp = percentage points.
Appendix F – List of four studies included in the synthesis report
| Study | Evidence included in summary report | Methods | Reference period | Observation period |
|---|---|---|---|---|
| Analysis of EBSM Profile, Outcomes and Medium-Term Incremental Impacts for 2001 to 2007 Participants in Northwest Territories (Completed in 2014) |
|
|
2001 to 2007 participants | 11 to 12 consecutive years between 1997 and 2011 (that is 5 years pre-program, 1 to 2 years in-program and 5 years post-program) |
| Cost-Benefit Analysis of EBSMs Delivered in the Northwest Territories (Completed in 2015; corrected in 2016) |
|
|
7 consecutive years between 2001 and 2012 (that is, 1 year in-program and 6 years post-program) | |
| Analysis of EBSM Profile and Outcomes for 2006-2008 Participants in Northwest Territories (Completed in 2015) |
|
|
2006 to 2008 participants | 9 to 10 consecutive years between 2001 and 2012 (that is 5 years pre-program, 1 to 2 years in-program and 3 years post-program) |
| Analysis of EBSM Profile and Outcomes for the EI Claimant Category Long-Tenured Workers in Northwest Territories (Completed in 2016) |
|
|
2007 to 2009 participants | 9 to 10 consecutive years between 2002 and 2013 (that is 5 years pre-program, 1 to 2 years in-program and 3 years post-program) |
Page details
- Date modified: