
EI Monitoring and Assessment Report 2012Chapter 1: Labour Market Context
Notice: Refer to the Table of contents to navigate through the EI Monitoring and Assessment Report .
This chapter outlines key labour market developments and the economic context that prevailed in the 2011/12 fiscal year, the period for which this report assesses the Employment Insurance (EI) program. Footnote 1 More detailed information on various elements discussed in this chapter is available in Annex 1.
I. ECONOMIC OVERVIEW
Despite a challenging and fragile global environment, Canada's economic performance since the late-2000s recession has been relatively solid compared with that of other Organisation for Economic Co-operation and Development (OECD) countries. This has been reflected in somewhat modest real gross domestic product (GDP) and employment growth rates. In 2011/12, economic growth in Canada was largely driven by relatively sustained strength in demand from Canadian households and businesses. Footnote 2
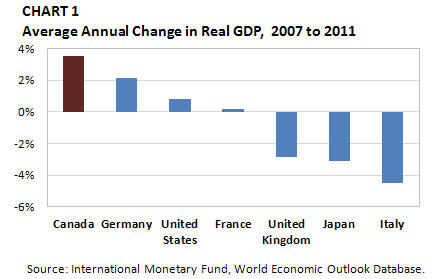
Table equivalent for Chart 1
| Country | Change in Real GDP, 2007 to 2011 |
|---|---|
| Canada | 3.5% |
| Germany | 2.1% |
| United States | 0.8% |
| France | 0.2% |
| United Kingdom | -2.8% |
| Japan | -3.1% |
| Italy | -4.5% |
From 2007 to 2011, Canada's real GDP increased by 3.5% above its pre-recession level, which represents the best economic performance among G7 countries during this period (see Chart 1). Footnote 3
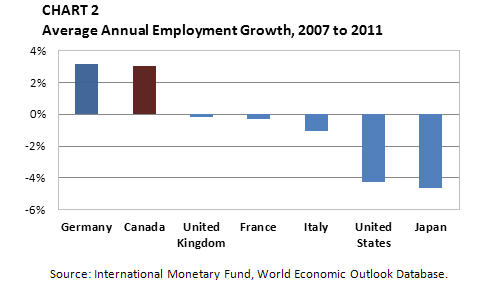
Table equivalent for Chart 2
| Country | 2010 Employment (millions) |
2011 Employment (millions) |
% Change |
|---|---|---|---|
| Germany | 40.505 | 41.036 | 3.1% |
| Canada | 17.046 | 17.309 | 3.0% |
| United Kingdom | 29.035 | 29.176 | -0.2% |
| France | 25.573 | 25.651 | -0.3% |
| Italy | 22.881 | 22.977 | -1.0% |
| United States | 139.07 | 139.873 | -4.2% |
| Japan | 62.568 | 61.146 | -4.6% |
Canada also posted a relatively strong employment growth rate, compared with other G7 countries. With employment gains of 3.0% from 2007 to 2011, Canada ranked second among G7 countries, right behind Germany (+3.1%), as shown in Chart 2. Footnote 4 Canada's employment situation contrasts sharply with that of the United States, where employment remains significantly below pre-recession levels (-4.2%).
More recently, however, the pace of economic recovery in Canada has slowed, compared with that in the previous year. Employment rose by 1.3% (+223,000) from 2010/11 to 2011/12, slower than the increase registered in 2010/11 (+1.7%). The growth rate of labour productivity Footnote 5 in Canada also slowed, increasing by 0.7% in 2011/12, after a progression of 1.2% in the previous year.
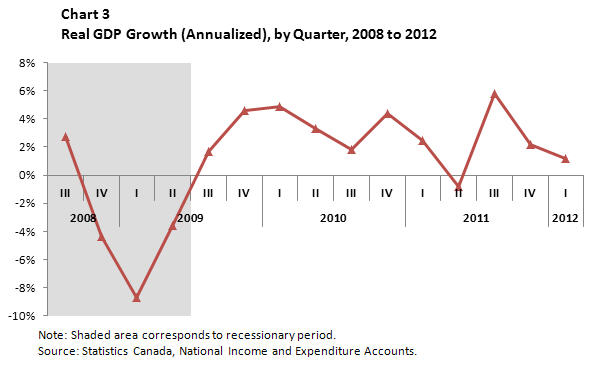
Table equivalent for Chart 3
| Year | Quarter | % Change |
|---|---|---|
| 2008 | III | 2.8% |
| IV | -4.4% | |
| 2009 | I | -8.7% |
| II | -3.6% | |
| III | 1.7% | |
| IV | 4.6% | |
| 2010 | I | 4.9% |
| II | 3.3% | |
| III | 1.8% | |
| IV | 4.4% | |
| 2011 | I | 2.5% |
| II | -0.8% | |
| III | 5.8% | |
| IV | 2.1% | |
| 2012 | I | 1.2% |
Real GDP Footnote 6 grew by 2.3% in 2011/12, which was slower than the growth rate in 2010/11 (+3.5%). As indicated in Chart 3, after experiencing negative growth rates during the late-2000s recession, the Canadian economy started to recover in the third quarter of 2009 and maintained positive GDP growth rates in subsequent quarters. There was one exception: a 0.8% decline in real GDP in the second quarter of 2011, resulting from a 1.6% drop in exports. As demand for exports grew again in the second half of 2011, real GDP advanced during subsequent quarters.
II. LABOUR MARKET OVERVIEW
1. Labour Force Participation Rate
In 2011/12, there were approximately 18.7 million people in the Canadian labour market, with a participation rate Footnote 7 of 66.7%. Although the participation rate has declined since peaking at its historical high Footnote 8 of 67.6% in 2008/09, it remains relatively high compared with the rates observed over the last 20 years (see Chart 4).
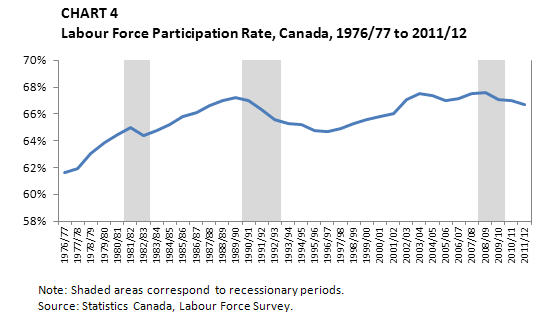
Table equivalent for Chart 4
| Year | % |
|---|---|
| 1976/77 | 61.6% |
| 1977/78 | 62.0% |
| 1978/79 | 63.0% |
| 1979/80 | 63.9% |
| 1980/81 | 64.4% |
| 1981/82 | 65.0% |
| 1982/83 | 64.4% |
| 1983/84 | 64.8% |
| 1984/85 | 65.2% |
| 1985/86 | 65.8% |
| 1986/87 | 66.1% |
| 1987/88 | 66.6% |
| 1988/89 | 67.0% |
| 1989/90 | 67.2% |
| 1990/91 | 67.0% |
| 1991/92 | 66.3% |
| 1992/93 | 65.6% |
| 1993/94 | 65.3% |
| 1994/95 | 65.2% |
| 1995/96 | 64.7% |
| 1996/97 | 64.6% |
| 1997/98 | 64.9% |
| 1998/99 | 65.2% |
| 1999/00 | 65.6% |
| 2000/01 | 65.8% |
| 2001/02 | 66.0% |
| 2002/03 | 67.1% |
| 2003/04 | 67.5% |
| 2004/05 | 67.4% |
| 2005/06 | 67.0% |
| 2006/07 | 67.1% |
| 2007/08 | 67.5% |
| 2008/09 | 67.6% |
| 2009/10 | 67.0% |
| 2010/11 | 67.0% |
| 2011/12 | 66.7% |
In 2011/12, the labour force participation rate for those aged 15 to 19 years registered its third consecutive decline, falling from 51.3% in 2010/11 to 50.6%, while the participation rate for those aged 20 to 24 years increased by 0.1 percentage points to 76.8%. During the late-2000s recession, those aged 15 to 19 years were more likely to be discouraged from joining the labour force due to weak labour market prospects than were those aged 20 to 24 years. The participation rate for individuals aged 15 to 19 years decreased by 4.8 percentage points from 2007/08 to 2011/12, while it decreased by 1.9 percentage points for those aged 20 to 24 years. As shown in Chart 5, the weak labour force participation of these two age groups has contributed to the decline in the overall participation rate since the onset of the late-2000s recession.
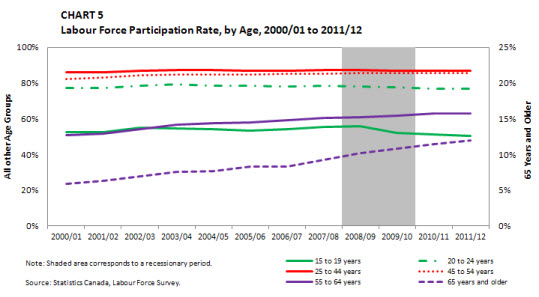
Table equivalent for Chart 5
| Age | 2000-2001 | 2001/02 | 2002/03 | 2003/04 | 2004/05 | 2005/06 | 2006/07 | 2007/08 | 2008/09 | 2009/10 | 2010/11 | 2011/12 |
|---|---|---|---|---|---|---|---|---|---|---|---|---|
| 15 to 19 years | 52.4% | 52.5% | 55.1% | 54.8% | 54.3% | 53.2% | 54.0% | 55.4% | 56.0% | 52.3% | 51.3% | 50.6% |
| 20 to 24 years | 77.2% | 77.3% | 78.6% | 79.2% | 78.6% | 78.4% | 78.3% | 78.7% | 78.3% | 77.5% | 76.7% | 76.8% |
| 25 to 44 years | 86.1% | 86.2% | 87.0% | 87.3% | 87.3% | 86.9% | 87.1% | 87.3% | 87.2% | 86.8% | 86.8% | 86.7% |
| 45 to 54 years | 82.1% | 83.0% | 84.2% | 84.9% | 85.0% | 84.6% | 85.0% | 85.4% | 85.8% | 85.7% | 85.7% | 85.8% |
| 55 to 64 years | 51.0% | 51.6% | 54.3% | 56.8% | 57.4% | 57.9% | 59.0% | 60.4% | 61.0% | 61.8% | 62.9% | 62.9% |
| 65 years and older | 5.9% | 6.3% | 6.9% | 7.6% | 7.7% | 8.3% | 8.3% | 9.2% | 10.2% | 10.8% | 11.5% | 12.0% |
Participation rates for those aged 55 to 64 years and those aged 65 years and older have been trending upward over the past decade. From 2000/01 to 2011/12, these groups showed an increase of 11.3 percentage points to 62.9%, and 5.7 percentage points to 12.0%, respectively. The rises in their participation rates are partly due to the increases in their numbers in the labour force, as more older people choose to work and delay their retirement. Footnote 9 The participation rates for core-aged people (25 to 44 years and 45 to 54 years) remained stable between 2000/01 and 2011/12, with participation rates of 86.7% and 85.7%, respectively, in 2011/12.
2. Employment and Employment Rate
In 2011/12, Canada experienced an increase in employment, with a net gain of 223,000 (+1.3%), to reach an annual average of 17.3 million. In the fourth quarter of 2011/12, there were 17.4 million people employed in Canada, which represented an increase of 608,400 (+3.6%) compared to the employment trough of the second quarter of 2009/10, when the lowest figure for employment was observed as a result of the late-2000s recession. As indicated in Chart 6, the employment growth rate during the recent recovery has been stronger than that of the early-1990s recovery but weaker than that of the early-1980s recovery.
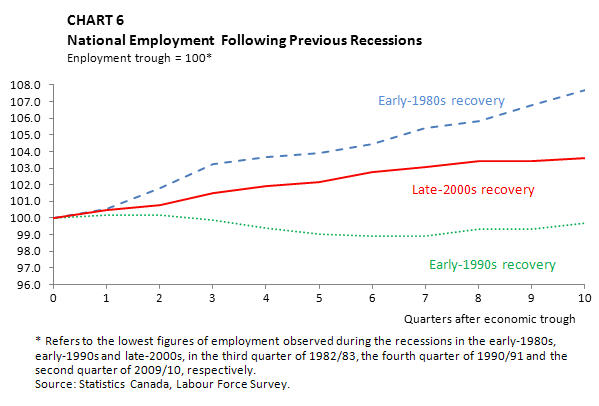
Table equivalent for Chart 6
| 4Q1982 | 100.0 | 1Q1991 | 100.0 | 3Q2009 | 100.0 |
|---|---|---|---|---|---|
| 1Q1983 | 100.5 | 2Q1991 | 100.2 | 4Q2009 | 100.5 |
| 2Q1983 | 101.8 | 3Q1991 | 100.1 | 1Q2010 | 100.8 |
| 3Q1983 | 103.2 | 4Q1991 | 99.9 | 2Q2010 | 101.5 |
| 4Q1983 | 103.7 | 1Q1992 | 99.4 | 3Q2010 | 101.9 |
| 1Q1984 | 103.9 | 2Q1992 | 99.1 | 4Q2010 | 102.2 |
| 2Q1984 | 104.4 | 3Q1992 | 98.9 | 1Q2011 | 102.7 |
| 3Q1984 | 105.4 | 4Q1992 | 98.9 | 2Q2011 | 103.1 |
| 4Q1984 | 105.8 | 1Q1993 | 99.4 | 3Q2011 | 103.4 |
| 1Q1985 | 106.8 | 2Q1993 | 99.3 | 4Q2011 | 103.4 |
| 2Q1985 | 107.7 | 3Q1993 | 99.7 | 1Q2012 | 103.6 |
* Refers to the lowest figures of employment observed during the recessions in the early-1980s, early-1990s and late-2000s, in the third quarter of 1982/83, the fourth quarter of 1990/91 and the second quarter of 2009/10, respectively. Source: Statistics Canada, Labour Force Survey.
Canada's employment rate has trended upward, increasing from 57.1% in 1976/77 to 61.8% in 2011/12. Although the employment rate decreased from 63.5% in 2007/08 to 61.4% in 2009/10, this decline was considerably smaller than those observed following previous recent recessions (see Chart 7).
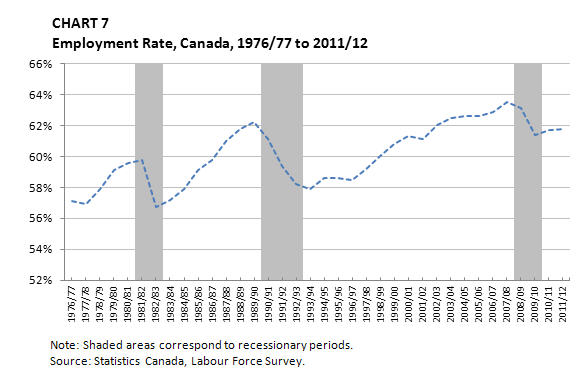
Table equivalent for Chart 7
| Year | Employment Rate |
|---|---|
| 1976/77 | 57.1% |
| 1977/78 | 56.9% |
| 1978/79 | 57.9% |
| 1979/80 | 59.1% |
| 1980/81 | 59.6% |
| 1981/82 | 59.8% |
| 1982/83 | 56.7% |
| 1983/84 | 57.2% |
| 1984/85 | 57.9% |
| 1985/86 | 59.1% |
| 1986/87 | 59.8% |
| 1987/88 | 61.0% |
| 1988/89 | 61.8% |
| 1989/90 | 62.2% |
| 1990/91 | 61.1% |
| 1991/92 | 59.4% |
| 1992/93 | 58.2% |
| 1993/94 | 57.9% |
| 1994/95 | 58.6% |
| 1995/96 | 58.6% |
| 1996/97 | 58.5% |
| 1997/98 | 59.2% |
| 1998/99 | 60.0% |
| 1999/00 | 60.8% |
| 2000/01 | 61.3% |
| 2001/02 | 61.1% |
| 2002/03 | 62.0% |
| 2003/04 | 62.5% |
| 2004/05 | 62.6% |
| 2005/06 | 62.6% |
| 2006/07 | 62.9% |
| 2007/08 | 63.5% |
| 2008/09 | 63.1% |
| 2009/10 | 61.4% |
| 2010/11 | 61.7% |
| 2011/12 | 61.8% |
2.1 Employment, by Sector and Job Permanency
In 2011/12, employment in the private sector increased by 1.8% (+191,200), while employment in the public sector increased by 0.8% (+28,700). Moreover, all of the increase in Canada was in full-time employment (+250,400, +1.8%), as part-time employment fell by 0.8% (-27,500) (see Chart 8).
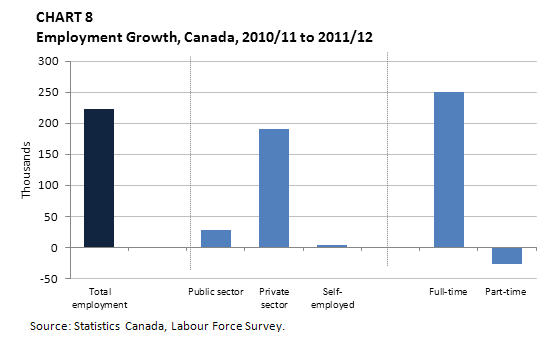
Table equivalent for Chart 8
| 2010/11 | 2011/12 | Growth | |
|---|---|---|---|
| Total employment | 17,121.3 | 17,344.3 | 223.0 |
| Public sector | 3,535.2 | 3,563.9 | 28.7 |
| Private sector | 10,921.9 | 11,113.1 | 191.2 |
| Self-employed | 2,664.2 | 2,667.3 | 3.1 |
| Full-time | 13,790.9 | 14,041.3 | 250.4 |
| Part-time | 3,330.4 | 3,302.9 | -27.5 |
The number of employees Footnote 10 with temporary work arrangements continued to rise in 2011/12. Temporary work arrangements—which include seasonal, contract or casual employment—accounted for 13.7% of all employees in 2011/12, the largest such share since comparable data were first recorded in 1997/98 (see Chart 9).
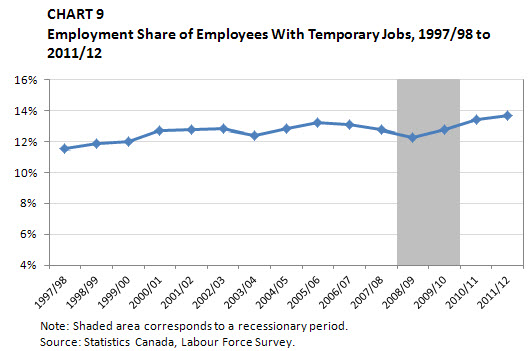
Table equivalent for Chart 9
| Year | Employment Share |
|---|---|
| 1997/98 | 11.5% |
| 1998/99 | 11.9% |
| 1999/00 | 12.0% |
| 2000/01 | 12.7% |
| 2001/02 | 12.8% |
| 2002/03 | 12.8% |
| 2003/04 | 12.4% |
| 2004/05 | 12.9% |
| 2005/06 | 13.2% |
| 2006/07 | 13.1% |
| 2007/08 | 12.8% |
| 2008/09 | 12.2% |
| 2009/10 | 12.8% |
| 2010/11 | 13.4% |
| 2011/12 | 13.7% |
2.2 Employment, by Industry
The services-producing sector regained, on a net basis, all of the employment lost during the late-2000s recession and added more workers, with employment up from 12.9 million in 2007/08 to 13.5 million in 2011/12. The professional, scientific and technical industry, as well as the health care and social assi stance industry, witnessed the strongest increases in employment in the services-producing sector, registering growths of 14.2% and 13.7%, respectively, between 2007/08 and 2011/12.
On the other hand, the goods-producing sector experienced a significant decline in employment during the late-2000s recession from which it has not recovered, on a net basis. The decrease was mainly due to employment losses in the manufacturing and construction industries.
Employment in the manufacturing industry has been vulnerable to cyclical movements in Canada. After the employment losses in the industry following the recessions of the early-1980s and early-1990s, the manufacturing industry saw periods of strong employment growth, which resulted in employment recovering to levels recorded prior to the recessions. However, employment in the manufacturing industry has been declining continuously since 2003/04, and the late-2000s recession only accelerated this decline. Over the 10-month period from October 2008 to July 2009 inclusive, employment in this industry decreased by 10.9% (-214,200). Then it increased only slightly (+20,200, +1.2%) from July 2009 to March 2012, remaining 9.9% or 194,000 below the pre-recession level recorded in October 2008.
The recent employment picture for the construction industry has been more positive. After losses of 106,300 (-8.6%) in employment between October 2008 and July 2009, there were gains of 142,300 (+12.5%) in employment added on a net basis from July 2009 to March 2011, more than compensating for the employment losses during the recession. From March 2011 to March 2012, employment gains in the construction industry slowed down (+1.1%, +13,500) compared with the growth rate of 11.4% observed between July 2009 and March 2011 (see Chart 10).
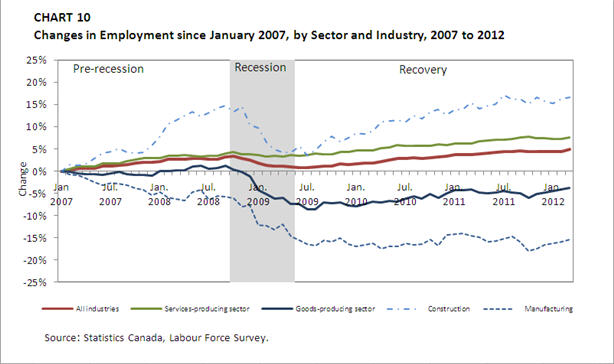
Table equivalent for Chart 10
| All industries | Goods-producing sector |
Construction | Manufacturing | Services-producing sector |
|
|---|---|---|---|---|---|
| January 2007 | 0 | 0 | 0 | 0 | 0 |
| February 2007 | 0.3% | -0.2% | 1.4% | -0.8% | 0.5% |
| March 2007 | 0.6% | -0.6% | 1.3% | -0.9% | 1.0% |
| April 2007 | 0.6% | -0.8% | 1.6% | -1.7% | 1.0% |
| May 2007 | 0.7% | -0.6% | 2.8% | -2.5% | 1.1% |
| June 2007 | 1.1% | -0.8% | 4.0% | -3.2% | 1.6% |
| July 2007 | 1.2% | -0.5% | 4.3% | -2.7% | 1.7% |
| August 2007 | 1.3% | -0.2% | 5.0% | -2.8% | 1.8% |
| September 2007 | 1.5% | -0.6% | 4.1% | -3.2% | 2.2% |
| October 2007 | 1.8% | -0.8% | 4.1% | -3.8% | 2.7% |
| November 2007 | 2.0% | -0.9% | 4.2% | -4.2% | 2.9% |
| December 2007 | 2.0% | -1.0% | 5.7% | -5.4% | 3.0% |
| January 2008 | 2.2% | 0.0% | 7.9% | -4.7% | 2.9% |
| February 2008 | 2.6% | 0.0% | 10.5% | -5.8% | 3.5% |
| March 2008 | 2.7% | 0.1% | 11.4% | -6.2% | 3.5% |
| April 2008 | 2.7% | 0.1% | 12.5% | -6.6% | 3.5% |
| May 2008 | 2.9% | 1.1% | 13.4% | -4.7% | 3.4% |
| June 2008 | 2.8% | 1.2% | 12.3% | -4.2% | 3.3% |
| July 2008 | 2.7% | 0.5% | 13.1% | -6.4% | 3.4% |
| August 2008 | 2.7% | 0.7% | 14.2% | -5.5% | 3.4% |
| September 2008 | 3.3% | 1.2% | 14.7% | -5.7% | 3.9% |
| October 2008 | 3.3% | 0.4% | 13.3% | -6.1% | 4.3% |
| November 2008 | 2.8% | -0.2% | 14.5% | -8.0% | 3.8% |
| December 2008 | 2.6% | -1.2% | 10.5% | -7.7% | 3.8% |
| January 2009 | 1.7% | -4.3% | 9.8% | -12.2% | 3.7% |
| February 2009 | 1.3% | -5.1% | 6.5% | -12.2% | 3.3% |
| March 2009 | 1.1% | -6.2% | 5.0% | -13.1% | 3.4% |
| April 2009 | 1.1% | -6.0% | 4.2% | -12.0% | 3.3% |
| May 2009 | 1.0% | -7.4% | 4.2% | -14.7% | 3.6% |
| June 2009 | 0.8% | -7.4% | 5.7% | -15.6% | 3.4% |
| July 2009 | 0.7% | -8.5% | 3.6% | -16.4% | 3.7% |
| August 2009 | 0.9% | -8.5% | 4.7% | -16.8% | 3.9% |
| September 2009 | 1.2% | -7.1% | 6.5% | -15.5% | 3.8% |
| October 2009 | 1.1% | -7.2% | 7.8% | -15.9% | 3.8% |
| November 2009 | 1.6% | -7.0% | 6.6% | -15.0% | 4.4% |
| December 2009 | 1.4% | -7.8% | 7.6% | -16.4% | 4.3% |
| January 2010 | 1.6% | -8.0% | 8.5% | -16.9% | 4.6% |
| February 2010 | 1.8% | -7.4% | 8.4% | -16.5% | 4.7% |
| March 2010 | 1.9% | -6.8% | 9.1% | -16.3% | 4.6% |
| April 2010 | 2.2% | -7.0% | 11.2% | -17.4% | 5.1% |
| May 2010 | 2.4% | -6.7% | 11.3% | -16.8% | 5.3% |
| June 2010 | 2.8% | -6.8% | 11.4% | -16.9% | 5.8% |
| July 2010 | 2.8% | -6.2% | 11.2% | -16.2% | 5.6% |
| August 2010 | 3.0% | -5.7% | 12.5% | -16.5% | 5.7% |
| September 2010 | 2.8% | -6.2% | 11.7% | -16.4% | 5.6% |
| October 2010 | 3.0% | -5.2% | 13.4% | -15.4% | 5.7% |
| November 2010 | 3.1% | -5.9% | 13.8% | -16.7% | 6.0% |
| December 2010 | 3.3% | -5.0% | 12.6% | -14.4% | 5.9% |
| January 2011 | 3.7% | -4.3% | 13.8% | -14.1% | 6.2% |
| February 2011 | 3.7% | -4.3% | 13.8% | -14.0% | 6.3% |
| March 2011 | 3.7% | -4.1% | 15.4% | -14.6% | 6.2% |
| April 2011 | 3.9% | -4.8% | 14.0% | -14.8% | 6.7% |
| May 2011 | 4.0% | -5.0% | 14.6% | -15.9% | 6.9% |
| June 2011 | 4.2% | -4.8% | 15.1% | -15.7% | 7.1% |
| July 2011 | 4.3% | -4.4% | 17.1% | -15.2% | 7.1% |
| August 2011 | 4.4% | -4.9% | 16.0% | -14.7% | 7.3% |
| September 2011 | 4.6% | -5.1% | 16.2% | -16.0% | 7.6% |
| October 2011 | 4.4% | -6.0% | 15.0% | -18.0% | 7.7% |
| November 2011 | 4.3% | -5.2% | 16.6% | -17.5% | 7.3% |
| December 2011 | 4.4% | -4.8% | 15.8% | -16.6% | 7.4% |
| January 2012 | 4.4% | -4.5% | 15.2% | -16.2% | 7.3% |
| February 2012 | 4.4% | -4.1% | 16.2% | -15.9% | 7.2% |
| March 2012 | 4.9% | -3.7% | 16.6% | -15.4% | 7.6% |
Source: Statistics Canada, Labour Force Survey.
2.3 Wages
Wage payments determine the premiums paid by employers and employees, as well as the level of benefits that EI claimants can receive, calculated as a proportion of a claimant's wage payments up to the maximum insurable earnings amount ($44,200 in 2011 and $45,900 in 2012).
According to the Survey of Employment, Payroll and Hours, the average weekly earnings Footnote 11 of employees Footnote 12 were $854 in 2011/12, up by 1.8% from the previous year.
As indicated in Chart 11, at the provincial level, average weekly earnings rose in every province, led by growth in Newfoundland and Labrador (+4.9%) and Saskatchewan (+3.9%). The lowest rate of growth was in Nova Scotia (+0.4%). Alberta had the highest average weekly earnings with $996, followed by Ontario at $875, Newfoundland and Labrador at $868 and Saskatchewan at $857. The average weekly earnings in the remaining provinces were lower than the national average of $854.
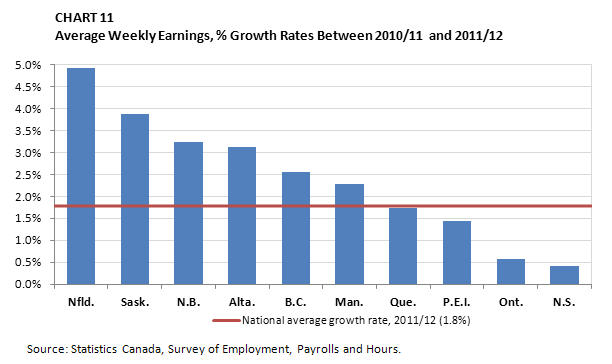
Table equivalent for Chart 11
| Province | 2010/11 | 2011/12 | % Change |
|---|---|---|---|
| Nfld. | $827 | $868 | 4.9% |
| Sask. | $825 | $857 | 3.9% |
| N.B. | $752 | $776 | 3.2% |
| Alta. | $966 | $996 | 3.1% |
| B.C. | $806 | $827 | 2.6% |
| Man. | $775 | $793 | 2.3% |
| Que. | $775 | $788 | 1.7% |
| P.E.I. | $706 | $716 | 1.4% |
| Ont. | $870 | $875 | 0.6% |
| N.S. | $744 | $747 | 0.4% |
Source: Statistics Canada, Labour Force Survey.
Among industries, employees in the forestry, fishing, mining, quarrying, oil and gas industries had the highest average weekly earnings ($1,604) in 2011/12, followed closely by workers in the utilities industry ($1,542). Employees in accommodation and food services industry had the lowest average weekly earnings ($354).
2.4 Hours Worked
Eligibility requirements for EI benefits are based on the number of insurable hours worked in the previous year. In 2011/12, the average hours worked per week increased slightly, from 30.4 in 2010/11 to 30.5. As illustrated in Chart 12, on average, employees in Alberta and in Newfoundland and Labrador worked the longest weeks (32.1 and 32.0 hours, respectively), almost two hours longer than the national average. Employees in Prince Edward Island worked the fewest number of hours per week in 2011/12, with an average of 29.5 hours.
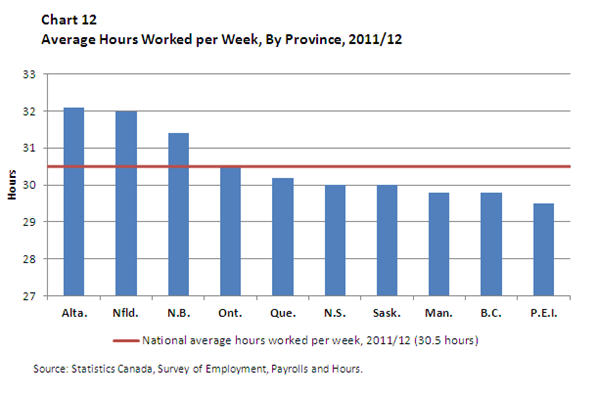
Table equivalent for Chart 12
| Province | Average Hours |
|---|---|
| Alta. | 32.1 |
| Nfld. | 32.0 |
| N.B. | 31.4 |
| Ont. | 30.5 |
| Que. | 30.2 |
| N.S. | 30.0 |
| Sask. | 30.0 |
| Man. | 29.8 |
| B.C. | 29.8 |
| P.E.I. | 29.5 |
| Canada | 30.5 |
3. Unemployment and Unemployment Rate
In 2011/12, there were 1.38 million unemployed individuals in Canada, representing a 5.7% decrease from 2010/11. For the second year in a row, Canada's annual unemployment rate declined, reaching 7.4% in 2011/12, compared with 7.9% in 2010/11 and 8.4% in 2009/10. The unemployment rate in 2011/12 was still 1.4 percentage points higher than the 6.0% observed in 2007/08, one year prior to the onset of the late-2000s recession. However, the unemployment rate in 2011/12 was comparable to the unemployment rate in the early 2000s and lower than it was throughout the 1980s and the 1990s (see Chart 13).
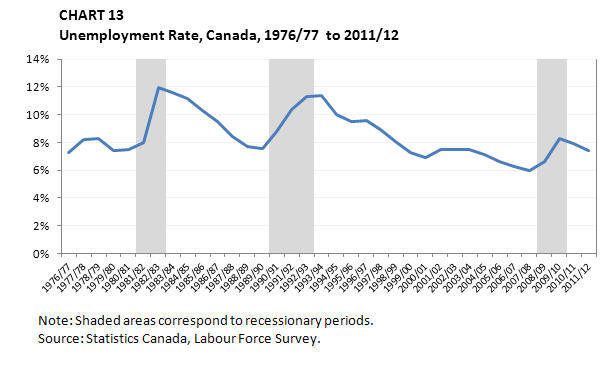
Table equivalent for Chart 13
| Year | Unemployment rate |
|---|---|
| 1976/77 | 7.3% |
| 1977/78 | 8.2% |
| 1978/79 | 8.3% |
| 1979/80 | 7.4% |
| 1980/81 | 7.5% |
| 1981/82 | 8.0% |
| 1982/83 | 12.0% |
| 1983/84 | 11.6% |
| 1984/85 | 11.2% |
| 1985/86 | 10.3% |
| 1986/87 | 9.5% |
| 1987/88 | 8.4% |
| 1988/89 | 7.7% |
| 1989/90 | 7.6% |
| 1990/91 | 8.8% |
| 1991/92 | 10.4% |
| 1992/93 | 11.3% |
| 1993/94 | 11.4% |
| 1994/95 | 10.0% |
| 1995/96 | 9.5% |
| 1996/97 | 9.6% |
| 1997/98 | 8.9% |
| 1998/99 | 8.1% |
| 1999/00 | 7.3% |
| 2000/01 | 6.9% |
| 2001/02 | 7.5% |
| 2002/03 | 7.5% |
| 2003/04 | 7.5% |
| 2004/05 | 7.1% |
| 2005/06 | 6.6% |
| 2006/07 | 6.3% |
| 2007/08 | 6.0% |
| 2008/09 | 6.6% |
| 2009/10 | 8.3% |
| 2010/11 | 7.9% |
| 2011/12 | 7.4% |
The average duration of unemployment, Footnote 13 which reflects the difficulty among the unemployed in finding employment, was 18.6 weeks in 2011/12, remaining stable from the previous year. It represented an increase of 4.7 weeks from 2007/08, before the late-2000s recession. The increase in the average duration of unemployment between 2007/08 and 2011/12, however, was smaller than the increase observed after the early-1980s and early-1990s recessions. The average duration of unemployment increased by 6.7 weeks from 1980/81 to 1984/85 and by 7.7 weeks from 1989/90 to 1993/94 (see Chart 14).
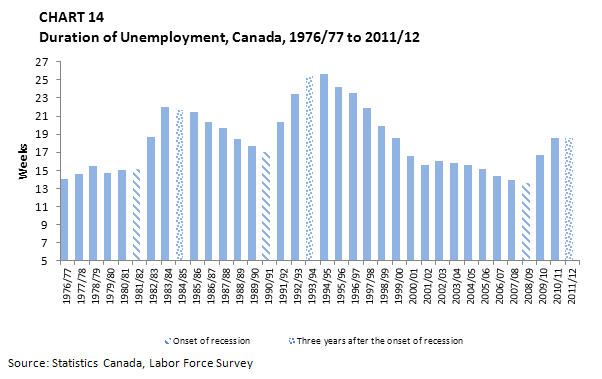
Table equivalent for Chart 14
| Year | Average Duration of Unemployment (Weeks) |
|---|---|
| 1976/77 | 14.0 |
| 1977/78 | 14.6 |
| 1978/79 | 15.5 |
| 1979/80 | 14.7 |
| 1980/81 | 15.0 |
| 1981/82 | 15.2 |
| 1982/83 | 18.7 |
| 1983/84 | 22.0 |
| 1984/85 | 21.7 |
| 1985/86 | 21.4 |
| 1986/87 | 20.4 |
| 1987/88 | 19.7 |
| 1988/89 | 18.5 |
| 1989/90 | 17.7 |
| 1990/91 | 17.0 |
| 1991/92 | 20.3 |
| 1992/93 | 23.4 |
| 1993/94 | 25.4 |
| 1994/95 | 25.7 |
| 1995/96 | 24.2 |
| 1996/97 | 23.6 |
| 1997/98 | 21.9 |
| 1998/99 | 19.9 |
| 1999/00 | 18.6 |
| 2000/01 | 16.6 |
| 2001/02 | 15.6 |
| 2002/03 | 16.0 |
| 2003/04 | 15.8 |
| 2004/05 | 15.6 |
| 2005/06 | 15.2 |
| 2006/07 | 14.4 |
| 2007/08 | 13.9 |
| 2008/09 | 13.6 |
| 2009/10 | 16.7 |
| 2010/11 | 18.6 |
| 2011/12 | 18.6 |
Considering the distribution in terms of the duration of unemployment, in 2011/12, most unemployed people (75.1%) were unemployed for 26 weeks or less, with 33.6% of the unemployed population unemployed for 4 weeks or less. Correspondingly, 20.7% of the total unemployed, or 286,000 unemployed individuals, were unemployed for 27 weeks or more (see Chart 15).
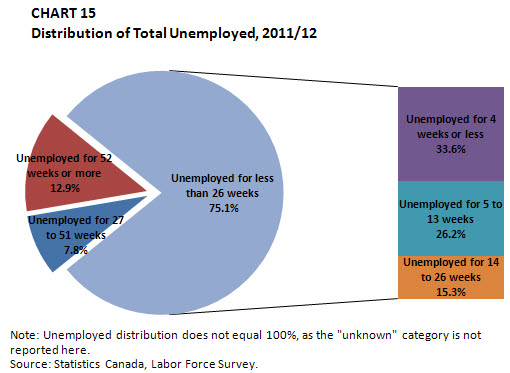
Table equivalent for Chart 15
| Unemployed for 27 to 51 weeks | 7.8% |
|---|---|
| Unemployed for 52 weeks or more | 12.9% |
| Unemployed for less than 26 weeks | 75.1% |
| Unemployed for 1 to 4 weeks | 33.6% |
| Unemployed for 5 to 13 weeks | 26.2% |
| Unemployed for 14 to 26 weeks | 15.3% |
| Duration Unknown | 4.2% |
| Total | 100% |
Among these individuals, 178,300 people were unemployed for over a year and considered to be a long-term unemployed. They represented 12.9% of the unemployed population in 2011/12. This figure rose by 6.0 percentage points between 2007/08 (6.9%), the year before the recession, and 2011/12 (12.9%), three years after the recession. The 6.0 percentage-point increase in the share of the long-term unemployed was lower than the 8.9 percentage-point increase observed following the early-1990s recession (from 7.8% in 1989/90 to 16.7% in 1993/94) and the 6.5 percentage-point increase observed following the early-1980s recession (from 5.3% in 1980/81 to 11.8% in 1984/85) (see Chart 16).
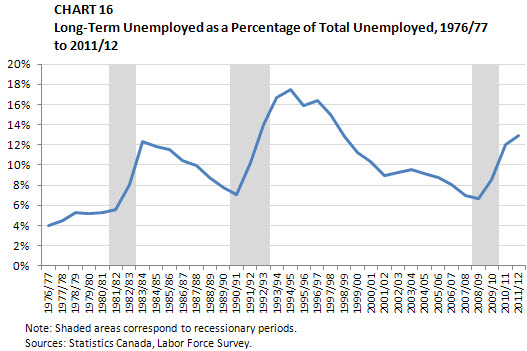
Table equivalent for Chart 16
| Year | % |
|---|---|
| 1976/77 | 4.0% |
| 1977/78 | 4.5% |
| 1978/79 | 5.3% |
| 1979/80 | 5.2% |
| 1980/81 | 5.3% |
| 1981/82 | 5.6% |
| 1982/83 | 8.1% |
| 1983/84 | 12.4% |
| 1984/85 | 11.8% |
| 1985/86 | 11.6% |
| 1986/87 | 10.4% |
| 1987/88 | 9.9% |
| 1988/89 | 8.8% |
| 1989/90 | 7.8% |
| 1990/91 | 7.1% |
| 1991/92 | 10.2% |
| 1992/93 | 14.0% |
| 1993/94 | 16.7% |
| 1994/95 | 17.5% |
| 1995/96 | 15.9% |
| 1996/97 | 16.3% |
| 1997/98 | 15.0% |
| 1998/99 | 12.9% |
| 1999/00 | 11.2% |
| 2000/01 | 10.3% |
| 2001/02 | 9.0% |
| 2002/03 | 9.3% |
| 2003/04 | 9.6% |
| 2004/05 | 9.2% |
| 2005/06 | 8.8% |
| 2006/07 | 8.0% |
| 2007/08 | 6.9% |
| 2008/09 | 6.7% |
| 2009/10 | 8.6% |
| 2010/11 | 12.0% |
| 2011/12 | 12.9% |
3.1 Unemployment Rate, by Province
The unemployment rate declined in seven provinces between 2010/11 and 2011/12. The decreases in Newfoundland and Labrador, Nova Scotia, Ontario, Saskatchewan, Alberta and British Columbia were driven by employment gains, while the decrease in Prince Edward Island was driven by a decline in the provincial labour force figures. The unemployment rate remained unchanged in Quebec, but rose by 0.3 percentage points in New Brunswick due to losses in employment. The slight increase (+0.1 percentage points) in the unemployment rate in Manitoba resulted from growth in the labour force (+0.5 percentage points) that was stronger than growth in employment (+0.4 percentage points).
With the exception of Newfoundland and Labrador, all provincial unemployment rates remained well above the rates observed before the late-2000s recession in 2007/08, with British Columbia showing the largest difference +2.8 percentage points) and Saskatchewan showing the smallest difference (+0.6 percentage points) (see Chart 17).
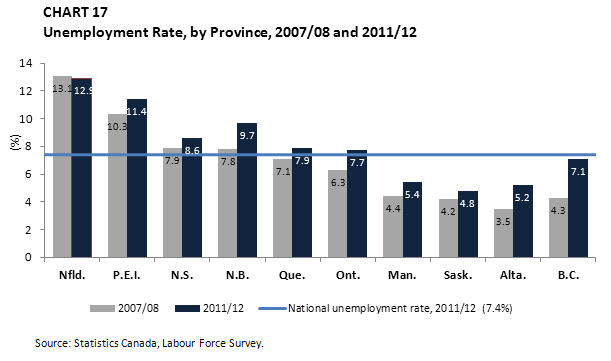
Table equivalent for Chart 17
| Province | 2007/08 | 2011/12 |
|---|---|---|
| Nfld. | 13.1 | 12.9 |
| P.E.I. | 10.3 | 11.4 |
| N.S. | 7.9 | 8.6 |
| N.B. | 7.8 | 9.7 |
| Que. | 7.1 | 7.9 |
| Ont. | 6.3 | 7.7 |
| Man. | 4.4 | 5.4 |
| Sask. | 4.2 | 4.8 |
| Alta. | 3.5 | 5.2 |
| B.C. | 4.3 | 7.1 |
| Canada | 6.0 | 7.4 |
As indicated in Chart 18, the duration of unemployment was the longest in Ontario (20.4 weeks), followed by Quebec and British Columbia (18.8 weeks for both provinces) in 2011/12. The duration of unemployment was below the national average of 18.6 weeks in the remaining provinces. When compared with pre-recession levels in 2007/08, British Columbia reported the largest increase in the average duration of unemployment (+6.8 weeks), followed by Ontario and Alberta (+6.6 weeks for both provinces). These three provinces witnessed some of the largest increases in provincial unemployment rates during the late-2000s recession and had some of the highest differences in their unemployment rates between 2007/08 and 2011/12.
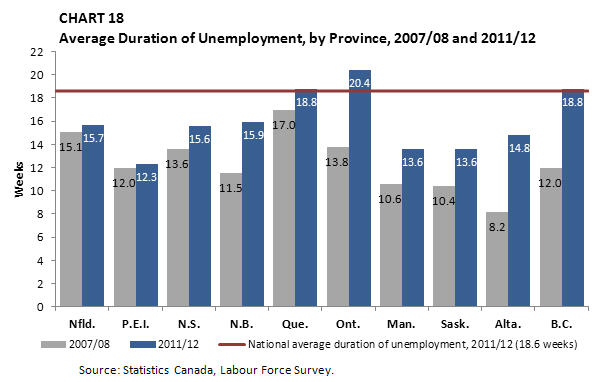
Table equivalent for Chart 18
| 2007/08 | 2011/12 | |
|---|---|---|
| Nfld. | 15.1 | 15.7 |
| P.E.I. | 12.0 | 12.3 |
| N.S. | 13.6 | 15.6 |
| N.B. | 11.5 | 15.9 |
| Que. | 17.0 | 18.8 |
| Ont. | 13.8 | 20.4 |
| Man. | 10.6 | 13.6 |
| Sask. | 10.4 | 13.6 |
| Alta. | 8.2 | 14.8 |
| B.C. | 12.0 | 18.8 |
| Canada | 13.9 | 18.6 |
3.2 Unemployment Rate, by Gender
In 2011/12, the unemployment rate for men fell by 0.7 percentage points to 7.7%, after registering a decline of 1.1 percentage points in 2010/11. The unemployment rate for women also declined in 2011/12, falling by 0.3 percentage points to 6.9%, after remaining relatively stable (+0.1 percentage points) the previous year. For men and women, the unemployment rates were 1.4 and 1.3 percentage points higher than in 2007/08, respectively, when the unemployment rates were at their lowest in comparable records (see Chart 19).
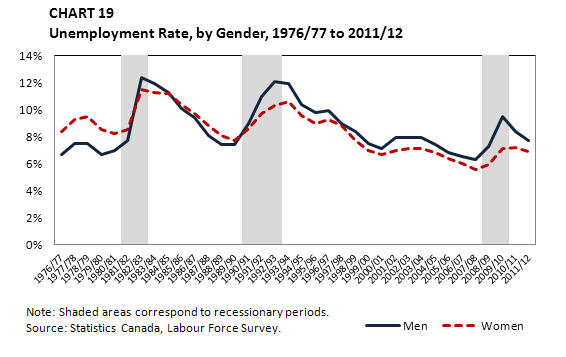
Table equivalent for Chart 19
| Year | Men | Women |
|---|---|---|
| 1976/77 | 6.7% | 8.4% |
| 1977/78 | 7.5% | 9.3% |
| 1978/79 | 7.5% | 9.5% |
| 1979/80 | 6.7% | 8.5% |
| 1980/81 | 7.0% | 8.2% |
| 1981/82 | 7.7% | 8.5% |
| 1982/83 | 12.4% | 11.5% |
| 1983/84 | 11.9% | 11.3% |
| 1984/85 | 11.3% | 11.2% |
| 1985/86 | 10.1% | 10.4% |
| 1986/87 | 9.4% | 9.7% |
| 1987/88 | 8.1% | 8.8% |
| 1988/89 | 7.4% | 8.1% |
| 1989/90 | 7.4% | 7.7% |
| 1990/91 | 9.0% | 8.6% |
| 1991/92 | 11.0% | 9.7% |
| 1992/93 | 12.1% | 10.3% |
| 1993/94 | 11.9% | 10.6% |
| 1994/95 | 10.4% | 9.6% |
| 1995/96 | 9.8% | 9.0% |
| 1996/97 | 9.9% | 9.3% |
| 1997/98 | 9.0% | 8.8% |
| 1998/99 | 8.4% | 7.7% |
| 1999/00 | 7.5% | 7.0% |
| 2000/01 | 7.1% | 6.7% |
| 2001/02 | 7.9% | 7.0% |
| 2002/03 | 7.9% | 7.1% |
| 2003/04 | 7.9% | 7.1% |
| 2004/05 | 7.4% | 6.8% |
| 2005/06 | 6.8% | 6.4% |
| 2006/07 | 6.5% | 6.0% |
| 2007/08 | 6.3% | 5.6% |
| 2008/09 | 7.3% | 5.9% |
| 2009/10 | 9.5% | 7.1% |
| 2010/11 | 8.4% | 7.2% |
| 2011/12 | 7.7% | 6.9% |
Prior to the early-1980s recession, the unemployment rate for women had been higher than that for men. However, during the early 1980s, men experienced significantly higher unemployment rates than did women and the gender unemployment rate gap reversed. The early-1990s recession again hit men harder than women, and the unemployment rate gap increased to 1.8 percentage points in 1992/93. During the late-2000s recession, the unemployment rate for men jumped to 9.5% and the unemployment rate gender gap reached 2.4 percentage points, exceeding the gaps that prevailed during the early-1980s and early-1990s recessions.
As shown in Chart 19, however, the gender unemployment rate gap falls when economic recoveries take hold. For example, the gender unemployment rate gap fell from 0.9% to 0.1% following the early-1980s recession, while it fell from 1.8% to 1.3% following the early-1990s recession. Similar patterns were observed in the late-2000s recession, as the gender unemployment gap fell from 2.4 percentage points in 2009/10 to 1.2 percentage points in 2010/11 and to 0.8 percentage points in 2011/12.
The average duration of unemployment has almost always been higher for men than for women during the past three decades, as illustrated in Chart 20. In 2011/12, the average duration of unemployment was 19.4 weeks for men and 17.6 weeks for women. For both genders, the highest average unemployment duration was recorded in 1994/95, when men were unemployed on average for over half a year (27.4 weeks) and women for 23.6 weeks.
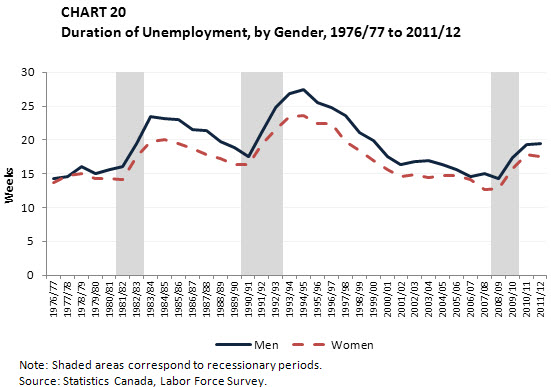
Table equivalent for Chart 20
| Year | Men | Women |
|---|---|---|
| 1976/77 | 14.3 | 13.7 |
| 1977/78 | 14.6 | 14.7 |
| 1978/79 | 16.0 | 15.0 |
| 1979/80 | 15.1 | 14.3 |
| 1980/81 | 15.6 | 14.3 |
| 1981/82 | 16.1 | 14.2 |
| 1982/83 | 19.4 | 17.6 |
| 1983/84 | 23.5 | 19.8 |
| 1984/85 | 23.1 | 20.0 |
| 1985/86 | 23.0 | 19.4 |
| 1986/87 | 21.6 | 18.8 |
| 1987/88 | 21.4 | 17.8 |
| 1988/89 | 19.8 | 17.2 |
| 1989/90 | 18.9 | 16.3 |
| 1990/91 | 17.6 | 16.4 |
| 1991/92 | 21.1 | 19.3 |
| 1992/93 | 24.8 | 21.5 |
| 1993/94 | 26.9 | 23.4 |
| 1994/95 | 27.4 | 23.6 |
| 1995/96 | 25.6 | 22.5 |
| 1996/97 | 24.8 | 22.4 |
| 1997/98 | 23.6 | 19.8 |
| 1998/99 | 21.1 | 18.4 |
| 1999/00 | 19.9 | 17.0 |
| 2000/01 | 17.5 | 15.6 |
| 2001/02 | 16.4 | 14.6 |
| 2002/03 | 16.8 | 14.9 |
| 2003/04 | 16.9 | 14.5 |
| 2004/05 | 16.3 | 14.7 |
| 2005/06 | 15.6 | 14.7 |
| 2006/07 | 14.6 | 14.1 |
| 2007/08 | 15.0 | 12.6 |
| 2008/09 | 14.3 | 12.8 |
| 2009/10 | 17.4 | 15.7 |
| 2010/11 | 19.3 | 17.8 |
| 2011/12 | 19.4 | 17.6 |
3.3 Unemployment Rate, by Age Group
In 2011/12, the unemployment rate fell across all three major age groups. The unemployment rate for youth (aged 15 to 24) fell slightly from 14.6% in 2010/11 to 14.2% in 2011/12. This decline was attributable to the slight increase of 0.3% in employment.
Older workers (55 years of age and older) also experienced a slight decline in their unemployment rate, from 6.4% in 2010/11 to 6.2% in 2011/12. The slight decrease in the unemployment rate in this age group resulted from growth in labour force figures (+3.7%) that countered the slight rise in unemployment (+0.3%). The unemployment rate for core-aged workers (aged 25 to 54) decreased from 6.7% to 6.1%, which reflected a decrease in unemployment (-8.5%), as their labour force numbers remained relatively stable (+0.2%).
In general, unemployment spells last longer for people in older cohorts (see Chart 21). In 2011/12, youth had the shortest average unemployment duration (10.9 weeks), while older workers had the longest (26.7 weeks). While older workers are less likely to be unemployed than their younger counterparts, if they do become unemployed, they tend to remain unemployed for a longer period.
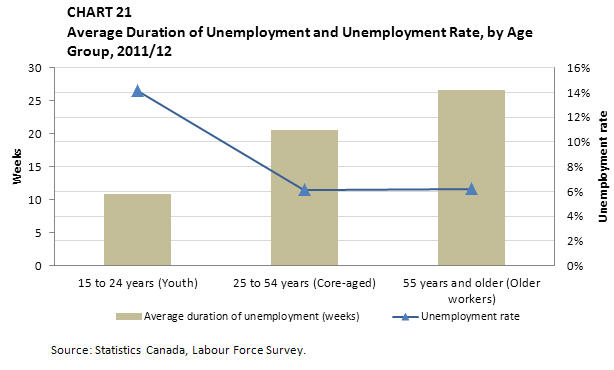
Table equivalent for Chart 21
| Age | Unemployment rate | Average duration of unemployment (weeks) |
|---|---|---|
| 15 to 24 years (Youth) | 14.2% | 10.9 |
| 25 to 54 years (Core-aged) | 6.1% | 20.6 |
| 55 years and older (Older workers) | 6.2% | 26.7 |
3.4 Unemployment Rate, by Educational Attainment
The unemployment rate tends to be inversely related to educational attainment—the higher the level of education attained, the lower the unemployment rate tends to be for that cohort. Correspondingly, the unemployment rate among individuals with a university degree Footnote 14 was 4.9% in 2011/12, compared with 5.9% among those with a post-secondary certificate or diploma. Footnote 15 On the other hand, the unemployment rate was 8.2% for high school graduates Footnote 16 and 15.1% among those who did not complete high school. Footnote 17
During the late-2000s recession, the unemployment rate for individuals who did not complete high school increased by 4.1 percentage points from 2007/08 to 2009/10, while it increased by only 1.5 percentage points for those with a university degree during the same period. A similar pattern was observed during the early-1990s recession (see Chart 22).

Table equivalent for Chart 22
| Year | Less than high school | High school | University degree | Post-secondary certificate or diploma |
|---|---|---|---|---|
| 1990/91 | 13.3% | 8.5% | 3.9% | 7.0% |
| 1991/92 | 15.4% | 10.4% | 5.2% | 8.4% |
| 1992/93 | 17.3% | 11.1% | 5.5% | 9.4% |
| 1993/94 | 17.1% | 11.4% | 5.9% | 9.7% |
| 1994/95 | 15.7% | 9.8% | 5.2% | 8.6% |
| 1995/96 | 15.1% | 9.5% | 5.0% | 7.9% |
| 1996/97 | 15.4% | 9.8% | 5.2% | 8.0% |
| 1997/98 | 15.4% | 9.0% | 4.6% | 7.1% |
| 1998/99 | 14.2% | 8.4% | 4.3% | 6.4% |
| 1999/00 | 13.1% | 7.5% | 4.1% | 5.6% |
| 2000/01 | 12.7% | 7.0% | 4.0% | 5.3% |
| 2001/02 | 13.5% | 7.5% | 4.8% | 5.9% |
| 2002/03 | 13.7% | 7.7% | 5.0% | 5.8% |
| 2003/04 | 13.7% | 7.8% | 5.4% | 5.8% |
| 2004/05 | 13.2% | 7.3% | 4.8% | 5.5% |
| 2005/06 | 12.3% | 6.9% | 4.5% | 5.3% |
| 2006/07 | 12.3% | 6.5% | 3.8% | 5.0% |
| 2007/08 | 12.0% | 6.3% | 3.7% | 4.8% |
| 2008/09 | 12.9% | 7.3% | 4.3% | 5.3% |
| 2009/10 | 16.1% | 9.5% | 5.2% | 6.9% |
| 2010/11 | 15.7% | 8.9% | 5.1% | 6.4% |
| 2011/12 | 15.1% | 8.2% | 4.9% | 5.9% |
3.5 Share of Unemployment, by Reason for Unemployment
There are a number of reasons for which an individual may experience an interruption in employment. The reason for the interruption is a key factor in determining eligibility for EI regular benefits, which are generally only available to individuals who have lost their jobs through no fault of their own or left their jobs with just cause. Footnote 18
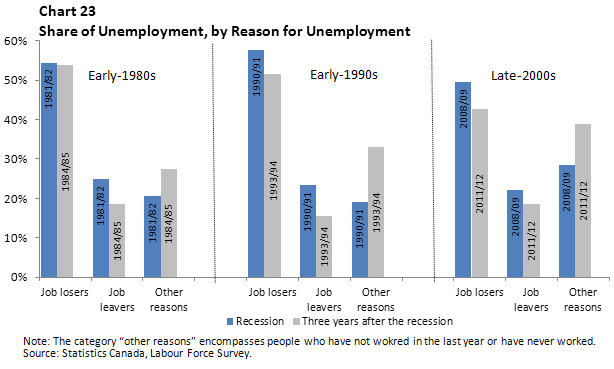
Table equivalent for Chart 23
| Early-1980s Recession | Early-1990s Recession | Late-2000s Recession | |||||||||
|---|---|---|---|---|---|---|---|---|---|---|---|
| Job losers | Job leavers | Other reasons | Job losers | Job leavers | Other reasons | Job losers | Job leavers | Other reasons | |||
| Recession | 54.5% | 25.0% | 20.5% | 57.6% | 23.4% | 19.0% | 49.4% | 22.0% | 28.5% | ||
| Three years after the recession | 53.8% | 18.6% | 27.5% | 51.5% | 15.5% | 33.0% | 42.7% | 18.5% | 38.8% | ||
As indicated in Chart 23, individuals who became unemployed because they lost their jobs (job losers) Footnote 19 accounted for the largest share of unemployment during recessionary periods in the past three decades (54.5% in 1981/82, 57.6% in 1990/91 and 49.4% in 2008/09). However, these figures declined in each of the subsequent recovery periods. For example, job losers accounted for 42.7% of the unemployed population in 2011/12, declining by 6.7 percentage points in the three years following the onset of the late-2000s recession.
In contrast, there was a significant increase in the share of the unemployed who had not worked in the last year or had never worked (indicated as "other reasons" in Chart 23). Moreover, during and following the late-2000s recession, this category accounted for a larger share of total unemployment than it did during and following the previous two recessions. For example, in 2008/09, the share of the unemployed who had not worked in last year or had never worked was 28.5%, higher than the figures observed in 1990/91 (19.0%) and 1981/82 (20.5%).
In 2011/12, the share of the unemployed who voluntarily left their jobs (job leavers) Footnote 20 had decreased by 3.5 percentage points from 2008/09, to reach 18.5%. This decrease was a smaller decrease than those in the years following the previous two recessions. In 1993/94 and 1984/85, this share fell by 7.9 and 6.4 percentage points, respectively, from the onset of the recessions in 1990/91 and 1981/82.
3.6 Job Vacancies and Unemployment-to-Job-Vacancy Ratio Footnote 21
In 2011/12, there were 239,370 vacant jobs on average in Canada. For every job vacancy, there was an average of 5.8 unemployed people. As indicated in Chart 24, the Prairie provinces registered the lowest ratios of unemployed people to job vacancies, while the Atlantic provinces had the highest ratios.
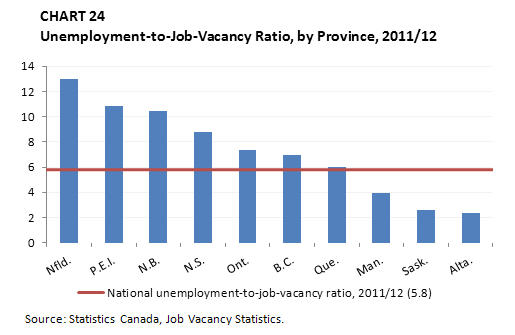
Table equivalent for Chart 24
| Nfld. | 13.0 |
|---|---|
| P.E.I. | 10.9 |
| N.B. | 10.5 |
| N.S. | 8.8 |
| Ont. | 7.3 |
| B.C. | 7.0 |
| Que. | 6.0 |
| Man. | 3.9 |
| Sask. | 2.6 |
| Alta. | 2.4 |
| Canada | 5.8 |
In 2011/12, there were, on average, 1.2 unemployed people per job vacancy in the health care and social assistance industry, the lowest unemployed-to-job-vacancy ratio among the 10 largest industries. Meanwhile, the construction industry had the highest unemployment-to-job-vacancy ratio among the 10 largest industries, with 8.2 unemployed people for every vacant job (see Chart 25).
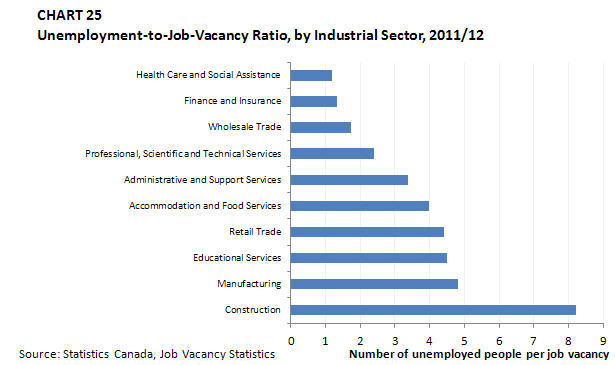
Table equivalent for Chart 25
| Construction | 8.2 |
|---|---|
| Manufacturing | 4.8 |
| Educational Services | 4.5 |
| Retail Trade | 4.4 |
| Accommodation and Food Services | 4.0 |
| Administrative and Support Services | 3.4 |
| Professional, Scientific and Technical Services | 2.4 |
| Wholesale Trade | 1.7 |
| Finance and Insurance | 1.3 |
| Health Care and Social Assistance | 1.2 |
Page details
- Date modified: