
EI Monitoring and Assessment Report 2012Chapter 3: Impacts and Effectiveness of Employment Benefits and Support Measures (EBSMs—EI Part II)
Notice: Refer to the Table of contents to navigate through the EI Monitoring and Assessment Report .
Activities delivered under Part II of the Employment Insurance Act help Canadians to prepare for, find and maintain employment. These activities include Employment Benefits and Support Measures (EBSMs), pan-Canadian programming and functions of the National Employment Service (NES).
This chapter provides information on the programming delivered under Part II of the Employment Insurance (EI) Act during 2011/12. Section I provides a national overview of EBSM similar programming delivered by provincial and territorial governments (P/Ts) under Labour Market Development Agreements (LMDAs) with the Government of Canada. This analysis also includes clients supported by Part II funding through Aboriginal Skills and Employment Training Strategy (ASETS) agreement holders. Section II summarizes individual P/T employment programming activities in the context of each jurisdiction's labour market conditions and employment priorities. New to this chapter this year, section III summarizes the first annual national quantitative analysis of the medium-term net impacts and outcomes of EBSMs. Section IV focuses on HRSDC's delivery of pan-Canadian activities that are not included in the LMDAs, as well as the administration of certain NES functions.
Notes to Reader
- The data used to analyze EBSM activities were collected from provinces, territories and ASETS agreement holders. Accordingly, the data were processed through several systems using a variety of sources. Governments continue to improve data quality and collection to ensure accurate, reliable and consistent information. While all data sets are verified before publication, systems and operational changes may affect the comparability of data from year to year. These instances are noted, where applicable.
- Throughout this chapter, the 2007/08 fiscal year is used as the reference period for pre-recession comparisons. References to average levels of activity, historic averages, and highs and lows use the 10-year period from 2002/03 to 2011/12 as a frame of reference.
- Statistics Canada's Labour Force Survey is the source of labour market data reported herein. Data for Canada and the provinces are fiscal-year averages, calculated using unadjusted data, while monthly references are seasonally adjusted. Data for the Northwest Territories, Yukon and Nunavut are calculated using four points of three-month moving average data. In discussions of employment trends by industry, standard industry titles are taken from the North American Industry Classification System (NAICS).
I. NATIONAL OVERVIEW
In 2011/12, EBSM-similar programming activity (clients served, interventions and expenditures, as well as key performance indicators) declined in most parts of the country, returning to levels at or near those reached in 2007/08, before the late 2000's recession. These declines are attributed to a combination of two factors: the return to more positive labour market conditions and the end of Economic Action Plan funding.
Labour Market Conditions
In many parts of the country, 2011/12 saw continued improvement in labour market conditions, with average national employment growth of 1.3%. Stronger labour markets generally reduce the demand for training, particularly for active claimants with stronger labour market attachment. These individuals are more likely to be close to job ready and therefore are more apt to take advantage of emerging employment opportunities or seek quick Employment Assistance Services (EAS) interventions, rather than opting for longer term Employment Benefits activities.
Economic Action Plan Funding
In response to the economic downturn that began in 2008, the Government of Canada announced its Economic Action Plan (EAP), which included measures to temporarily support unemployed workers. As part of the EAP, the government invested an additional $500 million in each of two fiscal years—2009/10 and 2010/11—to augment regular LMDA funding. P/Ts used these funds, which amounted to a 24% increase in regular LMDA funds over the two fiscal years, to address the rising demand for employment programming prompted by the downturn. In 2011/12, LMDA allocations returned to their regular level.
Canada: EBSM Key Facts
| EI | Non-Insured | Pan-Canadian |
|---|---|---|
416,935
|
214,587
|
14,773
|
| Active | Former | Non-Insured |
| 50.6%
|
16.2%
|
33.2%
|
| Youth (15-24)1 |
Core Age (25-54) |
Older Workers (55+) |
| 19.8%
|
69.9% - | 10.2%
|
| 2011/12 | Year-over-Year Change |
|
|---|---|---|
| Employment Benefits | 159,279 | 18.1%
|
| Support Measures: EAS | 788,779 | 18.3%
|
| Pan-Canadian | 14,615 | 8.5%
|
| 2011/12 | Year-over-Year Change |
|
|---|---|---|
| Employment Benefits | 16.8% | 0.0 - |
| Support Measures: EAS | 83.2% | 0.0 - |
| 2011/12 ($ Million) |
Year-over-Year Change |
|
|---|---|---|
| Employment Benefits | $1,220.6 | 18.2%
|
| Support Measures: EAS | $565.8 | 26.0%
|
| LMPs and R&I | $149.0 | 12.5%
|
| Pan-Canadian | $156.9 | 2.0%
|
| Indicator | Total |
|---|---|
| Active Claimants Served | 326,892 |
| Returns to Employment | 185,029 |
| Unpaid Benefits ($ Million) | $1,002.9 |
1 Age distribution does not equal 100%, as the "unknown" category is not reported here. Date of birth is not collected for clients in SD-Apprentices and Group Services.
2 Totals may not add due to rounding; does not include accounting adjustments.
This year, P/Ts and Aboriginal organizations helped 646,295 clients to prepare for, obtain and maintain employment. As could be expected, given stronger labour market conditions and the return to regular funding levels, this total represented a decrease of 14.5% compared with 2010/11. At the same time, it was substantially higher than the number of clients served in 2007/08 (612,622), before the EAP. These clients participated in 962,673 interventions, which was 18.1% lower than the total in 2010/11 but still comparable to activity in 2007/08. While the mix of Employment Benefits and EAS interventions was unchanged year over year, the EAS share of total interventions was significantly higher than the historic average and was up 3.7 percentage points from the pre-recession level. At the same time, the growing emphasis on apprenticeships meant that the number of Skills Development-Apprentices interventions was at or above pre-recession levels in most parts of the country. Conversely, Skills Development-Regular interventions reached a 10-year low and also accounted for their lowest share of Employment Benefits interventions in the last 10 years. Total expenditures for EBSM-similar programming fell at a faster rate than did the number of both clients served and interventions, dropping 19.1% to $2.1 billion.
1. Canada's Labour Market
As noted above, the national labour market regained strength in 2011/12. The labour force expanded modestly (+0.8%), while employment continued the recovery that began in 2010/11, climbing 1.3% to 17,345,900, the highest level observed since the beginning of the time series in 1976/77. Record highs were also seen in 11 jurisdictions across the country. Canada's employment gains were concentrated in full-time employment, offsetting a small loss in part-time work. Since employment growth outpaced the labour force expansion, unemployment decreased, and Canada's unemployment rate fell 0.5 percentage points to 7.4%. Unemployment rates in nine jurisdictions decreased or remained stable year over year.
2. Client Profile and Participation
As noted, the number of clients served was 14.5% lower year over year. There were also changes in the mix of clients served by client type, age, and equity group.
2.1 Client Types
Three types of clients participate in EBSMs: active claimants, former claimants and non-insured clients. In 2011/12, the distribution of clients served by client type continued to shift, part of a long-term trend that reflects increased demand from former claimants and non-insured clients.
Active claimants, who have an active claim for EI Part I benefits, typically have stronger recent labour force attachment and tend to be able to return to work more quickly than those with weaker ties to the labour market. Active claimants often seek out short-term interventions under EI Part II.
A total of 326,892 active claimants accessed EBSMs, a 12.2% decrease year over year, which, as noted above, reflected strengthening labour market conditions. Moreover, while active claimants' share of total clients served was up slightly year over year, this group's share has declined significantly over the longer term, falling from a high of 63.3% in 2003/04 to 50.6% this year.
Former claimants are no longer eligible for EI Part I; however, they remain eligible for EI Part II under certain criteria Footnote 1 . Since former claimants do not receive Part I income support and are fully supported by Part II, EBSM-similar expenditures increase disproportionately with their level of participation.
In 2011/12, the number of former claimants fell 8.3% to 104,816. However, at 16.2% of all clients served, this client segment reached a 10-year peak in its share of total clients served.
Non-insured clients have no substantive or recent labour force attachment. They include new labour force participants and individuals who were formerly self-employed. While these clients are not eligible for Employment Benefits under EI Part II, they are eligible for the services delivered under EAS.
The number of non-insured clients served fell 20.3% to 214,587, and their share dropped from 35.6% to 33.2%. Despite this year-over-year decline, their share has been trending upwards for the past 10 years and is now significantly higher than the norm for this group.
2.2 Age Distribution Footnote 2
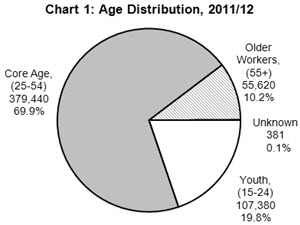
Table equivalent of Chart 1
| Age | 2011/12 | |
|---|---|---|
| # | % | |
| 15–24 Youth | 107,380 | 19.8 |
| 25–54 Core Age | 379,440 | 69.9 |
| 55+ Older Workers | 55,620 | 10.2 |
| Unknown | 381 | 0.1 |
| Total | 542,821 | 100.0 |
There were modest changes in the distribution of clients by age group in 2011/12. Youth (15–24) participation was up slightly year over year, and their share, which has gradually increased over the past several years, climbed to 19.8%. Similarly, older workers (55+) now account for a greater share of total clients served, reaching a 10-year high of 10.2% this year. The share of core-age workers (25–54) has been slipping over the past five years, and fell to 69.9% in 2011/12, compared with a high of 73.0% in 2006/07. These shifts mirror changes in the levels of unemployment of these groups: youth and older workers comprise a growing share of national unemployment, while unemployment among core-age workers has declined as economic conditions have improved.
2.3 Designated Groups Footnote 3
To ensure equity principles are observed in the delivery of EBSM-similar programming, HRSDC monitors the participation of women, persons with disabilities, Aboriginal people and members of visible minority groups.
- Women participated in 430,405 interventions in 2011/12, a decline of 18.2% year over year. Women represented 46.7% of all participants, virtually unchanged from 2010/11 and higher than their share of national unemployment (44.6%).
- Persons with disabilities participated in 55,580 interventions, which was 14.3% lower than the number in 2010/11. Despite the decline, this client group represented 6.0% of all participants in 2011/12, its highest share since 2007/08.
- Aboriginal people participated in 56,316 interventions, a decline of 15.0% year over year. This group's share of total interventions was unchanged at 6.1%.
- Members of visible minority groups participated in 49,546 interventions, a drop of 30.9% compared with 2010/11. After climbing to 6.4% last year, this group's share of total interventions fell back to approximate the pre-recession level of 5.4%.
3. Interventions: Employment Benefits Footnote 4
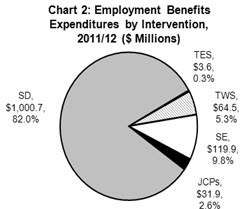
Table equivalent of Chart 2
| Intervention | 2011-2012 | |
|---|---|---|
| ($ Millions) | % | |
| TWS | 64,5 | 5.3 |
| SE | 119,9 | 9.8 |
| JCPs | 31,9 | 2.6 |
| SD | 1,000,7 | 82.0 |
| TES | 3,6 | 0.3 |
| Total | 1,220,6 | 100.0 |
Employment Benefits, which are available to active and former claimants only, generally involve longer term interventions that can last from several weeks to a year or more. Employment Benefits comprise Skills Development-Regular (SD-R), Skills Development-Apprentices (SD-A), Targeted Wage Subsidies (TWS), Self-Employment (SE), Job Creation Partnerships (JCPs) and Targeted Earnings Supplements (TES). A new component of Skills DevelopmentSD-Group (SD-G) was introduced in 2011/12; it is expected that some jurisdictions will start delivering SD-G in 2012/13.
In 2011/12, Employment Benefits interventions fell 18.1% to 159,279. This decline reflected a shift away from longer term interventions toward a focus on quicker returns to work. Employment Benefits accounted for 16.8% of all EBSM interventions delivered in 2011/12, a figure that was unchanged year over year, but significantly lower than the historical average. Employment Benefits expenditures fell 18.2% to $1.22 billion.
3.1 Skills Development
In 2011/12, SD-R interventions fell 31.1% to a 10-year low of 65,234, while SD A interventions fell 3.9% to a four-year low of 61,575. Traditionally, SD accounts for the largest proportion of Employment Benefits interventions and expenditures, and this trend continued in 2011/12, despite the year-over-year declines. SD represented 79.6% of Employment Benefits interventions, down from 81.6% last year. SD expenditures, which fell 19.9% to $1 billion, represented 82.0% of Employment Benefits expenditures, down slightly from 83.6%.
EBSMs in Action: Skills Development
A client applied for SD funding to attend a college certificate program in British Columbia. An undiagnosed learning disability proved to be a barrier to her success, but with counselling and assistance, she was able to remain in the program. While it took a bit longer, this client successfully pursued her career goal and received her certificate.
The Province of Manitoba is dedicated to improving access to Red Seal apprentice designations, essential skills and pre-employment training opportunities in rural, northern and remote areas. Training and job opportunities are focused on mining, roads and dam construction in the north. In 2011/12, Manitoba apprentices and their employers received a boost through the launch of AccessManitoba, a client-centred, online service-delivery system that allows businesses, entrepreneurs and individuals to register for programs and submit online applications.
3.2 Targeted Wage Subsidies
The use of TWS increased in 2011/12, with interventions rising 7.7% to 13,404. TWS' share of all Employment Benefits interventions also increased, climbing from 6.4% to 8.4% year over year. Most of this increase was concentrated in Ontario, as many P/Ts saw declines year over year. TWS expenditures fell 14.9% to $64.5 million, reflecting significant decreases in the average cost per intervention in most P/Ts. This decline is partially attributed to a shorter average TWS duration; in stronger labour markets, employers require less of an incentive to hire lower skilled workers.
EBSMs in Action: Targeted Wage Subsidies
Ontario has integrated its Job Placement with Incentive program into its new Employment Services delivery model. Eligible clients are referred directly to an appropriate job placement to receive valuable on-the-job experience. This new delivery model enabled Ontario to help more clients: in 2011/12, the number of TWS-similar interventions delivered in Ontario more than doubled when compared with the 2010/11 number, climbing from 1,126 to 2,335 (+1,209).
3.3 Self-Employment
Participation in SE decreased significantly in 2011/12, falling to a 10-year low of 7,967 (-30.6%). SE interventions represented 5.0% of all Employment Benefits interventions, down from 5.9% last year. At the same time, SE expenditures fell 3.1% to $119.9 million.
EBSMs in Action: Self-Employment
In the Northwest Territories, eligible clients get help to pursue self-employment or start a business. Support may include money for travel and living expenses, tuition, childcare, and special equipment and supports, as well as mentoring by a qualified business expert. In 2011/12, a client became frustrated at being unable to find and retain long-term employment. With counselling and guidance from a business consultant, combined with financial support, he developed a business plan and is now operating a successful commercial and residential cleaning service.
3.4 Job Creation Partnerships
A total of 3,463 JCP interventions were delivered in 2011/12, a decrease of 19.1% year over year. Since 2002/03, JCP interventions have declined 67.1%. JCPs' share of total benefit interventions has also fallen, dropping from 5.7% in 2002/03 to 2.2%. JCP expenditures fell 22.1% to $31.9 million.
3.5 Targeted Earnings Supplements
Quebec offers TES-similar programming through its Return to Work Supplement program. This program provides financial assistance to participants for expenses related to returning to work, such as the cost of new tools and clothing. This TES-similar benefit supported 7,636 participants in 2011/12, a 1.0% increase year over year. Quebec's total expenditure for this benefit fell 6.5% to $3.6 million.
4. Interventions: Support Measures
The Support Measures authorized by Part II of the EI Act comprise Employment Assistance Services (EAS), Labour Market Partnerships (LMPs), and Research and Innovation (R&I). Through LMDAs, P/Ts are responsible for delivering these measures at the regional and local levels, while HRSDC retains responsibility for pan-Canadian delivery of LMPs and R&I (see section IV). Support Measures are available to all unemployed individuals in Canada, including non-insured clients, though LMPs and R&I are generally not associated with direct client service and therefore do not have participants or interventions.
4.1 EAS Interventions
To assist all unemployed individuals, P/Ts design and deliver services similar to EAS. These interventions are usually reported in one of three categories: Employment Services, Group Services and Individual Counselling. In total, 788,799 EAS interventions were delivered in 2011/12, which was a decline of 18.3% year over year but still markedly higher than the levels seen in the years prior to the late 2000's recession. EAS expenditures fell 26.0% to $565.8 million.
EBSMs in Action: Employment Assistance Services
In the Dehcho and North Slave regions of the Northwest Territories, the Conseil de développement économique des Territoires du Nord Ouest received EAS funding to complement existing employment programming by offering complete, high-quality services to French-speaking individuals.
4.1.1 Employment Services
A total of 492,394 Employment Services interventions were delivered in 2011/12, which was 19.3% lower than the previous year but 10.7% higher than the pre recession level. Employment Services traditionally account for the majority of EAS interventions, and this pattern continued in 2011/12, as these interventions represented 62.4% of all EAS interventions.
EBSMs in Action: Employment Assistance Services
In 2011/12, BC prepared to open a new network of 85 WorkBC Employment Services Centres and 114 satellite offices that will offer a full suite of employment programs while ensuring quick and easy access through a single door. Employment advisors will provide job seekers with a range of services from needs assessment to building their resumes, taking additional training, or developing other skills that will help them find success in their job search. People living in smaller communities, as well as specialized populations (including immigrants, youth, Aboriginal people, francophones, people with multiple barriers, survivors of violence and/or abuse, people with disabilities and people living in rural and remote areas) will have access to the full suite of employment services.
4.1.2 Group Services
At 40,391, the number of Group Services interventions fell 21.4% year over year but was 12.8% higher than the pre-recession level. Group Services' share of total EAS interventions was slightly lower at 5.1%, compared with 5.3% in 2010/11
EBSMs in Action: Employment Assistance Services
EAS funding helps many Nova Scotia agencies and organizations provide job resource centres, case management services and workshops across the province. A long-tenured worker with no formal education or certification approached a job resource centre for assistance. Through assessments, research, conversations with employers and training facilities, and coaching from centre staff, he decided that he would enjoy working in a trade. His plan of action was formed: if he completed high school at the adult high school, focusing on science and math, he would qualify for acceptance into a trades training program, with financial support to attend training. He subsequently graduated class valedictorian and is now on his way to a new career.
4.1.3 Individual Counselling
The number of Individual Counselling interventions fell 15.6% to 255,994. Individual Counselling represented 32.5% of all EAS interventions, up from 31.4% last year.
4.2 Labour Market Partnerships
The LMP measure is designed to enable employers, employee and employer associations, community groups, and communities to work together to develop and implement strategies to deal with labour force adjustments and meet human resources requirements. In 2011/12, P/Ts allocated $147.2 million to LMPs, which was a year-over-year decrease of 12.5%.
EBSMs in Action: Labour Market Partnerships
With the economy changing and workplaces adjusting accordingly, women in New Brunswick need resilience to cope with demanding times and new skills to excel in the workplace. To understand and analyze the changing learning and development needs of women leaders and translate these needs into specific actions for leadership development, New Brunswick used LMP funds to support three provincial focus groups. As a result, a provincial advisory board consisting of leading New Brunswick women's organizations was formed to help develop programs to meet the needs identified in the focus groups and to develop funding and marketing strategies.
In Ontario, the Council for Automotive Human Resources (CAHR) used LMP funding to provide tools and resources to help workers in the vehicle manufacturing industry adapt to changes in their work environment, and continuously upgrade their knowledge, skills and competencies through lifelong learning.
4.3 Research and Innovation
Research and Innovation (R&I) initiatives are designed to identify better ways of helping people prepare for, return to, or maintain employment, and participate productively in the labour force. The total P/T investment in R&I initiatives was $1.8 million in 2011/12, an 11.5% drop from 2010/11.
EBSMs in Action: Research and Innovation
Manitoba used R&I funds to assess the needs of the core client groups that access labour market services. The goal of this project was to provide a perspective on the needs and characteristics of Manitoba's client groups, helping to inform future policy and program development and resource allocation. The primary objectives of this research were to identify Manitoba's main client groups and their characteristics as they relate to employment service needs; assess the extent to which Manitoba is meeting the employment service needs of its clients; and analyze the demand for programs and services by client segment. Manitoba has recently received the final report detailing the findings of the research. It is using the study to develop enhanced service delivery models to more effectively meet the needs of its clients, in alignment with labour market demand.
5. Expenditures
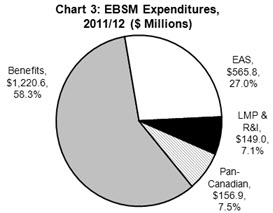
Table equivalent of Chart 3
| 2011-2012 | ||
|---|---|---|
| Expenditures | ($ Millions) | % |
| Benefits | $1,220,6 | 58.3% |
| EAS | $565,8 | 27.0% |
| LMP & R&I | $149,0 | 7.1% |
| Pan-Canadian | $156,9 | 7.5% |
| Total | $2,092,3 | 100.0% |
As discussed, the total national expenditure of $2.1 billion mainly comprised investments in programming delivered directly to unemployed individuals through Employment Benefits and EAS. The total also included expenditures on the two Support Measures—LMPs and R&I—that are not delivered directly to clients, and on the pan-Canadian activities described in section IV of this chapter.
Actual expenditures in each of these categories of programming decreased in 2011/12. Employment Benefits remained the largest category of expenditures, representing 58.3% of the total, up from 57.7% last year. Similarly, pan-Canadian activities rose from 6.2% to 7.5% of the total, while the share represented by LMPs and R&I increased from 6.6% to 7.1%. EAS' share of total expenditures fell from 29.5% to 27.0%.
6. Key Performance Indicators Footnote 5
HRSDC monitors the results of EBSM-similar programming delivered by P/Ts through three key performance indicators:
- the number of active EI claimants served;
- the number of EI clients who returned to employment following an intervention; Footnote 6 and
- the amount of unpaid EI Part I benefits resulting from the returns to employment.
All three indicators declined year over year, with 2011/12 results more closely mirroring the pre-recession period of 2007/08, as illustrated in Chart 4.
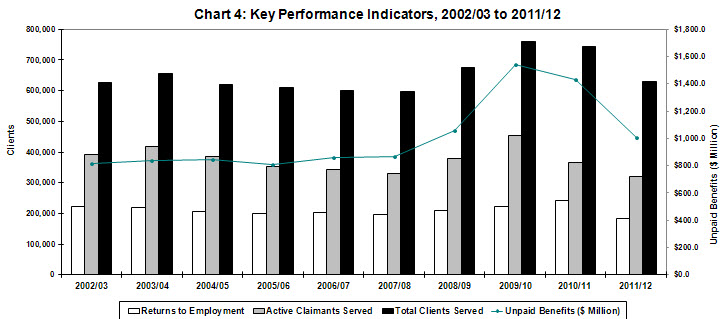
Table equivalent of Chart 4
| Year | Returns to Employment | Active Claimants Served | Total Clients Served | Unpaid Benefits ($ Million) |
|---|---|---|---|---|
| 2002/03 | 221,943 | 392,644 | 627,880 | $814.52 |
| 2003/04 | 218,876 | 416,426 | 655,028 | $839.00 |
| 2004/05 | 207,073 | 385,213 | 620,787 | $843.08 |
| 2005/06 | 198,727 | 353,542 | 611,420 | $807.47 |
| 2006/07 | 203,692 | 342,145 | 602,157 | $856.30 |
| 2007/08 | 196,498 | 329,127 | 595,910 | $866.90 |
| 2008/09 | 207,927 | 380,181 | 676,842 | $1,056.70 |
| 2009/10 | 222,526 | 453,781 | 758,761 | $1,540.30 |
| 2010/11 | 243,452 | 365,978 | 742,907 | $1,430.40 |
| 2011/12 | 184,245 | 319,784 | 630,537 | $1,002.90 |
As has been demonstrated, improving labour markets and emerging employment opportunities resulted in lower demand for EBSM-similar programming in 2011/12. This is reflected in the number of active EI claimants served, which fell 12.2% to 326,892 as the recovery took hold. The number of active claimants served had been trending downwards since 2002/03, before climbing to record highs during the late 2000's recession.
The number of EI clients who returned to work generally followed this same pattern but fell at a higher rate in 2011/12, dropping 24.0% to 185,029.
Unpaid benefits—which represent savings to the EI account—rose during the EAP years (2009/10 and 2010/11), due to the combination of a sharp increase in total clients served, the extension of regular EI benefits during the recession and the increase in the share of active claimants served under Part II. In 2011/12, unpaid benefits fell 29.9% to $1 billion.
7. Managing for Results
Each P/T conducts an extensive annual planning process for EBSM programming in which it sets out mutually agreed targets for the three key performance indicators. P/Ts provide these targets to the Government of Canada as part of their annual plan. These targets are usually posted on P/T web sites.
In 2011/12, P/Ts participated in various initiatives to ensure the effective and efficient design and delivery of EBSM-similar programming. Working with stakeholders, with particular emphasis on their employer communities, P/Ts monitored and evaluated the extent to which their programming was aligned with the needs of the labour market, and used the findings to identify gaps and refine service offerings.
Over the past few years, many jurisdictions have implemented new client service delivery models to increase flexibility and enhance service delivery to meet the needs of unemployed Canadians. As well, most P/Ts have introduced management information systems that have enhanced data collection and analysis. These enriched data contribute to improvements in program design and delivery.
II. PROVINCIAL AND TERRITORIAL EBSM ACTIVITIES
This section analyzes provincial and territorial EBSM-similar activity in 2011/12, linking trends in clients served, interventions and expenditures to local labour market conditions and employment programming priorities.
To address their unique labour market challenges, P/Ts deliver employment programming under LMDAs individually negotiated with the Government of Canada. Under the LMDAs, P/Ts receive funding to support the delivery of their own programs that are similar to the EBSMs established in Part II of the EI Act. Footnote 7 P/Ts design and deliver virtually all EI-funded employment programming, with the exception of the pan-Canadian activity discussed in section IV of this chapter.
Across the country, P/Ts continued to identify skills and labour shortages as the key labour market challenges they planned to address with EBSM-similar programming in 2011/12. They placed a priority on developing and delivering skill training to meet current and future skill requirements, and optimizing the existing labour supply by working to increase the labour force participation of underrepresented groups, including new immigrants.
As noted in section I, 2011/12 saw national declines in the delivery of EBSM-similar programming, as measured by clients served, interventions delivered and expenditures, as well as by the three key EBSM performance indicators. While these year-over-year declines could be expected, given the return to regular LMDA funding and improving labour markets, EBSM-similar activity this year was generally comparable with the average levels seen over the past 10 years, with the following notable trends.
- There has been a continuing shift away from longer term Employment Benefits interventions toward EAS interventions. This year, most P/Ts reached record highs in the EAS share of total interventions. This shift underlines the growing emphasis on helping to address labour shortages, as well as on assisting job-ready clients to connect with available employment opportunities, reflecting the most appropriate mix of programs and services in stronger labour markets.
- At the same time, investments in apprenticeship training (SD-A) equalled or exceeded the long-term average for these interventions in most parts of the country, reflecting the priority placed on skill training to address skill shortages, as well as the trend away from longer term interventions.
- P/Ts are continuing to implement more sophisticated case management and third-party delivery systems.
1. Newfoundland and Labrador
Newfoundland and Labrador: EBSM Key Facts
| EI | Non-Insured | |
|---|---|---|
| 12,432
|
2,031
|
|
| Active | Former | Non-Insured |
| 69.3%
|
16.6%
|
14.0%
|
| Youth (15–24)1 |
Core Age (25–54) |
Older Workers (55+) |
| 24.9% | 65.8%
|
9.2%
|
| 2011/12 | Year-over-Year Change |
|
|---|---|---|
| Employment Benefits | 7,652 | 14.1%
|
| Support Measures: EAS | 12,605 | 10.1%
|
| 2011/12 | Year-over-Year Change |
|
|---|---|---|
| Employment Benefits | 37.8% | 1.1
|
| Support Measures: EAS | 62.2% | 1.1
|
| 2011/12 ($ Million) |
Year-over-Year Change |
|
|---|---|---|
| Employment Benefits | $106.3 | 15.4%
|
| Support Measures: EAS | $20.9 | 29.4%
|
| LMPs and R&I | $4.7 | 13.9%
|
| Indicator | Total |
|---|---|
| Active Claimants Served | 10,027 |
| Returns to Employment | 6,335 |
| Unpaid Benefits ($ Million) | $26.71 |
1 Age distribution does not equal 100%, as the “unknown” category is not reported here. Date of birth is not collected for clients in SD-A and Group Services.
2 Totals may not add due to rounding; does not include accounting adjustments
The labour market of Newfoundland and Labrador strengthened in 2011/12. Employment rose to a record high of 225,600, an increase of 3,300 (+1.5%) year over year. The labour force expanded modestly to 258,900, another record high, and unemployment fell to a five-year low of 33,300 (-4.9%). As a result, the province’s unemployment rate dropped from 13.6% in 2010/11 to 12.9%, the lowest rate in the province since 1975/76.
Newfoundland and Labrador’s 2011/12 strategic priorities addressed ongoing challenges, including labour and skill shortages, an aging population, out-migration especially among youth and retention of immigrants. The province also identified limited access to human resource planning expertise as a challenge for small enterprises, and prioritized continued work with stakeholders to strengthen labour market development planning. Newfoundland and Labrador planned to support skills development to meet the requirements for a skilled workforce, and to encourage the labour force attachment of underrepresented individuals.
Labour market gains in 2011/12 led to a modest reduction in the demand for employment programming. The number of clients participating in EBSM-similar programming in Newfoundland and Labrador fell to 14,463. Active clients represented 69.3% of the total, down from a high of 79.8% in 2003/04. During the same period, the proportion of former claimants remained stable, while the proportion of non-insured clients jumped from 4.5% in 2002/03 to 14.0% in 2011/12. The number of interventions delivered in Newfoundland and Labrador fell to 20,257, while expenditures for EBSM-similar programming were $131.9 million.
1.1 Employment Benefits
Employment Benefits interventions decreased to 7,652 and represented 37.8% of all interventions. SD continued to account for the majority of Employment Benefits interventions, reaching a five-year high of 73.2%, as the province sought to improve skills to meet changing labour market needs. At the same time, JCPs represented 17.6% of all interventions, representing a new low for this intervention. Employment Benefits expenditures totalled $106.3 million.
| Employment Benefits | |
|---|---|
| TWS | Newfoundland and Labrador Wage Subsidy |
| SE | Newfoundland and Labrador Self-Employment Benefit |
| JCPs | Newfoundland and Labrador Job Creation Partnerships |
| SD | Newfoundland and Labrador Skills Development |
| Support Measures | |
| EAS | Newfoundland and Labrador Employment Assistance Services |
| LMPs | Newfoundland and Labrador Labour Market Partnerships |
1.2 Support Measures: EAS
The province delivered 12,605 EAS interventions, a 10.1% decrease from the previous year, and 62.2% of the total delivered in 2011/12. Individual Counselling was the sole EAS reported, reflecting the high priority assigned to delivering specialized services to address the complex needs of unemployed individuals. EAS expenditures were $20.9 million.
1.3 Other Support Measures: LMPs
Newfoundland and Labrador’s total expenditure for LMPs rose to $4.7 million and accounted for 3.6% of total EBSM-similar expenditures, down from 11.3% in 2002/03. LMP funding increased to support labour market strategies and activities to deal with labour force adjustments and human resources requirements.
1.4 Managing for Results
In July 2011, Newfoundland and Labrador launched a three-year strategic plan that identified three keys to improving labour force development: ensuring a supply of skilled and available workers; enabling client access to a continuum of social support; and developing a culture of service excellence. The province will present annual performance reports on the new strategy.
2. Prince Edward Island
Prince Edward Island: EBSM Key Facts
| EI | Non-Insured | |
|---|---|---|
| 3,495
|
1,340
|
|
| Active | Former | Non-Insured |
| 60.4%
|
11.9%
|
27.7%
|
| Youth (15–24)1 |
Core Age (25–54) |
Older Workers (55+) |
| 26.7%
|
65.1% | 8.1%
|
| 2011/12 | Year-over-Year Change |
|
|---|---|---|
| Employment Benefits | 2,224 | 10.8%
|
| Support Measures: EAS | 4,980 | 47.5%
|
| 2011/12 | Year-over-Year Change |
|
|---|---|---|
| Employment Benefits | 30.9% | 11.6
|
| Support Measures: EAS | 69.1% | 11.6
|
| 2011/12 ($ Million) |
Year-over-Year Change |
|
|---|---|---|
| Employment Benefits | $20.4 | 13.7%
|
| Support Measures: EAS | $4.9 | 3.1%
|
| LMPs and R&I | $1.8 | 0.4%
|
| Indicator | Total |
|---|---|
| Active Claimants Served | 2,921 |
| Returns to Employment | 2,034 |
| Unpaid Benefits ($ Million) | $8.16 |
1 Age distribution does not equal 100%, as the “unknown” category is not reported here. Date of birth is not collected for clients in SD-A and Group Services.
2 Totals may not add due to rounding; does not include accounting adjustments.
In 2011/12, Prince Edward Island’s labour market continued to strengthen. The labour force expanded for a fifth consecutive year (+2.3%), while employment grew to a record high of 72,300 (+2.6%). Unemployment was almost unchanged and the Island’s unemployment rate was 11.4%, compared with 11.5% last year.
As the province sought to equip Islanders to participate in the labour market, LMDA-supported programming was identified as a key component of Prince Edward Island’s economic development strategy, Island Prosperity–A Focus for Change. Specific employment programming priorities to address the Island’s labour market challenges were developed based on the strategy. One of the highest priorities was addressing the shortages of skills and labour created by a combination of rising demand for certain skills, an aging population and the out-migration of educated youth. PEI planned to focus on supporting newcomers, skill training and skill enhancement to help Islanders secure and maintain employment.
In 2011/12, the number of clients served on Prince Edward Island climbed to a high of 4,835 (+6.9%). Non-insured clients represented 27.7% of this total, a proportion that has more than doubled since 2002/03, when this group represented 12.6% of clients. The Island has experienced an increase in international migration that has prompted enhancements to programs and services to assist newcomers with language acquisition, acculturation, credential recognition, training and employment, as well as initiatives aimed at recognizing and celebrating diversity. This focus has resulted in an increase in the number of non-insured clients served. The share of active clients fell to 60.4%, the lowest since 2002/03 and, at 11.9%, the share of former claimants was also lower year over year. In total, 7,204 interventions were delivered, and expenditures fell to $27.1 million.
2.1 Employment Benefits
The number of Employment Benefits interventions delivered on Prince Edward Island fell to 2,224, representing a low of 30.9% of total interventions. TWS was the sole Employment Benefit that reported an increase (+9.8%). In the last four years, this intervention’s share of total Employment Benefits has almost quadrupled, from 4.8% to 18.6%. In an effort to stem the out-migration of well-educated youth, the province emphasized TWS programming to help integrate individuals into the local labour market. All other Employment Benefits shares declined. Even with this year’s decline, SD continued to be the most frequently used intervention on the Island, representing 65.8% of all Employment Benefits interventions, underlying the province’s commitment to meeting the demand for skilled workers in tight sectors of the labour market. Employment Benefits expenditures totalled $20.4 million.
| Employment Benefits | |
|---|---|
| TWS | Employ PEI |
| SE | Self-Employ PEI |
| JCPs | Work Experience PEI |
| SD | Training PEI—Individual Training PEI—Apprentice |
| Support Measures | |
| EAS | Employment Assistance Services |
| LMPs | Labour Market Partnerships |
| R&I | Research and Innovation |
2.2 Support Measures: EAS
With 4,980 interventions, EAS represented 69.1% of the 2011/12 total. Employment Services continued to be the most common EAS intervention, representing 68.0% of interventions (3,388). A decrease in employment toward the end of the year bolstered demand for these services, primarily for help with job search skills and résumé writing. In addition, enhancements to data capture and coding improved Employment Services data collection. Individual Counselling interventions fell to 32.0% of the total. EAS expenditures reached a high of $4.9 million.
2.3 Other Support Measures: LMPs
Prince Edward Island’s total expenditure for LMPs was almost unchanged at $1.8 million. LMP funding, which accounted for 6.6% of total EBSM-similar programming expenditures, was used to develop and promote labour market intelligence, career awareness, training curricula related to industry requirements and best practices for investing in worker training. The province also encouraged industry and community involvement in identifying and addressing labour market issues.
2.4 Managing for Results
Ensuring LMDA programming is aligned with emerging trends is vital to economic growth. Prince Edward Island continued to consult stakeholders to address emerging labour market needs, and ensure that programs and services effectively meet the needs of employers and individuals. In June 2011, SkillsPEI commissioned a labour market review to evaluate the effectiveness of labour market development programs and policies, and its service delivery model.
3. Nova Scotia
Nova Scotia: EBSM Key Facts
| EI | Non-Insured | |
|---|---|---|
| 13,339
|
4,247
|
|
| Active | Former | Non-Insured |
| 58.3%
|
17.6% | 24.1%
|
| Youth (15–24)1 |
Core Age (25–54) |
Older Workers (55+) |
| 20.7%
|
70.3%
|
8.8%
|
| 2011/12 | Year-over-Year Change |
|
|---|---|---|
| Employment Benefits | 5,118 | 11.8%
|
| Support Measures: EAS | 30,167 | 7.6%
|
| 2011/12 | Year-over-Year Change |
|
|---|---|---|
| Employment Benefits | 14.5% | 0.6
|
| Support Measures: EAS | 85.5% | 0.6
|
| 2011/12 ($ Million) |
Year-over-Year Change |
|
|---|---|---|
| Employment Benefits | $58.1 | 20.4%
|
| Support Measures: EAS | $21.2 | 4.4%
|
| LMPs and R&I | $1.0 | 0.7%
|
| Indicator | Total |
|---|---|
| Active Claimants Served | 10,250 |
| Returns to Employment | 6,734 |
| Unpaid Benefits ($ Million) | $25.38 |
1 Age distribution does not equal 100%, as the “unknown” category is not reported here. Date of birth is not collected for clients in SD-A and Group Services.
2 Totals may not add due to rounding; does not include accounting adjustments.
Labour market conditions in Nova Scotia were generally consistent with those observed in 2010/11. An extremely modest gain pushed employment to a record high of 454,100. The labour force contracted by less than 1.0%, which resulted in lower unemployment. Consequently, the unemployment rate fell from 9.3% last year to a three-year low of 8.6%. Despite modest improvements over the past two years, Nova Scotia’s labour market has not fully recovered from the recession.
Nova Scotia faces many labour market challenges, including skills and labour shortages, a shrinking labour force, a declining birth rate, youth out-migration and an aging population. The province’s 2011/12 LMDA plan continued to support the workforce strategy component of jobsHere, Nova Scotia’s economic development strategy. This strategy comprises three interrelated priorities: fostering the right skills for good jobs; growing the economy through innovation; and helping businesses compete globally. Other jobsHere priorities include providing access to programs and services that meet labour market development needs, and increasing the capacity of the provincial labour market to retain and add jobs requiring higher literacy and numeracy in an increasingly knowledge-based economy. Nova Scotia planned to work with community groups, training providers and businesses to address these priorities.
A total of 17,586 clients accessed EBSM interventions in Nova Scotia in 2011/12. Active clients represented 58.3% of this total, compared with 68.6% in 2002/03. At 17.6%, the proportion of former claimants remained stable. Almost one quarter (24.1%) of all clients served were non-insured. EBSM clients participated in 35,285 interventions, and total expenditures fell to $80.3 million.
3.1 Employment Benefits
Nova Scotia delivered 5,118 Employment Benefits interventions in 2011/12, representing 14.5% of total interventions, down from 52.8% in 2002/03. SD-R declined to 58.6% of total Employment Benefits interventions, an eight-year low, while SD-A’s share rose from 24.2% last year to 26.0%. Despite year-over-year declines, SD-A and SD-R combined represented 84.6% of all Employment Benefits interventions, reflecting the province’s commitment to helping Nova Scotians transition to new employment and develop the skills required in an increasingly knowledge-based economy. Employment Benefits expenditures fell to $58.1 million.
| Employment Benefits | |
|---|---|
| TWS | Nova Scotia Targeted Wage Subsidy |
| SE | Nova Scotia Self-Employment Benefit |
| JCPs | Nova Scotia Job Creation Partnerships |
| SD | Nova Scotia Skills Development |
| Support Measures | |
| EAS | Nova Scotia Employment Assistance Services |
| LMPs | Nova Scotia Labour Market Partnerships |
3.2 Support Measures: EAS
Employment growth in the second half of the year lessened the demand for employment services, and interventions fell to 30,167. Even so, EAS’ share of all interventions, which climbed from just 47.2% in 2002/03 to 85.5% this year, reflected Nova Scotia’s strong focus on providing access to programs and services. The province emphasized Employment Services (51.8%) and Individual Counselling (47.5%) over Group Services (0.6%). EAS expenditures fell to $21.2 million.
3.3 Other Support Measures: LMPs
At $1.0 million, Nova Scotia’s total expenditures for LMPs were stable year over year.
3.4 Managing for Results
In 2011/12, Nova Scotia prepared to launch a new client management system to support the delivery of labour market programs. The Labour Market Program Support System (LaMPSS) Footnote 8 helps the province make the most efficient use of staff and financial resources, while enhancing program delivery
4. New Brunswick
New Brunswick: EBSM Key Facts
| EI | Non-Insured | |
|---|---|---|
| 12,824
|
4,217
|
|
| Active | Former | Non-Insured |
| 61.4%
|
13.9%
|
24.7%
|
| Youth (15–24)1 |
Core Age (25–54) |
Older Workers (55+) |
| 33.7%
|
58.6%
|
7. 6%
|
| 2011/12 | Year-over-Year Change |
|
|---|---|---|
| Employment Benefits | 9,472 | 16.1%
|
| Support Measures: EAS | 24,318 | 4.9%
|
| 2011/12 | Year-over-Year Change |
|
|---|---|---|
| Employment Benefits | 28.0% | 2.6
|
| Support Measures: EAS | 72.0% | 2.6
|
| 2011/12 ($ Million) |
Year-over-Year Change |
|
|---|---|---|
| Employment Benefits | $74.2 | 19.6
|
| Support Measures: EAS | $10.7 | 24.8
|
| LMPs and R&I | $4.5 | 75.5%
|
| Indicator | Total |
|---|---|
| Active Claimants Served | 10,459 |
| Returns to Employment | 9,017 |
| Unpaid Benefits ($ Million) | $30.85 |
1 Age distribution does not equal 100%, as the “unknown” category is not reported here. Date of birth is not collected for clients in SD-A and Group Services.
2 Totals may not add due to rounding; does not include accounting adjustments.
New Brunswick’s labour market gradually weakened for a second consecutive year. After reaching a high of 359,400 in 2009/10, employment fell to a five-year low of 351,600 (-0.9%) in 2011/12. With unemployment increasing (+1.9%) and the labour force contracting (-0.6%), the unemployment rate reached an eight-year high of 9.7%.
In 2011/12, New Brunswick planned to make strategic investments through innovative programs, services and partnerships to help its citizens secure and maintain full-time employment. The province identified a two-fold labour market challenge: maximizing participation rates to fill vacancies and address the need for skilled workers, while continuing to improve literacy skills. New Brunswick sought to address these challenges by working with employers to enhance adult literacy, promoting continuous learning, assisting workers with job matching and collaborating with stakeholders to meet their training needs.
In 2011/12, 17,041 clients participated in EBSM-similar interventions in New Brunswick. Participation by client type remained stable: active clients represented 61.4% of all clients, followed by non-insured clients at 24.7% and former claimants at 13.9%. The number of interventions delivered in the province fell to an eight-year low of 33,790. EBSM-similar programming expenditures totalled $89.4 million.
4.1 Employment Benefits
A total of 9,472 interventions were delivered in New Brunswick in 2011/12. As was the case in most parts of the country, Employment Benefits’ share of total interventions decreased year over year, falling to a three-year low of 28.0%, compared with 43.2% in 2002/03. SD-R and SD-A both decreased year over year; SD-R declines were attributed in part to a series of changes in eligibility criteria. Despite these decreases, SD represented 87.9% of all Employment Benefits interventions in 2011/12, attesting to the province’s vision of assisting New Brunswickers to acquire skills to secure and maintain employment. Employment Benefits expenditures fell to $74.2 million.
| Employment Benefits | |
|---|---|
| TWS | Workforce Expansion—Employer Wage Subsidy |
| SE | Workforce Expansion—Self-Employment Benefit |
| SD | Training and Skills Development Program |
| Support Measures | |
| EAS | Employment Assistance Services |
| LMPs | Adjustment Services |
| R&I | Research and Innovation |
4.2 Support Measures: EAS
Though lower year over year, EAS interventions (24,318) accounted for 72.0% of all interventions delivered this year, a significant change from the 56.8% seen in 2002/03. Employment Services represented 39.6% of all EAS interventions, a three-year high, while the share of Individual Counselling fell to the 2007/08 level. The marked shift to EAS delivery resulted from the province’s commitment to assisting job-ready individuals who were actively seeking employment. At the same time, New Brunswick increased the services available to clients facing multiple barriers. EAS expenditures rose 24.8% to $10.7 million.
4.3 Other Support Measures: LMPs and R&I
New Brunswick’s expenditures for LMPs and R&I climbed 75.5% to $4.5 million. All of this increase was associated with a sharp increase in LMPs (+81.8%), with funds used to help employers in expanding industry sectors manage their human resource needs. R&I expenditures fell 17.7% to $133,000.
4.4 Managing for Results
New Brunswick has improved programming by increasing its availability and flexibility, ensuring that programs and services are more focused on clients’ needs. Program delivery is designed based on evidence from analyses of past and current client experiences. Ongoing program evaluations measure program effectiveness, and guide the design and delivery of the province’s employment programming.
Further, New Brunswick continuously engages various stakeholders to identify and address needs within the parameters of the province’s programming. Currently, New Brunswick is reviewing program support to employers to identify gaps and ways to work more effectively with employers, communities and industry groups to meet their needs.
5. Quebec
Quebec: EBSM Key Facts
| EI | Non-Insured | |
|---|---|---|
| 146,188
|
47,049
|
|
| Active | Former | Non-Insured |
| 62.7%
|
13.0%
|
24.3%
|
| Youth (15–24)1 |
Core Age (25–54) |
Older Workers (55+) |
| 16.6%
|
71.2%
|
12.2%
|
| 2011/12 | Year-over-Year Change |
|
|---|---|---|
| Employment Benefits | 43,268 | 11.5%
|
| Support Measures: EAS | 182,141 | 9.2%
|
| 2011/12 | Year-over-Year Change |
|
|---|---|---|
| Employment Benefits | 19.2% | 3.5
|
| Support Measures: EAS | 80.8% | 3.5
|
| 2011/12 ($ Million) |
Year-over-Year Change |
|
|---|---|---|
| Employment Benefits | $353.5 | 21.8%
|
| Support Measures: EAS | $129.3 | 4.4
|
| LMPs and R&I | $106.3 | 13.4%
|
| Indicator | Total |
|---|---|
| Active Claimants Served | 146,1883 |
| Returns to Employment | 52,872 |
| Unpaid Benefits ($ Million) | $219.42 |
1 Age distribution does not equal 100%, as the “unknown” category is not reported here. Date of birth is not collected for clients in SD-A and Group Services.
2 Totals may not add due to rounding; does not include accounting adjustments.
3 When setting targets Quebec includes both active and former claimants.
Conditions in the Quebec labour market were markedly stable year over year, with only modest changes seen in all of the major labour force characteristics. The provincial unemployment rate was unchanged at 7.9%.
In 2011/12, Quebec continued to face several labour market challenges, including limited labour force participation of underrepresented groups, an aging workforce and skill shortages. Quebec aligned its priorities to address these challenges, working toward employment recovery and gains, increased labour force participation, higher productivity, enhanced capacity of businesses to adapt to change, and a business model that would ensure efficiency by modernizing service delivery. To this end, Quebec planned to invest in developing the skills of its workforce, notably underrepresented groups. Quebec also planned to assist businesses to build a diverse workforce by connecting employers and job seekers.
In 2011/12, 193,237 clients participated in EBSM-similar programming in Quebec, similar to the previous year. Non-insured clients represented 24.3% of this total, which was significantly higher than in recent years. Conversely, active claimants fell to just 62.7% of the total, down from an average of 64.7% since 2002/03. At 13.0%, former claimants’ share has remained relatively stable. These clients participated in 225,409 interventions, with expenditures totalling $589.2 million.
5.1 Employment Benefits
Mirroring the national trend, the number of Employment Benefits interventions delivered in Quebec fell to 43,268, representing 19.2% of total interventions, the lowest share in 10 years. The province focused on interventions to help job-ready clients get back into the workforce quickly, which resulted in increases in both TWS (+23.1%) and TES (+1.0%). While SD use declined, these longer term interventions accounted for 62.6% of all Employment Benefits interventions delivered in 2011/12. Footnote 9 Employment Benefits expenditures fell 21.8% to $353.5 million.
| Employment Benefits | |
|---|---|
| SD | Manpower Training Measure Job Readiness |
| TWS | Wage Subsidy |
| SE | Support for Self-Employment Measure |
| TES | Return to Work Supplement |
| Support Measures | |
| EAS | Labour Market Information Job Placement Job Research and Assistance Services |
| LMPs | Job Cooperation Services Manpower Training Measure for Enterprises |
| R&I | Research and Innovation Strategy |
5.2 Support Measures: EAS
As part of its efforts to modernize its service delivery and encourage quicker returns to work, Emploi-Quebec reviewed its client pathway in June 2011 and now provides immediate assistance to clients identified as close to job ready. In addition, Quebec now includes services such as job placement and labour market information in its EAS interventions data, which contributed to the year-over-year increase in interventions delivered. As a result, the number of EAS interventions rose 9.2% to 182,141. Moreover, the EAS share of total interventions jumped to 80.8%, compared with a low of 72.1% in 2007/08. The province focused on Individual Counselling as a means of directly assisting job-ready individuals to return to the labour market. Group Services interventions declined, while the number of Employment Services interventions remained stable. EAS expenditures totalled $129.3 million.
5.3 Other Support Measures: LMPs and R&I
At $105.9 million, Quebec’s total expenditure for LMPs represented almost 18.0% of the province’s total expenditures for EBSM-similar programming, comparable with figures for the last few years. In addition to providing SD support to the employed workforce, LMP funds supported an analysis of Quebec’s workforce, the development of human resource functions within the employer community and the reclassification of licensed workers. Similarly, R&I funding has remained relatively stable at less than 1% of total expenditures and amounted to $419,000 in 2011/12.
5.4 Managing for Results
To continue to improve its delivery of services, Emploi-Quebec conducted a post-intervention survey with businesses that had benefited from an intervention. The survey, conducted in early 2012, gathered feedback on Emploi-Quebec’s contributions to increased job satisfaction, productivity, the capacity to adapt to change and the stability of the workforce.
6. Ontario
Ontario: EBSM Key Facts
| EI | Non-Insured | |
|---|---|---|
| 85,854
|
46,170
|
|
| Active | Former | Non-Insured |
| 48.3%
|
16.7
|
35.0%
|
| Youth (15–24)1 |
Core Age (25–54) |
Older Workers (55+) |
| 18.3%
|
71.4%
|
10.2%
|
| 2011/12 | Year-over-Year Change |
|
|---|---|---|
| Employment Benefits | 37,245 | 28.7%
|
| Support Measures: EAS | 108,570 | 49.2%
|
| 2011/12 | Year-over-Year Change |
|
|---|---|---|
| Employment Benefits | 25.5% | 5.9
|
| Support Measures: EAS | 74.5% | 5.9
|
| 2011/12 ($ Million) |
Year-over-Year Change |
|
|---|---|---|
| Employment Benefits | $325.8 | 4.5%
|
| Support Measures: EAS | $216.4 | 44.9%
|
| LMPs and R&I | $10.5 | 54.2%
|
| Indicator | Total |
|---|---|
| Active Claimants Served | 63,780 |
| Returns to Employment | 33,347 |
| Unpaid Benefits ($ Million) | $221.66 |
1 Age distribution does not equal 100%, as the “unknown” category is not reported here. Date of birth is not collected for clients in SD-A and Group Services.
2 Totals may not add due to rounding; does not include accounting adjustments.
Ontario’s labour market continued to strengthen in 2011/12, with employment reaching a new high of almost 6.75 million (+1.5%). While employment was slightly higher year over year, the labour force was stable. As a result, unemployment declined, and Ontario’s unemployment rate fell from 8.4% in 2010/11 to a three-year low of 7.7%.
Ontario faces multiple labour market challenges, including an aging population, long-term unemployment (i.e., people who have been unemployed more than 27 weeks) and growing demand in high-skilled sectors. The province is also experiencing low labour force participation and modest outcomes for specific groups, including immigrants, Aboriginal people, persons with disabilities and youth. To address these challenges in 2011/12, Ontario identified a mix of employment programs and services that would enable its clients to succeed in the labour market. The province planned to focus its investments on training, including literacy and basic skills programs, and on efforts to provide work experience to help Ontarians acquire the knowledge and skills they need to prepare for suitable jobs.
In 2011/12, 132,024 clients participated in EBSM-similar programming in Ontario. Active claimants represented 48.3% of this total, down from a high of 76.3% in 2002/03. At 16.7%, former claimants have more than doubled their share since 2002/03 (7.5%). After peaking at 48.2% last year, non-insured clients’ share dropped back to 35.0%, still more than double the share 10 years ago (16.2%). Ontario delivered 145,815 EBSM-similar interventions. Shifts in the types of clients served and the types of interventions delivered reflected Ontario’s strengthening economy and may also be partially attributed to the province’s new Employment Service model, which changed the method for tracking EAS interventions. Expenditures for EBSM-similar programming totalled $552.7 million.
6.1 Employment Benefits
Ontario delivered 37,245 Employment Benefits interventions in 2011/12. TWS has been integrated into the province’s Employment Service and is now referred to as Job Placement with Incentive. Footnote 10 These interventions jumped 107.4% (+1,209) to a three-year high of 2,335, and raised the TWS-similar share of total Employment Benefits interventions to 6.3%, up from 2.2% last year. SD-A’s share also increased, consistent with the province’s commitment to skill training. Employment Benefits expenditures totalled $325.8 million.
| Employment Benefits | |
|---|---|
| TWS | Job Placement with Incentive |
| SE | Ontario Self-Employment Benefit |
| JCPs | Ontario Job Creation Partnerships |
| SD-R | Second Career |
| SD-A | Skills Development-Apprenticeship |
| Support Measures | |
| EAS | Ontario Employment Assistance Services/Employment Service |
| LMPs | Ontario Labour Market Partnerships |
6.2 Support Measures: EAS
As noted, Ontario has introduced a new model for delivering employment services. Under this model, service providers record one counselling session per client case file, regardless of the number of EAS interventions the client receives. As a result, year-over-year comparisons are difficult to make. A total of 108,570 EAS interventions were recorded in 2011/12, all of which were recorded under Individual Counselling. Footnote 11 EAS expenditures totalled $216.4 million.
6.3 Other Support Measures: LMPs
Ontario’s total expenditures for LMPs in 2011/12 were $10.5 million, 1.9% of the total expenditure for EBSM-similar programming, compared with a 10-year high of 5.0% in 2002/03.
6.4 Managing for Results
To assess the performance of its service providers and overall employment programming, Ontario developed a performance management system centered on seven core measures and standards that form its Service Quality Standard (SQS). The SQS allows the province to monitor the performance of its service providers according to customer service quality, effectiveness and efficiency. As part of the annual business planning cycle, Ontario requires each service delivery site to identify continuous improvement targets. After the first full year of implementation, Ontario has sufficient SQS data to complete an initial analysis of the results and performance of the network.
Employment Ontario offers a flexible suite of programs designed to address barriers to employment. Indicators are used to assess a client’s employment barriers and inform the development of a service plan leading to sustainable employment. These indicators are aggregated to the network level and allow for an assessment of Ontario’s ability to achieve results for clients with complex service needs.
7. Manitoba
Manitoba: EBSM Key Facts
| EI | Non-Insured | |
|---|---|---|
| 15,609
|
13,704
|
|
| Active | Former | Non-Insured |
| 40.4%
|
12.9%
|
46.8%
|
| Youth (15–24)1 |
Core Age (25–54) |
Older Workers (55+) |
| 21.0%
|
71.5%
|
7.4%
|
| 2011/12 | Year-over-Year Change |
|
|---|---|---|
| Employment Benefits | 6,635 | 24.9%
|
| Support Measures: EAS | 45,013 | 7.0%
|
| 2011/12 | Year-over-Year Change |
|
|---|---|---|
| Employment Benefits | 12.8% | 4.6
|
| Support Measures: EAS | 87.2% | 4.6
|
| 2011/12 ($ Million) |
Year-over-Year Change |
|
|---|---|---|
| Employment Benefits | $29.0 | 31.1%
|
| Support Measures: EAS | $10.3 | 9.8%
|
| LMPs and R&I | $5.5 | 2.1%
|
| Indicator | Total |
|---|---|
| Active Claimants Served | 11,834 |
| Returns to Employment | 8,714 |
| Unpaid Benefits ($ Million) | $40.97 |
1 Age distribution does not equal 100%, as the “unknown” category is not reported here. Date of birth is not collected for clients in SD-A and Group Services.
2 Totals may not add due to rounding; does not include accounting adjustments.
After eight years of steady growth, Manitoba’s labour market conditions were stable in 2011/12. Modest changes in the labour force and employment caused the unemployment rate to edge up from 5.3% last year to 5.4%.
Manitoba established strategic priorities for 2011/12 to address ongoing challenges associated with skill and labour shortages attributed in part to an aging workforce and a shrinking labour pool. Addressing these shortages is seen as key to Manitoba’s economic growth and continued labour supply. The province planned to optimize the participation of the existing labour supply, and to assist groups of individuals who face barriers to entering and remaining in the labour market. These groups include Aboriginal people, underemployed workers and income assistance recipients. Manitoba also planned to focus on helping immigrants successfully integrate into the labour market. To help Manitobans meet employers’ requirements for skilled workers in rural, northern and remote communities, the province sought to provide adequate training across all regions of the province. For example, Manitoba planned to enhance and expand the Red Seal apprenticeship system to meet the demands of its changing labour market.
In 2011/12, 29,313 clients participated in EBSM-similar programming in Manitoba. This number represented a year-over-year decline of 11.5%, and reflected both stability in Manitoba’s economy and a return to activity levels observed prior to the economic downturn. Active claimants accounted for 40.4% of this total, down from a high of 53.8% in 2003/04. At 12.9%, the share of former claimants remained relatively stable compared with the past several years. The proportion of non-insured clients rose from a low of 33.8% in 2003/04 to 46.8% this year. The number of interventions delivered in Manitoba rose 1.5% to 51,648. At the same time, expenditures fell 21.2%, to $44.8 million.
7.1 Employment Benefits
Employment Benefits interventions fell to 6,635, representing just 12.8% of total interventions, down from a high of 18.9% in 2009/10. This decline is consistent with the trend of economic recovery in Manitoba. More Manitobans are using short-term measures and fewer are participating in Employment Benefits, due in part to the strength of Manitoba’s economy and the expansion of employment opportunities.
With a very modest increase year over year, SD-A reached a 10-year high (3,690) and accounted for over half of all Employment Benefits interventions delivered during the year. That proportion reflected Manitoba’s plan to expand apprenticeship opportunities to meet the needs of the labour market by addressing skill and labour shortages. Employment Benefits expenditures fell to $29.0 million.
| Employment Benefits | |
|---|---|
| TWS | Wage Subsidies |
| SE | Self-Employment |
| JCPs | Employment Partnerships |
| SD | Skills Development |
| Support Measures | |
| EAS | Employment Assistance Services |
| LMPs | Labour Market Partnerships |
| R&I | Research and Innovation |
7.2 Support Measures: EAS
EAS interventions rose to a 10-year high of 45,013, accounting for 87.2% of all interventions, compared with a low of 81.1% in 2009/10. In keeping with the province’s plan to optimize the existing labour supply, emphasis shifted toward Employment Services interventions. With more clients seeking access to job-focused employment preparation services, these interventions climbed 63.1% to a high of 28,462. At the same time, Individual Counselling interventions fell 32.7% to 16,551. Total EAS expenditures rose 9.8% to $10.3 million.
7.3 Other Support Measures: LMPs and R&I
Manitoba’s total expenditure for LMPs and R&I totalled $5.5 million, accounting for 12.3% of total expenditures for EBSM-similar programming. While LMP expenditures increased 3.4% to $4.7 million, R&I fell 5.4% to $753,000.
7.4 Managing for Results
In 2011/12, Manitoba undertook a planning process to develop a more efficient client service model. As a result, Manitoba has defined a full-spectrum service response that takes a client from entry into the system through successful retention in the workplace. A multi-tiered approach to employment counselling will be applied, and the service response will reflect the intensity of service that each client needs. Employer engagement is critical to getting clients into sustainable employment, and employer services will be delivered from Manitoba’s integrated service locations. The province will start implementing the new model in late 2012/13.
8. Saskatchewan
Saskatchewan: EBSM Key Facts
| EI | Non-Insured | |
|---|---|---|
| 13,892
|
870
|
|
| Active | Former | Non-Insured |
| 72.0%
|
22.1%
|
5.9%
|
| Youth (15–24)1 |
Core Age (25–54) |
Older Workers (55+) |
| 15.5%
|
77.5%
|
7.0%
|
| 2011/12 | Year-over-Year Change |
|
|---|---|---|
| Employment Benefits | 8,396 | 5.6%
|
| Support Measures: EAS | 12,294 | 41.7%
|
| 2011/12 | Year-over-Year Change |
|
|---|---|---|
| Employment Benefits | 40.6% | 10.0
|
| Support Measures: EAS | 59.4% | 10.0
|
| 2011/12 ($ Million) |
Year-over-Year Change |
|
|---|---|---|
| Employment Benefits | $29.8 | 17.5%
|
| Support Measures: EAS | $5.5 | 20.4%
|
| LMPs and R&I | $2.5 | 33.5%
|
| Indicator | Total |
|---|---|
| Active Claimants Served | 10,624 |
| Returns to Employment | 6,083 |
| Unpaid Benefits ($ Million) | $54.13 |
1 Age distribution does not equal 100%, as the “unknown” category is not reported here. Date of birth is not collected for clients in SD-A and Group Services.
2 Totals may not add due to rounding; does not include accounting adjustments.
Labour market conditions in Saskatchewan improved slightly in 2011/12. A modest increase pushed employment to a record high (527,100). In combination with a stable labour force, this resulted in a 9.2% decrease in unemployment. Consequently, the unemployment rate fell from 5.3% in 2010/11 to 4.8%.
Saskatchewan’s economic growth has created demand for skilled workers in many sectors. At the same time, the province faces challenges, including high rates of unemployment among First Nations, Métis and youth, and a tightening of the labour supply with accompanying labour shortages. Saskatchewan recognizes the need to increase the delivery of individualized services for clients facing multiple employment barriers and to make the province’s employment services more effective. To this end, Saskatchewan outlined five key strategic priorities: increase the labour force participation of its growing young First Nations and Métis populations; increase skill training opportunities to meet existing and future labour market demands; support an accessible advanced education system that responds to learners’ needs and contributes to an innovative economy; attract and retain newcomers to the province; and improve the overall effectiveness of its employment services.
In 2011/12, the total number of clients served rose 9.7% to 14,762. After climbing to a high of 78.2% in 2007/08, active claimants’ share of total clients fell to 72.0%, which was still slightly above the historical average. Similarly, the proportion of non-insured clients was slightly above average at 5.9%. Conversely, former claimants’ share, at 22.1%, was slightly below average. These clients participated in 20,690 interventions, which was an increase of 17.7% year over year. As Saskatchewan’s economy strengthened and jobs were more readily available, clients sought short-term EAS interventions to help them to return to the labour market, rather than accessing longer term training opportunities. Total expenditures for EBSM-similar programming fell 19.2% to $37.8 million.
8.1 Employment Benefits
The number of Employment Benefits interventions delivered in Saskatchewan fell to a three-year low of 8,396. In support of the province’s emphasis on skill training opportunities to meet the continuing demand for apprentices in a growing economy, SD-A increased (+3.2%) to a record high of 6,702 (+209). Moreover, SD-A continued to account for the majority of Saskatchewan’s Employment Benefits interventions, representing 79.8% of this year’s total. At the same time, individuals with marketable skills were able to transition back into the labour market quickly; therefore, fewer individuals sought longer term training opportunities. Consequently, SD-R interventions fell to an eight-year low of 1,566. SE also declined, falling to a four-year low. Saskatchewan discontinued the use of TWS in favour of maintaining support for apprentices. As a result, expenditures for Employment Benefits fell to $29.8 million.
| Employment Benefits | |
|---|---|
| TWS | Job Start/Future Skills |
| SE | Self-Employment Program |
| JCPs | Employment Programs |
| SD | Skills Training Benefit Provincial Training Allowance |
| Support Measures | |
| EAS | Workforce Development |
| LMPs | Sector Partnerships Regional Planning and Partnerships |
8.2 Support Measures: EAS
In 2011/12, Saskatchewan shifted away from longer Employment Benefits interventions to shorter EAS interventions. The province delivered 12,294 EAS interventions in 2011/12, an increase of 41.7% year over year. The focus on delivering interventions for clients facing multiple barriers resulted in a significant increase in Employment Services (+351.2%) and Group Services interventions (+43.4%). Individual Counselling interventions fell 18.7%. Expenditures fell to $5.5 million.
8.3 Other Support Measures: LMPs and R&I
Saskatchewan’s combined expenditures for LMPs and R&I fell to $2.5 million, accounting for 6.7% of the 2011/12 total, down from a peak of 19.3% in 2003/04. The province used LMP funding for needs assessments and human resource planning. These activities supported program alignment and effectiveness.
8.4 Managing for Results
Saskatchewan, Canada and five tribal councils committed to working together to increase the labour force participation of First Nations people. A steering committee will identify priority areas for collaboration, including youth career planning and skills development; strategies to address employment and training barriers; short-term training in areas such as literacy, adult basic education and essential skills; and training and employment opportunities developed in partnership with the private and public sectors and industry.
9. Alberta
Alberta: EBSM Key Facts
| EI | Non-Insured | |
|---|---|---|
| 62,360
|
65,098
|
|
| Active | Former | Non-Insured |
| 32.5%
|
16.4%
|
51.1%
|
| Youth (15–24)1 |
Core Age (25–54) |
Older Workers (55+) |
| 23.7%
|
67.2%
|
9.0%
|
| 2011/12 | Year-over-Year Change |
|
|---|---|---|
| Employment Benefits | 21,264 | 11.5%
|
| Support Measures: EAS | 264,427 | 14.7%
|
| 2011/12 | Year-over-Year Change |
|
|---|---|---|
| Employment Benefits | 7.4% | 0.3
|
| Support Measures: EAS | 92.6% | 0.3
|
| 2011/12 ($ Million) |
Year-over-Year Change |
|
|---|---|---|
| Employment Benefits | $76.5 | 33.2%
|
| Support Measures: EAS | $29.6 | 18.1%
|
| LMPs and R&I | $0.8 | 13.7%
|
| Indicator | Total |
|---|---|
| Active Claimants Served | 41,394 |
| Returns to Employment | 25,776 |
| Unpaid Benefits ($ Million) | $223.61 |
1 Age distribution does not equal 100%, as the “unknown” category is not reported here. Date of birth is not collected for clients in SD-A and Group Services.
2 Totals may not add due to rounding; does not include accounting adjustments.
In 2011/12, Alberta’s labour market strengthened on all key indicators. The labour force expanded (+2.8%) as employment reached a new peak of 2,110,700 (+3.9%) and unemployment decreased significantly (-12.8%). These shifts lowered the unemployment rate 0.9 percentage points to 5.3%, the largest decline among all P/Ts year over year.
Alberta identified skill and labour shortages, and low labour market participation of underrepresented groups, as two key challenges for 2011/12. Left unresolved, these issues threatened to constrain the province’s economic growth and prosperity. To address rising labour shortages, Alberta planned to encourage increased labour force participation by responding to sector-specific employment and career needs through targeted interventions. To address the province’s rising skills shortages, Alberta planned to help clients enter occupational skill training, with an emphasis on high-demand occupations, and to support apprenticeship training. Alberta also planned to emphasize labour market partnerships that would focus on increasing workplace training and skill development.
Alberta’s strong labour market conditions resulted in lower demand for employment programs and services. A total of 127,458 clients participated in EBSM-similar programming in Alberta in 2011/12, which was a four-year low. The mix of client types changed considerably, as the share of active claimants fell to a low of 32.5%, compared with a high of 43.3% in 2002/03. Former claimants represented a high of 16.4%, up from a low of 11.7% in 2009/10. Non-insured clients, whose share has fluctuated from 44.3% to 52.7% over the past 10 years, represented 51.1% of clients served. These clients participated in 285,691 interventions, with total expenditures for EBSM-similar programming at $106.9 million.
9.1 Employment Benefits
The number of Employment Benefits interventions fell to 21,264, and comprised just 7.4% of all interventions, down from a high of 13.3% in 2002/03. While the number of SD-A interventions decreased year over year, those interventions accounted for 84.1% of all Employment Benefits interventions, up from 62.4% in 2002/03, underlining Alberta’s commitment to supporting apprenticeship training. JCP interventions climbed 19.6% to 800, reflecting the province’s emphasis on partnerships and on increasing labour force participation through targeted interventions. Employment Benefits expenditures totalled $76.5 million.
| Employment Benefits | |
|---|---|
| TWS | Workplace Training |
| SE | Self-Employment |
| JCPs | Integrated Training |
| SD | Occupational Training Work Foundations |
| Support Measures | |
| EAS | Career Information |
| LMPs | Workforce Partnerships |
9.2 Support Measures: EAS
Though lower year over year, Alberta’s 264,427 EAS interventions comprised 92.6% of total interventions, a share that was comparable to figures for the last three years. EAS expenditures totalled $29.6 million.
9.3 Other Support Measures: LMPs
At $833,000, Alberta’s total expenditure for LMPs represented just 0.8% of total expenditures, down from 2.1% in 2007/08.
9.4 Managing for Results
Alberta is committed to the continual evaluation of the programs and services it provides under its LMDA. The province has implemented a plan to evaluate all LMDA-funded programs. It recently evaluated its Job Corps, Adult Basic Education and Integrated Training programs, and is currently evaluating its Workplace Training and Transitional Vocational Training programs.
10. British Columbia
British Columbia: EBSM Key Facts
| EI | Non-Insured | |
|---|---|---|
| 49,873
|
29,068
|
|
| Active | Former | Non-Insured |
| 46.7%
|
16.4%
|
36.8%
|
| Youth (15–24)1 |
Core-Age (25–54) |
Older Workers (55+) |
| 19.3%
|
68.8%
|
11.8%
|
| 2011/12 | Year-over-Year Change | |
|---|---|---|
| Employment Benefits | 17,250 | 22.6%
|
| Support Measures: EAS | 102,708 | 30.0%
|
| 2011/12 | Year-over-Year Change |
|
|---|---|---|
| Employment Benefits | 14.4% | 1.2
|
| Support Measures: EAS | 85.6% | 1.2
|
| 2011/12 ($ Million) |
Year-over-Year Change | |
|---|---|---|
| Employment Benefits | $141.6 | 24.2%
|
| Support Measures: EAS | $114.8 | 11.7%
|
| LMPs and R&I | $10.9 | 138.5%
|
| Indicator | Total |
|---|---|
| Active Claimants Served | 36,889 |
| Returns to Employment | 33,580 |
| Unpaid Benefits ($ Million) | $146.43 |
1 Age distribution does not equal 100%, as the “unknown” category is not reported here. Date of birth is not collected for clients in SD-A and Group Services.
2 Totals may not add due to rounding; does not include accounting adjustments.
Labour market conditions improved in British Columbia in 2011/12. While the labour force was stable, employment rose 1.1%, reaching a new high of 2,284,500 (+24,400). As a result, unemployment declined 7.6% (-14,500) and the province’s unemployment rate fell from 7.7% last year to a three-year low of 7.1%.
British Columbia continued to face several labour market challenges in 2011/12, including an aging workforce, a lack of skilled workers, and a shift from a resource-based economy to a knowledge and services economy. To address these challenges, the province identified key priorities for its labour market programming, which included developing and enhancing the skill level and labour market success of British Columbians; ensuring access to employment and labour market programs and services for underrepresented groups; and partnering with employers and communities to address workplace productivity and regional labour market needs. The province also planned to continue the development of its Labour Market Information Service through additional research and dissemination methods.
In April 2012, British Columbia introduced a new approach to delivering employment and training programs and services in the province. The Employment Program of British Columbia (EPBC) integrated EBSM-similar and provincial programs and services into a single, comprehensive employment program. EPBC services include self-serve job-search services, as well as client needs assessment, case management and other employment programming options to assist unemployed individuals to prepare for, find and maintain sustainable employment.
In 2011/12, 78,941 clients accessed EBSM-similar programming in British Columbia. A decline of 26.0% year over year, this figure mirrored the trend among the province’s EI Part I recipients. Active claimants accounted for 46.7% of this total, 3.2 percentage points lower than the historical average for this group. Conversely, the share for former claimants was 16.4%, up from a low of 11.1% in 2008/09. Non-insured clients’ share was slightly higher at 36.8%. These clients participated in 119,958 interventions, and expenditures totalled $267.3 million.
10.1 Employment Benefits
As the economy and labour market continued to improve in 2011/12, both the number of Employment Benefits interventions and the number of EI Part I recipients declined. Most of the decline occurred in time-intensive interventions (SD-R and SE), with many clients opting for shorter interventions and a quicker re-attachment to the labour market. While the number of SD-A interventions also declined, SD-A continued to account for a large proportion of Employment Benefits interventions. This growing commitment to apprenticeship reflects the province’s close collaboration with British Columbia’s Industry Training Authority to support training in skilled trades. As part of this commitment, British Columbia developed a new Apprentice Online Application (AOP) that allows apprentices to apply for LMDA funding online. The AOP is convenient and quick; to date, almost 4,000 apprentice applications have been processed through the AOP. British Columbia’s expenditures for Employment Benefits totalled $141.6 million.
| Employment Benefits | |
|---|---|
| TWS | Targeted Wage Subsidies |
| SE | Self-Employment |
| JCPs | Job Creation Partnerships |
| SD | Skills Development Employment Benefit |
| Support Measures | |
| EAS | Employment Assistance Services |
| LMPs | Labour Market Partnerships Employer-Sponsored Training |
10.2 Support Measures: EAS
Similar to declines in Employment Benefits, declines in EAS interventions mirrored the trends observed among EI Part I recipients and in the overall labour market. The number of interventions fell to a four-year low of 102,708 and represented 85.6% of all interventions delivered in 2011/12, a share that was above the historical average for British Columbia. EAS expenditures totalled $114.8 million.
10.3 Other Support Measures: LMPs
British Columbia’s total expenditures for LMPs climbed to $10.9 million and accounted for 4.1% of total expenditures, which was an historical high for this measure.
10.4 Managing for Results
As noted above, the launch of the EPBC was a key priority in 2011/12. The transition to the EPBC began with a request for proposals in March 2011. Successful organizations were announced in December 2011, after which agreements were developed, and comprehensive training and staffing strategies were developed and deployed. At the same time, nearly 400 LMDA contribution agreements were extended to ensure continuity of client service during the transition to the EPBC. Enhanced financial monitoring processes were introduced, which improved budget management for service providers and the province. In addition, a centralized unit was created to manage the client-related activities that remained with the province under the EPBC.
While preparing for the new EPBC, the province continued to make continuity of service to unemployed British Columbians a primary focus. To maintain and improve operations during the transition period, the province established a performance management system. It monitored performance against achievable targets and reported regularly on balanced scorecard performance measures.
11.Northwest Territories
Northwest Territories: EBSM Key Facts
| EI | Non-Insured | |
|---|---|---|
| 480
|
437
|
|
| Active | Former | Non-Insured |
| 35.7%
|
16.7%
|
47.7%
|
| Youth (15–24)1 |
Core-Age (25–54) |
Older Workers (55+) |
| 35.0%
|
61.4%
|
3.2%
|
| 2011/12 | Year-over-Year Change | |
|---|---|---|
| Employment Benefits | 406 | 8.1%
|
| Support Measures: EAS | 867 | 1.4%
|
| 2011/12 | Year-over-Year Change |
|
|---|---|---|
| Employment Benefits | 31.9% | 2.2
|
| Support Measures: EAS | 68.1% | 2.2
|
| 2011/12 ($ Million) |
Year-over-Year Change | |
|---|---|---|
| Employment Benefits | $1.8 | 15.8%
|
| Support Measures: EAS | $0.9 | 9.9%
|
| LMPs and R&I | $0.3 | 7.0%
|
| Indicator | Total |
|---|---|
| Active Claimants Served | 327 |
| Returns to Employment | 202 |
| Unpaid Benefits ($ Million) | $2.34 |
1 Age distribution does not equal 100%, as the “unknown” category is not reported here. Date of birth is not collected for clients in SD-A and Group Services.
2 Totals may not add due to rounding; does not include accounting adjustments.
The labour market of the Northwest Territories continued to strengthen in 2011/12. There were gains in employment (+3.2% or 700) and the labour force (+4.1% or 1,000). Since the number of people joining the labour force outpaced the available employment opportunities, unemployment rose 17.9% (+ 300). As a result, the unemployment rate rose from 7.1% last year to 8.0%.
The Northwest Territories identified several labour market challenges in its 2011/12 LMDA annual plan. Among the most significant of these challenges were workforce mobility issues; ongoing skill shortages sparked by oil and gas exploration projects; and the need to provide information to help clients make informed labour market choices. To address these challenges, the territory planned to enhance skills development, facilitate workforce mobility and self-employment, foster opportunities for people to gain work experience, and support local labour market partnerships.
A total of 917 clients accessed EBSM-similar programming in the Northwest Territories in 2011/12. The proportion of non-insured clients, a group whose share has been on the rise for the past five years, rose to a new high of 47.7%. At the same time, the proportion of former claimants expanded to a nine-year high (16.7%). Conversely, the share of active claimants fell from a high of 88.8% in 2005/06 to a low of 35.7%. These clients participated in 1,273 interventions, with expenditures totalling $2.9 million.
11.1 Employment Benefits
The number of Employment Benefits interventions delivered in the Northwest Territories declined to 406 and represented an historical low of 31.9% of total interventions. TWS accounted for 18.0% of these interventions and was the lone Employment Benefit that increased. All other Employment Benefit types had shares at or near the norm. Total expenditures for Employment Benefits were $1.8 million.
| Employment Benefits | |
|---|---|
| TWS | Training on the Job Apprenticeship Training on the Job Youth Employment |
| SE | Self-Employment Option |
| SD | Building Essential Skills Building Essential Skills-Apprenticeship |
| Support Measures | |
| EAS | Employment Assistance Services Career Development Service |
| LMPs | Labour Market Partnerships |
11.2 Support Measures: EAS
Individual Counselling is the only type of EAS intervention delivered in the Northwest Territories. Since its introduction in the territory in 2006/07, the number of these interventions has gradually increased, climbing to 867 interventions in 2011/12, and 68.1% of total interventions. The shift away from Employment Benefits interventions toward EAS interventions reflects the emphasis the Northwest Territories has placed on assisting job-ready clients. EAS expenditures totalled $862,000.
11.3 Other Support Measures: LMPs
The Northwest Territories’ expenditures for LMPs rose to $260,000 and accounted for 9.0% of total expenditures, which was below the 10-year average of 12.1%. This year, these funds were used to support a comprehensive review of labour force development needs. The NWT Mine Training Society, in collaboration with the Akaitcho Territory Government, Dehcho First Nation, NWT Métis Nation and Tlicho Government, assessed anticipated needs over the next five to ten years. The results of the review will inform strategic planning and program delivery in the future.
11.4 Managing for Results
Planning and collaboration with Regional Training Partnerships helps the Northwest Territories meet the needs for labour market programming more effectively. Partnership groups in all five territorial regions meet regularly to plan and prioritize training needs to meet current and projected regional demands.
12. Yukon
Yukon: EBSM Key Facts
| EI | Non-Insured | |
|---|---|---|
| 402
|
267
|
|
| Active | Former | Non-Insured |
| 45.6%
|
14.5%
|
39.9%
|
| Youth (15–24)1 |
Core-Age (25–54) |
Older Workers (55+) |
| 22.0%
|
62.7%
|
14.3%
|
| 2011/12 | Year-over-Year Change | |
|---|---|---|
| Employment Benefits | 209 | 14.0%
|
| Support Measures: EAS | 518 | 63.9%
|
| 2011/12 | Year-over-Year Change |
|
|---|---|---|
| Employment Benefits | 28.7% | 14.7
|
| Support Measures: EAS | 71.3% | 14.7
|
| 2011/12 ($ Million) |
Year-over-Year Change | |
|---|---|---|
| Employment Benefits | $2.1 | 4.5%
|
| Support Measures: EAS | $1.2 | 1.4%
|
| LMPs and R&I | $0.2 | 43.5%
|
| Indicator | Total |
|---|---|
| Active Claimants Served | 305 |
| Returns to Employment | 270 |
| Unpaid Benefits ($ Million) | $2.57 |
1 Age distribution does not equal 100%, as the “unknown” category is not reported here. Date of birth is not collected for clients in SD-A and Group Services.
2 Totals may not add due to rounding; does not include accounting adjustments.
Labour market conditions in Yukon improved in 2011/12. The labour force expanded significantly (+5.6% or +1,100). At the same time, employment increased at a slightly slower pace (+5.2% or 900). Since employment growth lagged labour force expansion, unemployment increased slightly (+10.9% or +100). As a result, the unemployment rate rose from 6.0% in 2010/11 to 6.3%.
In 2011/12, the Yukon labour market faced shortages in both skills and labour. In response, Yukon planned to increase the participation of underrepresented groups and immigrants in the workforce to meet labour market requirements; enhance the quality of skills development; facilitate workforce mobility; and provide its clients with the information they need to make informed labour market choices. To achieve these objectives, Yukon planned to provide support and guidance to the Disability Employment Strategy, a community-driven initiative, and foster ongoing community engagement through its Labour Market Framework. In addition, Yukon planned to implement a new participant case management practice and system, and to begin redeveloping its EAS/case management program and network.
A total of 669 clients accessed EBSM-similar programming in Yukon in 2011/12. Non-insured clients represented 39.9% of this total, which was a three-year high. Despite stronger labour market conditions, Yukon still faced challenges in providing effective services to persons who are chronically unemployed due to multiple barriers, which the increased share of non-insured participants reflected. At 14.5%, the proportion of former claimants also increased, but at a slower pace. In contrast, the share of active claimants fell to 45.6%, a four-year low. These clients participated in 727 interventions, with expenditures totalling $3.5 million.
12.1 Employment Benefits
Employment Benefits interventions dropped to a low of 209. The shares of three of the four interventions—SD-R, SE and TWS—were lower than average. In contrast, SD-A was well above average and reached a high of 69.4% of all Employment Benefits interventions. Yukon’s increased emphasis on SD-A targeted the demand for skilled trades workers. JCPs were not offered in 2011/12. Expenditures for Employment Benefits totalled $2.1 million.
| Employment Benefits | |
|---|---|
| TWS | Targeted Wage Subsidies |
| SE | Self-Employment |
| JCPs | Job Creation Partnerships |
| SD | Skills Development Employment Benefit |
| Support Measures | |
| EAS | Employment Assistance Services |
| LMPs | Labour Market Partnerships Employer-Sponsored Training |
12.2 Support Measures: EAS
EAS interventions represented 71.3% of all interventions delivered in 2011/12. Yukon focused on providing additional support to individuals facing multiple barriers who were not ready to access the territory’s stronger labour market. Accordingly, Yukon focused primarily on Employment Services, which represented 95.8% of all EAS interventions. This was the second consecutive year that Employment Services represented over 95.0% of EAS interventions. Since 2006/07, Individual Counselling’s share has decreased from 47.4% to 4.2%. Expenditures were stable at $1.2 million.
12.3 Other Support Measures: LMPs
In 2011/12, Yukon’s total expenditures for LMPs rose to $182,000 and accounted for 5.1% of total expenditures. LMP activities included an extensive review of the employment and employer engagement of individuals with disabilities.
12.4 Managing for Results
Yukon’s strategic plan for 2011 to 2016 confirmed the territory’s commitment to continuing work on a new case management database that will enhance its administrative and data collection systems and processes. This plan identifies the second set of performance indicators to be collected for all employment programs delivered in Yukon. In addition, Yukon plans to evaluate the impact and effectiveness of all LMDA programs as part of the ongoing LMDA evaluations.
13. Nunavut
Nunavut: EBSM Key Facts
| EI | Non-Insured | |
|---|---|---|
| 187
|
89
|
|
| Active | Former | Non-Insured |
| 38.8%
|
29.0%
|
32.2%
|
| Youth (15–24)1 |
Core-Age (25–54) |
Older Workers (55+) |
| 27.3%
|
69.7%
|
2.9%
|
| 2011/12 | Year-over-Year Change | |
|---|---|---|
| Employment Benefits | 140 | 9.1%
|
| Support Measures: EAS | 171 | 125.0%
|
| 2011/12 | Year-over-Year Change |
|
|---|---|---|
| Employment Benefits | 45.0% | 21.9
|
| Support Measures: EAS | 55.0% | 21.9
|
| 2011/12 ($ Million) |
Year-over-Year Change | |
|---|---|---|
| Employment Benefits | $1.6 | 10.5%
|
| Support Measures: EAS | $0 | 0.0% - |
| LMPs and R&I | $0.014 | 42.7%
|
| Indicator | Total |
|---|---|
| Active Claimants Served | 107 |
| Returns to Employment | 65 |
| Unpaid Benefits ($ Million) | $0.63 |
1 Age distribution does not equal 100%, as the “unknown” category is not reported here. Date of birth is not collected for clients in SD-A and Group Services.
2 Totals may not add due to rounding; does not include accounting adjustments.
Nunavut’s labour market was slightly weaker in 2011/12, with extremely small changes resulting in a lower unemployment rate. Employment fell 1.3% to 11,600, while the labour force contracted 1.2%. The combination of these two relatively modest declines resulted in lower unemployment, and Nunavut’s unemployment rate fell from 16.4% in 2010/11 to 16.0%.
In 2011/12, Nunavut continued to focus on preparing its labour force to meet the needs of its changing economy. Challenges the territory faced included low levels of literacy, educational attainment and job readiness, and skill shortages. Human resource management capacity also continued to be a challenge for enterprises in Nunavut. The territory planned to address these challenges by providing career development and employability services to new young workers. To address skill shortages, education and training remained high priorities. In addition to these priorities, Nunavut planned to increase its service delivery capacity through additional staff training and support.
A total of 276 clients accessed EBSM-similar programming in Nunavut in 2011/12. The proportion of two client types—active claimants (38.8%) and former claimants (29.0%)—declined year over year, while non-insured clients nearly doubled their share of total clients served. In total, clients participated in 311 interventions, with expenditures totalling $1.6 million.
13.1 Employment Benefits
The number of Employment Benefits interventions delivered in Nunavut fell to a low of 140. SD-A interventions represented 30.7% of all Employment Benefits interventions, up from a low of 12.5% in 2009/10. At the same time, SD-R fell to a record low but still accounted for nearly half of all Employment Benefits interventions (44.3%) delivered during the year. TWS interventions increased sharply, jumping from 2 last year to 35, accounting for 25% of Employment Benefits interventions. Employment Benefits expenditures totalled $1.6 million.
| Employment Benefits | |
|---|---|
| TWS | Training on the Job |
| SE | Self-Employment Option |
| JCPs | Job Creation Partnerships |
| SD | Building Essential Skills |
| Support Measures | |
| EAS | Employment Assistance Services |
| LMPs | Labour Market Partnerships |
| R&I | Research and Innovation |
13.2 Support Measures: EAS
After falling to a record low of 76 last year, EAS interventions rose to 171 (+125.0%). Nunavut field employees deliver EAS directly to clients; therefore, there are no LMDA expenditures associated with delivering these interventions.
13.3 Other Support Measures: LMPs
Nunavut’s total expenditures for R&I were $14,000, less than 1% of the territory’s 2011/12 total.
13.4 Managing for Results
Nunavut committed to improving education and training outcomes by supporting a wider range of options for education, adult learning and training. In its 2011/12 LMDA annual plan, Nunavut made it a priority to improve harmonization in the delivery of labour market and career development services and programs.
III. EBSM EVALUATION: NATIONAL ANALYSIS OF MEDIUM-TERM NET IMPACTS
As part of the second cycle of LMDA evaluations, a quantitative analysis of net impacts and outcomes will be conducted each year for different sub-groups of participants and/or time periods. Marking the first time these results have been included in this report, this year's analysis measures EBSM net impacts for active claimants over the medium term (five years after they participated in EBSMs). This analysis provides a unique picture of EBSM effectiveness and shows whether the short-term impacts found in the first summative evaluation cycle were sustained over the medium term.
1. Background on LMDA Evaluations
The LMDAs call for evaluations of the impacts and effectiveness of EBSMs every three to five years. Between 2001 and 2011, bilateral summative evaluations were conducted in each province and territory, except Quebec, which is responsible for its own evaluation. The second cycle of evaluations was launched in early 2012 using a new approach: ongoing studies for the 12 participating provinces and territories will be done simultaneously over the next five years. These studies will include an annual analysis of net impacts and outcomes, and their results will be presented in this report.
2. Study Approach and Methodology
The purpose of the net impact analysis is to allow direct attribution of impacts to the EBSMs by assessing the difference participation makes, compared with non-participation. Footnote 12
This year's analysis covered a sample of 10% of all active claimants from all 13 P/Ts, Footnote 13 for a total of 35,863 participants who ended their EBSM participation in 2001/02 or 2002/03. Net impacts were estimated using linked administrative data from the EI databank and the Canada Revenue Agency. Overall, this methodology is consistent with the methods used during the summative evaluations.
3. Net Impact Results
Net impacts were measured separately for each EBSM against four outcome indicators:
- annual average incidence of employment (i.e., incidence of earning money from employment and/or self-employment);
- annual average employment earnings (including earnings from both employment and self-employment);
- annual average number of weeks in receipt of EI; and
- annual average amount of EI benefits received.
This section discusses statistically significant results at the 95% confidence level.
3.1 Skills Development (SD)
Results from the summative evaluations showed that SD was the most effective EBSM in increasing the employment earnings of active claimants. The national analysis, which was conducted on 12,327 active claimants, confirmed this finding. Participation in SD led to net increases in employment earnings in each year of the post-program period, and these gains were the highest among active claimants who participated in all types of EBSMs. Moreover, the annual net earnings gains steadily increased between the second and fifth years after participation, rising from $1,910 to $4,062. The impact found in the first year was not statistically significant.
These increases in employment earnings were accompanied by net gains in the incidence of employment in all years of the post-program period, indicating that the overall employment duration of active claimants increased. Footnote 14 As shown in Table 1, annual net gains in the incidence of employment increased over the period, from 4.2 percentage points in the first year to 5.7 percentage points in the fifth year.
|
Indicators
(Average Per Year) |
Post-Program Period | ||||
|---|---|---|---|---|---|
| 1st Year | 2nd Year | 3rd Year | 4th Year | 5th Year | |
| Employment Earnings | $925 | $1,910* | $2,692* | $3,390* | $4,062* |
| Incidence of Employment | 4.2 pp* | 4.4 pp* | 5 pp* | 5.7 pp* | 5.7 pp* |
| EI Benefits | -$343* | $59 | $99* | $111* | $104* |
| Number of Weeks in Receipt of EI | -1.4* | -0.1 | 0 | 0.1 | 0.1 |
pp = percentage points *Statistically significant results at the 95% confidence level.
The positive effects on earnings and incidence of employment may be partially explained by the focus of many SD interventions on obtaining credentials. The surveys conducted during the summative evaluation in four jurisdictions showed that between 73% and 78% of participants received a certificate or a diploma as a result of the training they received under SD. Footnote 15 As reported in a study from the Organisation for Economic Co-operation and Development (OECD), such credentials may signal participants' productivity to prospective employers. Footnote 16
Active claimants reduced their use of EI in the first year following the end of their participation, with a net reduction of $343 in EI benefits and of 1.4 weeks in receipt of EI.
In the third, fourth and fifth years, there were very modest net increases ranging between $99 and $111 in the amount of EI benefits collected. The net impact on the amount of EI benefit collected in the second year was not statistically significant. As well, the net impacts on the number of weeks in receipt of EI were not statistically significant in the last four years of the post-program period.
SD results reflect those of studies from other OECD countries, which show that public training programs have positive labour market impacts on the employment and earnings of adult participants. Footnote 17 Interestingly and somewhat in line with the results found in the national analysis, a meta-analysis of 97 micro-econometric evaluations of active labour market policies in various countries reported that classroom and on-the-job training programs were more likely to yield better outcomes 12 to 24 months after participation than in the shorter term. Footnote 18
3.2 Targeted Wage Subsidies (TWS)
The analysis covered 1,692 active claimants. While the short-term net impacts on employment earnings were not statistically significant, the results show that TWS had positive net impacts on this indicator starting in the third year following the end of participation. As shown in Table 2, these net impacts increased over the last three years of the post-program period from $955 to $1,373.
|
Indicators
(Average Per Year) |
Post-Program Period | ||||
|---|---|---|---|---|---|
| 1st Year | 2nd Year | 3rd Year | 4th Year | 5th Year | |
| Employment Earnings | $511 | $425 | $955* | $1,326* | $1,373* |
| Incidence of Employment | 8.3 pp* | 7.1 pp* | 8 pp* | 7.6 pp* | 7.3 pp* |
| EI Benefits | $482* | $408* | $474* | $615* | $679* |
| Number of Weeks in Receipt of EI | 2.5* | 1.7* | 1.7* | 1.8* | 1.9* |
pp = percentage points *Statistically significant results at the 95% confidence level.
Annual net gains in incidence of employment ranging between 7.1 and 8.3 percentage points were found in each of the five years that followed the end of participation. These gains were the highest among results for active claimants in all EBSMs.
There were net increases in the use of EI benefits (ranging from $408 to $679) and in the number of weeks in receipt of EI (ranging from 1.7 to 2.5 weeks) in all years after participation. Increases in EI use were also found in the summative evaluations and are not surprising, since participants gain EI eligibility during the work experience provided under TWS. Although the net impacts on employment earnings and incidence of employment show that TWS participants had employment gains, some participants may still lose their employment and re-apply for EI benefits.
The summative evaluations indicate that TWS increased the employment earnings of active claimants, though the results for most P/Ts were not statistically significant. The national results presented here confirm this trend and show that TWS also increased the incidence of employment. These findings are consistent with studies of wage subsidies in other OECD countries, which generally indicate that participation in such programs results in modest gains in employment. Footnote 193.3 Self-Employment (SE)
The national analysis covered 1,530 active claimants who participated in SE. Similar to findings from the summative evaluations, the national analysis found negative net impacts on earnings ranging from a decrease of $9,118 in the first year to a decrease of $4,397 in the fifth year after participation. There were also net decreases in the incidence of employment ranging from 7.5 percentage points in the first year to 2.5 percentage points in the third year. The results for the fourth and fifth years were statistically non-significant. Overall, for both earnings and incidence of employment, the size of the annual impacts continuously diminished over the post-program period.
SE resulted in reduced use of EI benefits and weeks; however, similar to earnings and incidence of employment, the size of the impact decreased significantly over time. The use of EI benefits diminished from a decrease of $1,250 in the first year to a decrease of $286 in the fifth year after participation. The number of weeks in receipt of EI diminished from a decrease of 3.7 weeks in the first year to a decrease of 1 week in the fourth year. The result for the fifth year was not statistically significant. Reductions in EI use were expected, as self-employed individuals were not eligible to receive EI benefits during the reference period.
|
Indicators
(Average Per Year) |
Post-Program Period | ||||
|---|---|---|---|---|---|
| 1st Year | 2nd Year | 3rd Year | 4th Year | 5th Year | |
| Employment Earnings | -$9,118* | -$8,235* | -$6,686* | -$5,250* | -$4,397* |
| Incidence of Employment | -7.5 pp* | -4.3 pp* | -2.5 pp* | -2.1 pp | -1.0 pp |
| EI Benefits | -$1,250* | -$799* | -$640* | -$478* | -$286* |
| Number of Weeks in Receipt of EI | -3.7* | -2.2* | -1.6* | -1.0* | -0.4 |
pp = percentage points *Statistically significant results at the 95% confidence level.
In both the summative evaluations and the national analysis, the net impacts of SE were measured relative to a comparison group of non-participants who were not necessarily self-employed after the participation period. In this context, the analysis assessed whether obtaining help to become self-employed improves participants' labour market situation after their program participation in comparison to non-participants who ended up in various employment or unemployment situations after the participation period.
In order to better understand the national net impacts of SE, it is important to also consider research about the financial well-being of self-employed individuals in general. A study from Statistics Canada showed that self-employed individuals in Canada have a lower average annual income than paid employees ($46,200 versus $52,400 in 2009). Footnote 20 At the same time, the average net worth of their households is 2.7 times that of the households of paid employees, indicating that income is probably not fully representative of the financial well-being of the self-employed, since some may leave funds within their business for reinvestment purposes. Footnote 21 In this regard, when interpreting SE results, one should consider that the tax files used to measure earnings do not account for all of the fiscal advantages applicable to self-employed individuals and for the net worth created through their businesses.
Various factors, such as the economic context and the financial resources of the self-employed, may have an impact on business survival and SE participants' success. While it was not possible to assess the survival rate of businesses created by SE participants, there are indications that those who remained self-employed over the post-program period were able to improve their earnings from self-employment over time. Footnote 22 Specifically, the proportion of participants who reported having earnings from self-employment (either positive earnings or loss) in the post-program period fell from 52% to 38%, but the actual amount of annual earnings from self-employment increased slightly. Overall, however, a small proportion of SE participants' total average earnings came from self-employment (between 19% and 28%).
Current SE evaluation evidence provides a partial picture of the extent to which this EBSM helps to provide sustainable employment to its participants. A more complete assessment would require an examination of the survival rate of businesses, the influence of external and personal factors on business success, and participants' wealth accumulation. Also, little is currently known about the type of assistance provided under SE, how it is targeted and delivered, and the business concepts that participants develop. To fully measure SE success and to assess whether changes to the program may be warranted, HRSDC will undertake a detailed study of program design, delivery, effectiveness and longer term net impacts within the next two years of the second cycle of LMDA evaluations.
3.4 Job Creation Partnerships (JCP)
The summative evaluations did not permit the identification of clear trends about JCP effectiveness because the net impacts were quite varied and often not statistically significant.
The national net impact analysis covered 733 active claimants. It showed that JCP had positive impacts on the earnings and incidence of employment of active claimants. Similar to the results found in the summative evaluations, which generally covered up to three years after participation, the net impacts on employment earnings were not statistically significant in the first two years. Net gains were found in all other years and these continuously increased over time, rising from $1,305 in the third year to $3,262 in the fifth year. The incidence of employment increased in all years, with annual net impacts ranging between 3.4 and 6.2 percentage points.
The amount of EI benefits collected decreased by $257 in the first year post-program, while the net impact on the number of weeks in receipt of EI during that year was statistically non-significant. The use of EI increased over the following years, rising from $418 and 2.1 weeks in the second year to $914 and 3.3 weeks in the fifth year.
|
Indicators
(Average Per Year) |
Post-Program Period | ||||
|---|---|---|---|---|---|
| 1st Year | 2nd Year | 3rd Year | 4th Year | 5th Year | |
| Employment Earnings | $835 | $925 | $1,305* | $2,071* | $3,262* |
| Incidence of Employment | 3.5 pp* | 3.4 pp* | 4.4 pp* | 43.6 pp* | 76.2 pp* |
| EI Benefits | -$257* | $418* | $539* | $572* | $914* |
| Number of Weeks in Receipt of EI | 0.4 | 2.1* | 2.5* | 2.5* | 3.3* |
pp = percentage points *Statistically significant results at the 95% confidence level.
The positive effects on employment earnings and incidence of employment vary from those in the international literature, which generally shows that public service employment programming similar to JCP is relatively ineffective or has the least favourable impacts of all active labour market programs. Footnote 23 Interestingly, the net impacts of JCP are within ranges similar to the impacts of SD and TWS.
The JCP national net impacts suggest that further examination of this intervention is required. In particular, the net impacts should be examined using administrative data for 100% of JCP participants across the country. Since the national analysis showed that JCP participants increased their use of EI and had relatively strong EI dependence compared with other EBSM participants, there is a need to conduct a detailed analysis of key characteristics of JCP participants, their employment and unemployment patterns following participation, and the types of jobs created under JCP.
3.5 Employment Assistance Services (EAS)
Net impacts generated as part of the summative evaluations for participants who only received EAS (referred to as EAS-only) were often not statistically significant. As a result, it has been difficult to identify any clear trends about the effectiveness of this support measure, though there were some indications that these services may increase the earnings of active claimants.
|
Indicators
(Average Per Year) |
Post-Program Period | ||||
|---|---|---|---|---|---|
| 1st Year | 2nd Year | 3rd Year | 4th Year | 5th Year | |
| Employment Earnings | -$501* | -$82 | $259 | $770* | $1,048* |
| Incidence of Employment | 2.5 pp* | 2.6 pp* | 2.5 pp* | 2.8 pp* | 3.1 pp* |
| EI Benefits | -$363* | -$231 | -$205* | -$188* | -$129* |
| Number of Weeks in Receipt of EI | -1.2* | -0.7* | -1* | -1* | -0.4* |
pp = percentage points *Statistically significant results at the 95% confidence level.
The national analysis covered 19,581 active claimants who received EAS only. As shown in Table 5, EAS-only participation led to a net decrease of $501 in employment earnings in the first year after participation, while results in the second and third years were statistically non-significant. Net gains of $770 and $1,048 were found in the fourth and fifth years, respectively. The incidence of employment increased in all post-program years, with annual net gains ranging between 2.5 and 3.1 percentage points. Specifically, the annual net impacts ranged from a decrease of $363 and 1.2 weeks in the first year to a decrease of $129 and 0.4 week in the fifth year.
These findings reflect general trends identified in studies in other countries, which usually found that employment services similar to EAS could have positive impacts. Footnote 24
4. Conclusion
In summary, with the exception of SE, the results of this national analysis are generally positive and show the following:
- SD increased employment earnings and the incidence of employment over both the short and medium terms. SD participation led to the largest net employment earnings increases among all EBSMs. It is also notable that these net impacts on earnings continuously grew over the five years that followed the end of participation.
- TWS increased employment earnings in the medium term and the incidence of employment over both the short and medium terms. It resulted in the largest increases in incidence of employment among all EBSMs.
- Self-Employment had large negative impacts on employment earnings and incidence of employment, but the size of the impacts diminished over time. However, the analysis provides only a partial picture of SE effectiveness, as it does not capture the influence of other factors—such as business success and wealth accumulation—on SE participants' success. These factors will be examined in detail in the coming years.
- JCP increased employment earnings in the medium term and increased the incidence of employment over both the short and medium terms.
- EAS increased employment earnings in the medium term and increased the incidence of employment in both the short and medium terms.
IV. PAN-CANADIAN ACTIVITIES AND THE NATIONAL EMPLOYMENT SERVICE
This section analyzes pan-Canadian activities that are delivered by HRSDC and supported by EI Part II funds.
While P/Ts have full responsibility for designing and delivering EBSM-similar programming, Canada plays a leadership role in active employment measures by ensuring accountability and evaluation of LMDA programming, and by developing labour market policy. In addition, the federal government plays a primary role in responding to challenges that extend beyond local and regional labour markets by delivering pan-Canadian activities and certain functions of the National Employment Service.
Pan-Canadian activities fulfill three primary objectives:
- promoting an efficient and integrated national labour market, and preserving and enhancing the Canadian economic union;
- helping address common labour market challenges and priorities of international or national scope that transcend provincial borders; and
- promoting equality of opportunity for all Canadians with a focus on helping underrepresented groups reach their full potential in the Canadian labour market.
Pan-Canadian funding is focused on four streams of investment:
- Aboriginal Programming;
- Enhancing Investments in Workplace Skills;
- Finding Innovations and Supporting Agreements with P/Ts and Aboriginal Peoples; and
- Labour Market Information.
In 2011/12, investments in these four streams totalled $172.8 million, delivered through the Aboriginal Skills and Employment Training Strategy (ASETS—$93.5 million), Labour Market Partnerships (LMPs—$56.1 million), Supporting Agreements ($15.8 million), and Research and Innovation (R&I—$7.2 million). Footnote 25
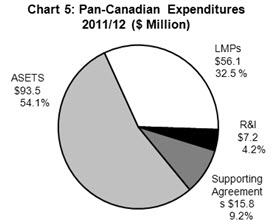
Table equivalent of Chart 5
| Expenditures | 2011/12 | |
|---|---|---|
| $ | % | |
| ASETS | $93.5 | 54.1% |
| LMPs | $56.1 | 32.5% |
| R&I | $7.2 | 4.2% |
| Supporting Agreements | $15.9 | 9.2% |
| Total | $172.8 | 100.0% |
1. Aboriginal Programming
Pan-Canadian funding in the Aboriginal Programming stream is delivered through the Aboriginal Skills and Employment Training Strategy (ASETS). The objective of ASETS is to increase Aboriginal participation in the Canadian labour market, ensuring that First Nations, Inuit and Métis people are engaged in sustainable, meaningful employment.
ASETS, which replaced the Aboriginal Human Resource Development Strategy (AHRDS) in 2010, aims to improve labour market outcomes by supporting demand-driven skills development, fostering partnerships with the private sector and P/Ts, and emphasizing increased accountability and results. It also supports the development of a skilled Aboriginal workforce, which is one of the objectives of the Federal Framework for Aboriginal Economic Development.
Pan-Canadian Programming in Action: Centre for Aboriginal Human Resource Development
The Centre for Aboriginal Human Resource Development (CAHRD) Inc. is a non-profit organization that delivers education, training and employment services to the Aboriginal population of Winnipeg. CAHRD delivers human resource and labour market programs, employment services, and training through the Neeginan Institute. CAHRD also delivers programs through partner organizations, such as Aboriginal community organizations, training institutes and other community-based organizations. In 2011/12, CAHRD assisted 1,330 clients, placed 334 Aboriginal people in employment and supported 254 Aboriginal people returning to school through nine locations in the Winnipeg area.
ASETS supports a network of more than 80 Aboriginal service delivery organizations (agreement holders), with over 800 points of service across Canada. These organizations help develop and deliver training and employment programs and services that are best suited to the unique needs of their clients. These programs and services help Aboriginal clients prepare for, obtain and maintain meaningful and sustainable employment, and assist Aboriginal youth to make the successful transition from school to work, or support their return to school.
In 2011/12, ASETS funding served more than 49,000 clients, helping almost 12,000 to find jobs and more than 6,000 to return to school. In addition, funding was provided for 8,500 childcare spaces in First Nations and Inuit communities. Canada's 2011/12 investment in ASETS totalled $344.4 million, which included expenditures of $93.5 million in EI Part II funds.
2. Enhancing Investments in Workplace Skills
This investment stream helps the federal government ensure that Canada's labour market functions as an integrated national system by working toward the following:
- removing barriers and impediments to labour mobility;
- building capacity among workplace partners to improve skills development as a key factor in increasing productivity;
- leveraging investment in and ownership of skills issues, especially in addressing skills and labour shortages; and
- supporting efforts to ensure Canada's learning system is responsive to employers' skills requirements.
Activities supported through this investment stream complement other labour market programming, including programs funded through the Consolidated Revenue Fund (CRF). In 2011/12, EI Part II expenditures for this investment stream totalled $61.6 million.
2.1 Sectoral Partnerships Initiatives
Sectoral Partnerships Initiatives (SPI) funding supports activities in two areas: the Sector Council Program and Skills Tables. In 2011/12, EI Part II expenditures under SPI agreements totalled $35.3 million.
2.1.1 Sector Council Program
The CRF-funded Sector Council Program (SCP) supports partnerships with organizations that bring business, labour and education together to address issues unique to specific industrial sectors. In 2011/12, the SCP covered over 50% of the Canadian labour market through a network of 36 national, non-profit sectoral organizations. Sector council members develop collective and sustainable solutions by sharing ideas, concerns and perspectives about industrial challenges.
Sector council activities have traditionally had four main objectives:
- ensuring that industry requirements are met by informing the learning system;
- reducing barriers to labour mobility, leading to a more efficient labour market;
- enhancing the ability of industry to recruit and retain workers and address human resource issues; and
- increasing industry investment in skills development to promote a quality workforce.
Through its network of sector councils, the SCP works to achieve these objectives by:
- supporting the development of labour market information to help stakeholders better understand economic and labour market conditions;
- exploring cross-sectoral links with other sector councils; and
- ensuring that sector council activities align with P/T investments in skills development, including apprenticeship training.
To measure results, the SCP administers the Annual Survey of Performance Indicators (ASPI), which collects data on the outputs of sector councils and the EI-funded projects that they manage, as defined in the Sector Council Generic Logic Model. These data measure the performance of the SCP against predetermined immediate outcomes and, to a lesser extent, intermediate outcomes. In 2011/12, highlights of the ASPI included:
- Sectors had access to 528 relevant and up-to-date labour market and sector study reports.
- On average, each sector council had partnerships with 2,692 stakeholders.
- Councils leveraged $38.3 million in stakeholder investments, comprising $27.8 million in cash and $10.5 million in in-kind contributions. Over the past four years, they leveraged a total of $168.9 million.
- Nineteen councils developed or upgraded occupational standards, or helped other organizations do so.
HRSDC regularly undertakes strategic reviews to ensure programs and services are focused, modern and efficient; continue to respond to the priorities of Canadians; and align with core federal responsibilities. In 2010, HRSDC conducted a strategic review that included a detailed assessment of the SCP. It concluded that this program should be refocused on core federal roles representing a public good—specifically, the provision of labour market information (LMI). As a result, core operational funding to sector councils, as well as funding for projects not consistent with the new program parameters, was to be phased out by March 31, 2013.
Pan-Canadian Programming in Action: Mining Industry Human Resources Council (MiHR)
This sector council is a recognized leader in the development and implementation of national human resource solutions for the Canadian minerals and metals industry. MiHR contributes to the strength, competitiveness and sustainability of the Canadian mining sector by actively engaging and working with employers, educators, organized labour and Aboriginal groups, among others, to develop solutions tailored to human resources needs in the mining sector.
With the support of EI funding, MiHR has established the Canadian Mining Certification Program (CMCP) as a nationwide initiative that provides all industry players with comprehensive, objective ways to verify the skills, knowledge and experience of workers; target training requirements; and enable workers from other industries to make smooth transitions to jobs in the Canadian mining industry.
With its refocused mandate, the program will be referred to as the Sectoral Initiatives Program, and will be targeted toward emerging and growing labour market needs. The refocused program will be based on a competitive process open to organizations that can deliver national partnership-based projects to develop labour market intelligence, national occupational standards and certification/accreditation regimes for sectors of economic interest.
2.1.2 Skills Tables
In addition to sector councils, SPI supports skills tables, which are time-limited, industry-driven, cross-sectoral partnerships aimed at developing shared and coordinated responses to human resource and skills needs. There are currently two skills tables: the Asia-Pacific Gateway Skills Table (APGST) and the Yukon Skills Table Committee.
Established in fall 2011, the Yukon Skills Table Committee works across sectors (industry/employers, Aboriginal organizations and communities, federal/territorial governments, and the learning system) to address key labour market and skills development priorities. The Skills Table Committee complements the priorities of Yukon's Labour Market Framework and enables more effective coordination of programs, services and tools among key labour market partners. To date, the Yukon Skills Table Committee has completed a labour market planning and needs forecast, and HRSDC is considering prospective Yukon projects associated with labour demand, supply and migration trends, and the development of an online information portal.
Located in British Columbia and established in fall 2008, the APGST is a non-profit regional partnership of labour, business and education/training institutions. It responds to human resource and skills development pressures associated with major infrastructure projects supporting the Asia-Pacific Gateway Corridor, a critical network of intermodal transport systems supporting trade and commerce in Canada and with Asian and North American markets. Under the auspices of the Government of Canada's Asia-Pacific Gateway and Corridor Initiative, HRSDC and Transport Canada have provided close to $4.8 million to the APGST since 2008—including $906,390 in 2011/12—to fund industry-related LMI, certification/training strategies and recruitment initiatives. As is the case with sector councils, HRSDC core funding for the APGST is winding down in March 2013.
2.1.3 Skilled Trades and Apprenticeship, and the Red Seal Program
Apprenticeships are essential to building a highly skilled and mobile trades workforce that supports Canadian competitiveness. The Interprovincial Standards Red Seal program is Canada's standard of excellence for training and certification in the skilled trades, and provides a vehicle to promote harmonization. Recognized in the Agreement on Internal Trade (Chapter 7), the program is a well-established means of developing common interprovincial standards for trades. In most P/Ts, the Red Seal examination is used as the certification exam for Red Seal trades.
Under this program, experienced tradespeople and apprentices who have completed their training may challenge the interprovincial Red Seal examination. If successful, they receive a Red Seal endorsement on their provincial or territorial certificate of qualification. When presented with this endorsement, employers are assured that potential employees have met a pan-Canadian standard. Each year, more than 40,000 completing apprentices and qualified uncertified tradespeople from across Canada write Red Seal examinations, and more than 25,000 Red Seals are issued. This number has steadily increased over the past decade. Apprenticeship is closely tied to economic and labour market conditions, and new apprenticeship registrations are back on the rise following a decline during the late-2000s recession.
The Red Seal Program: The Numbers
According to Statistics Canada, there were 327,339 apprentices registered at the end of 2010, a decrease of 3.8% compared with 2009. Of that total, 259,977 apprentices (or approximately 79%) were in Red Seal trades. A total of 36,009 apprentices completed their program in 2010, representing a significant 16.6% increase over the previous year and a 95.7% increase since 2000. Of those apprentices who finished in 2010, 29,421 completed a Red Seal trade, representing 81.7% of all completions and an increase of 13.2% since the previous year. In 2010, women accounted for 13.4% of all registered apprentices.
The Canadian Council of Directors of Apprenticeship (CCDA), comprising the apprenticeship authorities from each P/T and representatives from HRSDC, administers the Red Seal program. In addition to functioning as the national secretariat—providing administrative, operational and strategic support—HRSDC provides significant funding (approximately $8 million annually) for the Red Seal program. The Red Seal program currently covers 55 skilled trades, which encompass approximately 80% of registered apprentices. Footnote 26 HRSDC works closely with industry experts and apprenticeship authorities to coordinate the development of high-quality Red Seal products, including National Occupational Analyses (NOAs) and interprovincial examinations. These products are updated periodically to reflect evolving labour market needs. Because each P/T needs standards and examinations to certify thousands of apprentices and trade qualifiers each year, the collaboration involved in developing interprovincial Red Seal standards and examinations results in significant economies of scale.
Service standards are critical in planning and ensure that all Red Seal products are up to date, continually reflecting the skills and knowledge of the trades workforce. The Red Seal program also encourages the harmonization of apprenticeship training outcomes through interprovincial program guides (IPGs), which P/Ts use to inform the in-school portion of apprenticeship programs. Federal support also allows for the integration of essential skills into apprenticeship systems. Tools and resources to help Red Seal trades apprentices build their essential skills are developed jointly with apprenticeship authorities and HRSDC's Office of Literacy and Essential Skills. In 2011/2012, new exam banks were developed for 14 trades, and 12 new NOA standards and three IPGs were published. NOAs, IPGs, Red Seal examination preparation material and essential skills resources are available on the Red Seal web site at www.red-seal.ca.
The Red Seal Program and Pan-Canadian Research
National Apprenticeship Survey (NAS) The NAS (2007) surveyed 30,000 apprentices on their apprenticeship experience and labour market outcomes. The CCDA delved into the findings, producing nine in-depth studies. These studies are now available online at http://www.red-seal.ca/images/NAS-Reorts-Eng.html.
Registered Apprenticeship Information System (RAIS) There are 13 apprenticeship systems in Canada. Each year, Statistics Canada conducts a survey for HRSDC using the RAIS. The survey obtains information on participants in apprenticeship and certification programs in P/Ts across Canada. It compiles data on the number of registered apprentices taking in-class and on-the-job training in Red Seal and non-Red Seal trades, whether apprenticeship training is compulsory or voluntary. The survey also collects information such as gender, age, date of registration, time of completion and reasons for leaving an apprenticeship program, as well as prior education, work and training experience.
Labour shortages in the skilled trades are more pronounced in some regions and sectors (e.g., construction, oil sands and mining), and governments are committed to developing a skilled and mobile workforce to meet the needs of the labour market. To ensure that the Red Seal program continues to respond to labour market needs, the CCDA is enhancing its accountability and outreach by engaging stakeholders in its strategic directions and key initiatives. In 2009, the CCDA launched the Strengthening the Red Seal Initiative to explore an enhanced standards model and multiple forms of assessment in addition to written multiple-choice examinations. In the initial phase of this initiative, the CCDA gathered information and feedback through multiple assessment pilots, national in-person consultation sessions and an online survey. Based on this information and feedback, the CCDA approved short-term (October 2011 to March 2013) activities that include identifying an optimal structure, content and development process for a national standard; analyzing the costs of current Red Seal product development processes, the piloted processes and an enhanced standard prototype process; and studying the feasibility of implementing an enhanced standard and assessment model in P/Ts. The CCDA is also developing a branding strategy, informed by 2010 employer survey results, to increase awareness of the Red Seal program as a standard of excellence for the skilled trades.
The Red Seal program is the main delivery platform for federal measures such as Apprenticeship Incentive Grants and the Apprenticeship Job Creation Tax Credit for employers. Tying these incentives to designated Red Seal trades promotes interprovincial mobility and national standards.
2.2 Youth Awareness
The national Youth Awareness program provides financial assistance for projects designed to address community labour market issues. Through job fairs and promotional events, this program aims to raise awareness among employers and communities that young people are the labour force of the future. In 2011/12, program priorities included raising awareness of skilled trades and technologies among youth, and improving opportunities for youth in small rural communities. Delivered at the national, regional and local levels, Youth Awareness leverages funds from many sources, including P/Ts. In 2011/12, Youth Awareness expenditures supported 195 projects and totalled $8.1 million.
2.3 National Occupation Classification (NOC)
The National Occupational Classification (NOC) is Canada's occupational information infrastructure. It specifies and describes 500 distinct occupations according to skill type and skill level, detailing educational requirements, job descriptions and titles. In spring 2012, NOC 2011 replaced both Statistics Canada's National Occupational Classification for Statistics (NOC-S) 2006 and HRSDC's NOC 2006. Footnote 27 NOC 2011 provides students, workers, employers, human resource specialists and others with a common and consistent understanding of the entire range of occupational activity in Canada.
In 2011/12, the NOC 2006 and 2011 web sites (http://www5.hrsdc.gc.ca/NOC/) received more than 168 million hits and more than 9 million visits.
2.4 National Essential Skills Initiative
The main priority of the National Essential Skills Initiative is to improve the literacy and essential skills of adult Canadians in order to achieve the objectives set out in the Advantage Canada framework—to create the best-educated, most skilled and most flexible workforce in the world. At the national level, Literacy and Essential Skills (LES) programming contributes to productivity and economic competitiveness. Footnote 28

What are the Benefits of
Investing in Essential Skills?
- Increased Productivity
- Enhanced Workplace
- Efficiencies
- Increased Competitiveness
- More Vibrant and
- Engaged Workforce
- Better Workplace
- Health and Safety
- Better Team Performance
- More Highly Skilled
- Workforce
Through the Essential Skills Workplace Service, Essential Skills Workplace Literacy projects and Essential Skills Profiles, federal investments have leveraged significant contributions from employers and P/Ts. In 2011/12, 21 projects—with expenditures totalling $11.9 million—encouraged a large and growing body of employers to incorporate essential skills training and assessment tools into their human resource planning. Further, the development of tools and models through these projects may leverage or increase P/T investments in labour market programming, as well as federal Aboriginal and immigrant programming related to literacy and essential skills.
Pan-Canadian Programming in Action: Demonstration Project to Test Literacy and Essential Skills Intervention in the Workplace
This demonstration project, which started in late 2009/10 and will conclude in 2012/13, is testing the effectiveness of LES workplace-based interventions. It was designed to determine whether workplace LES training closes workers' skills gaps and improves job performance in ways that support individuals and meet company objectives.
Specifically, this project is testing:
- the effect of workplace LES training on improving LES levels of workers, and how these effects vary with the type of worker (e.g., demographic characteristics, age, gender, immigrant status), the nature of workers' skills gaps, and the firm's LES delivery model and practices;
- the effect of raising LES levels of individual workers on indicators such as job performance, wage growth, job stability, satisfaction with work, and participation in and completion of other training;
- the effect of raising firm-wide LES levels on indicators such as productivity or error rates, employee retention, and health and safety; and
- the benefits and costs of LES training for individual workers (who invest personal time), and for firms and governments (which both partially cover the costs of training).
2.5 Reducing Barriers to Labour Market Mobility
The Labour Mobility Initiative supports activities and strategies aimed at reducing or eliminating barriers to mobility. This will enable workers in regulated professions and trades, including internationally trained workers, to work in their occupation anywhere in Canada. In 2011/12, $2.0 million was invested in this initiative.
Pan-Canadian Programming in Action: Reducing Barriers to Labour Market Mobility
Regulatory authorities for licensed practical nurses are collaborating to develop more uniform standards to address barriers to labour mobility across Canadian jurisdictions. By establishing common inter-jurisdictional entry-to-practice competencies, as well as a common code of ethics and standards of practice, the profession is working to eliminate current barriers and prevent new barriers from arising.
Sustained federal investments and technical expertise help regulatory authorities and professional associations develop common standards and processes to improve labour mobility, as set out in the amended Chapter 7 (Labour Mobility) of the Agreement on Internal Trade.
In 2011/12, federal funding supported the development of inter-jurisdictional, entry-to-practice competencies and standards of practice in regulated occupations, which would otherwise pose barriers to labour mobility. Funding also helped regulatory authorities and national groups to develop common methods for language proficiency testing, further enhancing mobility across jurisdictions.
2.6 Research Project: Financial Assistance to Internationally Trained Workers
In 2011/12, the Foreign Credential Recognition (FCR) Loans pilot was launched to provide financial assistance to internationally trained individuals undertaking FCR activities. This research project was designed to create a strong base of evidence regarding the financial barriers faced by internationally trained individuals, including Canadians who obtained their education abroad.
This pilot will help authorities to determine internationally trained individuals' need for and interest in obtaining financial support while they are undertaking FCR activities. It will also measure the capacity of community-based partners, financial institutions and governments to work together to provide financial support to internationally trained individuals, and their interest in doing so. Finally, the pilot will help to determine whether there is an appropriate permanent federal role in providing financial assistance to internationally trained individuals.
Early in 2012, pilot sites were announced in British Columbia, Ontario and Saskatchewan. It was expected that a total of nine pilot sites would be operating in locations across Canada by the end of the 2012 calendar year, supporting up to 1,800 internationally trained individuals over the next three years. In 2011/12, expenditures for the FCR Loans pilot totalled $4.3 million.
In its March 2012 report on FCR, the Standing Committee on Human Resources, Skills and Social Development, and the Status of Persons with Disabilities (HUMA) recommended that the federal government establish a permanent loans program if results of the FCR Loans pilot are positive.
3. Finding Innovations and Supporting Agreements with P/Ts and Aboriginal Peoples
This investment stream includes the Pan-Canadian Innovations Initiative (PCII), which tests new approaches to helping people become productive participants in the labour force. Funding in this stream also supports existing agreements with P/Ts through the LMDAs and with Aboriginal peoples through the ASETS agreements. These agreements require Canada to fund activities that support service delivery and labour market development, such as EI systems connectivity; ensure EI claimants have timely access to EI Part II; and ensure effective reporting by P/Ts.
3.1 Pan-Canadian Innovations Initiative
Conducted in partnership with P/Ts, PCII aimed to remove barriers to full labour market participation for immigrants, Aboriginal people and other underrepresented groups by funding time-limited, research-oriented projects that tested and developed new approaches to helping persons prepare for, obtain or maintain employment, and become productive participants in the Canadian labour force. Governments and stakeholders were encouraged to test creative ways to incrementally improve existing programs.
In recent years, there has been less demand for PCII due to the P/T focus on local priorities, and the supplementary funding available under Labour Market Agreements and LMDAs. At the same time, the federal government's focus on stimulus programming led to a re-prioritization of spending, both across the government and within HRSDC.
As a result, PCII was winding down in 2011/12, with expenditures totalling just $500,000. Though HRSDC is not actively encouraging new submissions, it maintains the authority for PCII so that it can respond to changing circumstances. P/Ts may develop their own LMDA-funded initiatives under the R&I Support Measure discussed in section I of this chapter.
Pan-Canadian Programming in Action: PCII
A pilot conducted in September 2011 in Newfoundland and Labrador tested whether the combined use of classroom instruction, on-line distance education and volunteer mentors would increase participation in and successful completion rates for Adult Basic Education (ABE) level I training. Participants had low levels of literacy and also faced multiple barriers to learning, which included living in remote areas and facing social, family or employment-related challenges.
This blended method of delivering training through in-class teaching and evaluation combined with online instruction proved more successful than traditional in-class-only courses in every way. Measures of success included higher registration rates; lower dropout rates; higher completion rates; higher participation rates among women and Aboriginal people; and higher rates of participants taking subsequent learning courses. A majority of participants confirmed that the ability to pursue this training online, at their own pace and on their own schedule allowed them to accommodate childcare and job-related obligations that would otherwise have prevented them from participating in full-time classroom courses.
3.2 LMDA Systems Development
In Budget 2007, Canada announced its intention to enter into full-transfer LMDAs with five remaining P/Ts: Newfoundland and Labrador, Prince Edward Island, Nova Scotia, British Columbia, and Yukon. As part of this process, an expenditure of $28.5 million ($9.5 million per year for three years, beginning in 2008/09) was approved to help these P/Ts fund systems costs related to implementing their new LMDAs. In 2011/12, the four remaining jurisdictions (excluding Prince Edward Island) received $15.7 million for systems development.
3.3 LMDA Systems Connectivity
Under the LMDAs, Canada and P/Ts exchange client information required for the delivery of EBSM-similar programming. This includes personal information on clients' eligibility for EI and their referral to P/T benefit-based interventions; administrative data related to performance measurement and results; and data used to monitor, assess and evaluate P/T programs. Most of this information is shared electronically: P/Ts access systems provided by the Government of Canada (e.g., LMDA Access, Common System for Grants and Contributions) and exchange data with Canada via various support tools.
In 2011/12, HRSDC thoroughly reviewed LMDA-related systems development and identified opportunities to support emerging priorities. This work will continue in 2012/13.
4. Labour Market Information
Labour market information (LMI) is an essential component of Canada's economic agenda, because it can improve the efficiency and quality of the labour force, increase the labour supply, and help workers find suitable employment and employers find suitable workers.
The outcomes of LMI initiatives include ensuring that:
- individuals can make informed learning, career and employment choices;
- employers can make the right training and recruitment decisions; and
- governments can make effective, evidence-based policy and program decisions to ensure accountability for results.
The responsibility for LMI was not transferred to P/Ts under LMDAs. As outlined in Part II of the EI Act and the EI Regulations, the federal government is responsible for collecting and disseminating information on employment opportunities and labour market conditions, so that Canadians can access high-quality LMI about all areas of the country.
4.1 Research Projects
HRSDC uses R&I to fund activities that identify better ways of helping people prepare for or keep employment, and participate productively in the labour market. It funded two areas of research in 2011/12.
4.1.1 Research: Effectiveness of LMI
This research program—launched in 2008 and concluded in 2012—comprised a set of experimental projects. The projects primarily used random assignment to test the impacts of various LMI interventions on diverse clients—such as underemployed post-secondary graduates, displaced auto workers, recent immigrants, persons with disabilities and youth in school—as well as on various intermediaries providing career development assistance in several provinces. The experiments assessed the impacts of LMI on a range of variables, including confidence in and attitudes toward the labour market; decision-making related to studying, training, and career and job choices; and employment outcomes. More than 1,000 Canadians participated in these projects. In 2011/12, expenditures for this research program totalled $987,000.
To date, the research has revealed the following.
- Information is often necessary but not sufficient to elicit changes in behaviour. Motivation, skill and opportunity are also essential.
- Packaging and organizing LMI according to labour market needs, such as job seeking activities and the career decision-making process, produces better results.
- LMI interventions had a positive impact on intermediate outcomes, such as the ability to acquire and use additional LMI, undertake job searches, and make career-related decisions.
- Even though students at risk of dropping out tend to recognize the positive impact of post-secondary education, members of this group share characteristics (such as risk aversion and impatience) that may inhibit them from pursuing post-secondary education.
- Demographic, geographic and personal factors also affect job search, career decision-making and labour market outcomes.
4.1.2 Research: What Works in Career Development Services
In June 2011, HRSDC issued a call for concept papers to measure the results of career development services (CDS) through multidisciplinary research. The purpose of this research is to examine the factors affecting career development activities aimed at various groups of people facing obstacles in integrating into the labour market.
Of the 17 concepts submitted, 9 received funding for further development, with a total budget of $154,760. A departmental CDS advisory committee selected 3 of these projects for implementation starting in April 2012. The projects will identify key knowledge gaps related to CDS performance. In the implementation phase, the projects will carry out laboratory or field experiments using random assignment to create comparison groups to examine the impact of interventions or variations of key aspects of CDS.
The Canadian Career Development Foundation: Common Indicators is conducting two of the projects. They are: Transforming the Culture of Evaluation in Career and Employment Services; and Assessing the Impact of Career Information and Career Development Services across Employability Dimensions. The Social Research and Demonstration Corporation is conducting the Motivational Interviewing Pilot Project: Advancing Career Development Services for Income Assistance Clients. The findings from these projects will be available in May 2013.
4.2 LMI Business Data Platform Development
In 2011/12, HRSDC completed a two-year plan to improve learning and labour market information (LLMI) to support the decisions of individual Canadians, businesses and institutions. HRSDC collaborated with Statistics Canada, P/Ts and the private sector to pilot innovative tools to collect and provide information on the demand/employer side of the labour market that was previously difficult to access or simply unavailable.
The plan included the collection of information on monthly job vacancies using the Statistics Canada Business Payroll Survey. In December 2011, the Chief Statistician of Canada agreed to assume responsibility for collecting and disseminating monthly job vacancy data after the end of the pilot period on March 31, 2012. On January 24, 2012, Statistics Canada provided the first release of monthly job vacancy data, averaging data collected during the three-month period ending in September 2011. Monthly job vacancy data are now available through Statistics Canada's web site.
The plan also included the collection of information from a new pilot survey on labour market composition, compensation and turnover (employment, hiring and separations), with modules on job vacancies and skills/occupational shortages, and workplace practices, such as hiring and training practices. Data collection has been completed and a plan to proceed with the analysis of the results is in development.
Finally, new information products were developed in collaboration with P/Ts and Statistics Canada, through the Forum of Labour Market Ministers' LMI working group, to integrate measures of labour demand and labour market pressures, using private sector job postings, EI and Labour Force Survey data. All of this information is integrated to produce new information for Canadians, providing a timely, detailed and comprehensive picture of job opportunities and shortages, by small area/region and occupation.
5. National Employment Service Initiatives
Pan-Canadian operating funds support three national employment services HRSDC administers to help Canadians find suitable employment: Job Bank, Working in Canada (WiC) and LMI. These services—which are available online to all Canadians, free of charge—connect job seekers and employers, and help individuals complete their return-to-work action plans. Job Bank, WiC and LMI are designed to improve the way information about jobs and the labour market is disseminated by reducing duplication, improving the quality of information, and making online information more accessible and easier to use.
Since clients access these services on a self-serve basis with no registration required, data on results for these services are challenging to collect and to attribute to specific interventions.
5.1 Job Bank
In partnership with P/Ts, HRSDC maintains this electronic labour exchange, which fosters efficient and inclusive labour markets by connecting job seekers and employers. Job Bank listings are organized according to the NOC. Job Bank also provides specialized tools to help job seekers and employers connect, and to match skills with demand. These tools include Job Match, Job Alert, Résumé Builder and Career Navigator. In addition, the bilingual site provides users with information on acquiring the skills needed to pursue their chosen career.
In 2011/12, Job Bank hosted more than 150 million visits and provided access to over 1.1 million online job postings. Each day, Job Bank sends more than 53,000 job alerts to notify job seekers of potential employment opportunities, for a total of 19.4 million alerts sent in 2011/12. And, while the number of new job seeker accounts fell 20%, from 322,899 in 2010/2011 to 258,311 in 2011/12, job orders increased 6% year over year.
As of March 2012, more than 126,000 employers were using Job Bank for Employers and 330,000 job seekers had active accounts. The Job Match tool was used 9,219 times by employers to find suitable candidates and 101,380 times by job seekers to find jobs corresponding to their skills.
In 2011/12, the top five occupational groups advertised on Job Bank were Service Clerks, Truck Drivers, Labourers in Manufacturing and Utilities, Retails Salespersons and Sales Clerks, and Food Counter Attendants. These five groups accounted for 26.0% of all jobs advertised.
For more information on Job Bank, please visit http://www.jobbank.gc.ca.
5.2 Working in Canada
The Working in Canada (WiC) web site is HRSDC's single integrated site for LMI resources. WiC provides users with current occupational and career information that is accessible through an occupational search, a skills and knowledge checklist, and an educational program search. WiC leverages information from 23 sources, including Job Bank, and can generate more than 32,000 unique LMI reports based on a client's occupation and location. WiC reports provide targeted, comprehensive information on job postings, wage rates, employment trends and outlooks, licensing and certification requirements, job skills, and relevant educational and training programs for occupations at the regional, provincial and national levels.
More than 5 million WiC reports were generated in 2011/12, for a total of more than 9 million generated since WiC was launched.

For more information on WiC, please visit http://www.workingincanada.gc.ca.
5.3 Labour Market Information
The LMI service delivers accurate and reliable LMI to individuals and employers to help them make informed labour market decisions. LMI helps workers manage their career and search for a job by providing occupational and skills information. It assists employers to recruit, train and retain workers, and make business and investment decisions, by providing information on wages and on labour supply and demand.
A regional LMI network of analysts and economists identifies labour market trends by continually monitoring and analyzing socio-economic data and events. LMI staff members also work with stakeholders—including employers, educational institutions and other levels of government—to ensure that clients have access to high-quality LMI. The LMI products meet a national standard and identify trends at the community, occupational and industrial levels. This information is available for locations across the country at http://www.workingincanada.gc.ca.
Page details
- Date modified: