
EI Monitoring and Assessment Report 2012CHAPTER 4: PROGRAM ADMINISTRATION
Notice: Refer to the Table of contents to navigate through the EI Monitoring and Assessment Report .
This chapter discusses the delivery of Employment Insurance (EI) services to Canadians in 2011/12. Section I briefly examines the context in which EI benefits were delivered. Section II provides an overview of the delivery of EI benefits and related services by Service Canada. Section III explores the quality of EI services, including the accuracy of payments. Finally, Section IV assesses the integrity of the delivery of the EI program.
I. CONTEXT
Since 2005, Service Canada has been the face of government to millions of Canadians as the Government of Canada’s citizen-centred service delivery organization. Providing single-window access to a wide range of government services, Service Canada, as a dedicated service delivery organization, has made significant improvement in delivering programs and benefits to citizens.
EI is one of the core benefits Service Canada delivers. Service Canada’s role includes working to ensure Canadians have access to the EI benefits and services to which they are entitled and that clients receive their full entitlement. Service Canada is committed to processing timely and accurate benefit payments and services, and ensuring quality and efficiency by continuously improving and transforming its business operations.
Service Canada’s multi-channel service delivery model works to meet the day-to-day demands of delivering EI benefits and strives to efficiently provide consistently high-quality service to Canadians. The model faced challenges in 2011/12, as the Government of Canada saw a period of fiscal restraint while Service Canada continued to respond to higher-than-normal volumes of EI claims. Footnote 1 However, through continued investment in workload management tools, the Department continues to find innovative methods to overcome the challenges of processing EI benefits and effectively manage the program.
Service Canada remains committed to transforming and modernizing its business operations through automation and other process and service improvements. It will continue to enhance the electronic services available to individuals and businesses. Through increased automation, benefit modernization and improved service delivery, Service Canada strives to reduce costs and improve the value for money of delivering EI.
II. SERVICE DELIVERY
Service Canada supports EI clients through every stage of the process, from providing benefit information, responding to enquiries and assisting employers, to processing claims and providing the means to appeal decisions. This section describes each aspect of the service delivery spectrum.
1. Information and Enquiries
Through a multi-channel service delivery model, Service Canada provides clients access to EI information on the Internet, by telephone or in person.
1.1 On the Internet (Click)
The Service Canada website offers information on a wide variety of government programs and services, including online services and forms, all designed to help users find the service that they need. After a 67% growth in traffic from 2008/09 to 2009/10, and growth by a further 21.5% in 2010/11, growth in 2011/12 continued, with a 14% increase over the previous fiscal year, bringing the total annual visits to approximately 76.5 million. Footnote 2 On average, visitors viewed 3.7 pages on the Service Canada website, with a third of all visits (33%) totalling eight or more page views. Three of the top four web pages accessed through the Service Canada website home page are related to EI: “Complete your EI report” (8% of home page traffic), “Apply for EI Benefits” (5% of home page traffic) and the EI index page (5% of home page traffic). The top link was “Access My Service Canada Account,” which received 30% of all home page traffic. Over 90% of all My Service Canada Account (MSCA) sessions focused on EI-related transactions.
In 2011/12, Service Canada initiated a comprehensive review of all EI-related web content and publications, and successfully implemented smart publishing principles Footnote 3 for the most popular EI publications. Service Canada uses smart publishing principles to guide decisions on the appropriate communications medium to better meet Canadians’ needs, minimize waste, reduce costs and limit the Department’s environmental footprint. As a result, publications such as EI Regular Benefits were restructured and rewritten to provide Canadians with more convenient, user-friendly access to information. In another example, the 48-page publication How to Apply for EI was turned into a 3-page leaflet. Also, the preamble of the online EI application page was redesigned and reorganized into a step-by-step approach.
Service Canada continues to evaluate the following marketing activities:
- Between April 1, 2011, and March 31, 2012, the 13 videos pertaining to EI generated 460,039 downloads from the Service Canada website. Applying for EI was the most popular video, generating 129,413 downloads within that period. At less than $0.20 per view, web videos have proved to be a cost-effective way to help clients use self-serve options and complete transactions. The Department measured client satisfaction with an Intercept survey posted on the Internet, which users were asked to complete after viewing the videos. Among the results were the following:
- 79.4% agreed or strongly agreed that the language was clear and understandable;
- 74.8% liked that the presenter was a Service Canada employee and not an actor;
- 62.3% either agreed or strongly agreed that the knowledge and information they gained helped them continue their application or find what they were looking for; and
- 52.3% responded that they did not have to call the 1-800 telephone service or visit a Service Canada Centre for additional help.
- Videos are helping clients serve themselves. This results in overall savings, since the average cost of in-person service is higher than that of phone service and significantly higher than that of web service.
- After Service Canada improved the Finding a Job landing page in 2008, monthly page views increased from less than 14,000 to over 500,000 page views per month. This level of monthly page traffic (or page activity) was sustained in 2011/12, with an average of 566,000 page views per month. The web promo boxes, which feature timely and relevant information for clients, were designed to complement the landing page improvements. The web promo boxes were used 460,000 times by Canadians in 2011/12.
1.1.1 EI: Electronic Services
The EI section of MSCA (MSCA-EI) enables clients to view information on their current and previous EI claims online. In addition, MSCA-EI provides links to other electronic services, such as EI Application On-line (AppliWeb) and the Internet Reporting Service.
My Service Canada Account: EI
Through MSCA-EI, Canadians can perform the following actions on their account related to EI:
- view their EI messages, payment information and claim information;
- view and change their EI direct deposit details, mailing address and telephone number;
- view and print their EI tax slips;
- view their electronic Record of Employment (E-ROE); and
- register in the EI program for access to special benefits for self-employed persons.
In 2011/12, logins to MSCA on the Service Canada website increased by 46.7% over the previous fiscal year, with Canadians logging onto MSCA 23.4 million times. Footnote 4 As well, there were almost 905,000 new registrations for MSCA, an increase of 8% over the previous year, for a total estimated active user base of over 1.68 million. An estimated 90% of the activity on MSCA continued to be related to EI functions, with approximately 25% of EI clients accessing MSCA for information.
EI Application On-line (AppliWeb)
The EI Application On-line (AppliWeb) allows clients to file for EI benefits on the Internet. Clients can apply from home or anywhere else they have access to the Internet. AppliWeb is available seven days a week, 24 hours a day. Clients can also apply for benefits by visiting their local Service Canada Centre, where they can access the EI Application On-line.
Internet Reporting Service
To receive EI benefits, most claimants must complete and submit biweekly reports to demonstrate their continuing entitlement. The Internet Reporting Service allows claimants to do so easily and securely over the Internet, 24 hours a day, 7 days a week.
Recent enhancements to the Internet Reporting Service allows claimants to provide information regarding absences from Canada and/or training courses directly, resulting in fewer calls to EI call centres, enabling the auto-adjudication process and decreasing the workloads of processing centres.
The advantages of using the Internet Reporting Service to complete EI reports are as follows:
- faster processing of EI payments;
- availability of service to hearing-impaired claimants and claimants without access to a touch-tone telephone;
- elimination of delays and mailing costs, if the claimant subscribes to direct deposit; and
- fast, convenient, simple and secure service.
1.2 By Telephone (Call)
1.2.1 Specialized EI Call Centres
For more complex enquiries, Service Canada has a specialized EI call centre network. It is the public’s primary point of contact for claim-specific enquiries related to the EI program, such as questions related to application process and status, benefit eligibility, and benefit delivery. Clients always have access to EI information via an automated telephone information system, as well as citizen service officers (CSOs), who are available Monday to Friday.
As part of an ongoing effort to ensure call centre hours are aligned with call volume, Service Canada completed a review and implemented changes accordingly. In 2011/12, agents were available to assist clients from 8:00 a.m. to 6:00 p.m. local time and answered 5.7 million client enquiries, including calls to the Employer Contact Centre (ECC), which is 1.1 million fewer calls than answered in 2010/11. While the Department strives to answer 80% of calls within 180 seconds, in 2011/12, it answered only 29% of calls within 180 seconds, 13% lower than 2010/11. This decreased call-handling capacity is largely attributed to increases in average handling time, due to the need to explain complex legislation, and periods of the year when there were processing delays. More detailed information on call volume can be found in Annex 4.2.
Call centre modernization efforts advanced in 2011/12 in the areas of business processes and people management. Service Canada implemented new business processes allowing call centre agents to complete selected transactions that would otherwise have been forwarded to processing for action. In 2011/12, call centre agents resolved approximately 113,000 client inquiries, increasing the resolution rate at the first point of contact from 83% to 85%.
1.2.2 1 800 O-Canada
From within Canada and from more than 60 countries, Canadians can call the 1 800 O-Canada line Monday to Friday with general enquiries. For callers in Canada, service is available from 8:00 a.m. to 8:00 p.m. in each time zone. For callers outside Canada, service is available from 8:00 a.m. to 8:00 p.m. Eastern time. Service is provided in English and French. In 2011/12, 1 800 O-Canada agents answered 2.3 million calls, including more than 575,000 calls related to EI general enquiries. Call volumes for 1 800 O-Canada remained relatively constant from 2009/10 to 2010/11, but increased by 24% from 2010/11 to 2011/12. EI-related calls increased by 24% from 2009/10 to 2010/11, and by a further 57% from 2010/11 to 2011/12. Footnote 5 The increase in EI-related enquiries to 1 800 O-Canada could be associated with high call volumes at the specialized EI call centres. The service delivery standard is to have bilingual agents answer 85% of the calls within 18 seconds (three rings). This service standard also applies to EI-related calls. In 2011/12, 29.4% of calls met this service standard, compared with 42.1% the previous year.
The second 1 800 O-Canada service standard is that EI callers have access to the interactive voice response (IVR) system. In 2011/12, 99.3% of callers trying to access the IVR system were able to do so, compared with 99.7% of callers the previous year.
Service Canada conducted client satisfaction surveys in 2006, 2008 and 2010. The 2010 survey showed that 89% of clients were satisfied with the 1 800 O-Canada service, with more than two thirds (69%) of these clients saying they were very satisfied. These results have remained consistent year over year. In 2011/12, a mystery shopper research exercise was conducted. It showed that 96% of callers (mystery shoppers) were able to reach 1 800 O-Canada on their first attempt and 90% of the callers received the general information that was relevant to the call scenario.
1.3 In Person (Visit)
Service Canada has more than 600 in-person points of service (Service Canada Centres, Scheduled Outreach Sites and Service Canada Community Offices). Clients made over 4.9 million EI-related visits to an in-person point of service across the country in 2011/12.
Service Canada employees in the in-person channel provide general information to citizens on the application process and eligibility criteria, such as how to apply, required documents and proof of identity for the EI program. They also help clients fill out paper and online benefit applications, which entails verifying information for completeness, validating supporting documents and identifying the client. Service Canada aims to ensure that 90% of Canadians have access to a Service Canada point of service (Service Canada Centre or Scheduled Outreach Site) within a 50-kilometre drive of their home; it is meeting this service standard. Over the coming years, the network of offices will be adjusted gradually, when opportunities arise and budgets permit. Ongoing realignment of the points of service network is necessary as Service Canada becomes more modern, focused and efficient in its service delivery in the context of expected resource constraints.
Service Canada’s in-person points of service fall under four categories.
1.3.1 Service Canada Centre (SCC)
- An SCC is a full-time office, open five days a week, managed and occupied by Service Canada staff, offering general information and transactional services. SCCs are primarily located in urban centres, and may stand alone or co-located with other organizations.
1.3.2 Micro Service Canada Centre (New)
- A micro SCC is a part-time office in a rural or remote area that is open to the public for a maximum of 30 hours per week (two to four days per week). It offers the same level of service as a regular SCC, with the same information technology (IT) infrastructure.
1.3.3 Scheduled Outreach Site
- A Scheduled Outreach Site is a point of service that is physically located outside an SCC but offers similar services. Service Canada employees (from a nearby SCC or Micro SCC) travel to a pre-determined location regularly (for example, one day per week) to deliver services. Scheduled Outreach is typically offered in rural or remote locations, offered at partner premises (such as band council, provincial or territorial offices), and managed through service contracts and/or memoranda of understanding.
1.3.4 Mobile Outreach Service
Service Canada uses Mobile Outreach Service (MOS) to connect with communities across the country. It complements the services already provided at SCCs and Scheduled Outreach Sites, and is part of the in person service delivery network. MOS increases awareness of Service Canada programs and service offerings, providing Canadians with information at places such as job fairs, mass layoff sites, schools, community service organizations and retirement homes.
Between April 2011 and March 2012, through its MOS, Service Canada delivered:
- more than 12,800 EI information sessions to employers, with a total of almost 17,900 companies and organizations participating;
- approximately 1,700 EI information sessions to workers facing layoffs, with a total of more than 49,700 participants; and
- more than 400 EI information sessions to workers on work sharing, with a total of more than 9,000 participants. Footnote 6
During the same period, citizen services specialists attended:
- 80 fairs, exhibits or kiosks for employers, providing EI general information to nearly 3,000 participants; and
- nearly 9,300 fairs, exhibits or kiosks for workers, providing EI general information to more than 12,000 participants.
In addition, SCC staff answered over 5.1 million EI-related requests, including 89,000 requests during Scheduled Outreach in 2011/12. Service Canada further expanded in-person service delivery by extending the use of Scheduled Outreach Sites, increasing the number of locations from 253 at the beginning of 2011/12 to 270 by fiscal year end.
2. EI Services for Employers
Service Canada works closely with employers to ensure that the EI program is administered fairly and efficiently. As employers issue Records of Employment (ROEs), a requirement to establish EI claims, Service Canada continues to seek ways to improve services it provides to employers, as discussed below.
2.1 Electronic Record of Employment
The ROE is the key document used to process EI benefits, and to determine EI entitlement, rate and claim duration. The electronic ROE (E-ROE) is a major element of the automation of the EI program.
In response to the Red Tape Reduction Commission, Service Canada is examining efficient and cost-effective methods to reduce the ROE administrative burden on employers. The E-ROE is a key way to reduce this burden, as employers no longer need to order or store paper ROE forms, retain copies on file, or send copies to Service Canada or to their employees. E-ROEs have other advantages: employers can issue E-ROEs in alignment with pay cycles, amend them more easily than paper ROEs and complete hundreds of them at once. In addition, E-ROEs improve service to claimants and help minimize errors. However, employers can still use paper ROEs: each paper ROE has a unique pre-printed serial number that allows Service Canada to ensure that it issues ROEs only to employers with a valid Canada Revenue Agency (CRA) business number.
To increase the take-up of the E-ROE, Service Canada developed a 2011–2013 marketing strategy in September 2011 to support the following objectives:
- advance the EI Automation and Service Improvements project, which includes initiatives to improve services for employers and increase the number of E-ROEs; and
- register 26,000 new businesses and receive 65% of all ROEs electronically.
Service Canada undertook a comprehensive rebranding of ROE Web Footnote 7 to promote the electronic application to employers with the tagline “Register, Submit, Save.” The Department planned targeted activities to encourage registrations in industries that used the most paper ROEs.
The Department implemented the following tactics in 2011/12, which helped it surpass its target to receive 65% of all ROEs electronically.
- CRA mailout: In January 2012, an ROE Web insert was included with the approximately 1.1 million remittance slips that CRA distributed to all employers across Canada. More than 3,500 employers visited the ROE Web page as a result of this campaign. Compared with last year’s CRA mailout, new branding and messages proved to be very effective and contributed to a 45% increase in the response rate.
- Outreach: Service Canada launched an outreach campaign with trade and professional organizations in September 2011. Currently, the Department has established relationships with 48 organizations reaching out to more than 500,000 member employers, by posting articles, blog posts and banner ads on their websites, e-newsletters, print and online magazines.
- Webinars: Service Canada piloted a webinar as an effective and low-cost vehicle to promote ROE registrations. The webinar was promoted at the 2011 Canadian Payroll Association (CPA) conference. Fifty CPA attendees participated in this webinar, which received very positive feedback.
- Tutorials: Service Canada created a series of interactive, online tutorials to give detailed instructions on how to complete ROEs and reduce errors. The interactive examples in these tutorials complement the guide How to Complete the Record of Employment Form. In one month, the five tutorials had more than 5,000 visitors.
- Video: More than 3,500 visitors viewed the new promotional ROE Web video in the first two months after its release.
By the end of 2011/12, a total of 285,846 employer businesses—including 45,099 new ROE Web registrants—had registered for E-ROE products. These include ROE Web and ROE Secure Automated Transfer, a secure communication line designed to allow large payroll service providers or businesses to submit large volumes of ROEs simultaneously. Consequently, the majority of ROEs (65.8% or 5.9 million) were submitted to Service Canada electronically, a 14.6% increase over the previous year Footnote 8 (see Chart 1).
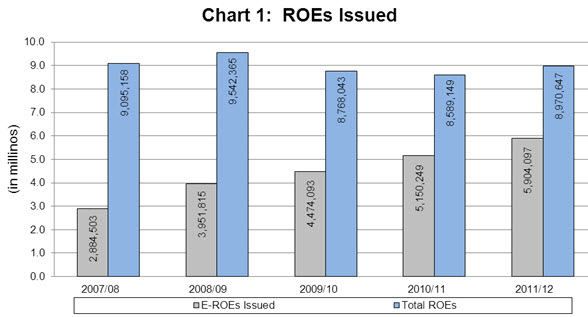
Table equivalent for Chart 1
| Year | E-ROEs Issued | Total ROEs |
|---|---|---|
| 2007/08 | 2,884,503 | 9,095,158 |
| 2008/09 | 3,951,815 | 9,542,365 |
| 2009/10 | 4,474,093 | 8,768,043 |
| 2010/11 | 5,150,249 | 8,589,149 |
| 2011/12 | 5,904,097 | 8,970,647 |
Source: EI Administrative Data
2.2 Employer Contact Centre (ECC)
The ECC enhances service to employers by providing an accessible, national, single point of contact, delivering services such as ROE advice and guidance, ROE orders, and ROE Web technical support.
In June 2011, Service Canada launched two national call centres located in Bathurst and Vancouver to respond to enquiries from employers across the country. The ECCs answered 389,164 calls from June 2011 to March 31, 2012. The Department continues to streamline services to employers. The top three reasons why employers contact an ECC are to:
- request orders for paper copies of ROEs;
- get support for the web based tool for employers to manage ROE’s; and
- seek guidance on completing an ROE.
3. EI Services for Individuals
3.1 Claims Processing
In 2011/12, Service Canada received 2.86 million EI applications. Although this represented a 1.6% reduction from the previous fiscal year, the volume of claims remained high compared with the pre-recession volume of 2.6 million claims. Footnote 9
Speed of payment, a key performance indicator, is defined as the percentage of initial and renewal claims for which the Department sends a payment or non-payment notification to the claimant within 28 days of the date of filing. Several factors can affect speed of payment, including benefit applications that are missing information or that require clarification of information, and complex applications that require Service Canada to do fact-finding with employers and third parties to render a fair and equitable decision. Claim volumes can fluctuate dramatically from week to week. During peak intake weeks, a large percentage of claims are automated, which causes the performance indicator to rise sharply. Following a peak intake, the residual volume of complex claims requiring manual intervention may result in a dip in the speed of payment results. In 2011/12, without the level of temporary funding provided under the Economic Action Plan in the previous two years to respond to workload volumes, Service Canada returned to a yearly objective of 80% for speed of payment. With fiscal restraint and an ongoing high volume of claims, the Department was unable to meet this target, reaching an average speed of payment of 71.1%, with all regions of the country within 2.6% of the national outcome. Footnote 10
Service Canada balanced EI claims processing service levels across the country by advancing its National Service Delivery Model. The ability to move work virtually resulted in consistent and equitable service to all EI clients, as demonstrated by the speed of payment variance rate noted in the above paragraph.
3.2 EI Special Benefits for Self-Employed People
Since January 2010, self-employed individuals who are Canadian citizens or permanent residents have been able to voluntarily enter into an agreement with the Canada Employment Insurance Commission to participate in the EI program for access to special benefits, which include maternity, parental, sickness and compassionate care benefits. Self-employed individuals have been able to apply for EI special benefits since January 2, 2011. As of March 31, 2012, a total of 10,422 self-employed individuals were registered with the EI program. Claims from self-employed people are processed in one national specialized centre to promote service excellence.
4. Service Transformation
In 2011/12, Service Canada continued to invest in the design and use of technologies to support automated application processing, as well as to expand Internet services, thus improving EI service delivery to Canadians. These enhancements changed the benefits processing network and expanded its ability to respond to workload volumes by introducing more standardized processes and increasing levels of automation. These innovations contributed to more accurate and consistent services for Canadians.
Since electronic EI applications were implemented in 2001/02, their proportion of all applications has steadily increased, from 17% that year to 98.0% in 2011/12. Moreover, in the most recent fiscal year, 99.9% of eligible claimants filed their biweekly reports electronically, and 59.7% of all initial and renewal claims were partially or fully processed by automated means. While the amount of benefits paid out annually has increased and the number of EI applications has increased slightly since 1999/2000, the cost per initial and renewal claim processed has declined from $97.80 in 2001/02 to $59.88 in 2011/12. This decline represents a 38.8% drop in cost per claim. The gradual increase in electronic services and in claims automation has reduced the amount of manual claims processing activity, which results in fewer resources required to process the claims and a lower cost per claim. In 2011/12, employers submitted 65.8% of their ROEs via online services, and 88.9% of clients opted to receive their EI benefit payments via direct deposit Footnote 11 (see Chart 2).
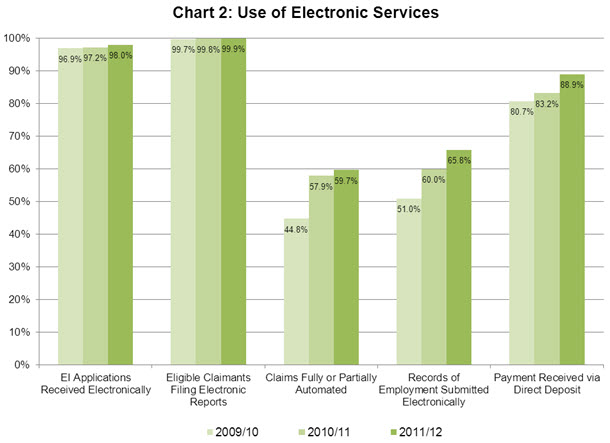
Table equivalent for Chart 2
| 2009/10 | 2010/11 | 2011/12 | |
|---|---|---|---|
| EI Applications Received Electronically | 96.9% | 97.2% | 98.0% |
| Eligible Claimants Filing Electronic Reports | 99.7% | 99.8% | 99.9% |
| Claims Fully or Partially Automated | 44.8% | 57.9% | 59.7% |
| Records of Employment Submitted Electronically | 51.0% | 60.0% | 65.8% |
| Payment Received via Direct Deposit | 80.7% | 83.2% | 88.9% |
Source: EI Administrative Data
5. Appeals of EI Decisions
The EI appeals process provides claimants and employers with a means to challenge, before an independent external authority, an administrative decision that they believe was made in error or with which they are dissatisfied. There are two levels of appeal under the Employment Insurance Act: boards of referees and umpires. Further recourse is available at the Federal Court of Appeal and, finally, at the Supreme Court of Canada.
A board of referees is an independent, impartial tribunal. Each three-member panel consists of a chairperson appointed by the Governor-in-Council, a member appointed by the Commissioner for Employers and a member appointed by the Commissioner for Workers. Approximately 900 part-time board members hear appeals in 83 board centres across Canada.
In 2011/12, boards of referees heard 22,009 appeals, 63.0% of which were scheduled on a hearing date that fell within 30 days of receipt of the appeal notice. Boards’ decisions are normally issued within seven days of the hearing. Approximately 21% of the cases heard by boards resulted in a reversal of the Department’s decisions.
Claimants, employers, and claimant and employer associations, as well as the Canadian Employment Insurance Commission, can appeal a board of referees decision to an umpire—an independent, administrative tribunal. Some 20 to 40 federal court judges or retired provincial superior court judges sit alone as umpires and hear cases across Canada.
In 2011/12, clients filed 1,494 appeals to umpires; the Department prepared and sent 96.8% of the client appeal dockets to the Office of the Umpire within 60 days of receiving the appeal notice. As this is a legislated requirement, the target is 100%. The main factor contributing to the slight variance stems from delays in the routing of paper documentation between business lines. In addition to client appeals, the Commission filed 420 appeals to umpires. Approximately 16% of the decisions rendered by umpires were favourable to the client.
Claimants, employers and the Commission can seek judicial review of an umpire’s decision at the Federal Court of Appeal. In 2011/12, the Federal Court of Appeal rendered 209 decisions on cases related to EI benefits, 2% of which were favourable to the client. The Supreme Court of Canada did not issue any decisions related to EI.
III. QUALITY
1. Payment and Processing Accuracy
1.1 EI Payment Accuracy Review
The EI Payment Accuracy Review (EI PAAR) measures the accuracy of EI benefit payments. Over the last 15 years, the payment accuracy rate has hovered around the established 95% Footnote 12 target (error rate of 5.0%). Footnote 13
The EI PAAR consists of a random sample of 500 EI claims per year that are reviewed by two separate PAAR reviewers; results from both reviews are compared to ensure the accuracy and impartiality of results, ensuring consistency in results among reviewers. Each review provides detailed information on the causes and dollar value of undetected errors at the time of adjudication. Errors include overpayments and underpayments attributable to three sources: claimants, employers and Service Canada (see Table 1). The EI PAAR also determines the “most likely” value of incorrectly paid benefits, and the results are used to improve program delivery and sustain program integrity. The Office of the Auditor General (OAG) uses EI PAAR results in its annual financial audit of the EI Account, the results of which are reported each year as part of the Public Accounts of Canada.
The EI payment accuracy rate increased from 94.0% (or 6.0% error rate) in 2010/11 to 95.2% (or 4.8% error rate) in 2011/12. The decrease in the error rate to 4.8% is attributable to two factors: a decrease in the Service Canada and claimant error rates.
The decrease in Service Canada errors is likely attributable to the return to a more stable processing environment (the error rate dropped by 0.9 percentage points, from 1.9% to 1.0%, between 2010/11 and 2011/12). The 2010/11 report noted that the downturn in the economy had negatively impacted workload, which resulted in the hiring of a thousand new employees to handle additional volume. Many of these new hires had no previous knowledge of the complex EI program and may have received less training than usual.
Claimant errors also decreased by 1 percentage point compared with last year, from 3.0% to 2.0%. It is likely that the EI client base changed following last year’s recession cycle. In difficult economic times, the proportion of new claimants with no prior experience with the EI program reporting requirements increases from an approximate 20% to 30%, consequently resulting in a rise in claimant errors. With increased economic stability over the past year, there has likely been a return to a client base that is more familiar with EI reporting requirements. The EI PAAR data reveals that the two types of claimant errors - (1) failure to report earnings and (2) failure to report non-availability for work while in receipt of benefits - represent 80% and 20% of all claimant errors, respectively. Those proportions are consistent with last year’s results of 79% and 21%, respectively.
While Service Canada and claimant errors decreased in 2011/12, employer errors increased by 0.7 percentage points, from 1.1% to 1.8%, compared with last year. During the post-audit ROE validation with the employer, employer errors were detected in all of the files randomly reviewed in the PAAR program. Of the errors, 58% were made by employers who own a small business (rather than a medium-sized or large firm, who may have more familiarity with the completion and issuance of ROEs). In addition, 58% of the erroneous ROEs were paper ROEs, suggesting that electronic ROEs are more accurate. Please refer to section 2, EI Services for Employers, for more detailed information on Service Canada’s effort to increase the intake of electronic ROEs.
| 2011/12 | 2010/11 | |||
|---|---|---|---|---|
| Total EI Benefit Payout | $16.1 billion | $17.8 billion | ||
| EI Payment Accuracy Rate | 95.2%** | 94.0%** | ||
| Estimated Total Value of Mispayments* | Extrapolated Value | Error Rate | Extrapolated Value | Error Rate |
| $772.3 million | 4.8%** | $1.1 billion | 6.0%** | |
| By source | ||||
| - Employer | $286.0 million | 1.78% | $197.1 million | 1.11% |
| - Claimant | $325.3 million | 2.03% | $530.4 million | 2.98% |
| - Service Canada | $161.1 million | 1.00% | $340.9 million | 1.92% |
* Mispayments are the sum of overpayments plus underpayments.
** Results have been rounded to the first decimal.
1.2 EI Processing Accuracy Review
The EI Processing Accuracy Review (EI PRAR) comprises a review of a random sample of approximately 18,500 initial, renewed and revised decisions per year. It verifies that applications for benefits are adjudicated and calculated in accordance with national operational policies and procedures. The EI processing accuracy rate is the rate at which claims processing activities conform to EI national operational policies and procedures. In 2000/01, the Department implemented Quality Monitoring now known as EI PRAR to measure the percentage of initial claims “in order” (a claim is considered to be “in order” when all criteria relevant to the review of the claim have been met). In 2005/06, Service Canada set a national target of 80%. At present, officials are examining whether the EI PRAR target should be increased.
In 2011/12, the processing accuracy rate dropped by 2.9 percentage points to 85.9% from 88.8% in 2010/11. Footnote 14 Each year, Service Canada develops a national quality action plan to ensure continued processing improvements. The plan focuses on the three errors that occurred most frequently across the country, as well as one or two regionally identified areas for improvement.
2. Information and Transaction Accuracy
The National Quality Assurance Program (NQAP) in EI call centres aims to ensure quality and consistency of service to clients, to identify employee training needs and opportunities for improvement, and to provide ongoing feedback and support to employees.
In 2011/12, the NQAP was enhanced and streamlined to better define the scoring criteria and categories used to evaluate calls. Fiscal 2011/12 was the first full year of operation of the enhanced NQAP.
A total of 12,686 calls were monitored in 2011/12. Results for the year were 86% against a target of 80%.
3. Insurability of Employment
The Minister of National Revenue is responsible for the administration of Part IV (Insurable Earnings and Collection of Premiums) of the Employment Insurance Act. This responsibility includes the issuance of rulings regarding the insurability of employment, the number of insurable hours and the amount of insurable earnings.
Service Canada requests rulings from CRA when a claim for EI benefits has been filed and the insurability of employment, the amount of insurable earnings or the number of insurable hours is in question. It does so to ensure that the claimant receives the amount of EI benefits to which he or she is entitled. CRA aims to issue a ruling within 15 calendar days when payment of a claim is pending and within 31 calendar days when payment is not pending. In 2011/12, Service Canada requested 10,924 rulings from CRA, a 5.0% decrease from 2010/11.
IV. INTEGRITY
Given the large scale of the EI program, Canadians expect sound stewardship and accountability for the program’s integrity. The Department maintains a balance among detection, deterrence and prevention activities. The Integrity program focuses on detection activities using a variety of programs and systems, such as Computer Post Audit, the Report on Hirings program and Automated Earnings Reporting Systems. In addition, Service Canada carries out education and prevention activities, such as Claimant Information Sessions. These activities inform claimants, employers and the general public about EI requirements and the consequences of abusing the EI system, such as penalties or prosecutions.
In 2011/12, Service Canada held 9,607 Claimant Information Sessions, to which 166,433 claimants were directed to attend. Service Canada also conducted 367,053 investigations into suspected client error and fraud. Footnote 15 Combined, these activities resulted in a total of $385.6 million in savings for the EI Operating Account (see Chart 3). These savings consist of recovered overpayments and associated penalties, as well as the discontinuation of future ineligible payments, benefitting both employee and employer premium payers alike through the reduction in the total cost of the EI program.
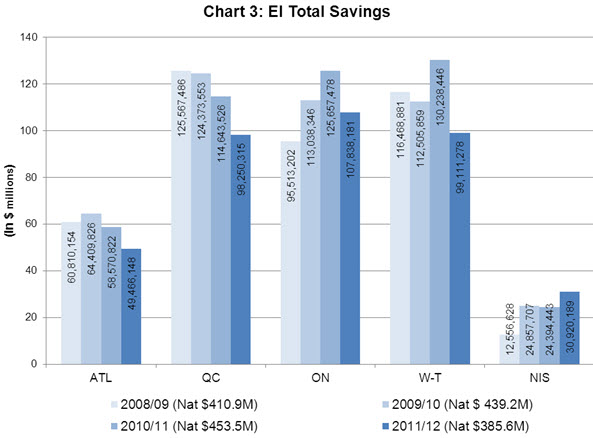
Table equivalent for Chart 3
| Region | ($) | |||
|---|---|---|---|---|
| 2008/09 (Nat $410.9M) | 2009/10 (Nat $439.2M) | 2010/11 (Nat $453.5M) | 2011/12 (Nat $385.6M) | |
| ATL | $60,810,154 | $64,409,826 | $58,570,822 | $49,466,148 |
| QC | $125,567,486 | $124,373,553 | $114,643,526 | $98,250,315 |
| ON | $95,513,202 | $113,038,346 | $125,657,478 | $107,838,181 |
| W-T | $116,468,881 | $112,505,859 | $130,238,446 | $99,111,278 |
| NIS | $12,556,628 | $24,857,707 | $24,394,443 | $30,920,189 |
Source: EI Administrative Data
* NIS: Cases dealing with unreported absences from Canada while on EI, as well as the Report on Hirings program, are centrally managed through Integrity’s National Investigative Services (NIS) centre in Miramichi, N.B.
Service Canada maintains management frameworks, processes and risk-based controls to strengthen the integrity of its programs by ensuring operational and service compliance. In addition, the Department continues to place significant emphasis on the importance of protecting the information entrusted to it by Canadians.
1. Integrity Quality Initiatives
A national quality team, which is specific to Integrity Operations in the regions, helps ensure consistent quality management of regional Integrity units and their investigative work. Its work includes ensuring that every region has quality advisors and coordinators, incorporates quality management plans in business planning, and conducts consistent monitoring. National Headquarters makes regular monitoring visits to regional Integrity units to evaluate Integrity program activities.
Service Canada has taken significant steps to implement a quality management and reporting system for the Social Insurance Number (SIN) program’s database, the Social Insurance Register (SIR). Since 2007, it has measured the accuracy rate of all data on the SIR annually. In the 2011 calendar year, the key performance indicators for the SIR were as follows:
- the accuracy rate for vital events (birth and death data) was 97.9%; and
- the accuracy rate for legitimate SINs issued was greater than 99.9%.
In addition, since 2008, Service Canada has implemented a quality management strategy for new updates to the SIR—specifically, those related to clients applying for a SIN or updating their SIN. In 2011/12, of the updates reviewed, 99.97% were free of critical errors (i.e., no multiple SINs were issued and no date of birth errors were made). Overall, the accuracy of the SIR is fundamental to all SIN-enabled programs, including the EI program, as accurately identifying clients is crucial to ensuring benefits are paid to the correct and eligible individuals.
2. Risk Management
Service Canada is responsible for ensuring that the right amount of EI benefits is allocated to the right recipient for the intended purpose. In 2011/12, Service Canada continued to emphasize the use of risk management strategies in its approach to investigations, to improve the overall integrity of the program and to ensure that correct payments were made to eligible claimants. As part of this activity, the Integrity Services Branch has a robust risk analysis function to quantitatively and qualitatively assess program integrity risks and develop appropriate mitigation strategies.
Over the past several years, there has been a focus on simplifying processes to increase efficiencies and enable automation of EI claims. In its vision to modernize and provide claimants with easily accessible services, the Department considers the impact that simplification measures have on its ability to maintain stewardship of EI funds and other obligations, as prescribed in the EI Act and Regulations.
The Department conducted a quantitative risk assessment to identify and quantify the nature and extent of risks or errors associated with the payment of sickness benefits that arise when the Department does not request a claimant to submit medical proof of illness. Currently, claimants do not have to submit proof during the first 9 weeks of illness. The study not only looked at the risks associated with this current practice, but also projected the impact if this requirement were relaxed for the full maximum 15 weeks of payment.
Results from this study have informed senior management of the need to implement mitigation strategies. Post-monitoring activities, implemented in fall 2012, will track payment accuracy and inform if any further mitigation are warranted.
Page details
- Date modified: