
Employment Equity in the Public Service of Canada 2013–14
Notice to Reader
Please note, on June 12th, 2015, the following corrections were made to Table 1 of the Annual Report. Under the column titled "Women", the number and percentage of women for the following organizations should read: for the Registry of the Specific Claims Tribunal of Canada, 4 and 44.4%; for the Registry of the Competition Tribunal, 3 and 50.0%; and for the RCMP External Review Committee, 1 and 25.0%.
ISSN: 1926-2485
Catalogue No. BT1-28/2014E-PDF
Table of Contents
- President's Message
- Introduction
- Treasury Board of Canada Secretariat Activities
- Conclusion
- Appendix A: Statistical Tables
- Appendix B: Technical Notes
- Footnotes
President's Message
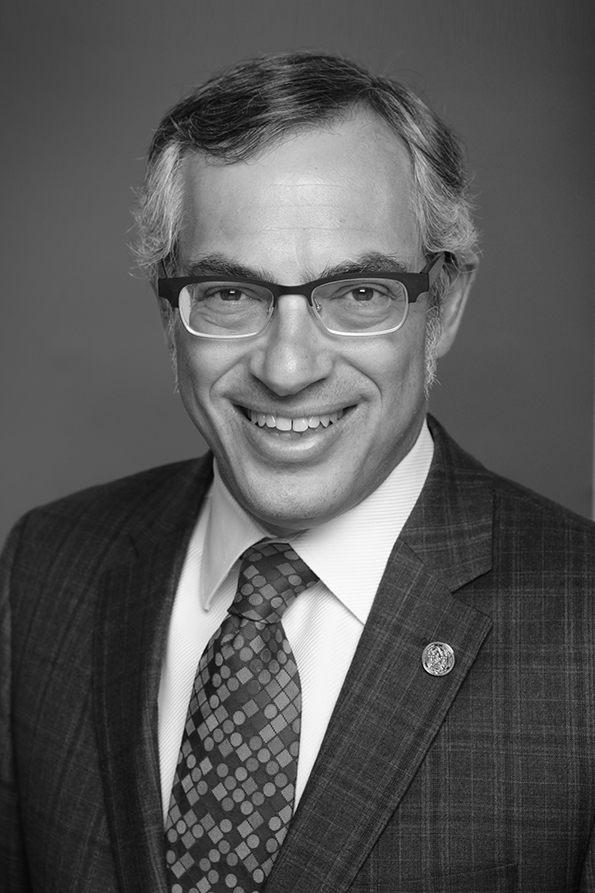
I am pleased to present the 22nd Annual Report to Parliament on Employment Equity in the Public Service of Canada.
As a champion of modernizing the federal public service, I know a workforce that reflects the people it serves is better able to design and deliver programs and services to meet the needs of Canadians. The federal public service has contributed much to Canada's success, and I am proud of how far we have come in building a public service that reflects the diversity of our society.
This report demonstrates the progress that federal departments and agencies continue to make in developing inclusive organizations that reflect, respect, and value Canada's rich diversity. In particular, the report shows that all employment equity designated groups are fully represented within the core public administration in terms of their workforce availability.
These positive results are evidence of the Government's ongoing commitment to ensuring Canadians are served by a representative and inclusive public service that truly reflects today's society. I invite all Canadians to read this report to see the progress we are making in meeting the objectives of the Employment Equity Act.
Original signed by
The Honourable Tony Clement
President of the Treasury Board
Introduction
The Employment Equity Act requires the President of the Treasury Board to submit a report to Parliament on the state of employment equityin the core public administration (CPA) for each fiscal year. This report outlines results and progress with respect to the representation of employment equity designated groups for fiscal year 2013–14.
The Government of Canada remains committed to a diverse public service that reflects today’s society, a message which was reinforced when the Chief Human Resources Officer of the Government of Canada appeared before the Standing Senate Committee on Human Rights in April 2013 and stated, “Our ultimate goal is to ensure that the workforce in the federal public service reflects the diversity of today’s society, and is innovative and responsive to address the needs of all Canadians.” The Clerk of the Privy Council also addressed this issue when he launched Blueprint 2020 in June 2013, a dialogue on a vision for a world-class public service “reflecting the diversity of Canadian society and drawing on a vast array of skills and expertise to meet the needs of Canadians and respond to the priorities of the Government.”
As at March 31, 2014, all four employment equity designated groups exceeded their workforce availability, as determined from 2006 Census data.Footnote 1 Aboriginal peoples continued to increase their representation, from 5.0 per cent to 5.1 per cent; members of a visible minority group increased their representation from 12.6 per cent to 13.2 per cent; the representation of persons with disabilities decreased marginally from 5.8 per cent to 5.7 per cent; and women’s representation decreased slightly from 54.2 per cent to 54.1 per cent.
Within the executive cadre, representation rates continued to exceed workforce availability for three of the four designated groups. Women increased their representation from 46.0 per cent to 46.1 per cent; persons with disabilities increased their representation from 5.3 per cent to 5.4 per cent; and members of a visible minority group increased their representation from 8.2 per cent to 8.5 per cent. The representation of Aboriginal peoples remained stable at 3.7 per cent, below their workforce availability for executives.
Appendix A provides statistical tables. Technical notes in Appendix B provide an explanation of the CPA workforceFootnote 2 information on the data for persons in the designated groups and definitions of terminology used throughout this report.
Treasury Board of Canada Secretariat Activities
Collaboration
The Office of the Chief Human Resources Officer (OCHRO) in the Treasury Board of Canada Secretariat works closely with the Public Service Commission of Canada (PSC) on employment equity issues. In addition to continuing collaboration on their common methodology for data collection and reporting, the two organizations, in collaboration with Employment and Social Development Canada and Shared Services Canada, participated in a pilot outreach workshop at Carleton University, Ottawa, in March 2014. The workshop provided information to students with disabilities on job opportunities, various employment programs open to students, and accommodation measures in the federal public service. There are plans to expand the initiative to include other universities and community colleges in the fall of 2014.
The following summarizes other activities undertaken by OCHRO, key stakeholders and bargaining agents in progressing toward the achievement of employment equity goals in the federal public service.
Employment Equity Champions and Chairs Committees and Circle
The three Employment Equity Champions and Chairs Committees and Circle (Visible Minorities Champions and Chairs Committee, Persons with Disabilities Champions and Chairs Committee, and Champions and Chairs Circle for Aboriginal Peoples) have successfully transitioned into an expanded role under the new governance model, implemented in the fall of 2011. The majority of departments and agencies have selected management champions and employee network chairs to participate in these committees. Each committee has established its priorities, is taking stock of progress against employment equity objectives, and is developing strategies and activities to address employment equity issues. Working groups have been set up to look at common areas of interest and areas of interdepartmental cooperation, such as career development, retention and advancement, and creating a healthy workplace. The focus is to collect and disseminate employment equity best practices and resources across the public service and within departments and to develop ideas and suggestions for consideration by departments.
Each employment equity deputy minister champion reported on the priorities, progress and emerging issues of their committees at a Public Service Management Advisory Committee meeting on April 26, 2013, and in a letter to the Clerk of the Privy Council. In addition, they met with the Standing Senate Committee on Human Rights on April 29, 2013, to provide an update on the governance model and how their committees are functioning.
OCHRO consulted with the three Employment Equity Champions and Chairs Committees and Circle in May 2013 on the proposed changes to the 2014 Public Service Employee Survey (PSES). OCHRO’s PSES team members gathered the comments and feedback from committee members and adjusted the survey questions where appropriate. The objective of the consultation was to ensure that the 2014 PSES would address major people management themes and issues and that the questions would be clear and relevant to employees.
The employment equity deputy minister champions took advantage of their roles as community champions to promote dialogue around the Blueprint 2020 vision and to provide a summary report following discussions at each Employment Equity Committee and Circle. Promoting dialogue within the committees and circle helped ensure that the horizontal perspectives provided by each community were reflected in the Blueprint 2020 discussions and in the 2014 Destination 2020 report.
The use of GC 2.0 Tools continues to be promoted at Employment Equity Champions and Chairs Committees and Circle meetings as useful mechanisms for consultation, collaboration, and sharing of information and best practices among all three committees.
Joint Employment Equity Committee
The Joint Employment Equity Committee (JEEC), a National Joint Council committee, provides a forum for OCHRO, the PSC, departments and bargaining agents to consult and collaborate on the development, implementation and review of public service–wide policies and practices that affect employment equity designated groups.
During 2013–14, the JEEC received updates and presentations, and participated in consultations on the following topics:
- The effect of the Canadian Human Rights Commission’s Human Rights Maturity Model and its impact on employment equity;
- Disability management (with a focus on the Treasury Board Directive on Leave and Special Working Arrangements);
- Priority population statistics, provided by the PSC;
- Survey questions to be included in the 2014 PSES; and
- The Report of the Standing Senate Committee on Human Rights, Employment Equity in the Federal Public Service: Staying Vigilant for Equality.
In addition, the JEEC agreed to continue to receive the following updates on an ongoing basis:
- From Employment and Social Development Canada: the Temporary Foreign Worker Program, the survey previously known as the Participation and Activity Limitation Survey, the recognition of foreign credentials of visible minorities, and the review of the Employment Equity Act;
- From OCHRO: the impact of the Deficit Reduction Action Plan on employment equity groups, the status of relevant Treasury Board policies (Policy on the Duty to Accommodate Persons with Disabilities in the Federal Public Service, Employment Equity Policy and Telework Policy), parking for persons with disabilities, and the impact of the Disability Management Initiative on employment equity groups; and
- From the PSC: accommodation during the assessment process.
Conclusion
The public service continues to make progress in achieving employment equity goals. The Treasury Board of Canada Secretariat, through OCHRO, will continue to collaborate with key stakeholders and provide support and guidance to departments on matters related to employment equity.
Appendix A: Statistical Tables
| Department or Agency | All Employees | Women | Aboriginal Peoples | Persons with Disabilities | Members of a Visible Minority Group | ||||
|---|---|---|---|---|---|---|---|---|---|
| Number | Number | % | Number | % | Number | % | Number | % | |
Notes The sum of designated groups does not equal the total (All Employees) because employees may have voluntarily chosen to self-identify in more than one designated group and men are included in the total. Table 1 Notes
|
|||||||||
| National Defence See note 1 table 1 § | 22,112 | 8,628 | 39.0 | 686 | 3.1 | 1,350 | 6.1 | 1,592 | 7.2 |
| Employment and Social Development Canada | 19,802 | 13,825 | 69.8 | 916 | 4.6 | 1,303 | 6.6 | 3,378 | 17.1 |
| Correctional Service Canada | 17,834 | 8,515 | 47.8 | 1,757 | 9.9 | 1,012 | 5.7 | 1,666 | 9.3 |
| Canada Border Services Agency | 13,391 | 6,619 | 49.4 | 486 | 3.6 | 644 | 4.8 | 1,980 | 14.8 |
| Public Works and Government Services Canada | 11,352 | 6,610 | 58.2 | 364 | 3.2 | 671 | 5.9 | 1,401 | 12.3 |
| Fisheries and Oceans Canada See note 2 table 1 † | 9,097 | 3,249 | 35.7 | 422 | 4.6 | 527 | 5.8 | 515 | 5.7 |
| Health Canada | 8,761 | 5,777 | 65.9 | 714 | 8.2 | 546 | 6.2 | 1,766 | 20.2 |
| Environment Canada | 5,852 | 2,761 | 47.2 | 173 | 3.0 | 264 | 4.5 | 808 | 13.8 |
| Royal Canadian Mounted Police (Civilian Staff) | 5,830 | 4,571 | 78.4 | 358 | 6.1 | 290 | 5.0 | 718 | 12.3 |
| Foreign Affairs, Trade and Development Canada | 5,607 | 3,077 | 54.9 | 143 | 2.6 | 203 | 3.6 | 784 | 14.0 |
| Shared Services Canada | 5,158 | 1,637 | 31.7 | 178 | 3.5 | 343 | 6.7 | 725 | 14.1 |
| Citizenship and Immigration Canada | 4,918 | 3,251 | 66.1 | 166 | 3.4 | 259 | 5.3 | 1,150 | 23.4 |
| Agriculture and Agri-Food Canada See note 3 table 1 ‡ | 4,572 | 2,215 | 48.5 | 145 | 3.2 | 207 | 4.5 | 547 | 12.0 |
| Industry Canada | 4,541 | 2,265 | 49.9 | 135 | 3.0 | 223 | 4.9 | 738 | 16.3 |
| Transport Canada | 4,500 | 2,019 | 44.9 | 161 | 3.6 | 230 | 5.1 | 629 | 14.0 |
| Statistics Canada | 4,433 | 2,255 | 50.9 | 101 | 2.3 | 274 | 6.2 | 880 | 19.9 |
| Department of Justice Canada | 4,410 | 3,000 | 68.0 | 156 | 3.5 | 288 | 6.5 | 751 | 17.0 |
| Aboriginal Affairs and Northern Development Canada | 4,405 | 2,823 | 64.1 | 1,285 | 29.2 | 266 | 6.0 | 503 | 11.4 |
| Natural Resources Canada | 3,782 | 1,676 | 44.3 | 104 | 2.8 | 190 | 5.0 | 478 | 12.6 |
| Veterans Affairs Canada | 2,939 | 2,148 | 73.1 | 89 | 3.0 | 221 | 7.5 | 335 | 11.4 |
| Public Health Agency of Canada | 1,943 | 1,320 | 67.9 | 65 | 3.4 | 122 | 6.3 | 367 | 18.9 |
| Treasury Board of Canada Secretariat | 1,648 | 1,027 | 62.3 | 45 | 2.7 | 113 | 6.9 | 262 | 15.9 |
| Canadian Heritage | 1,640 | 1,100 | 67.1 | 61 | 3.7 | 81 | 4.9 | 181 | 11.0 |
| Public Safety Canada | 962 | 585 | 60.8 | 50 | 5.2 | 60 | 6.2 | 111 | 11.5 |
| Public Prosecution Service of Canada | 952 | 642 | 67.4 | 53 | 5.6 | 59 | 6.2 | 121 | 12.7 |
| Library and Archives Canada | 889 | 538 | 60.5 | 62 | 7.0 | 57 | 6.4 | 89 | 10.0 |
| Immigration and Refugee Board of Canada | 798 | 517 | 64.8 | 30 | 3.8 | 57 | 7.1 | 254 | 31.8 |
| Department of Finance Canada | 719 | 348 | 48.4 | 16 | 2.2 | 22 | 3.1 | 107 | 14.9 |
| Public Service Commission of Canada | 713 | 462 | 64.8 | 31 | 4.4 | 59 | 8.3 | 107 | 15.0 |
| Privy Council Office | 665 | 370 | 55.6 | 28 | 4.2 | 37 | 5.6 | 85 | 12.8 |
| Canadian Space Agency | 587 | 245 | 41.7 | See note 4 table 1 * | See note 4 table 1 * | 19 | 3.2 | 80 | 13.6 |
| Canada School of Public Service | 565 | 375 | 66.4 | 24 | 4.3 | 33 | 5.8 | 82 | 14.5 |
| Atlantic Canada Opportunities Agency | 555 | 364 | 65.6 | 16 | 2.9 | 31 | 5.6 | 23 | 4.1 |
| Courts Administration Service | 550 | 361 | 65.6 | 19 | 3.5 | 32 | 5.8 | 80 | 14.6 |
| Office of the Chief Electoral Officer | 434 | 208 | 47.9 | 19 | 4.4 | 34 | 7.8 | 68 | 15.7 |
| Canadian Radio-television and Telecommunications Commission | 402 | 229 | 57.0 | 14 | 3.5 | 22 | 5.5 | 53 | 13.2 |
| Canadian Grain Commission | 393 | 161 | 41.0 | 22 | 5.6 | 27 | 6.9 | 68 | 17.3 |
| Parole Board of Canada | 393 | 312 | 79.4 | 24 | 6.1 | 22 | 5.6 | 39 | 9.9 |
| Canada Economic Development for Quebec Regions | 288 | 168 | 58.3 | 5 | 1.7 | 6 | 2.1 | 38 | 13.2 |
| Western Economic Diversification Canada | 286 | 179 | 62.6 | 18 | 6.3 | 19 | 6.6 | 59 | 20.6 |
| Infrastructure Canada | 271 | 167 | 61.6 | 8 | 3.0 | 12 | 4.4 | 41 | 15.1 |
| Offices of the Information and Privacy Commissioners of Canada | 241 | 145 | 60.2 | 12 | 5.0 | 9 | 3.7 | 24 | 10.0 |
| Canadian Transportation Agency | 206 | 119 | 57.8 | 5 | 2.4 | 12 | 5.8 | 26 | 12.6 |
| Federal Economic Development Agency for Southern Ontario | 201 | 126 | 62.7 | 7 | 3.5 | 15 | 7.5 | 50 | 24.9 |
| Canadian Environmental Assessment Agency | 199 | 138 | 69.4 | 11 | 5.5 | 8 | 4.0 | 20 | 10.1 |
| Office of the Registrar of the Supreme Court of Canada | 196 | 116 | 59.2 | 7 | 3.6 | 14 | 7.1 | 10 | 5.1 |
| Transportation Safety Board of Canada | 192 | 61 | 31.8 | See note 4 table 1 * | See note 4 table 1 * | 7 | 3.7 | 16 | 8.3 |
| Canadian Human Rights Commission | 182 | 119 | 65.4 | 13 | 7.1 | 28 | 15.4 | 26 | 14.3 |
| Office of the Commissioner of Official Languages | 157 | 107 | 68.2 | 5 | 3.2 | 11 | 7.0 | 16 | 10.2 |
| Office of the Secretary to the Governor General | 141 | 82 | 58.2 | See note 4 table 1 * | See note 4 table 1 * | 11 | 7.8 | 19 | 13.5 |
| Status of Women Canada | 83 | 73 | 88.0 | See note 4 table 1 * | See note 4 table 1 * | 7 | 8.4 | 9 | 10.8 |
| Canada Industrial Relations Board | 76 | 58 | 76.3 | See note 4 table 1 * | See note 4 table 1 * | 6 | 7.9 | See note 4 table 1 * | See note 4 table 1 * |
| Canadian International Trade Tribunal | 61 | 39 | 63.9 | See note 4 table 1 * | See note 4 table 1 * | See note 4 table 1 * | See note 4 table 1 * | See note 4 table 1 * | See note 4 table 1 * |
| Commission for Public Complaints Against the Royal Canadian Mounted Police | 56 | 39 | 69.6 | See note 4 table 1 * | See note 4 table 1 * | See note 4 table 1 * | See note 4 table 1 * | 8 | 14.3 |
| Office of the Commissioner for Federal Judicial Affairs Canada | 54 | 36 | 66.7 | See note 4 table 1 * | See note 4 table 1 * | 5 | 9.3 | See note 4 table 1 * | See note 4 table 1 * |
| Patented Medicine Prices Review Board Canada | 51 | 33 | 64.7 | See note 4 table 1 * | See note 4 table 1 * | See note 4 table 1 * | See note 4 table 1 * | 8 | 15.7 |
| Canadian Dairy Commission | 48 | 33 | 68.8 | See note 4 table 1 * | See note 4 table 1 * | See note 4 table 1 * | See note 4 table 1 * | 6 | 12.5 |
| Military Grievances External Review Committee | 35 | 26 | 74.3 | See note 4 table 1 * | See note 4 table 1 * | See note 4 table 1 * | See note 4 table 1 * | See note 4 table 1 * | See note 4 table 1 * |
| Office of the Public Sector Integrity Commissioner of Canada | 27 | 20 | 74.1 | See note 4 table 1 * | See note 4 table 1 * | See note 4 table 1 * | See note 4 table 1 * | See note 4 table 1 * | See note 4 table 1 * |
| Public Service Staffing Tribunal | 26 | 17 | 65.4 | See note 4 table 1 * | See note 4 table 1 * | See note 4 table 1 * | See note 4 table 1 * | See note 4 table 1 * | See note 4 table 1 * |
| International Joint Commission | 25 | 10 | 40.0 | See note 4 table 1 * | See note 4 table 1 * | See note 4 table 1 * | See note 4 table 1 * | See note 4 table 1 * | See note 4 table 1 * |
| Office of the Commissioner of Lobbying of Canada | 25 | 11 | 44.0 | See note 4 table 1 * | See note 4 table 1 * | See note 4 table 1 * | See note 4 table 1 * | See note 4 table 1 * | See note 4 table 1 * |
| Canadian Intergovernmental Conference Secretariat | 21 | 10 | 47.6 | See note 4 table 1 * | See note 4 table 1 * | See note 4 table 1 * | See note 4 table 1 * | See note 4 table 1 * | See note 4 table 1 * |
| Human Rights Tribunal of Canada | 17 | 11 | 64.7 | See note 4 table 1 * | See note 4 table 1 * | See note 4 table 1 * | See note 4 table 1 * | See note 4 table 1 * | See note 4 table 1 * |
| Farm Products Council of Canada | 16 | 9 | 56.3 | See note 4 table 1 * | See note 4 table 1 * | See note 4 table 1 * | See note 4 table 1 * | See note 4 table 1 * | See note 4 table 1 * |
| Indian Residential Schools Truth and Reconciliation Commission | 13 | 7 | 53.9 | See note 4 table 1 * | See note 4 table 1 * | See note 4 table 1 * | See note 4 table 1 * | See note 4 table 1 * | See note 4 table 1 * |
| Military Police Complaints Commission of Canada | 12 | 9 | 75.0 | See note 4 table 1 * | See note 4 table 1 * | See note 4 table 1 * | See note 4 table 1 * | See note 4 table 1 * | See note 4 table 1 * |
| Copyright Board Canada | 12 | 5 | 41.7 | See note 4 table 1 * | See note 4 table 1 * | See note 4 table 1 * | See note 4 table 1 * | See note 4 table 1 * | See note 4 table 1 * |
| Registry of the Specific Claims Tribunal of Canada | 9 | 4 | 44.4 | See note 4 table 1 * | See note 4 table 1 * | See note 4 table 1 * | See note 4 table 1 * | See note 4 table 1 * | See note 4 table 1 * |
| Transportation Appeal Tribunal of Canada | 8 | 6 | 75.0 | See note 4 table 1 * | See note 4 table 1 * | See note 4 table 1 * | See note 4 table 1 * | See note 4 table 1 * | See note 4 table 1 * |
| Public Servants Disclosure Protection Tribunal Canada | 7 | 6 | 85.7 | See note 4 table 1 * | See note 4 table 1 * | See note 4 table 1 * | See note 4 table 1 * | See note 4 table 1 * | See note 4 table 1 * |
| Registry of the Competition Tribunal | 6 | 3 | 50.0 | See note 4 table 1 * | See note 4 table 1 * | See note 4 table 1 * | See note 4 table 1 * | See note 4 table 1 * | See note 4 table 1 * |
| RCMP External Review Committee | 4 | 1 | 25.0 | See note 4 table 1 * | See note 4 table 1 * | See note 4 table 1 * | See note 4 table 1 * | See note 4 table 1 * | See note 4 table 1 * |
| Total | 181,356 | 98,078 | 54.1 | 9,239 | 5.1 | 10,390 | 5.7 | 23,919 | 13.2 |
| Region of Work | All Employees | Women | Aboriginal Peoples | Persons with Disabilities | Members of a Visible Minority Group | ||||
|---|---|---|---|---|---|---|---|---|---|
| Number | Number | % | Number | % | Number | % | Number | % | |
Note The sum of designated groups does not equal the total (All Employees) because employees may have voluntarily chosen to self-identify in more than one designated group and men are included in the total. Table 2 Notes
|
|||||||||
| Newfoundland and Labrador | 2,784 | 1,177 | 42.3 | 173 | 6.2 | 153 | 5.5 | 52 | 1.9 |
| Prince Edward Island | 1,554 | 980 | 63.1 | 44 | 2.8 | 112 | 7.2 | 39 | 2.5 |
| Nova Scotia | 8,349 | 3,567 | 42.7 | 412 | 4.9 | 593 | 7.1 | 490 | 5.9 |
| New Brunswick | 6,387 | 3,572 | 55.9 | 233 | 3.6 | 334 | 5.2 | 154 | 2.4 |
| Quebec (without the NCR) See note 1 table 2 † | 20,427 | 10,669 | 52.2 | 420 | 2.1 | 672 | 3.3 | 1,999 | 9.8 |
| NCR (Quebec) See note 1 table 2 † | 24,333 | 13,927 | 57.2 | 1,276 | 5.2 | 1,310 | 5.4 | 3,162 | 13.0 |
| NCR See note 2 table 2 ‡ | 80,358 | 45,146 | 56.2 | 3,094 | 3.9 | 4,619 | 5.7 | 11,660 | 14.5 |
| Ontario (without the NCR) See note 1 table 2 † | 23,340 | 12,795 | 54.8 | 1,213 | 5.2 | 1,604 | 6.9 | 4,074 | 17.5 |
| NCR (Ontario) See note 1 table 2 † | 56,025 | 31,219 | 55.7 | 1,818 | 3.2 | 3,309 | 5.9 | 8,498 | 15.2 |
| Manitoba | 6,442 | 3,629 | 56.3 | 942 | 14.6 | 423 | 6.6 | 596 | 9.3 |
| Saskatchewan | 4,464 | 2,564 | 57.4 | 747 | 16.7 | 261 | 5.8 | 279 | 6.3 |
| Alberta | 9,083 | 5,091 | 56.0 | 789 | 8.7 | 628 | 6.9 | 1,085 | 11.9 |
| British Columbia | 15,774 | 7,663 | 48.6 | 943 | 6.0 | 882 | 5.6 | 3,224 | 20.4 |
| Yukon | 290 | 183 | 63.1 | 48 | 16.6 | 25 | 8.6 | 19 | 6.6 |
| Northwest Territories | 384 | 232 | 60.4 | 80 | 20.8 | 23 | 6.0 | 25 | 6.5 |
| Nunavut | 231 | 128 | 55.4 | 79 | 34.2 | 11 | 4.8 | 19 | 8.2 |
| Outside Canada | 1,489 | 682 | 45.8 | 22 | 1.5 | 50 | 3.4 | 204 | 13.7 |
| Total | 181,356 | 98,078 | 54.1 | 9,239 | 5.1 | 10,390 | 5.7 | 23,919 | 13.2 |
| Occupational Group | All Employees | Women | Aboriginal Peoples | Persons with Disabilities | Members of a Visible Minority Group | ||||
|---|---|---|---|---|---|---|---|---|---|
| Number | Number | % | Number | % | Number | % | Number | % | |
Notes The sum of designated groups does not equal the total (All Employees) because employees may have voluntarily chosen to self-identify in more than one designated group and men are included in the total. Table 3 Notes
|
|||||||||
| Executives | 5,252 | 2,423 | 46.1 | 192 | 3.7 | 282 | 5.4 | 447 | 8.5 |
|
EX (Executive)
|
4,955 | 2,256 | 45.5 | 185 | 3.7 | 262 | 5.3 | 429 | 8.7 |
|
LC (Law Management)
See note 2 table 3 ‡
|
297 | 167 | 56.2 | 7 | 2.4 | 20 | 6.7 | 18 | 6.1 |
| Scientific and Professional | 31,854 | 16,357 | 51.3 | 999 | 3.1 | 1,427 | 4.5 | 5,491 | 17.2 |
| Administrative and Foreign Service | 82,710 | 52,009 | 62.9 | 4,434 | 5.4 | 5,176 | 6.3 | 11,638 | 14.1 |
| Technical | 12,593 | 3,140 | 24.9 | 531 | 4.2 | 604 | 4.8 | 974 | 7.7 |
| Administrative Support | 19,891 | 15,647 | 78.7 | 1,300 | 6.5 | 1,528 | 7.7 | 2,882 | 14.5 |
| Operational | 28,971 | 8,453 | 29.2 | 1,779 | 6.1 | 1,364 | 4.7 | 2,477 | 8.5 |
| Undetermined | 85 | 49 | 57.6 | 4 | 4.7 | 9 | 10.6 | 10 | 11.8 |
| Total | 181,356 | 98,078 | 54.1 | 9,239 | 5.1 | 10,390 | 5.7 | 23,919 | 13.2 |
| Salary Range ($) |
All Employees | Women | Aboriginal Peoples | Persons with Disabilities | Members of a Visible Minority Group | |||||||||
|---|---|---|---|---|---|---|---|---|---|---|---|---|---|---|
| Number | % of All Employees | Number | % of Salary Range | % of EESee note 1 table 4 ‡ Group | Number | % of Salary Range | % of EESee note 1 table 4 ‡ Group | Number | % of Salary Range | % of EESee note 1 table 4 ‡ Group | Number | % of Salary Range | % of EESee note 1 table 4 ‡ Group | |
Notes The sum of designated groups does not equal the total (All Employees) because employees may have voluntarily chosen to self-identify in more than one designated group and men are included in the total. Table 4 Notes
|
||||||||||||||
| Under 5,000 | 41 | 2.3 | 15 | 36.6 | 0.0 | See note 2 table 4 * | See note 2 table 4 * | See note 2 table 4 * | See note 2 table 4 * | See note 2 table 4 * | See note 2 table 4 * | See note 2 table 4 * | See note 2 table 4 * | See note 2 table 4 * |
| 5,000 to 9,999 | 141 | 0.1 | 35 | 24.8 | 0.0 | See note 2 table 4 * | See note 2 table 4 * | See note 2 table 4 * | 7 | 5.0 | 0.1 | 8 | 5.7 | 0.0 |
| 10,000 to 14,999 | 67 | 0.0 | 35 | 52.2 | 0.0 | See note 2 table 4 * | See note 2 table 4 * | See note 2 table 4 * | See note 2 table 4 * | See note 2 table 4 * | See note 2 table 4 * | See note 2 table 4 * | See note 2 table 4 * | See note 2 table 4 * |
| 15,000 to 19,999 | 149 | 0.1 | 103 | 69.1 | 0.1 | 5 | 3.4 | 0.1 | 8 | 5.4 | 0.1 | 14 | 9.4 | 0.1 |
| 20,000 to 24,999 | 260 | 0.1 | 191 | 73.5 | 0.2 | 17 | 6.5 | 0.2 | 15 | 5.8 | 0.1 | 28 | 10.8 | 0.1 |
| 25,000 to 29,999 | 393 | 0.2 | 319 | 81.2 | 0.3 | 26 | 6.6 | 0.3 | 22 | 5.6 | 0.2 | 52 | 13.2 | 0.2 |
| 30,000 to 34,999 | 382 | 0.2 | 332 | 86.9 | 0.3 | 15 | 3.9 | 0.2 | 18 | 4.7 | 0.2 | 59 | 15.4 | 0.2 |
| 35,000 to 39,999 | 1,567 | 0.9 | 1,194 | 76.2 | 1.2 | 85 | 5.4 | 0.9 | 97 | 6.2 | 0.9 | 150 | 9.6 | 0.6 |
| 40,000 to 44,999 | 4,017 | 2.2 | 2,817 | 70.1 | 2.9 | 236 | 5.9 | 2.6 | 341 | 8.5 | 3.3 | 563 | 14.0 | 2.4 |
| 45,000 to 49,999 | 14,809 | 8.2 | 10,383 | 70.1 | 10.6 | 990 | 6.7 | 10.7 | 1,106 | 7.5 | 10.6 | 1,941 | 13.1 | 8.1 |
| 50,000 to 54,999 | 19,791 | 10.9 | 13,691 | 69.2 | 14.0 | 1,168 | 5.9 | 12.6 | 1,195 | 6.0 | 11.5 | 2,827 | 14.3 | 11.8 |
| 55,000 to 59,999 | 16,869 | 9.3 | 10,939 | 64.8 | 11.2 | 896 | 5.3 | 9.7 | 1,006 | 6.0 | 9.7 | 2,212 | 13.1 | 9.2 |
| 60,000 to 64,999 | 14,840 | 8.2 | 8,484 | 57.2 | 8.7 | 811 | 5.5 | 8.8 | 824 | 5.6 | 7.9 | 1,753 | 11.8 | 7.3 |
| 65,000 to 69,999 | 18,827 | 10.4 | 9,275 | 49.3 | 9.5 | 982 | 5.2 | 10.6 | 1,026 | 5.4 | 9.9 | 2,336 | 12.4 | 9.8 |
| 70,000 to 74,999 | 14,716 | 8.1 | 5,711 | 38.8 | 5.8 | 1,054 | 7.2 | 11.4 | 693 | 4.7 | 6.7 | 1,876 | 12.7 | 7.8 |
| 75,000 to 79,999 | 9,265 | 5.1 | 4,689 | 50.6 | 4.8 | 407 | 4.4 | 4.4 | 426 | 4.6 | 4.1 | 1,328 | 14.3 | 5.6 |
| 80,000 to 84,999 | 16,917 | 9.3 | 8,098 | 47.9 | 8.3 | 933 | 5.5 | 10.1 | 1,068 | 6.3 | 10.3 | 2,109 | 12.5 | 8.8 |
| 85,000 to 89,999 | 7,448 | 4.1 | 3,929 | 52.8 | 4.0 | 313 | 4.2 | 3.4 | 387 | 5.2 | 3.7 | 1,234 | 16.6 | 5.2 |
| 90,000 to 94,999 | 7,499 | 4.1 | 3,583 | 47.8 | 3.7 | 254 | 3.4 | 2.7 | 360 | 4.8 | 3.5 | 1,036 | 13.8 | 4.3 |
| 95,000 to 99,999 | 8,252 | 4.6 | 3,372 | 40.9 | 3.4 | 238 | 2.9 | 2.6 | 431 | 5.2 | 4.1 | 1,319 | 16.0 | 5.5 |
| 100,000 and over | 25,106 | 13.8 | 10,883 | 43.3 | 11.1 | 806 | 3.2 | 8.7 | 1,354 | 5.4 | 13.0 | 3,069 | 12.2 | 12.8 |
| Total | 181,356 | 100.0 | 98,078 | 54.1 | 100.0 | 9,239 | 5.1 | 100.0 | 10,390 | 5.7 | 100.0 | 23,919 | 13.2 | 100.0 |
| Action Type | All Employees | Women | Aboriginal Peoples | Persons with Disabilities | Members of a Visible Minority Group | ||||
|---|---|---|---|---|---|---|---|---|---|
| Number | Number | % | Number | % | Number | % | Number | % | |
Notes The sum of designated groups does not equal the total (All Employees) because employees may have voluntarily chosen to self-identify in more than one designated group and men are included in the total. "Hirings" refers to employees who were added to the Public Service of Canada payroll between April 1, 2013, and March 31, 2014. Data on "promotions" are obtained from the Public Service Commission of Canada and include information from departments and agencies that fall under both the Financial Administration Act, Schedules I and IV, and the Public Service Employment Act. "Separations" refers to employees who left the Public Service of Canada payroll between April 1, 2013, and March 31, 2014. The percentages represent that designated group's share of all actions of the given type. See the definitions of "hirings," "promotions" and "separations" in Appendix B. |
|||||||||
| Hirings | 7,146 | 3,948 | 55.2 | 327 | 4.6 | 238 | 3.3 | 1,140 | 16.0 |
| Promotions | 9,106 | 4,948 | 54.3 | 390 | 4.3 | 389 | 4.3 | 1,261 | 13.8 |
| Separations | 15,184 | 8,502 | 56.0 | 813 | 5.4 | 1,348 | 8.9 | 1,501 | 9.9 |
| Age Range | All Employees | Women | Aboriginal Peoples | Persons with Disabilities | Members of a Visible Minority Group | |||||||||
|---|---|---|---|---|---|---|---|---|---|---|---|---|---|---|
| Number | % of All Employees | Number | % of Age Range | % of EESee note 1 table 6 ‡ Group | Number | % of Age Range | % of EESee note 1 table 6 ‡ Group | Number | % of Age Range | % of EESee note 1 table 6 ‡ Group | Number | % of Age Range | % of EESee note 1 table 6 ‡ Group | |
| Note The sum of designated groups does not equal the total (All Employees) because employees may have voluntarily chosen to self-identify in more than one designated group and men are included in the total. Table 6 Notes
|
||||||||||||||
| Under 35 | 33,830 | 18.7 | 18,755 | 55.4 | 19.1 | 1,515 | 4.5 | 16.4 | 871 | 2.6 | 8.4 | 5,599 | 16.6 | 23.4 |
| 35 to 39 | 26,338 | 14.5 | 14,740 | 56.0 | 15.0 | 1,359 | 5.2 | 14.7 | 1,009 | 3.8 | 9.7 | 4,221 | 16.0 | 17.6 |
| 40 to 44 | 27,032 | 14.9 | 15,030 | 55.6 | 15.3 | 1,638 | 6.1 | 17.7 | 1,317 | 4.9 | 12.7 | 3,957 | 14.6 | 16.5 |
| 45 to 49 | 28,931 | 16.0 | 15,971 | 55.2 | 16.3 | 1,742 | 6.0 | 18.9 | 1,758 | 6.1 | 16.9 | 3,695 | 12.8 | 15.4 |
| 50 to 54 | 32,710 | 18.0 | 17,723 | 54.2 | 18.1 | 1,556 | 4.8 | 16.8 | 2,476 | 7.6 | 23.8 | 3,065 | 9.4 | 12.8 |
| 55 and over | 32,515 | 17.9 | 15,859 | 48.8 | 16.2 | 1,429 | 4.4 | 15.5 | 2,959 | 9.1 | 28.5 | 3,382 | 10.4 | 14.1 |
| Total | 181,356 | 100.0 | 98,078 | 54.1 | 100.0 | 9,239 | 5.1 | 100.0 | 10,390 | 5.7 | 100.0 | 23,919 | 13.2 | 100.0 |
Appendix B: Technical Notes
Core public administration
The Employment Equity Act prescribes that this report cover the portions of the public service of Canada set out in Schedules I and IV of the Financial Administration Act. Seventy-three departments, agencies and commissions comprise the core public administration (CPA), for which the Treasury Board is the employer (see Table 1). The statistics in this report include only employees working for these organizations, which numbered 181,356 on March 31, 2014.
This report includes information on indeterminate employees, term employees of three months or more, and seasonal employees, with the exception of those seasonal employees who are on leave without pay at the end of March for each fiscal year. No information is reported on students or casual workers, except in cases where they were subsequently hired as indeterminate employees, for terms of three months or more, or as seasonal employees before the end of the fiscal year. Employees on leave without pay, such as those on care and nurturing leave and educational leave, are not included in these tables.
Statistics in this document also exclude Governor in Council appointees, ministerial staff, federal judges and deputy ministers, who are also on the public service payroll. As required under the Employment Equity Act, annual reports to Parliament present information for the fiscal year beginning April 1 and ending March 31.
The statistics of separate employers, covered under Schedule V of the Financial Administration Act, are not included in this report. Under the Employment Equity Act, separate employers that have more than 100 employees (e.g., the Canada Revenue Agency and the Canadian Food Inspection Agency) are required to provide their reports to the Office of the Chief Human Resources Officer (OCHRO) of the Treasury Board of Canada Secretariat only for the purposes of tabling in Parliament at the same time as this report. To view their employment equity reports, readers should visit those organizations’ websites, or contact them directly.
Reports on employment equity in the Canadian Forces and with respect to members of the Royal Canadian Mounted Police are prepared by those organizations and are also tabled in Parliament at the same time as those of separate employers.
Data on persons in designated groups
To assure the consistency of data presented in this report, OCHRO uses the incumbent file, which contains information on all employees for whom the Treasury Board is the employer, in accordance with Schedules I and IV of the Financial Administration Act. Since 2011–12, the executive category includes data on the LC Group (Law Management Occupational Group) in its total workforce, which will need to be taken into consideration when comparing data historically.
All tabulations, other than those for women, contain data obtained through self-identification. This data is provided voluntarily by employees and maintained separately and confidentially in the Employment Equity Data Bank by OCHRO, and where applicable, through the self-declaration of individuals applying to the public service through the Public Service Commission of Canada’s (PSC’s) Public Service Resourcing System. A reconciliation process is carried out each year by OCHRO, the PSC and the departments of the CPA to ensure that information derived from the Public Service Resourcing System, the Employment Equity Data Bank, and incumbent file harmonizes with the information from departmental sources.
The completeness and accuracy of employment equity data for the CPA depend on the willingness of employees to self-identify and on departments providing opportunities for them to do so. Employees, including those engaged as students or casual workers, are given an opportunity to provide this information when they are hired and during departmental self-identification surveys or other campaigns. Furthermore, they may complete a self-identification form, available from their departmental employment equity coordinator, at any time.
Definitions
- Aboriginal peoples:
- Persons who are Indians, Inuit or Métis.
- Casual workers:
- People hired for a specified period of no more than 90 days by any one department or agency during the calendar year. Casual workers are not included in the representation figures.
- Designated groups:
- Women, Aboriginal peoples, persons with disabilities, and members of a visible minority group.
- Hirings:
- The number of persons added to the employee population in the past fiscal year. This includes indeterminate and seasonal employees, with the exception of those seasonal employees who are on leave without pay at the end of March; those with terms of three months or more; and students and casual workers whose employment status has changed to indeterminate, terms of three months or more, or seasonal. Hirings measure the flow of employees into the public service and may include more than one staffing action for term employees.
- Indeterminate employees:
- People appointed to the public service for an unspecified duration.
- Members of a visible minority group:
- Persons, other than Aboriginal peoples, who are non-Caucasian in race or non-white in colour.
- Persons with disabilities:
-
Persons who have a long-term or recurring physical, mental, sensory, psychiatric or learning impairment and who:
- Consider themselves to be disadvantaged in employment by reason of that impairment; or
- Believe that an employer or potential employer is likely to consider them to be disadvantaged in employment by reason of that impairment.
Included are persons whose functional limitations owing to their impairment have been accommodated in their current job or workplace.
- Promotions:
- The number of appointments to positions at higher maximum pay levels, either within the same occupational group or subgroup or in another group or subgroup.
- Seasonal employees:
- People hired to work cyclically for a season or portion of each year.
- Self-declaration:
- Voluntary information provided by applicants in appointment processes for statistical purposes related to appointments and, in the case of processes targeting employment equity groups, to determine eligibility.
- Self-identification:
-
A collection of employment equity information, voluntarily provided by employees, for statistical purposes in analyzing and monitoring the progress of employment equity groups in the federal public service and for reporting workforce representation.
In 2012–13, OCHRO and the PSC worked together to address the long-standing issue of using different methodologies (self-identification and self-declaration) in the public service to report employment equity information to Parliament and Canadians. A common methodology was developed to address this issue, which has improved the quality and completeness of employment equity information as well as the efficiencies by which departments and agencies will obtain and report on employment equity data. This should be considered when comparing data historically.
- Separations:
- The number of employees (i.e., indeterminate, terms of three months or more, and seasonal) removed from the public service payroll, which may include more than one action for term employees. Separations include employees who retired or resigned, or employees whose specified employment period (term) ended.
- Tenure:
- The period of time for which a person is employed.
- Women:
- An employment equity designated group under the Employment Equity Act.
- Workforce availability:
- The distribution of people in the designated groups as a percentage of the total Canadian workforce. For federal public service purposes, workforce availability is based on Canadian citizens in those occupations in the Canadian workforce corresponding to the occupations in the public service and is derived from 2006 Census data. Estimates for persons with disabilities are derived from data, also collected by Statistics Canada, in the 2006 Participation and Activity Limitation Survey. Based on the 2006 data, workforce availability for women is 52.3 per cent, Aboriginal peoples is 3.0 per cent, persons with disabilities is 4.0 per cent, and members of a visible minority group is 12.4 per cent.
Note: Although 2011 Census data have been published for the private sector, 2011 workforce availability for the CPA is not yet available. The 2011 Census data will be reflected in next year’s annual report.
Page details
- Date modified: