
Opioid pain relief medication use and mood disorders in Canada: a descriptive analysis of Canadian Community Health Survey data
Canada is experiencing a drug overdose crisis. Over 26,000 Canadians died from apparent opioid toxicity from January 2016 to September 2021.Footnote 1 Opioid medications, such as codeine and oxycodone, are commonly prescribed and used for treating and managing physical pain.Footnote 2 International research has found that mood disorders are more common among people who use opioid pain relief medications, as well as among those who use these medications for reasons other than pain relief.Footnote 3Footnote 4Footnote 5Footnote 6Footnote 7 The relationship between opioid pain relief medication use and mood disorders has not been explored in a nationally representative population in Canada. The objective of this analysis is to describe the relationship between opioid pain relief medication use and reports of a mood disorder diagnosis in Canadian adults aged 18 or more. The findings presented here use data from adult respondents in the Canadian Community Health Survey (CCHS) 2018 from all Canadian provinces.
Definitions included in this report
Opioid pain relief medication use: In this analysis, respondents who reported the use of opioid pain relief medication in the 12 months preceding the survey were considered to have used opioid medication. The CCHS defines opioid pain relief medication as products that contain opioids such as codeine or morphine, or related drugs. While most of these products require a prescription, some codeine products are available without a prescription, for example, Tylenol #1 or 222s.
Opioid pain relief medication use not as directed or for reasons other than pain relief: This included reporting one or more of: taking opioid medication in greater amounts than prescribed or more often than directed; intentional use for the experience, the feeling they caused or to get high; use for reasons other than pain relief, for example, to feel better (improve mood) or to cope with stress or problems; and/or tampering with a product before taking it, for example, crushing tablets to swallow, snort or inject, but not counting for ease of swallowing or to take a lower dose.
Mood disorder: Mood disorders were identified through a single question asking whether respondents had ever been diagnosed by a health professional with a mood disorder such as depression, dysthymia, bipolar disorder, or mania.
Chronic pain conditions (arthritis and/or cancer): This report examined two chronic conditions which may be associated with chronic pain.Footnote 8Footnote 9 These included self-reported arthritis (e.g. osteoarthritis, rheumatoid arthritis, gout but excluding fibromyalgia) and cancer. As the CCHS 2018 did not ask respondents about other conditions associated with chronic pain (e.g. fibromyalgia, other back problems, migraine headaches), they were not included in this analysis.
Key findings
Opioid pain relief medication use and mood disorders in Canadian adults
Among Canadian adults in 2018, 13.1% had used opioid pain relief medication (hereafter, opioid medication use) in the past 12 months and 9.1% reported being diagnosed with a mood disorder. The most common type of opioid pain relief medication used in the past 12 months was codeine products (76.2%).
Adults with a mood disorder diagnosis had a higher prevalence of opioid medication use in the past 12 months (27.8%) compared to those without a mood disorder diagnosis (11.7%) (Figure 1a). When examining the prevalence of mood disorders, 19.1% of adults with opioid medication use in the past 12 months reported a mood disorder diagnosis, compared to 7.5% of those without opioid medication use (Figure 1b).
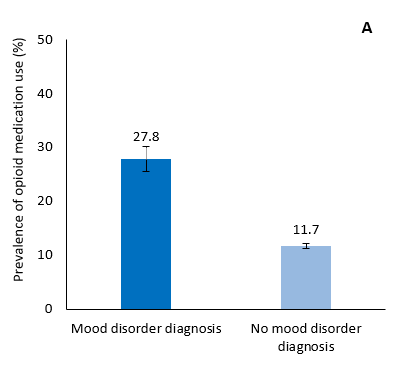
Figure 1a – Text description
Opioid medication use in past 12 months |
95% confidence interval |
|
|---|---|---|
Mood disorder diagnosis |
27.8% |
25.5%, 30.1% |
No mood disorder diagnosis |
11.7% |
11.2%, 12.2% |
Data source: |
||

Figure 1b - Text description
Mood disorder diagnosis |
95% confidence interval |
|
|---|---|---|
Opioid medication use in past 12 months |
19.1% |
17.4%, 20.9% |
No opioid medication use in past 12 months |
7.5% |
7.1%, 8.0% |
Data source: |
||
Pattern of use
Respondents who indicated opioid medication use in the past 12 months were subsequently asked how often they used such medication. Adults with a mood disorder diagnosis reported higher daily/almost daily opioid use in the past 12 months (24.0%), compared to those without a mood disorder diagnosis (13.4%) (Figure 2).
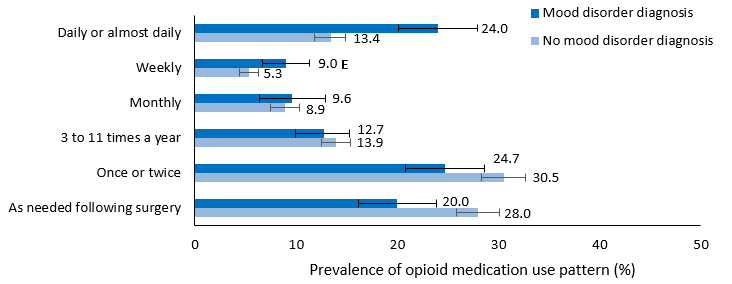
Figure 2 - Text description
Opioid medication use pattern in past 12 months |
||||||||||||
|---|---|---|---|---|---|---|---|---|---|---|---|---|
Daily or almost daily |
95% confidence interval |
Weekly |
95% confidence interval |
Monthly |
95% confidence interval |
Three to eleven times a year |
95% confidence interval |
Once or twice |
95% confidence interval |
As needed following surgery |
95% confidence interval |
|
No mood disorder diagnosis |
13.4% |
11.9%, 15.0% |
5.3% |
4.3%, 6.2% |
8.9% |
7.5%, 10.3% |
13.9% |
12.4%, 15.3% |
30.5% |
28.3%, 32.7% |
28.0% |
25.9%, 30.2% |
Mood disorder diagnosis |
24.0% |
20.1%, 27.9% |
9.0% E |
6.7%, 11.3% |
9.6% |
6.3%, 12.8% |
12.8% |
10.1%, 15.5% |
24.7% |
20.8%, 28.6% |
20.0% |
16.1%, 23.8% |
Data source: Footnotes E Use with caution, as the proportion of weekly opioid pain relief use for adults with a mood disorder diagnosis had a coefficient of variation between 15.1% and 35.0%. |
||||||||||||
Sex and age
The prevalence of opioid medication use in the past 12 months among adults with and without a mood disorder diagnosis was similar in males and females (Figure 3a). For all ages, opioid medication use was higher among adults who reported a mood disorder diagnosis, however, this difference was more pronounced in the age groups 35 to 49 and 50 to 64 years (Figure 3b).
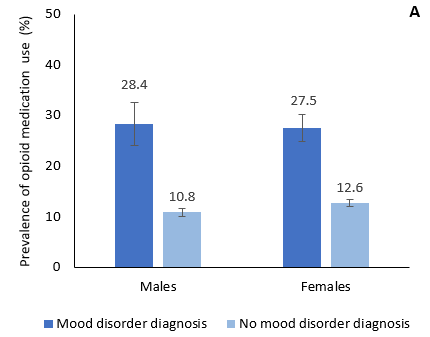
Figure 3a - Text description
Opioid medication use in past 12 months |
||||
|---|---|---|---|---|
Males |
95% confidence interval |
Females |
95% confidence interval |
|
Mood disorder diagnosis |
28.4% |
24.2%, 32.7% |
27.5% |
24.8%, 30.1% |
No mood disorder diagnosis |
10.8% |
10.1%, 11.5% |
12.6% |
11.9%, 13.3% |
Data source: |
||||
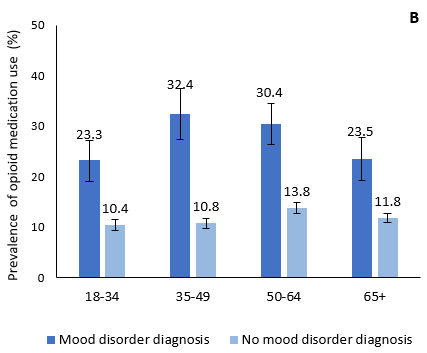
Figure 3b - Text description
Opioid medication use in past 12 months |
||||||||
|---|---|---|---|---|---|---|---|---|
Ages 18-34 |
95% confidence interval |
Ages 35-49 |
95% confidence interval |
Ages 50-64 |
95% confidence interval |
Ages 65+ |
95% confidence interval |
|
Mood disorder diagnosis |
23.3% |
19.1%, 27.1% |
32.4% |
27.3%, 37.5% |
30.4% |
26.3%, 34.4% |
23.5% |
19.3%, 27.8% |
No mood disorder diagnosis |
10.4% |
9.4%, 11.5% |
10.8% |
9.8%, 11.8% |
13.8% |
12.8%, 14.8% |
11.8% |
10.9%, 12.7% |
Data source: |
||||||||
Selected chronic pain conditions
The prevalence of reported opioid medication use was higher among those reporting chronic pain conditions, as compared to this who didn’t report such conditions. Among adults reporting chronic pain conditions, 43.3% of adults with a mood disorder diagnosis reported opioid medication use, compared to 20.9% of those without a mood disorder diagnosis (Figure 4).
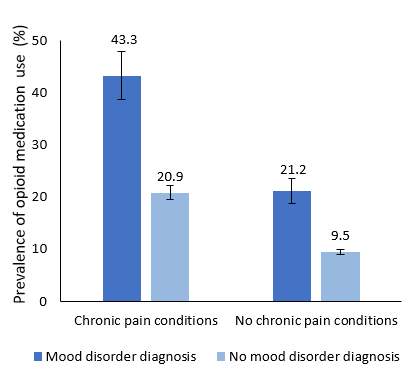
Figure 4 - Text description
Opioid medication use in past 12 months |
||||
|---|---|---|---|---|
Chronic pain conditions |
95% confidence interval |
No chronic pain conditions |
95% confidence interval |
|
Mood disorder diagnosis |
43.3% |
38.8%, 47.9% |
21.2% |
18.8%, 23.6% |
No mood disorder diagnosis |
20.9% |
19.6%, 22.2% |
9.5% |
9.0%, 10.0% |
Data source: Notes |
||||
Opioid medication use not as directed or for reasons other than pain relief
In 2018, 11.2% of respondents who reported opioid medication use in the past 12 months also reported using this medication not as directed or for reasons other than pain relief. This was higher among adults with a mood disorder diagnosis (22.7%, 95% CI: 17.6%, 27.9%) compared to those without a mood disorder diagnosis (8.5%, 95% CI: 7.1%, 9.9%).
In summary
Furthering our understanding of associations between use of opioid pain relief medication and mental health conditions is essential to inform comprehensive clinical and public health actions to address opioid-related harms in Canada. The analysis presented here suggests that opioid pain relief medication use and mood disorders often co-occur among Canadian adults. Additionally, some adults with a mood disorder diagnosis reported higher opioid medication use not as directed or for reasons other than pain relief. Together with stakeholders, the Public Health Agency of Canada will continue to work towards the improvement of data and analysis to inform strategies and interventions to reduce opioid-related harms across the country.
Acknowledgements
We would like to acknowledge Statistics Canada for collecting and providing access to the Canadian Community Health Survey 2018.
Suggested Citation
Opioid pain relief medication use and mood disorders in Canada: a descriptive analysis of Canadian Community Health Survey data. Ottawa: Public Health Agency of Canada; March 2022. https://www.canada.ca/en/health-canada/services/opioids/data-surveillance-research/opioid-pain-relief-medication-use-mood-disorders.html
Technical notes
Methodology
The analyses in this report used data from Statistics Canada’s Canadian Community Health Survey (CCHS), 2018 cycle. The CCHS is an annual cross-sectional survey that collects health-related information from a nationally representative sample. The data used in this report included respondents from all ten Canadian provinces, but did not include information from participants in the Northwest Territories, Nunavut, or Yukon.
The variable for opioid medication use in the past 12 months was a derived variable based on whether respondents indicated they had used pain relievers containing opioids in the past 12 months (including codeine, oxycodone, fentanyl or other opioid products). If respondents indicated they had used such medications in the past 12 months, they were then asked questions about their frequency of use and opioid medication use not as directed or for reasons other than pain relief. All respondents were asked if they had been diagnosed by a health professional with a mood disorder, such as depression, bipolar, mania, or dysthymia.
Survey weights were applied for all analyses. All 95% confidence intervals (CIs) and statistical tests were estimated using replicate bootstrap weights provided by Statistics Canada. More information on the CCHS 2018 questionnaire and methodology can be found on Statistic Canada’s website.
In this report, when two estimates are said to be different or more frequent, this indicates that the difference was statistically significant at the 5% level (where the p-value is less than 0.05), based on a Rao-Scott Chi-Square test for difference of proportions.
Limitations
General notes
The CCHS excludes certain populations including people who are living in institutions, full-time members of the Canadian Forces, people living on reserves and other Aboriginal settlements in the provinces, and persons living in rural and remote areas. Altogether, these exclusions represent less than 3% of the Canadian population aged 12 and over. More information on the CCHS 2018 target population can be found on Statistics Canada’s website.
Data on sex and gender
In the 2018 CCHS cycle, no data were collected in relation to gender identity. In this survey, a question on sex was included.
Page details
- Date modified: