
Health Impacts of Air Pollution in Canada: Estimates of morbidity and premature mortality outcomes – 2021 Report
Download the alternative format
(PDF format, 6.23MB, 56 pages)
Organization: Health Canada or Public Health Agency of Canada
Published: by authority of the Minister of Health
Cat.: H144-51/2021E-PDF
ISBN: 978-0-660-37331-7
Pub.: 200423
Table of contents
- Summary
- 1.0 Introduction
- 2.0 Methods
- 3.0 Results
- 4.0 Discussion
- 5.0 Conclusions
- 6.0 References
- Appendix A. Information on air emissions levels and sources associated with ambient concentrations of PM2.5, ozone and NO2 in Canada
- Appendix B. NO2, ozone and PM2.5 concentration-response functions in AQBAT version 3.0
- Appendix C. Baseline incidence rates for key health endpoints by geographic area, in annual events per million population – 2011 estimates included in AQBAT version 3.0
- Appendix D. Additional air pollution and health impact estimates
Summary
A large body of scientific evidence has accumulated over the past 25 years attributing a wide range of adverse health effects to ambient (outdoor) air pollution exposure. These effects range in severity from respiratory symptoms to the development of disease and premature death. Significant advances in the health and atmospheric sciences over the last two decades have also made it possible to estimate the number of deaths and illnesses associated with air pollution. In Canada and internationally, health impact assessments identify air pollution as one of the largest risk factors for premature death and disability.
In this report, air pollution is defined as pollutants that scientific studies have associated with wide-ranging health effects and to which the population is ubiquitously exposed in the outdoor environment. These pollutants include fine particulate matter (PM2.5), ground-level ozone, and nitrogen dioxide (NO2). This is an update to previous health impacts of air pollution reports published by Health Canada. It relies on data and scientific knowledge, including ambient air pollution exposure estimates and demographic data from 2014 to 2017. The approach for quantitatively estimating the population health impacts of air pollution is well established by international health science organizations. In alignment with established approaches, Health Canada estimated 1) exposures to ambient air pollution across Canada, 2) the associated adverse health impacts in the population and 3) the corresponding economic costs of these health impacts. This analysis accounts for national demographics, including population counts, age profiles and baseline health status. Health impacts are presented nationally, as well as by province and territory (using 2016 population data).
This report considers Canadians’ exposure to above-background levels. Above-background levels correspond to the difference between ambient concentrations and background concentrations. Background concentrations are equivalent to minimum ambient air pollution levels, such as those present in remote areas uninfluenced by human activity. The above-background air pollution is comprised mostly of human-source (anthropogenic) emissions, but it also includes emissions from natural events such as forest fires. Exposure to air pollutants in indoor environments was not considered. The focus on above-background air pollution is relevant to air quality management in Canada because policies and regulations to improve air quality generally target anthropogenic emissions. The national average exposure to above-background air pollution estimates were 4.3 µg/m3 for PM2.5, 7.2 ppb for NO2, 13.2 ppb for annual ozone and 14.4 ppb for summer ozone. These averages are population-weighted to account for the geographic distribution of the Canadian population.
Health Canada estimates that above-background air pollution, including air pollution from human sources in North America, contributes to 15,300 premature deaths per year in Canada. Footnote 1 This includes an estimated 6,600 premature deaths in Ontario, 4,000 in Quebec, 1,900 in British Columbia and 1,400 in Alberta. National morbidity or nonfatal health outcomes include 2.7 million asthma symptom days and 35 million acute respiratory symptom days per year, with the total economic cost of all health impacts attributable to air pollution for the year being $120 billion (2016 CAD). This is equivalent to approximately 6% of Canada’s 2016 real gross domestic product.
The mortality estimates reported in this assessment are based on risk information from epidemiological studies deemed to be the most relevant to Canada. The mortality endpoints include all-cause mortality Footnote 2 associated with long-term exposure to ambient PM2.5, and short-term exposure to NO2 and annual ozone, as well as respiratory mortality associated with long-term exposure to warm-season ozone. All risk information contributing to Health Canada’s mortality estimates was derived from Canadian cohort and time-series studies, with the exception of chronic exposure respiratory mortality associated with ozone that was derived from an American cohort. In the context of this analysis, short-term exposure is related to effects that occur a few days after an elevation in ambient air pollution (i.e. acute health effects), while long-term exposure refers to exposures averaged over the years preceding the development of disease or death (i.e. chronic health effects).
In addition to the effects of changes in air pollution exposure over time, population growth also influences the overall health burden of air pollution, leading to a greater number of exposed individuals and resulting in an overall net increase in premature deaths attributable to air pollution. These variations in population can be standardized by presenting the death rates per 100,000 population. The current estimate of 15,300 premature deaths is equivalent to 42 premature deaths per 100,000 Canadians. Health Canada estimated, in 2017, 14,400 premature deaths per year, and, in 2019, 14,600 premature deaths per year, which were equivalent to 41–42 deaths per 100,000 Canadians. Footnote 3
In this analysis, the air pollution-associated premature death and nonfatal effect counts are based on exposure to ambient concentrations of PM2.5, NO2 and ozone exclusively. These pollutants are included because there is robust epidemiological evidence of their adverse health impacts as well as the ability to accurately estimate the spatial distribution of their ambient concentrations across Canada. However, owing to data limitations and knowledge gaps, not all health effects that have been associated with exposure to PM2.5, NO2 and ozone in the scientific literature can currently be quantified. Further, there are other air contaminants that contribute to air pollution health impacts, but they are beyond the scope of this work. The quantitative estimates of population health effects provided in this report are therefore assumed to underestimate the full impact of exposure to air pollution in Canada. Overall, this analysis indicates that despite the relatively low levels of air pollutants in Canada compared to other regions of the world, air pollution continues to impact population health.
1. Introduction
Air pollution is recognized globally as a major contributor to the development of disease and premature death and represents the largest environmental risk factor to human health (WHO 2016). Exposure to air pollution increases the risk of premature mortality from heart disease, stroke and lung cancer. Footnote 4 The health and atmospheric sciences have advanced significantly in the past two decades, making it possible to estimate the number of deaths and illnesses associated with air pollution. These values are estimated using information from the peer-reviewed scientific literature, which relates population-level pollution exposure (both short-term and long-term) to the risk of adverse health outcomes, including premature death and hospital visits. The quantitative relationship between exposure and increased risk of adverse health outcomes is referred to as the concentration-response function (CRF). Estimates of air pollution-attributable deaths and other adverse health outcomes have been developed globally and for many individual countries, including by Cohen et al. (2017), the Institute for Health Metrics and Evaluation (IHME) and the Health Effects Institute (HEI) (2018), and the World Health Organization (WHO) (2016).
According to the Global Burden of Disease (GBD) project, air pollution is the fifth leading mortality risk in the world and was responsible for 8.7% of deaths globally in 2017 (or 4.9 million premature deaths worldwide) (IHME and HEI 2019). Internationally, Canada is among the top 10 countries with the lowest national PM2.5 exposure levels (IHME and HEI 2019). According to the GBD analyses, air pollution ranks as the 11th largest risk factor overall for premature death and disability in Canada, and is the top environmental risk. Footnote 5
Estimates of air pollution-attributable mortality in Canada have previously been developed by Health Canada (2017, 2019), Stieb et al. (2015), the Canadian Medical Association (2008), and as part of the GBD project. Footnote 6 The previous edition of this report (Health Canada 2019) estimated that 14,600 premature deaths were associated with ambient air pollution exposure in 2015. In this context, air pollution is defined as pollutants that scientific studies have associated with wide-ranging health effects and to which the population is ubiquitously exposed. These pollutants include PM2.5, ground-level ozone, and NO2. While both sulphur dioxide and carbon monoxide are also ubiquitous in Canada and have also been associated with such effects in some studies, they appear to have far less important impact than the three pollutants listed above.
Estimates of air pollution-attributable fatal and nonfatal outcomes are expected to change over time as a result of our improving understanding of the relationship between exposure and risk and the spatial representation of air pollution exposure. For example, new scientific information may support or confirm the inclusion of additional causes of death associated with air pollution. In addition, new air pollution exposure data and modelling tools provide more accurate air pollution level estimates with improved spatial and temporal resolution for all regions of Canada. Changes in population health and demographics, including the aging population, will influence the number of health outcomes attributable to air pollution exposure.
The objective of this analysis is to draw on the most recent data and scientific knowledge to provide comprehensive and up-to-date estimates of morbidity and mortality outcomes in Canada related to ambient levels of PM2.5, ozone and NO2. These pollutants were included because there is robust epidemiological evidence of their adverse health impacts as well as the ability to accurately estimate the spatial distribution of their ambient concentrations across Canada. Estimates are provided at the national, provincial and territorial levels. In addition, an economic valuation of health impacts is presented. The methods described here are considered to be comprehensive and appropriate for the Canadian context. Exposure to air pollutants in indoor environments was not considered.
2. Methods
2.1 Pollutants included in the estimate
This analysis of air pollution health impacts in Canada focuses on PM2.5, NO2, and ozone. Emissions from local, regional, national and international sources directly (primary emissions) and indirectly (secondary formation) contribute to the presence of these pollutants in the country’s ambient air. Fuel combustion, including from mobile (e.g. on-road vehicles and off-road equipment) and power generation (e.g. coal or natural gas) sources, directly releases particles and nitrogen oxides (NOx) into the air. In addition, combustion emits a suite of organic and inorganic compounds that contribute to secondary PM2.5 and ozone. Ozone is not emitted directly, but formed from precursors such as NOx and volatile organic compounds (VOCs) via secondary reactions in the atmosphere and reactions with sunlight. Health Canada and other international agencies have concluded that PM2.5, NO2 and ozone cause or are likely to cause premature mortality based on extensive evidence from epidemiological studies (e.g. Health Canada 2013, 2016; US EPA 2019). These three pollutants also account for the majority of population health impacts from air pollution. There is robust scientific evidence of health effects at very low concentrations of these pollutants, and no evidence of an exposure threshold in the population. In other words, any incremental increase in air pollutant concentration is associated with an increased risk of adverse health outcomes. General information on emissions and ambient concentrations of NO2, ozone, and PM2.5 in Canada as well as the associated adverse health effects are presented in Appendix A.
2.2 Estimating population exposures to above-background air pollution
The current analysis estimates the mortality and morbidity outcomes associated with ambient air pollution corresponding to above-background levels. While most of the above-background increment is linked to human source (anthropogenic) emissions originating from North America, natural emissions are also included, notably from wildfires. Health impacts associated with “background” pollutant concentrations (which include emissions from other natural sources and sources beyond North America) were not included. Footnote 7 This measurement of above-background air pollution is relevant to air quality management in Canada, as policies and regulations generally target anthropogenic emissions to improve air quality. High-resolution estimates of ambient concentrations of PM2.5, NO2, and ozone were used to estimate population-level exposures across Canada. These estimates, which are presented graphically in Figures 1–3, were generated using a combination of ground-level measurements, satellite data, geographic and land-use information, as well as computer model simulations. Background concentrations were then subtracted to obtain the exposure data included in this analysis.
2.2.1 Background concentrations of air pollution
Background concentrations of PM2.5, NO2 and ozone were estimated in collaboration with Environment and Climate Change Canada (Judek et al. 2004). This complex initiative involved a combination of qualitative (i.e. expert judgment) and quantitative (i.e. data-driven) approaches to evaluate concentration measurements at rural and remote monitoring sites. Background concentrations were estimated using either one of the following methods:
- The data from rural and remote monitoring sites were separated into sectors of different air mass origin, and the background concentrations were selected as the monthly or annual average concentrations for the sectors containing no major anthropogenic sources; or
- Many years of rural and remote measurement data were plotted in a time series allowing a qualitative selection of the lowest values that are considered to be the most representative of background air masses.
This resulted in annual average background concentrations for NO2 and PM2.5. A set of monthly-average background concentrations were derived for ozone, for which the ambient concentrations have a strongly seasonal cycle. These monthly averages were then combined into summer and annual average concentrations to be consistent with those used to quantify health risks. Regional differences in background concentrations are likely, but for the purposes of this analysis, a single background concentration was applied across Canada for each pollutant. Footnote 8 The estimated background concentrations for Canada are as follows:
- 1.8 micrograms per cubic metre (µg/m3) for PM2.5 (annual average).
- 0.15 parts per billion by volume (ppb) for NO2 (annual average).
- 26 ppb for annual ozone (annual average of daily 1-h maximum) and 28 ppb for summer ozone (May–September average of daily 1-h maximum).
2.2.2 Above-background air pollution
To estimate the population health impacts attributable to above background air pollution, it is necessary to calculate the above-background air pollution increment. Air pollution levels are known to vary geographically and can be estimated using a combination of observed and simulated concentrations. Routine ground-level air pollution monitoring in Canada occurs at discrete monitoring stations across the country, which limits the geographic coverage of air pollution exposure estimates that rely solely on direct measurements. For this assessment, we relied on spatially resolved estimates of ambient air pollution levels (including both anthropogenic and natural sources, and non–North American contributions) for PM2.5, NO2 and ozone, produced through a combination of data sources, including ambient monitoring, as described below. In contrast, a single background concentration for each pollutant was developed and was assumed to apply across Canada (as described in the previous section).
2.2.3 Assignment of concentrations to populations
Air pollution concentration estimates for NO2, PM2.5 and ozone were generated and mapped to the Canadian population (using the 2011 census, with population counts for 2016). Ambient concentrations were averaged over three years of available data (between 2014 and 2017) to ensure that results were not influenced by any interannual variations in concentrations. Abnormal weather patterns and air pollution events, including wildfires and stay-at-home orders, are possible causes of interannual variations (Griffin et al. 2020; Matz et al. 2020; Zangari et al. 2020). Air pollution concentrations were estimated for up to 293 census divisions (CDs). Footnote 9 Figures 1 to 3 present maps of population-weighted ambient air pollutant concentrations for annual average PM2.5, annual 1-h daily maximum ozone, summer 1-h daily maximum ozone (i.e. May–September), and annual average NO2. The data displayed in these maps represent the estimated distribution of ambient air concentrations from all natural and anthropogenic sources. Canadian background concentrations were then subtracted to estimate exposures to above-background ambient air pollution concentrations. The methods used to estimate air pollutant levels are detailed in the following subsections.
2.2.3.1 Fine particulate matter
Annual average PM2.5 concentrations for 2015–2017 were derived from optimal estimation methods combining remote-sensing observations, chemical transport modelling and ground-based observations (van Donkelaar et al. 2015a). Aerosol optical depth (AOD) data were obtained from three satellite instruments: Multi-angle Imaging SpectroRadiometer (MISR), Moderate Resolution Imaging Spectroradiometer (MODIS), and Sea-viewing Wide Field-of-view Sensor (SeaWiFS) (Boys et al. 2014; Crouse et al. 2015; Stieb et al. 2015; van Donkelaar et al. 2010, 2013, 2015a). AOD is a vertically integrated measurement of light extinction in the atmosphere, which is associated with aerosols. Factors such as the vertical distribution and composition of aerosols, as well as humidity and other meteorological conditions, can influence estimates of ground-level PM2.5 concentrations based on AOD measurements. To account for these factors, AOD values can be normalized or adjusted using output from chemical transport models and ground-based observations. For the current assessment, AOD data were combined with information obtained from the Goddard Earth Observing System chemical transport model (GEOS-Chem) and Canada’s National Air Pollution Surveillance (NAPS) network (ground-based air pollutant monitoring) to provide final national estimates of PM2.5 levels (van Donkelaar et al. 2015b).
The annual average PM2.5 concentration estimates were generated as a gridded surface with a spatial resolution of approximately 1 km × 1 km. The grid cell values were then converted to a point dataset and merged with a dataset representing postal code areas. The nearest point was assigned to each postal code. The postal code results were then combined with dissemination area (DA) population data to calculate population-weighted concentrations for each CD.
Figure 1 shows the distribution of annual average PM2.5 concentrations for the years 2015 to 2017. The national population-weighted average ambient PM2.5 concentration is 6.1 µg/m3 during the period of interest. As expected, higher PM2.5 concentrations are observed in many of the more populous CDs, such as those in the Lower Fraser Valley of British Columbia, the Calgary–Edmonton Corridor in Alberta, and along the Windsor–Quebec City Corridor in Ontario and Quebec (Figure 1).

Figure 1 Description
A map of Canada showing the population-weighted daily fine particulate matter concentrations in ambient air across Canadian census divisions. The concentrations are three-year averages for the 2015 to 2017 period. Census divisions are categorized by the concentration of fine particulate matter in micrograms per cubic metre. Concentrations between 0.6 and 2.6 micrograms are observed in the northeastern regions of Canada including Quebec, northern Manitoba, Nunavut, and the northern regions of the Northwest Territories. Concentrations of 2.7 to 3.9 micrograms are observed in New Brunswick, Nova Scotia, PEI, Ontario, southern Manitoba, the western region of the Northwest Territories, Yukon, and the northern regions of British Columbia. Concentrations of 4.0 to 5.1 micrograms are observed in southern regions of Quebec and Ontario, some northern and southern regions of Saskatchewan and Alberta, northern regions of British Columbia, and the eastern region of the Northwest Territories. Concentrations of 5.2 to 6.6 micrograms are observed in various southern regions in Quebec, Ontario, Saskatchewan, Alberta, and British Columbia. Concentrations of 6.7 to 8.8 micrograms are observed in northern Alberta regions, and southern British Columbia.
2.2.3.2 Ozone
Estimates of both the (1) annual ozone average and (2) summer ozone average (May–September) were derived from daily 1-h maximum concentrations for 2014, 2015 and 2017. Data for 2016 were not available owing to operational considerations for the underlying model. These estimates were produced by Environment and Climate Change Canada using objective analysis, an interpolation technique that weighs and combines modelled ozone forecasts with observations of ozone (Robichaud and Ménard 2014; Kalnay 2003). The model led ozone forecast was provided by the Global Environmental Multiscale - Modelling Air quality and Chemistry (GEM-MACH) system, Environment and Climate Change Canada’s operational regional air quality forecast model (e.g. Makar et al. 2018; Moran et al. 2010; Whaley et al. 2018). Ozone measurements were obtained from the Canadian Air and Precipitation Monitoring Network (CAPMoN) and the Canadian NAPS network. In objective analysis, the optimal combination of modelled and observed values improves the coverage and accuracy of air pollution patterns (Robichaud et al. 2016). Objective analysis leads to better estimates of ambient ozone concentrations in areas lacking monitoring data compared to standard interpolation techniques (such as spatial kriging). Estimates for Canada are available for 2014, 2015 and 2017, on a grid point surface with a horizontal resolution of 10 km x 10 km. The grid point estimates were then interpolated to CD polygons (using a normalized conservative approach). All grid points within and bordering CD polygons were included, wholly or partially, to estimate the average ozone concentration values by CD.
Figure 2 (top panel) shows the distribution of the annual average of daily 1-h maximum ozone concentrations for the years 2014, 2015 and 2017. The distribution of summer-average daily 1-h maximum ozone is similar (Figure 2–bottom panel). Higher ozone concentrations are observed in the Lower Fraser Valley of British Columbia, in southern Alberta and along the Windsor–Quebec City Corridor, including many of the more populous CDs in Canada. As environmental and meteorological conditions in warmer months promote the formation of ozone, higher concentrations are also observed in the summer: The national population-weighted average ambient concentrations are 39.2 ppb for annual ozone and 42.4 ppb for summer ozone.

Figure 2 Description
Two maps of Canada showing the population-weighted annual (top panel) and summer (bottom panel) ozone concentrations in ambient air across Canadian census divisions. The concentrations are three-year averages of the daily one-hour maximum for 2014, 2015 and 2017. Census divisions are categorized by the concentration of ozone in parts per billion.
Top Panel- Annual ozone concentrations: Concentrations of 30 to 32 parts per billion are present in northern Canada including Yukon, the Northwest territories, Nunavut, Newfoundland, as well as the norther regions of Quebec, Ontario, Manitoba, Saskatchewan, Alberta, and British Columbia. Concentrations of 33 to 35 parts per billion are observed in New Brunswick, as well as southern regions in Quebec, Ontario, Manitoba, and Saskatchewan, as well as a northern region of Alberta, eastern regions of British Columbia, and a central region of the Northwest Territories. Concentrations of 36 to 38 parts per billion are observed in Nova Scotia, southern regions in Quebec, Ontario, Saskatchewan and British Columbia, as well as in two norther regions of Alberta. Concentrations of 39 to 41 parts per billion are observed in southern Ontario, Alberta, and British Columbia. Concentrations of 42 to 48 parts per billion are observed in southern Alberta.
Bottom panel- Summer ozone concentrations: Concentrations of 30 to 32 parts per billion are present in northern Canada including Yukon, the Northwest territories, Nunavut, Newfoundland, as well as the norther regions of Quebec, Ontario, Manitoba, Saskatchewan, Alberta, and British Columbia. Concentrations of 33 to 35 parts per billion are observed in New Brunswick, as well as southern regions in Quebec, Ontario, Manitoba, and Saskatchewan, as well as a northern region of Alberta, and eastern regions of British Columbia. Concentrations of 36 to 38 parts per billion are observed in Nova Scotia, southern regions in Quebec, Ontario, Saskatchewan and British Columbia, as well as in two norther regions of Alberta. Concentrations of 39 to 41 parts per billion are observed in southern Ontario and Alberta. Concentrations of 42 to 48 parts per billion are observed in southern Alberta.
2.2.3.3 Nitrogen dioxide
Annual average NO2 concentrations were estimated using a national land-use regression (LUR) model for 2015–2017 (Larkin and Hystad 2020). The LUR model predictors included three-year annual average NO2 concentrations for 2015, 2016, and 2017 using NO2 vertical column densities (NASA Earth Observations database Footnote 10) from the Ozone Monitoring Instrument (OMI), as well as land use and meteorological descriptors (e.g. Boersma et al. 2011; Hystad et al. 2011; Lamsal et al. 2008). In addition to the OMI data, the model predictors were population density, railways, temperature, industrial use, highways and expressways, and the normalized difference vegetation index (NDVI). The NO2 estimates were developed on a high-resolution grid (30 m) in order to best capture the fine spatial gradients in NO2 concentrations. The LUR model performance was assessed by comparing predicted and observed NO2 concentrations. Observations corresponded with the three-year annual average NO2 data from the NAPS network for 2015, 2016, and 2017 (180 monitoring stations). A coefficient of determination (R2) of 0.68 was reported between the NO2 model results and the corresponding NAPS data (Larkin and Hystad 2020).
In this analysis, the 2015–2017 annual average NO2 estimates were derived for dissemination block (DB) centroids (or nearest valid location). Estimates were available for 486,676 DBs (2016 Census). DB estimates ranged from 0 to 20 ppb, with a mean of 5.4 ppb. The DB results were used to calculate population-weighted concentrations for each CD. Figure 3 shows the distribution of annual average NO2 concentrations, averaged over 2015 to 2017. The national population-weighted average ambient concentration is 7.4 ppb for NO2. As is the case for PM2.5 and ozone, higher NO2 concentrations were observed in southwestern British Columbia, around the Calgary–Edmonton Corridor in Alberta, in southern Saskatchewan, and along the Windsor–Quebec City Corridor in Ontario and Quebec.

Figure 3 Description
A map of Canada showing the population-weighted daily nitrogen dioxide concentrations in ambient air across Canadian census divisions. The concentrations are three-year averages for the 2015–2017 period. Census divisions are categorized by the concentration of nitrogen dioxide parts per billion. Concentrations of 0 to 2.0 parts are observed in Manitoba, Northern British Columbia, Yukon, Northwest territories, and northern Nunavut. Concentrations of 2.1 to 3.5 parts are observed in Newfoundland, PEI, Nova Scotia, New Brunswick, Quebec, Nunavut, Manitoba, Saskatchewan, northern Alberta, and eastern regions of British Columbia and the Northwest Territories. Concentrations of 3.6 to 5.0 parts per billion are observed in the southern regions of Quebec, Ontario, Manitoba, Saskatchewan, Alberta, and British Columbia. Concentrations of 5.1 to 7.4 parts per billion are observed in southern Quebec, Saskatchewan, and British Columbia, as well as in the eastern regions of Alberta. Concentrations of 7.5 to 12.4 parts per billion are observed in southern Alberta.
2.3 Estimating premature deaths and nonfatal outcomes from air pollution
This analysis used Health Canada’s Air Quality Benefits Assessment Tool (AQBAT) version 3.0 (Judek et al. 2019; Xu and Stieb Footnote 11) to link population-level above-background air pollution exposure to health outcomes. The AQBAT model estimates the number of premature deaths and other health outcomes associated with specified changes in air pollution concentrations across geographic units (i.e. CDs) in Canada. Outcomes can then be aggregated to provincial, territorial and national health impact estimates, as was done here. Health effect information for the three air pollutants is included in the form of CRFs. A CRF represents the excess health risk for a given endpoint, such as asthma symptoms, chronic bronchitis, and mortality, that follows a unit increase in ambient pollutant concentration. For example, an increase in PM2.5 chronic exposure of 10 µg/m3 leads to a corresponding 10% increase in the risk of premature mortality from nonaccidental causes. A CRF is a statistically derived estimate, from a single study or a meta-analysis of multiple studies.
Health endpoints (related to acute or chronic exposure), the associated CRFs and the applicable population group(s) (e.g. age-specific groups) are predefined in AQBAT. In the context of this analysis, short-term exposure contributes to effects that occur within a few days of an increase in ambient air pollution (acute health effects), while long-term exposure refers to exposures averaged over the years preceding the development of disease or death (chronic health effects). Pollutant-specific CRFs for individual adverse health outcomes are drawn from the health science literature and are the consensus selection of a panel of Health Canada experts. They are therefore Health Canada-endorsed values. Table 1 presents the pollutants and their associated health effects considered by this analysis. Previous studies (e.g. Crouse et al. 2012; Judek et al. 2019; Shin et al. 2013; Stieb et al. 2015) contain background information on the CRF estimates used in this analysis (i.e. references to the scientific literature upon which the risk estimates are based) and the analysis undertaken to produce the estimates within AQBAT. This information is also summarized in Appendix B. Health outcomes were considered to have no threshold for effect (i.e. effects were assumed to occur at all levels of exposure), which is consistent with Health Canada’s conclusions upon evaluation of the overall literature on each of these pollutants (Health Canada 2013, 2016).
| PollutantFootnote a | Averaging period | Health endpoint | Causality determinationFootnote d | Reference |
|---|---|---|---|---|
| NO2 | 24-h | Acute exposure mortalityFootnote bFootnote c | Likely causal | Health Canada 2016 |
| Ozone | 1-h maximum | Acute exposure mortalityFootnote b | Likely causal | Health Canada 2013 |
| Summer ozone | 1-h maximum | Acute respiratory symptom days | Causal | Health Canada 2013 |
| Asthma symptom days | Causal | Health Canada 2013 | ||
| Chronic exposure respiratory mortality | Suggestive to be causal | Health Canada 2013 | ||
| Minor restricted activity days | Causal | Health Canada 2013 | ||
| Respiratory emergency room visits | Causal | Health Canada 2013 | ||
| Respiratory hospital admissions | Causal | Health Canada 2013 | ||
| PM2.5 | 24-h | Acute respiratory symptom days | Causal | Health Canada 2013 |
| Adult chronic bronchitis cases | Suggestive to be causal | Health Canada 2013 | ||
| Asthma symptom days | Causal | Health Canada 2013 | ||
| Cardiac emergency room visits | Causal | Health Canada 2013 | ||
| Cardiac hospital admissions | Causal | Health Canada 2013 | ||
| Child acute bronchitis episodes | Causal | Health Canada 2013 | ||
| Chronic exposure mortality | Causal | Health Canada 2013 | ||
| Respiratory emergency room visits | Causal | Health Canada 2013 | ||
| Respiratory hospital admissions | Causal | Health Canada 2013 | ||
| Restricted activity days | Causal | Health Canada 2013 | ||
AQBAT: Air Quality Benefits Assessment Tool; CRF: concentration–response function; NO2: nitrogen dioxide; ozone: ozone; PM2.5: fine particulate matter or particulate matter with a diameter of 2.5 µm or less
Footnotes
|
||||
Population-level premature deaths were estimated using the following CRFs and health endpoints:
- Nonaccidental causes of death Footnote 12 associated with long-term exposure to PM2.5 from a Canadian cohort (Crouse et al. 2012).
- Nonaccidental causes of deaths associated with short-term exposure to NO2 and ozone from a Canadian time-series analysis (Burnett et al. 2004).
- Death from respiratory causes associated with long-term exposure to summer ozone from an American cohort (Jerrett et al. 2009).
CRF values for premature deaths are shown in Table 2 and 3 for all health endpoints in Appendix B. Table 2 and 3 summarize methodological considerations for the current health impact assessment, including a list of fatal and nonfatal health effects associated with each air pollutant, data sources for estimating exposures to air pollution, and national population-weighted average exposure estimates.
CRFs can be input as a distribution function in the calculations, accounting for inherent uncertainty in the CRF estimates. Monte Carlo simulations employing 10,000 iterations were used to propagate this uncertainty in the CRFs. The model generates a central estimate of the most likely health impacts equal to the median of the output distribution, as well as low- and high-end estimates equal to the 2.5 and 97.5 percentiles of the output distribution.
CRF values for PM2.5 mortality from ischemic heart disease (IHD), cerebrovascular disease (CVD), lung cancer and chronic obstructive pulmonary disease (COPD) for adults 25 years and over, are also included in AQBAT (Shin et al. 2013). Footnote 13 These four individual causes correspond to the approach employed by the IHME and the WHO in the GBD analyses (Cohen et al. 2017; Lim et al. 2012; Global Burden of Disease), which include estimates of air quality and health impacts across the world. IHD, CVD, lung cancer and COPD are a subset of nonaccidental chronic exposure mortality (i.e. nonaccidental deaths), which are reported herein. For the purposes of this report, nonaccidental causes of death is considered the most appropriate premature mortality metric associated with chronic exposure to PM2.5; it generally leads to higher mortality estimates than the sum of specific causes of death.
| Health effects | PM2.5 | NO2 | Annual ozone | Summer ozone |
|---|---|---|---|---|
| Cause of death and exposure type % increase per change [key reference] | AllFootnote a – chronic 10% per 10 µg/m3 [Crouse et al. 2012] | AllFootnote a – acute 1.5% per 20 ppb [Burnett et al. 2004c] | AllFootnote a – acute 1.7% per 20 ppb [Burnett et al. 2004] | Respiratory – chronic 8.2% per 20 ppb [Jerrett et al. 2009] |
| Morbidity outcomes | Acute Respiratory Symptom Days; Adult Chronic Bronchitis Cases; Asthma Symptom Days; Cardiac ER Visits; Cardiac HA; Child Acute Bronchitis Episodes; Respiratory ER Visits; Respiratory HA; Restricted Activity Days | None | None | Acute Respiratory Symptom Days; Asthma Symptom Days; Minor Restricted Activity Days; Respiratory ER Visits; Respiratory HA |
CRF: concentration-response function; ER: emergency room; GEM-MACH: Global Environmental Multiscale - Modelling Air quality and CHemistry; GEOS-Chem: Goddard Earth Observing System chemical transport model; HA: hospital admissions; µg/m3: micrograms per cubic metre; NAPS: National Air Pollutant Surveillance network; ppb: parts per billion by volume.
Footnotes
|
||||
| National exposure estimates | PM2.5 | NO2 | Annual ozone | Summer ozone |
|---|---|---|---|---|
| Years of exposure data | 2015–2017 | 2015–2017 | 2014, 2015, 2017 | |
| Type of exposure data [key reference] | Satellite observations, ground observations (NAPS), and chemical transport models (GEOS-Chem) [van Donkelaar et al. 2015a,b] | Satellite observations, ground observations (NAPS), geographic data (e.g. land use, distance to roadways) [Larkin and Hystad 2020] | Objective analysis of ground observations (NAPS) and chemical transport model (GEM-MACH) [Robichaud and Ménard 2014]. Annual and summer (May–September) averages | |
| Average ambient concentrationFootnote a | 6.1 µg/m3 | 7.4 ppb | 39.2 ppb | 42.4 ppb |
| Natural background concentration | 1.8 µg/m3 | 0.15 ppb | 26 ppb | 28 ppb |
| Average air pollution concentrationFootnote aFootnote b | 4.3 µg/m3 | 7.2 ppb | 13.2 ppb | 14.4 ppb |
CRF: concentration-response function; ER: emergency room; GEM-MACH: Global Environmental Multiscale - Modelling Air quality and CHemistry; GEOS-Chem: Goddard Earth Observing System chemical transport model; HA: hospital admissions; µg/m3: micrograms per cubic metre; NAPS: National Air Pollutant Surveillance network; ppb: parts per billion by volume.
Footnotes
|
||||
2.3.1 Baseline incidence rates
Baseline incidence rates of the health endpoints considered are a key factor in estimating the count of health outcomes associated with a change in pollutant concentration. Baseline incidence rates are pre-defined in AQBAT as a model parameter. These rates are estimated through detection, observation and formal means of reporting (e.g. death certificates, hospital admission records) based on data provided by Statistics Canada or epidemiological studies (e.g. Abbey et al. 1995; Hoek et al. 2012; Krupnick et al. 1990; Ostro 1987; Osto and Rothschild 1989; Weinmayr et al. 2010). They are expressed in annual events per million people. Details regarding the source data, formulas, and algorithms used to estimate annual baseline health endpoint incidence rates are provided in the AQBAT user guide (Judek et al. 2019).
Baseline cause- and age-specific mortality rates were derived from counts of mortality obtained for each CD outside of Québec, where these data were not available. Rates are averaged over the three most recent years of available data to improve stability (Stieb et al. 2015). For Quebec, mortality counts were derived for each CD by applying national age- and cause-specific rates to the CDs’ individual population age distribution. For each morbidity and mortality health endpoint in AQBAT, a data file contains estimated annual events per million specified people for every geographic area, age group, scenario year and population projection. The national, provincial and territorial baseline rates for health endpoints associated with NO2, ozone and PM2.5 in the current version of AQBAT are summarized in Appendix C. Footnote 14
Incidence rates are generally associated with many factors, such as age, gender, race, education, income, environmental factors and lifestyle habits. Age-specific baseline incidence rates (for the health endpoints in question) for the target population were included to estimate the number of excess health outcomes associated with the increased risk following a change in air pollutant concentration. Annual baseline health endpoint rates of events are assigned to specific populations that correspond to those examined in the underlying epidemiologic studies. For example, the Restricted Activity Days endpoint is assigned to 94% of people aged 20 years and older (i.e. nonasthmatics). Exposure to pollutants typically has a minor influence on the baseline incidence rates. Additional details and references on the process of deriving baseline rates have previously been published (Judek et al. 2019; Stieb et al. 2015).
2.4 Estimating the economic value of health outcomes from air pollution
Estimating the economic value (or valuation) of air pollution-related health impacts monetizes health outcomes, allowing impacts to be expressed in monetary units. In doing so, the potential social, economic and public welfare consequences of a health endpoint are considered, including medical costs, reduced workplace productivity, pain and suffering, and the other effects of increased health risks. Expressing impacts in monetary terms provides a common metric across health endpoints to estimate the overall benefits or damages in order to inform air quality management strategies. The sum provides an indication of the relative benefits or damages to society resulting from reduced or increased risks to health.
In AQBAT, each health endpoint is assigned a monetary value, typically derived from surveys, accounting or economic or actuarial data. The valuation estimates used in the model, along with references to the studies from which they are derived, are provided in Table 4. Endpoint valuations have inherent uncertainties, which are captured by a distribution of possible values within the model and defined by a distribution form and a set of parameters (Table 4). Endpoint valuations are expressed in Canadian dollars and can be temporally adjusted from the source years of the underlying studies based on the consumer price index, as defined by Statistics Canada (Judek et al. 2019; Statistics Canada, annual). In the current analysis, the currency year 2016 (2016 CAD) was used.
| Endpoint [reference] |
Currency year of original study | Source type | FormFootnote a | Parameter 1 (prob.) | Parameter 2 (prob.) | Parameter 3 (prob.) |
|---|---|---|---|---|---|---|
| Mortality [Chestnut and De Civita 2009] |
2007 | WTP/WR | Discrete | $3,500,000 (25%) | $6,500,000 (50%) | $9,500,000 (25%) |
| Acute respiratory symptom days [Stieb et al. 2002] |
1997 | WTP | Normal | $13 | $7 | – |
| Adult chronic bronchitis cases [Krupnick and Cropper 1992; Viscusi et al. 1991] |
1996 | WTP | Discrete | $175,000 (33%) | $266,000 (34%) | $465,000 (33%) |
| Asthma symptom days [Stieb et al. 2002] |
1997 | WTP | Triangular | $7 | $28 | $120 |
| Cardiac emergency room visitsFootnote b [Stieb et al. 2002] |
1997 | WTP | Normal | $4,400 | $590 | – |
| Child acute bronchitis episodes [Krupnick and Cropper 1989] |
1996 | WTP | Discrete | $150 (33%) | $310 (34%) | $460 (33%) |
| Elderly cardiac hospital admissions [Stieb et al. 2002] |
1997 | WTP | Normal | $5,200 | $610 | – |
| Minor restricted activity days [Stieb et al. 2002] |
1997 | WTP | Normal | $22 | $9 | – |
| Respiratory emergency room visitsFootnote b [Stieb et al. 2002] |
1997 | WTP | Normal | $2,000 | $210 | – |
| Restricted activity days [Stieb et al. 2002] |
1997 | WTP | Normal | $48 | $18 | – |
| Adapted from Judek et al. (2019) prob.: probability of value being selected in the analysis; WR: wage risk; WTP: willingness to pay Footnotes
|
||||||
As evident in Table 4, the monetary value of mortality is considerably higher than that of any other health endpoint. For the purposes of policy analysis, the recommended central estimate of an avoided premature death is $6.5 million (CAD 2007) based on a review of Canadian studies by Chestnut and De Civita (2009). The underlying data indicate that an average Canadian would be willing to pay approximately $65 in order to reduce the risk of premature death by 1 out of 100,000. The aggregate willingness to pay (WTP) of 100,000 Canadians ($65 each) equals the value of the one avoided death. The uncertainty in this estimate is addressed by a recommended low value of $3.5 million and a high value of $9.5 million (Table 4). These values provide a reasonable range of WTP but should not be considered as lower and upper bounds (Chestnut and De Civita 2009). The above values are not equivalent to the economic worth of an identified person’s life, but rather an aggregation of individual values people are willing to pay for small changes in risk. Footnote 15 Following adjustments based on the consumer price index, the value of an avoided premature death in 2016 CAD is $7.5 million.
3. Results
Table 5 presents the health impact and economic value results for mortality endpoints associated with PM2.5, ozone and NO2 air pollution for national, provincial and territorial geographies. Metrics in Table 5 include the count of incidences and normalized values per 100,000 population. The latter metric allows for comparisons of health impact estimates among geographic regions of different population sizes. All results represent the health impacts attributable to above-background concentrations, as outlined in the Methods section. The Canadian values presented herein have not previously been published.
Overall, the total mortality attributable to above-background air pollution in Canada was estimated to be 15,300 premature deaths per year, based on population data for 2016 and air pollutant concentrations from 2014 to 2017. Footnote 16 More specifically, the following population health impacts of PM2.5, ozone and NO2 were estimated: Footnote 17
- Chronic exposure to PM2.5 air pollution contributed to 8.0% of all-cause nonaccidental mortality among Canadians over 25 years of age, equivalent to 10,000 deaths per year or 27 deaths per 100,000 population.
- Acute exposure to NO2 air pollution contributed to 0.9% of all-cause nonaccidental mortality among Canadians of all ages, equivalent to 1,300 deaths per year or 4 deaths per 100,000 population.
- Acute exposure to ozone was associated with 2.7% of all-cause nonaccidental mortality among Canadians of all ages, equivalent to 2,800 deaths per year or 8 deaths per 100,000 population. This estimate was derived using the annual average of daily 1-h maximum ozone concentrations.
- Chronic exposure to ozone was associated with 10% of respiratory-related mortality among Canadians over 30 years of age, equivalent to 1,300 deaths per year or 4 deaths per 100,000 population. This estimate was derived using the summer average of daily 1-h maximum ozone concentrations.
The economic cost of the 15,300 premature deaths associated with air pollution is estimated at $114 billion per year (2016 CAD). Health Canada recognizes the possibility of overlap or double counting of endpoints; this is addressed in the Uncertainties and limitations section.
Large variations in premature death counts and normalized risks are observed across geographic regions (Table 5). Higher mortality counts are estimated for the provinces of Ontario, Quebec, British Columbia and Alberta, which are the most populous provinces and those with the highest projected air pollution levels (Figures 1 to 3). Reported premature deaths per 100,000 population indicate that air pollution mortality risks are highest in Ontario and Quebec, reflecting the confluence of high population density and air pollution levels, and lowest in Nunavut and the Northwest Territories. There are also variations between regions with populations of comparable size. For example, the death rate per 100,000 population in British Columbia (40) is somewhat higher than in Alberta (33). Results at the CD level, discussed below, underline potential reasons for these differences.
| Region—population | Counts of premature deathsFootnote a | Valuation (2016 CAD) × $1,000,000Footnote a | |||||
|---|---|---|---|---|---|---|---|
| Pollutant | per 100,000 | ||||||
| NO2 | PM2.5 | OzoneFootnote b | OzoneFootnote c | AllFootnote d | AllFootnote d | AllFootnote d | |
| Canada — 36,229,449 | 1,300 | 10,000 | 2,800 | 1,300 | 15,300 | 42 | 114,000 |
| Alberta — 4,286,341 | 120 | 850 | 290 | 140 | 1,400 | 33 | 10,400 |
| British Columbia — 4,689,131 | 170 | 1,200 | 310 | 160 | 1,900 | 40 | 13,900 |
| Manitoba — 1,307,764 | 35 | 300 | 72 | 28 | 430 | 33 | 3,300 |
| New Brunswick — 760,167 | 14 | 110 | 52 | 14 | 190 | 5 | 1,400 |
| Newfoundland and Labrador — 521,209 | 10 | 35 | 37 | 9 | 92 | 18 | 690 |
| Northwest Territories — 44,648 | 0 | 3 | 1 | 0 | 4 | 9 | 32 |
| Nova Scotia — 946,936 | 20 | 150 | 74 | 24 | 270 | 29 | 2,000 |
| Nunavut — 37,382 | 0 | 0 | 1 | 0 | 1 | 3 | 6 |
| Ontario — 13,979,393 | 570 | 4,200 | 1,200 | 580 | 6,600 | 47 | 49,200 |
| Prince Edward Island — 149,904 | 3 | 10 | 12 | 4 | 30 | 0 | 220 |
| Québec — 8,348,780 | 330 | 2,800 | 640 | 280 | 4,000 | 48 | 30,200 |
| Saskatchewan — 1,120,939 | 29 | 280 | 67 | 30 | 410 | 36 | 3,000 |
| Yukon — 36,855 | 0 | 3 | 1 | 0 | 4 | 11 | 31 |
Footnotes
|
|||||||
National estimates for all health endpoints, both fatal and nonfatal, are provided in Table 6. Air pollution is associated with a considerable number of morbidity or nonfatal outcomes; the highest counts are predicted for the following outcomes: acute respiratory symptom days, restricted activity days, and asthma symptom days. However, the annual costs associated with morbidity outcomes, which total $5.6 billion (2016 CAD), are much less than those for mortality, owing to the large monetary value assigned to increased risk of death (Table 4).
The 2.5 and 97.5 percentiles reported in Table 6 represent the low- and high-range estimates. They are generally within a factor of two to three of the central estimate, except for minor restricted activity days. The estimates for this health endpoint have a broader range owing to the associated CRF. Specifically, the regression coefficient used to derive the CRF is not statistically significant, and the distribution overlaps 0 and is truncated at 0 (Judek et al. 2019). It may also have wide confidence intervals. Nil values are also estimated as the lower range for adult chronic bronchitis cases linked to exposure to PM2.5. The CRF parameters explain this range in values (see Appendix B).
| Health endpoint | Pollutant | CountFootnote a [2.5 / 97.5 percentile] | Valuation (2016 CAD) × $1,000,000Footnote a [2.5 / 97.5 percentile] |
|---|---|---|---|
| Mortality | |||
| Acute exposure | NO2 | 1,300 [450 / 2,100] | 9,700 [2,600 / 20,200] |
| Ozone | 2,800 [1,900 / 3,600] | 20,600 [8,800 / 36,400] | |
| Chronic exposure – respiratory | Summer ozoneFootnote b | 1,300 [440 / 3,100] | 9,500 [2,600 / 19,600] |
| Chronic exposure | PM2.5 | 10,000 [5,300 / 14,500] | 74,600 [27,200 / 142,000] |
| Total mortalityFootnote c | All pollutants | 15,300 [8,000 / 22,400] | 114,000 [41,000 / 218,000] |
| Morbidity | |||
| Acute respiratory symptom days | Summer ozone, PM2.5 | 35,000,000 [377,000 / 69,900,000] | 360 [0 / 1,400] |
| Adult chronic bronchitis cases | PM2.5 | 9,200 [0 / 17,900] | 4,000 [0 / 10,500] |
| Asthma symptom days | Summer ozone, PM2.5 | 2,660,000 [362,000 / 5,420,000] | 200 [17 / 560] |
| Cardiac emergency room visits | PM2.5 | 1,100 [570 / 1,600] | 7 [3 / 10] |
| Cardiac hospital admissionsFootnote d | PM2.5 | 810 [430 / 1,200] | N/A |
| Child acute bronchitis episodes | PM2.5 | 42,300 [0 / 91,700] | 19 [0 / 53] |
| Minor restricted activity days | Ozone summer | 2,300,000 [0 / 9,540,000] | 72 [0 / 350] |
| Respiratory emergency room visits | Ozone summer, PM2.5 | 7,000 [2,400 / 11,600] | 20 [0 / 350] |
| Respiratory hospital admissions | Ozone summer, PM2.5 | 1,400 [480 / 2,300] | N/A |
| Restricted activity days | PM2.5 | 13,100,000 [7,750,000 / 18,400,000] | 890 [220 / 1,800] |
| Total morbidityFootnote c | All pollutants | N/A | 5,600 [2,400 / 14,700] |
N/A: not applicable
Footnotes
|
|||
Figure 4 shows variations in premature death rates per 100,000 population for CDs across Canada. Five groups were created to categorize normalized mortality rates attributable to air pollution exposure. Groups 1 and 2 are associated with rates that are lower than the national average of 42 premature deaths per 100,000 (group 3), and groups 4 and 5 are associated with higher-than-average rates. The geographic distribution of normalized mortality rates generally reflects the distribution of air pollution (see Figures 1 to 3), with CDs in groups 4 and 5 corresponding with regions of higher air pollution. The results illustrate that population size alone does not determine the rate of premature deaths: While higher population areas are generally characterized by higher air pollution levels, it does not necessarily translate to higher death rates per 100,000 population. Appendix D lists the results for the most populous CDs in Canada (Table D1) and the CDs with the highest rates (Table D2) and the lowest rates (Table D3) of premature deaths per 100,000 population. For high-population CDs (i.e. above 500,000), the rates range from 26 in Calgary (Division No. 6; 1,577,299 population) to 67 in Hamilton (564,030). The CDs with the highest rates could be divided into two distinct groups: southern British Columbia and southern Ontario. These CDs are clearly visible in Figure 5 and correspond with regions of higher air pollution levels. The British Columbia CDs in particular align with the distribution of PM2.5 concentrations associated with forest fire pollution in the province (Figure 1). These CDs are also generally characterized by relatively large populations (approximately 50,000–400,000 per CD). Lastly, the CDs with the lowest rate of deaths (Table D3) correspond with rural, northern or remote areas, including sparsely populated CDs in Nunavut, the Northwest Territories and Labrador.

Figure 4 Description
Notes: National average is 42 premature deaths per 100,000 population. Group 1 = 57 CDs; Group 2 = 93 CDs; Group 3 = 78 CDs; Group 4 = 37 CDs; Group 5 = 28 CDs
A map of Canada showing the annual rate of premature deaths per 100,000 population in 2016 associated with exposure to nitrogen dioxide, ozone and fine particulate matter in ambient air for census divisions in Canada. Census divisions are categorized by death per 100,000 population. 1 to 20 deaths per 100,000 population are observed in Newfoundland, Nunavut, Yukon, and northern regions of Quebec, Ontario, Manitoba, Saskatchewan, Alberta, British Columbia, and Northwest Territories. 21 to 34 deaths per 100,000 population are observed in New Brunswick, Nova Scotia, PEI, and southern regions of Quebec, Ontario, Manitoba, Saskatchewan, Alberta, British Columbia, and Northwest Territories. 35 to 45 deaths per 100,000 population are observed in southern regions of Quebec, Saskatchewan, Alberta, British Columbia, and Northwest Territories. 46 to 59 deaths per 100,000 population are observed in the southern regions of Quebec, Ontario, Saskatchewan, and British Columbia. 60 deaths per 100,000 population or more are observed in the southern regions of British Columbia.
The total annual economic value of health outcomes associated with air pollution in Canada is approximately $120 billion (2016 CAD). This is largely driven by premature deaths, which represent $114 billion (2016 CAD) in annual damages, or 95% of the overall monetized health burden. Although nonfatal endpoints have a lower monetary value ($5.6 billion per year [2016 CAD]) than premature deaths, air pollution-related morbidity impacts remain a health burden for the Canadian population.
4. Discussion
Health Canada estimates that 15,300 deaths per year are attributable to ambient air pollution in Canada, corresponding to 42 deaths per 100,000 population in 2016. The total monetary value of health outcomes associated with air pollution is approximately $120 billion per year (2016 CAD), a figure equivalent to 6% of Canada’s total real gross domestic product in 2016. Footnote 18 These estimates reflect the contribution from human sources of emissions in North America to Canada’s ambient concentrations of NO2, ozone, and PM2.5, as well as contributions from irregular natural events such as forest fires. In this analysis, air pollution data from 2015 to 2017 were used for NO2 and PM2.5, and from 2014, 2015 and 2017 for ozone. Uniform Canadian background concentrations were subtracted from these three-year average exposure surfaces to estimate the above‑background component of ambient air pollution. This approach was taken because this component, which includes anthropogenic emissions, is generally the subject of air quality management measures. Although Canada’s air pollution levels are low compared to those of other developed nations, Footnote 19 recent Canadian studies indicate that air pollution increases the risk of mortality even at low ambient concentrations (Crouse et al. 2015; Pinault et. al. 2017; Pappin et al. 2019).
The provincial results (Table 5) indicate that Ontario and Quebec see the heaviest health impacts from air pollution, both in terms of mortality count and premature deaths per 100,000 population. This is not unexpected, as approximately 63% of the total Canadian population resides in these two provinces. Further, some of the highest air pollution levels in Canada are found in the southern regions of Ontario and Quebec, which include the highly populated and industrialized Windsor-Quebec City Corridor (encompassing the Greater Toronto and Hamilton Area and Greater Montreal). On the CD level (Tables D1 to D3, Appendix D), results show that higher rates of premature deaths are not correlated solely with higher population; they reflect a combination of environmental factors, age distribution and demographic characteristics, including higher pollution levels and baseline incidence rates. For example, an analysis of health impacts associated with PM2.5 from wildfire smoke in Canada (Matz et al. 2020) indicated that between 2013 and 2018, the 10 CDs with the greatest average wildfire-PM2.5 exposures (45–70% of the total exposure to PM2.5) were all located in British Columbia. Five of those CDs were identified in Table D2 (CDs with the highest rates of premature death per 100,000). Wildfire activity was also common in Alberta, Saskatchewan and Manitoba in 2014, 2015 and 2017 (Matz et al. 2020). In addition, baseline incidence rates integrate various health and demographic variables, notably age distribution. Generally, CDs with older populations will have higher baseline incidence rates and consequently will be associated with higher rates of health outcomes for a given air pollution increment. Notwithstanding the exact causes used for calculating baseline incidence rates across all Canadian CDs, it was observed that several of the CDs with the highest premature death rates are associated with relatively elevated baseline incidence rates (Table D2, Appendix D). Thus, in a given CD, higher rates of health outcomes per 100,000 population represents the integration of several factors that influence the risks associated with exposure to air pollution.
Compared to previous analyses by Health Canada (see Table 7), the mortality health burden of air pollution in Canada for 2016 represents a slight increase in absolute terms: 14,400 in 2011 and 14,600 in 2015 (Health Canada 2017, 2019). The change in the number of premature deaths between analyses should be interpreted in consideration of: 1) estimates of exposure to air pollution across Canada; 2) estimates of the risk of health effects from exposure to air pollutants; and 3) demographic data, including population counts, age profiles and baseline health status. As presented in Table 7, the population-weighted average exposures to air pollution (above-background) in this analysis generally decreased from the previous reports for PM2.5 and summer ozone, whereas a slight increase was estimated for annual ozone. Although the national average estimates are comparable, regional variability can also influence the results. There was an estimated 1.8 ppb‑increase in NO2 exposure since the last analysis.
The variation in NO2 exposure estimates is possibly related in part to modifications in the LUR modelling since the 2014–2016 analysis (Health Canada 2019). Overall, the predictability of the 2014-2016 model reached an R2 of 0.73, compared to 0.68 for the 2015–2017 version. Two important changes include an update to the remote-sensing data Footnote 20 and the use of monitoring data from a near-road monitoring site. Notably, the new model integrates data from a new NAPS station located in downtown Vancouver (station 100141) that were characterized by higher NO2 concentrations than those measured at other monitoring stations. A mean annual average of 22.0 ppb was recorded at this station, over 3 ppb higher than the station with the next highest average (18.7 ppb), also located in downtown Vancouver, and more than 6 ppb higher than the stations with the highest concentrations in other provinces. The inclusion of locations with higher levels of air pollution increased model error. Footnote 21 However, this also increased model generalizability by capturing a unique combination of dense emission sources that are sparsely represented in the NAPS air monitoring network. Thus, while variations in air pollution exposure estimates across analyses can effectively reflect increases or decreases in ambient concentrations, methodological modifications also contribute to variability over time. The recent changes in LUR modelling for NO2 are considered incremental and necessary improvements.
| Exposure PeriodFootnote a | Population (Year) | NO2 | Annual ozone | Summer ozone | PM2.5 | Total Deaths | |||||
|---|---|---|---|---|---|---|---|---|---|---|---|
| pwe (ppb) | count | pwe (ppb) | count | pwe (ppb) | count | pwe (µg/m3) | count | count | per 100,000 | ||
| 2007–2012Footnote b | 34,342,780 (2011) | 8.3 | 1,300 | 12.8 | 2,400 | 15.6 | 1,200 | 4.7 | 9,500 | 14,400 | 42 |
| 2014–2016Footnote c | 35,851,774 (2015) | 5.4 | 940 | 13.0 | 2,700 | 14.8 | 1,300 | 4.3 | 9,700 | 14,600 | 41 |
| 2014–2017Footnote d | 36,229,449 (2016) | 7.2 | 1,300 | 13.2 | 2,800 | 14.4 | 1,300 | 4.3 | 10,000 | 15,300 | 42 |
pwe: population-weighted exposure
Footnotes
|
|||||||||||
In terms of demographics, the current estimates used population data for the year 2016. Previous analyses used the 2011 population (Health Canada 2017) and the 2015 population (Health Canada 2019). The Canadian population count for 2016 represented an approximate increase of 378,000 people over 2015 (1.1% increase) and 1.9 million people over 2011 (5.5% increase). On the CD level, variations in population counts between the 2016 and 2015 data ranged from approximately -2.3 to 2.7%. An alternative means of measuring air pollution health impacts is to express the number of health outcomes per 100,000 population, thereby removing the influence of population changes. The results normalized by population show that estimates of premature death associated with air pollution are consistent across analyses: 42 per 100,000 Canadians in 2016, compared with 41 per 100,000 Canadians in 2015 and 42 per 100,000 in 2011. The air pollution estimates also suggest that spatial characteristics of air pollution in Canada have not changed substantially in recent years. In the current analysis, the air pollution estimates (Figure 1) are comparable to those of the previous analysis (reproduced in Figures D1 to D4, Appendix D). The highest air pollution estimates are reported in the same CDs, generally those associated with the southern regions of British Columbia and Alberta, as well as areas along the Windsor–Quebec City Corridor.
The risk estimates for the various health outcomes, represented herein by CRFs, were consistent between this analysis and previous reports, and therefore are not considered a source of variation across the estimates. The baseline incidence rates for mortality and morbidity outcomes were updated for AQBAT version 3.0 and as such are consistent with the previous analysis (Health Canada 2019), but differ from analyses based on earlier versions of AQBAT (e.g. Health Canada 2017).
Other studies have estimated the impact of air pollution on Canadians, most notably using the approaches developed under the IHME’s Global Burden of Disease (GBD) project. The GBD analysis estimated 7,136 premature deaths from exposure to ozone and PM2.5 in Canada for the year 2016, equivalent to 20 premature deaths per 100,000 population. Footnote 22 Overall, Canada is characterized by low levels of air pollution and relatively low incidence of air pollution-related deaths compared to other countries. The GBD estimates of premature mortality in Canada in 2016 (7,136) is lower than Health Canada’s estimate for the same year (15,300). The differences lie in the details of the approaches, including the basic CRFs and exposure surfaces for pollutants considered in the analyses. For example, in the current analysis, the PM2.5 CRF was for all-cause mortality and used the Canada-specific study of Crouse et al. (2012), while the GBD analysis used an amalgam of several international studies, five specific causes of mortality, and a somewhat different approach to classification of mortality effects. In addition, while both the Health Canada and GBD approaches incorporate mortality effects for ozone, the specific causes of death or CRFs are different and lead to dissimilar estimates. Moreover, in Canadian analyses of the health effects of air pollution, NO2 is a significant predictor of premature mortality. Exposure to NO2 in 2016 is associated with 1,300 premature deaths in our current analysis; the GBD approach does not include NO2. This demonstrates the influence of the CRF and underlines the importance of selecting the most scientifically robust value for the Canadian population.
Other differences arise from the relatively coarser resolution exposure surfaces for PM2.5 and ozone used in the GBD analysis (e.g. Cohen et al. 2017). For this analysis, high-resolution surfaces were developed for PM2.5 (1‑km resolution), ozone (10-km resolution) and NO2 (30-m resolution) in order to ascertain population exposure. Finally, the analysis provided here utilizes Canadian analyses of background concentrations, representing a lower counterfactual scenario than the GBD analysis (i.e. theoretical minimum risk exposure level [Cohen et al. 2017]), which result in some additional differences versus other approaches.
4.1 Sensitivity analysis
As a sensitivity analysis, an alternative and nonlinear CRF was applied for nonaccidental mortality associated with long-term exposure to PM2.5 (i.e. chronic exposure mortality; Pinault et al. 2017). This CRF was derived from an analysis of the 2001 Canadian Census Health and Environment Cohort (CanCHEC). By contrast, the AQBAT CRF from Crouse et al. (2012, 2015) was based on the 1991 CanCHEC. Pinault et al. (2017) derived the CRF using a statistical curve-fitting method: the Shape Constrained Health Impact Function (SCHIF). This method fits several mathematical functions, including linear and nonlinear curves, to describe the shape of association. The SCHIF method was recently employed to derive the Global Exposure Mortality Model (GEMM) for 41 cohorts internationally, across the global range of PM2.5 exposures, to assess global estimates of mortality associated with long-term exposure to ambient PM2.5 (Burnett et al. 2018). The results from GEMM show a considerable increase in global mortality attributable to outdoor PM2.5 air pollution (8.9 million deaths) compared to previous GBD estimates (4.1 million deaths) (Cohen et al. 2017).
To assess the potential influence of a nonlinear CRF for PM2.5, the CRF for PM2.5 of Pinault et al. (2017) was employed in the current evaluation as a sensitivity analysis. The selection of this CRF is relevant since it was developed using a large Canadian cohort (CanCHEC) of 2.4 million people. A supralinear shape of association was reported, which indicates higher incremental risks across the lowest range of PM2.5 air pollution (Pinault et al. 2017). This supralinearity concurs with the GEMM and findings from Burnett et al. (2018). A large fraction of the Canadian population is expected to be exposed to air pollution levels in the lower range of exposures (i.e. less than 5 µg/m3). Use of the alternative nonlinear CRF (nonaccidental deaths) for chronic exposure to ambient PM2.5 resulted in an additional 3,000 premature deaths, valued at $22.4 billion (the health impact estimates for NO2 and ozone are unchanged).
4.2 Uncertainties and limitations
The air quality and health impacts modelling conducted in the current assessment made use of the best available tools and data for Canadian scenarios. As with other health impact assessments, the health impact estimates are subject to uncertainty introduced by assumptions implicit in the assignment of population exposure, representation of health risks via CRFs, and the valuation of health endpoints. This section addresses these categories of uncertainty, which are associated specifically with the analysis of health impacts, by means of qualitative discussions and quantitative sensitivity analyses. When possible, uncertainties were evaluated according to their potential influence on the direction and magnitude of estimated health impacts, as well as the amount of evidence available to support the approach or assumptions selected for the current assessment. This approach aims to follow the WHO uncertainty framework (2008) and the United States Environmental Protection Agency’s approach to the qualitative assessment of uncertainty outlined in the assessment of the National Ambient Air Quality Standard (NAAQS) for PM (2012). Overall, it is expected that uncertainties in the current assessment likely lead to an underestimation of health impacts.
4.2.1 Exposure uncertainty
In this analysis, three different methods were used to calculate Canadians’ exposure to each of the three pollutants. These included satellite observations and ground observations fused with a chemical transport model (PM2.5); objective analysis (OA) that considered ground observations fused with a chemical transport model (ozone); and LUR modelling (NO2). These three estimation methods currently provide the best available national exposure estimates for each pollutant. Ongoing work on model development and testing could eventually lead to a uniform approach for all pollutants that is consistent in its assumptions and spatial representativeness; for example, an OA approach for all pollutants. However, there is currently no evidence indicating that the use of a single modelling approach would generate better or more consistent predictions. The three approaches utilize methods that are optimal (at time of writing) for each pollutant and may represent the best analysis, since each pollutant is governed by different processes and parameters. It is unclear how the use of distinct methods impacts the magnitude and direction (i.e. increase or decrease) of air pollution estimates.
The ambient concentrations that informed this analysis were averaged over three years of available data to ensure that results were not influenced by interannual variability. The data periods for each pollutant differ slightly: While data from 2015 to 2017 informed the NO2 and PM2.5 concentrations, ozone concentrations were based on data for 2014, 2015 and 2017 because the 2016 data were not useable at the time of this assessment owing to operational considerations for the underlying model. Footnote 23 Health Canada and Environment and Climate Change Canada continue to collaborate on the evaluation of approaches for developing more integrated exposure estimates that can be updated annually or biannually. The uncertainty associated with excluding ozone data for the year 2016 is expected to have a minor impact on the magnitude and direction of health impact estimates.
The use of uniform background concentrations to estimate population exposures is a source of uncertainty. Regional differences in background concentrations likely exist across Canada for each pollutant. Spatial variations in background concentrations can lead to under- or overestimates of population exposures to air pollution. Continuing analyses of air quality in Canada could provide new, spatially-resolved, background air pollution concentrations for use in future analyses. It is uncertain how the use of new background concentrations would impact the magnitude and direction of air pollution exposure estimates across Canada.
Another potential source of uncertainty is the variation in spatial resolution among air pollution exposure and epidemiologic data. First, the spatial resolution of the modelled exposure surfaces applied in this analysis differ from those used in the epidemiological source studies. Specifically, in this analysis, the exposure estimates were based on air pollution estimates for CD geographies, with population exposure estimates in particular being based on residential locations and a presumption that individuals remained within their CDs to carry out their daily activities. The CD estimates were weighted or interpolated from relatively high‑resolution national-scale exposure surfaces for NO2 (30-m grid), ozone (10-km grid) and PM2.5 (1-km grid). The CRFs in AQBAT for acute exposure mortality were derived from epidemiological studies that assessed population health effects based on monitoring data collected at centrally located sites. In addition, the mortality CRFs for chronic exposure to PM2.5 applied in AQBAT relied upon less spatially refined satellite-derived data (10-km grid resolution). These epidemiological studies used exposure data that were not as highly resolved as that of the current analysis. Meanwhile, population health effect studies based on high-resolution exposure estimates were not readily available. The magnitude and direction of the bias owing to this exposure misclassification are difficult to assess without a thorough sensitivity analysis, which was beyond the scope of the current assessment. An analysis of a population-based Canadian environmental cohort, the 2001 CanCHEC, examined the sensitivity of PM2.5 mortality associations to exposure surface resolution. Brauer et al. (2019) found improved model fit and higher risk estimates for the finest resolution surface analyzed (1 km) compared to 5 km and 10 km. It is likely that the CRF for chronic exposure mortality and PM2.5 exposure, which was derived using a 10-km exposure surface (Crouse et al. 2012), underestimates risk at the 1-km resolution applied in this assessment. The magnitude of this effect likely varies according to the pollutant examined in light of differences in the atmospheric lifetimes and spatial gradients in concentration as well as the resolutions employed for each species (30 m for NO2, 1 km for PM2.5, and 10 km for ozone).
Populations are exposed concurrently to multiple air pollutants in the ambient air mixture, and not to individual pollutants in isolation. It can be difficult for epidemiological studies to statistically separate the true, independent effects of individual pollutants. Where possible, the CRFs employed in this analysis were derived from models that statistically adjusted for the effects of other pollutants in multipollutant models. However, it remains possible that some pollutant effects have been double-counted, or that effects attributed to one pollutant were not fully disentangled from those attributed to other pollutants. One example is the association between NO2 concentrations and daily mortality rates (i.e. acute exposure mortality). Health Canada (2016) has concluded that acute exposure to NO2 is likely to cause an increased risk of mortality; however, NO2 originates from combustion sources and it is possible that NO2 exposure reflects, in part, the influence of other combustion products, including gases and particulates (Brook et al. 2007). A growing number of studies have also linked NO2 to chronic exposure mortality, but this was not included in AQBAT because Health Canada (2016) concluded that the evidence was merely suggestive of a causal relationship, primarily in light of the uncertainty in the potential mode of action and the possibility that it is acting as a surrogate for specific sources or other pollutants. If there is a causal relationship between chronic NO2 exposure and mortality, this would represent an underestimate in the current analysis.
There is also the potential for overlap between or double counting of acute and chronic health effects (WHO 2013). Double counting from this perspective is believed to be controlled in the selection of air pollutant and health endpoint CRFs in AQBAT. The uncertainty associated with double-counting premature deaths linked to acute and chronic exposure to air pollution is expected to have a minor impact on the magnitude and direction of the overall health impact estimates. Additional epidemiological studies addressing acute and chronic health outcomes in Canada and internationally are needed to further clarify this uncertainty.
4.2.2 Exposure-response uncertainty
The selection of a specific CRF for use in AQBAT is non-trivial. As the tool is used in part for regulatory purposes, the consistency and stability of model parameters are important considerations. While new studies may report alternative or updated CRFs, these must be evaluated by Health Canada, and the AQBAT model is updated periodically rather than continuously. Recent analyses, including those applying nonlinear curve‑fitting techniques (e.g. Burnett et al. 2018; Pinault et al. 2017) suggest a supralinear association between long-term exposure to PM2.5 and mortality from various causes. This supralinear shape of the relationship is especially relevant for conditions in Canada, which are typically characterized by low ambient air pollution concentrations. A supralinear CRF implies higher incremental effects per unit of exposure across the lowest range of PM2.5 air pollution levels and, when used in AQBAT, leads to additional premature deaths (health impacts for NO2 and ozone are unchanged). This new CRF for long-term exposure to PM2.5 has not been officially included in AQBAT; rather, it is used here for sensitivity analyses. These analyses indicate that current AQBAT results may underestimate PM2.5-associated premature deaths by approximately 30% (and total premature deaths by 20%). Chen et al. (2020) have also investigated the use of the SCHIF to characterize the joint impact of PM2.5 concentration and composition on cardiovascular disease outcomes across regions in Ontario. The results obtained by using the PM2.5-component-adjusted approach indicated improved prediction of the health impacts of PM2.5, especially when considering nonlinear air pollutant–outcome relationships. This new approach improves understanding of the health effects of PM2.5 and the quantification of population health impacts in future analyses.
Regarding CRFs in general, AQBAT includes a set of values that are endorsed by Health Canada based on the robustness of the database. In light of new research findings, CRFs may be added, modified or removed from AQBAT. Similar to the GBD analyses, the inclusion of new CRFs or new risk-outcome pairs in AQBAT depends on the strength of evidence for a causal association between the risk (in this case exposure to an air pollutant) and the health outcome, as well as the feasibility of developing an exposure surface for the air pollutant of interest (Shaffer et al. 2019). The decision to remove, add or modify CRFs requires the availability of robust data and a clear consensus among Health Canada experts that the proposed values are more relevant for the current Canadian population.
4.2.3 Uncertainty in endpoints and valuation
In the current analysis, the mortality and morbidity outcomes associated with air pollution are based on ambient concentration estimates of PM2.5, NO2 and ozone exclusively. AQBAT includes health endpoints associated with these air pollutants, for which there is a strong weight of evidence for effect and robust information quantifying the relationship between air pollution exposure and adverse health outcome. In addition, many effects that have been linked to air pollution are not included in AQBAT but may be in the future. For example, air pollution-related health endpoints of interest include neurological outcomes (e.g. dementia, intellectual disability) and reproductive outcomes (e.g. low birth weight) (Shaffer et al. 2019). Overall, it is expected that AQBAT results are underestimating fatal and nonfatal outcomes associated with air pollution. The magnitude of the bias is uncertain.
The inclusion of a health outcome in AQBAT requires the quantification of estimates of the associated baseline incidence rates and of target population characteristics, such as population count and age distributions. For some health endpoints, data reflecting regional differences in incidence rates are available, while for others, uniform incidence rates are applied across Canada in the absence of more detailed geographic data (e.g. cause-specific mortality related to long-term PM2.5 exposure). The assumption of geospatially constant baseline incidence rates is simplistic and a source of uncertainty that may lead to over- or underestimation of impacts depending on the characteristics of populations across regions of Canada.
Costs are assigned to the health outcomes for economic valuation purposes. The current version of AQBAT includes willingness to pay values that were temporally adjusted using the consumer price index from the source years of the underlying studies. However, these studies were published more than a decade ago (see Table 4) and may not reflect the most recent data and approaches. While the probabilistic approach in AQBAT accounts for valuation uncertainties, updating the underlying data could potentially improve estimates of the economic costs of air pollution. For air pollutants and health endpoint CRFs included in AQBAT version 3.0, the magnitude and direction of this bias are uncertain.
5. Conclusions
Air pollution is recognized globally as a leading risk factor for premature mortality based on an established database of international epidemiological studies and toxicological investigations. Comprehensive risk assessments performed by Health Canada (2013, 2016) have concluded that, based on extensive research and assessment, exposures to PM2.5, NO2, and ozone have been found to exert the largest population health impacts in Canada.
The current analysis provides estimates of mortality, morbidity and economic costs associated with the above‑background component of ambient air pollutant levels in Canada, which corresponds to air pollution that is targeted by air quality management measures. Health Canada estimates that in 2016, 15,300 premature deaths in Canada could be attributed to air pollution from PM2.5, NO2, and ozone. Nonfatal health outcomes attributable to air pollution include 35 million acute respiratory symptoms days, 2.7 million asthma symptom days and 8,100 emergency room visits. The total economic value of adverse air pollution health impacts is estimated to be $120 billion per year (2016 CAD), equivalent to 6% of total real gross domestic product in 2016. Although air pollution affects the health of Canadians in all regions of the country, the largest impacts are seen in the most populous provinces and those with the largest sources of emissions: Ontario, Quebec, British Columbia and Alberta.
While all three pollutants considered here exert impacts, exposure to PM2.5 represents the majority of the estimated mortality burden (65%), with ozone and NO2 accounting for 26% and 8%, respectively. Regarding nonfatal outcomes, both ozone and PM2.5 are associated with health impacts. This is not the case for NO2 because, while considered to be causally associated with several important respiratory effects, there are currently no CRFs in AQBAT for NO2 and morbidity outcomes.
This estimate of 15,300 deaths per year is equivalent to 42 per 100,000 Canadians and is consistent with previous analyses. The higher number of exposed individuals in 2016 compared to previous years of analysis (owing to population increase) leads to an overall higher mortality count. It is estimated that Canadians are currently exposed, on average, to lower air pollution levels for PM2.5 and summer ozone compared to exposure periods that informed previous analyses. In contrast, this assessment uses overall higher concentrations for annual ozone, while NO2 exposure estimates do not suggest any clear directional change. The normalized value per 100,000 population provides a more objective picture of the health burden and suggests that per capita air pollution-related health risks in Canada have remained consistent over the last decade. While Canadians benefit from relatively good air quality, air pollution continues to have impacts on population health.
The data and methods (e.g. background concentrations, CRFs) used in the current analysis, the most comprehensive analysis available, incorporate the most up-to-date science, data and knowledge on the health effects of air pollution in Canada compared with previous Canadian estimates. Nonetheless, evidence suggests that air pollution may be associated with additional adverse health outcomes that were not considered here. Further, there are air pollutants other than NO2, PM2.5 and ozone that are responsible for adverse health effects. As a result, the quantitative estimates of population health outcomes in this analysis are assumed to underestimate the adverse health impacts of air pollution in Canada.
Changes in health impact estimates are to be expected following each update by Health Canada. Variations or discrepancies between estimates may occur owing to changes in data or methods to assess population exposure to air pollutants, changes in concentration-response relationships, changes in the baseline rates of adverse outcomes in Canada, or changes in population demographics. AQBAT is periodically updated as new evidence is evaluated for inclusion in the model. For example, recent studies have reported a supralinear CRF between exposure to ambient PM2.5 and premature mortality, which would increase count estimates for Canada if it were included in AQBAT for health burden analyses. Evaluation of the relative risks and CRFs at low levels of air pollution, which is particularly relevant for Canada, is also an active area of research (Shaffer et al. 2019). Sensitivity analyses, such as the one discussed above, were conducted to explore the influence of different factors. Finally, there is the possibility of re-estimating the health impacts for years included in Health Canada analyses to ensure that estimates are based on internally consistent methods and data.
6. References
Abbey DE, Lebowitz MD, Mills PK, Petersen FF, Beeson L, Burchette RJ. 1995. Long term ambient concentrations of particulates and oxidants and development of chronic disease in a cohort of nonsmoking California residents. Inhal Toxicol 7(1): 19–34.
Boersma KF, Eskes HJ, Dirksen RJ, van der A RJ, Veefkind JP, Stammes P, Huijnen V, Kleipool QL, Sneep M, Claas J, Leitão J, Richter A, Brunner D. 2011. An improved retrieval of tropospheric NO2 columns from the Ozone Monitoring Instrument. Atmos Meas Tech 4: 1905–1928.
Boys B, Martin RV, Van Donkelaar A, MacDonell R, Hsu NC, Cooper MJ, Yantosca RM, Lu Z, Streets DG, Zhang Q, Wang SW. 2014. Fifteen-year global time series of satellite-derived fine particulate matter. Environ Sci Technol 48: 11109–11118.
Brauer M, Brook JR, Christidis T, Chu Y, Crouse D, Erickson A, Hystad P, Li C, Martin RV, Meng J, Pappin AJ, Pinault LL, Tjepkema M, van Donkelaar A, Weichenthal S, Burnett RT. 2019. Mortality–Air Pollution Associations in Low-Exposure Environments (MAPLE): Phase 1. Research Report 203
Brook JR, Burnett RT, Dann TF, Cakmak S, Goldberg MS, Fan X, Wheeler AJ. 2007. Further interpretation of the acute effect of nitrogen dioxide observed in Canadian time-series studies. J Exp Sci Environ Epidem 17: S36–S44.
Burnett RT, Stieb D, Brook JR, Cakmak S, Dales R, Raizenne M, Vincent R, Dann T. 2004. Associations between short-term changes in nitrogen dioxide and mortality in Canadian cities. Arch Environ Health 59(5): 228–36.
Burnett R, Chen H, Szyszkowicz M et al. 2018. Global estimates of mortality associated with long-term exposure to outdoor fine particulate matter. Proceedings of the National Academy of Sciences 115 (38): 9592–9597.
Canadian Medical Association. 2008. No Breathing Room: National Illness Cost of Air Pollution Summary Report. Ottawa: CMA.
Chen H, Zhang Z, van Donkelaar A, Bai L, Martin RV, Lavigne E, Kwong JC, Burnett RT. 2020. Understanding the joint impacts of fine particulate matter concentration and composition on the incidence and mortality of cardiovascular disease: a component-adjusted approach. Environ Sci Technol doi 10.1021
Chestnut LG, De Civita P. 2009. Economic valuation of mortality risk reduction: review and recommendations for policy and regulatory analysis. Prepared for the Government of Canada Policy Research Initiative. PRI Project – Regulatory strategy.
Cohen AJ, Brauer M, Burnett R, Anderson HR, Frostad J, Estep K, Feigin V et al. 2017. Estimates and 25-year trends of the global burden of disease attributable to ambient air pollution: an analysis of data from the Global Burden of Diseases Study 2015. The Lancet 389(10082): 1907–1918.
Crouse DL, Peters PA, van Donkelaar A, Goldberg MS, Villeneuve PJ, Brion O, Khan S, Atari DO, Jerrett M, Pope CA, Brauer M, Brook JR, Martin RV, Stieb D, Burnett RT. 2012. Risk of nonaccidental and cardiovascular mortality in relation to long-term exposure to low concentrations of fine particulate matter: a Canadian national-level cohort study. Environ Health Perspect 120(5): 708–714.
Crouse DL, Peters PA, Hystad P, Brook JR, van Donkelaar A, Martin RV, Villeneuve PJ, Jerrett M, Goldberg MS, Pope CA, Brauer M, Brook RD, Robichaud A, Menard R, Burnett RT. 2015. Ambient PM2.5, ozone, and NO2 exposures and associations with mortality over 16 years of follow-up in the Canadian Census Health and Environment Cohort (CanCHEC). Environ Health Perspect 123(11): 1180–1186.
[CRS] Congressional Research Service. 2019. Background ozone: challenges in science and policy. Prepared for Members and Committees of Congress. R45482. 18 pp. https://fas.org/sgp/crs/misc/R45482.pdf
Geddes JA, Martin RV. Boys BL, van Donkelaar A. 2016. Long-term trends worldwide in ambient NO2 concentrations inferred from satellite observations. Environ Health Perspect 124(3): 281–289.
Griffin D, McLinden C, Racine J, Moran M, Fioletov V, Pavlovic R, Eskes H. 2020. Assessing the impact of Corona-virus-19 on nitrogen dioxide levels over southern Ontario, Canada. Geophys Res Letters [submitted] https://doi.org/10.1002/essoar.10503538.2
Health Canada. 2013. Canadian smog science assessment – Volume 2: Health Effects. Air Health Sciences Division. Cat. En88-5/2-2013E-PDF. 533 pp.
Health Canada. 2016. Human health risk assessment for ambient nitrogen dioxide. Water and air quality Bureau, Safe Environments Directorate. Cat. H144-31/2016E-PDF. 288 pp.
Health Canada. 2017. Health impacts of air pollution in Canada – An estimate or premature mortalities. Government of Canada. ISBN 978-0-660-23740-4. 13 pp. http://publications.gc.ca/site/eng/9.846412/publication.html
Health Canada. 2019. Health impacts of air pollution in Canada – Estimate of morbidity and premature mortality outcomes – 2019 report. Government of Canada. ISBN 978-0-660-31165-4. 38 pp. http://publications.gc.ca/site/eng/9.874080/publication.html
Hoek G, Pattenden S, Willers S, Antova T, Fabianova E, Braun-Fahrländer C, et al. 2012. PM10 and children's respiratory symptoms and lung function in the PATY study. Eur Respir J 40(3): 538–47.
Hystad P, Setton E, Cervantes A, Poplawski K, Deschenes S, Brauer M, van Donkelaar A, Lamsal L, Martin R, Jerrett M, Demers P. 2011. Creating national air pollution models for population exposure assessment in Canada. Environ Health Perspect 119: 1123–1129.
[IHME and HEI] Institute for Health Metrics and Evaluation and Health Effects Institute. 2018. State of Global Air/2018. Institute for Health Metrics and Evaluation, and Health Effects Institute. https://www.stateofglobalair.org/
IHME and HEI. 2019. State of Global Air/2019. Institute for Health Metrics and Evaluation, and Health Effects Institute. https://www.stateofglobalair.org/
Jerrett M, Burnett RT, Pope CA III, Ito K, Thurston G, Krewski D, Shi Y, Calle E, Thun M. 2009. Long-term ozone exposure and mortality. N Engl J Med 360(11): 1085–1095.
Judek S, Stieb D, Xi G, Jovic B, Edwards B. 2019. Air Quality Benefits Assessment Tool (AQBAT) – User Guide – Version 3. Healthy Environments and Consumer Safety Branch, Health Canada. 205 pp.
Judek S, Jessiman B, Stieb D, Vet R. 2004. Estimated number of excess deaths in Canada due to air pollution. Ottawa: Health Canada.
Kalnay E. 2003. Atmospheric Modeling, Data Assimilation and Predictability: New York: Cambridge University Press.
Krupnick AJ, Cropper ML. 1989. Valuing chronic morbidity damages: medical costs, labor market effects and individual valuations. Final report to Office of Policy Analysis, US Environmental Protection Agency. 269 pp.
Krupnick AJ, Harrington W, Ostro B. 1990. Ambient ozone and acute health effects: Evidence from daily data. J Environ Econ Manage 18(1): 1–18.
Krupnick AJ, Cropper ML. 1992. The effect of information on health risk valuations. J Risk Uncertain 5: 29–48.
Lamsal LN, Martin RV, van Donkelaar A, Steinbacher M, Celarier EA, Bucsela E, et al. 2008. Ground- level nitrogen dioxide concentrations inferred from the satellite-borne Ozone Monitoring Instrument. J Geophys Res Atmos 113: D16308.
Larkin A, Hystad P. 2020. Update of the Canadian NO2 land use regression model for years 2015–2017, and prediction of Canadian NO2 concentrations. Produced for Health Canada, contract 4500401021. January 31, 2020. 13 pp.
Lim SS, Vos T, Flaxman AD, et al. 2012. A comparative risk assessment of burden of disease and injury attributable to 67 risk factors and risk factor clusters in 21 regions, 1990–2010: A systematic analysis for the Global Burden of Disease Study 2010. Lancet 380: 2224–2260.
Makar P, Akingunola A, Aherne J, Cole A, Aklilu Y, Zhang J, Wong I, Hayden K, Li S, Kirk J, Scott K, Moran M, Robichaud A, Cathcart H, Baratzedah P, Pabla B, Cheung P, Zheng Q, Jeffries DS. 2018. Estimates of exceedances of critical loads for acidifying deposition in Alberta and Saskatchewan. Atmos Chem Phys 18: 9897–9927.
Matz CJ, Egyed M, Guoliang X, Racine J, Pavlovic R, Rittmaster R, Henderson SB, Stieb DM. 2020. Health impact analysis of PM2.5 from wildfire smoke in Canada (2013–2015, 2017–2018). Sci Total Environ 725: 138506.
Moran MD, Ménard S, Talbot D, Huang P, Makar PA, Gong W, Landry H, Gravel S, Gong S, Crevier L-P, Kallaur A, Sassi M. 2010. Particulate-matter forecasting with GEM-MACH15, a new Canadian air-quality forecast model. Air pollution modelling and its application XX, edited by Steyn DG and Rao, ST, Springer, Dordrecht. pp. 289–292.
Ostro BD. 1987. Air pollution and morbidity revisited: A specification test. J Environ Econ Manage 14(1): 87–98.
Ostro BD, Rothschild S. 1989. Air pollution and acute respiratory morbidity: An observational study of multiple pollutants. Environ Res 50(2): 238–47.
Pappin AJ, Christidis T, Pinault LL, Crouse DL, Brook JR, Erickson A, Hystad P, Li C, Martin RV, Meng J, Weichenthal S, van Donkelaar A, Tjepkema M, Brauer M, Burnett RT. 2019. Examining the shape of the association between low levels of fine particulate matter and mortality across three cycles of the Canadian Census Health and Environment Cohort. Environ Health Perspect 127(10): 107008.
Pinault LL, Weichenthal S, Crouse DL, Brauer M, Erickson A, van Donkelaar A, Martin RV, Hystad P, Chen H, Finès P, Brook JR, Tjepkema M, Burnett RT. 2017. Associations between fine particulate matter and mortality in the 2001 Canadian Census Health and Environment Cohort. Environmental Research 159: 406–415.
Robichaud A, Ménard R, Zaïtseva Y, Anselmo D. 2016. Multi-pollutant surface objective analyses and mapping of air quality health index over North America. Air Qual Atmos Health 9:743–759.
Robichaud A, Ménard R. 2014. Multi-year objective analyses of warm season ground-level ozone and PM2.5 over North America using real-time observations and the Canadian operational air quality models. Atmos Chem Phys 14(4): 1769–1800.
Shaffer RM, Sellers SP, Baker MG, de Buen Kalman R, Frostad J, Suter MK, Anenberg SC, Balbus J, Basu N, Bellinger DC, Birnbaum L, Brauer M, Coehn A, Ebi KL, Fuller R, Grandjean P, Hess JJ, Kogevinas M, Kumar P, Landrigan PJ, Lanphear B, London SJ, Rooney AA, Stanaway JD, Trasande L, Walker K, Hu H. 2019. Improving and expanding estimates of the Global Burden of Disease due to environmental health risk factors. Environ Health Perspect 127(10): 105001-1–16.
Shin HH, Cohen A, Pope CA III, Ezzati M, Lim SS, Hubbell B, et al. 2013. Critical issues in combining disparate sources of information to estimate the Global Burden of Disease attributable to ambient fine particulate matter exposure. Working paper prepared for: Methods for Research Synthesis: A Cross-Disciplinary Workshop. Cambridge (MA): Harvard Center for Risk Analysis.
Statistics Canada. Annual. Table 18-10-0005-01 – Consumer Price Index, annual average, not seasonally adjusted. www150.statcan.gc.ca/t1/tbl1/en/tv.action?pid=1810000501
Stieb DM, De Civita P, Johnson FR, Manary M, Anis A, Beveridge RC, Judek S. 2002. Economic evaluation of the benefits of reducing acute cardiorespiratory morbidity associated with air pollution. Environ Health 1: 1–13.
Stieb DM, Judek S, van Donkelaar A, Martin RV, Brand K, Shin HH, Burnett RT, Smith-Doiron M. 2015. Estimated public health impact of changes in fine particle air pollution in Canada, 2000–2011. Can J Public Health 106(6): 362–368.
[TFHTAP] Task Force on Hemispheric Transport of Air Pollution. 2010. Hemispheric transport of air pollution 2010 – Part A: Ozone and particulate matter. Air Pollution Studies No. 17. Editors: Dentener F, Keating T & Akimoto H. Economic Commission for Europe. 304 pp. http://www.htap.org
[US EPA] United States Environmental Protection Agency. 2012. Regulatory impact analysis for the proposed revision to the National Ambient Air Quality Standards for particulate matter. Office of Air Quality Planning and Standards, US Environmental Protection Agency. Research Triangle Park, NC. EPA-452/R-12-003. 522 pp.
US EPA. 2013. Integrated science assessment for ozone and related photochemical oxidants. (EPA/600/R-10/076F). Research Triangle Park, NC: US Environmental Protection Agency, National Center for Environmental Assessment. http://cfpub.epa.gov/ncea/isa/recordisplay.cfm?deid=247492
US EPA. 2019. Integrated science assessment for particulate matter. Office of Research and Development. 1967 pp. https://cfpub.epa.gov/ncea/isa/recordisplay.cfm?deid=347534#tab-3
van Donkelaar A, Martin RV, Brauer M, Kahn R, Levy R, Verduzco C, Villeneuve PJ. 2010. Global estimates of ambient fine particulate matter concentrations from satellite-based aerosol optical depth: development and application. Environ Health Perspect 118: 847–855.
van Donkelaar A, Martin RV, Spurr RJD, Drury E, Remer LA, Levy RC, Wang J. 2013. Optimal estimation for global ground-level fine particulate matter concentrations. J Geophys Res 118: 5621–5636.
van Donkelaar A, Martin RV, Brauer M, Boys BL. 2015a. Use of satellite observations for long-term exposure assessment of global concentrations of fine particulate matter. Environ Health Perspect 123(2): 135–143.
van Donkelaar A, Martin RV, Spurr RJ, Burnett RT. 2015b. High-resolution satellite-derived PM2.5 from optimal estimation and geographically weighted regression over North America. Environ Sci Technol 49: 10482–10491.
Viscusi WK, Magat WA, Huber J. 1991. Pricing environmental health risks: survey assessments of risk–risk and risk–dollar trade-offs for chronic bronchitis. J Environ Econ Manage 21(1): 32–51.
Weinmayr G, Romeo E, De Sario M, Weiland SK, Forastiere F. 2010. Short-term effects of PM10 and NO2 on respiratory health among children with asthma or asthma-like symptoms: a systematic review and meta-analysis. Environ Health Perspect 118(4): 449–57.
Whaley C, Makar PA, Shephard MW, Zhang L, Zhang J, Zheng Q, Akingunola A, Wentworth GR, Murphy JG, Kharol SK, Cady-Pereira KE. 2018. Contributions of natural and anthropogenic sources to ambient ammonia in the Athabasca Oil Sands and north-western Canada. Atmos Chem Phys 18: 2011–2034.
[WHO] World Health Organization. 2008. Part 1: Guidance document on characterizing and communicating uncertainty in exposure assessment – harmonization project document No. 6. Published under joint sponsorship of the World Health Organization, the International Labour Organization and the United Nations Environment Programme. WHO Press: Geneva, Switzerland. https://www.who.int/ipcs/methods/harmonization/areas/uncertainty%20.pdf
WHO. 2013. Health risks of air pollution in Europe – HRAPIE project. Recommendations for concentration–response functions for cost–benefit analysis of particulate matter, ozone and nitrogen dioxide. HWO Regional Office for Europe: Copenhagen, Denmark. 60 pp.
WHO. 2016. Ambient air pollution: a global assessment of exposure and burden of disease. Geneva. https://www.who.int/phe/publications/air-pollution-global-assessment/en/
Zangari S, Hill DT, Charette AT, Mirowsky JE. 2020. Air quality changes in New York City during the COVID-19 pandemic. Sci Total Environ 742: 140496.
Appendix A. Information on air emissions levels and sources associated with ambient concentrations of PM2.5, ozone and NO2 in Canada
Extensive scientific studies indicate that there are significant health and environmental effects associated with exposure to the air pollutants considered in the current assessment, namely fine particulate matter (PM2.5), ground-level ozone, and nitrogen dioxide (NO2). These pollutants are notably responsible for the formation of smog. This appendix provides general information on Canadian sources of emissions for these pollutants, as well as their associated health effects. In addition, emissions data are provided for nitrogen oxides (NOx) and volatile organic compounds (VOCs), precursors for the formation of ozone and PM2.5.
Note:
This appendix summarizes findings published in Canada’s Air Pollutant Emissions Inventory Report, a report released annually by Environmental and Climate Change Canada (ECCC 2020). Additional information and data were extracted from the State of the Air Report, available on the website of the Canadian Council of Ministers of the Environment. For additional details, please refer to the original publications.
Particulate matter
Emissions in Canada
Particulate matter consists of aerosols (i.e. airborne particles) in solid or liquid form. It exists in various sizes that are often classified as coarse (aerodynamic diameter between 2.5 and 10 µm), fine (2.5 µm or less) and ultrafine (0.1 µm or less).
PM may be defined as primary or secondary:
- Primary PM is emitted by a source directly into the atmosphere. Examples include combustion emissions from smokestacks and vehicle exhaust or noncombustion emissions from wind-entrained dust produced by soil, as well as paved and unpaved roads.
- Secondary PM is not emitted directly, but rather formed in the atmosphere through a series of chemical and physical reactions involving gases such as sulphur oxides, NOx, and VOCs.
In 2015–2017, approximately 1.6 million tonnes (Mt) of PM2.5 were emitted in Canada (Table A1). The largest contributions were associated with noncombustion emissions. Dust sources accounted for 58% of total PM2.5 emissions, mostly from construction activities (55% of dust emissions) and unpaved roads (43% of dust emissions). Agriculture was the second largest contributing sector to PM2.5 emissions, accounting for 24% of total PM2.5 emissions.
In terms of combustion-related emissions, the largest contribution originated from commercial, residential, and institutional sources (11% of total PM2.5 emissions), mainly associated with residential wood burning (10% of total PM2.5 emissions). The ore and mineral industry sector and transportation and mobile equipment sources each contributed 2% of total PM2.5 emissions, while other source sectors accounted for less than 1%.
Figure A1 presents the distribution of PM2.5 emissions in 2016, not including dust emissions and natural sources (e.g. forest fires). As indicated above, residential wood burning is responsible for the largest share of PM2.5 emissions in Canada. Figure A2 shows trends in PM2.5 emissions from 1990 to 2018. Dust emissions have steadily increased in absolute and relative terms over this period and accounted for more than 50% of total PM2.5 emissions. Particulate emission from other sectors have generally decreased owing to new technologies and practices.
| Sectors | 2015 | 2016 | 2017 |
|---|---|---|---|
| Ore and Mineral Industry | 31,000 | 32,000 | 35,000 |
| Oil and Gas Industry | 12,000 | 11,000 | 13,000 |
| Electric Power Generation (Utilities) | 3,500 | 3,400 | 3,300 |
| Manufacturing | 18,000 | 17,000 | 17,000 |
| Transportation and Mobile Equipment | 37,000 | 33,000 | 35,000 |
| Agriculture | 370,000 | 380,000 | 380,000 |
| Commercial/Residential/Institutional | 180,000 | 180,000 | 180,000 |
| Incineration and Waste | 2,700 | 2,700 | 2,800 |
| Paints and Solvents | 15 | 16 | 23 |
| Dust | 920,000 | 930,000 | 930,000 |
| Fires | 10,000 | 9,100 | 4,800 |
| Total | 1,600,000 | 1,600,000 | 1,600,000 |
| Source: Canada’s Air Pollutant Emissions Inventory Report 2020: chapter 2.1, Environment and Climate Change Canada. | |||

Figure A1 Description
Source: Canada’s Air, Canadian Council of Ministers of the Environment.
Emissions of air pollutants come from human activities and natural causes. This chart presents fine particulate matter emissions from human-activities only in 2016. Percentages are measured against a Canada-wide total which excludes open sources (like road dust) and natural sources (like forest fires). Home Firewood Burning comprises 61.1%, Mobile sources account for 13.6%, Ores and mineral industry makes up 12.4%, manufacturing accounts for 6.6%, other sources account for 2.1%, and oil and gas industry comprises 4.2%.

Figure A2 Description
Source: Canada’s Air Pollutant Emissions Inventory Report 2020: chapter 2.1, Environment and Climate Change Canada.
Figure A2 is a stacked area graph displaying the five major contributors to national trends in fine particulate matter emissions between 1990 and 2018. The five contributors are the following: Construction Operations, Paved and Unpaved Roads, Crop Production, Home Firewood Burning, and Other. The following table displays the contributions (kt) for the years 1990 to 2018.
Health effects
Exposures to PM2.5 can negatively impact the heart and lungs and can lead to health issues such as asthma symptoms, chronic bronchitis, and heart attacks. Exposure to PM2.5 is also linked to increased emergency room visits and hospitalization for respiratory and cardiovascular problems, as well as increased risk of premature death. Vulnerable population groups, such as children and those with pre-existing cardiovascular and respiratory disease, are more sensitive to these effects (Health Canada 2013).
Ground-level ozone
Precursor emissions and ambient levels in Canada
Ozone is an colourless, odourless and highly irritating gas and a major component of smog. Populations are exposed to ozone that forms at ground level, which is also referred to as tropospheric ozone. Ozone is not emitted directly by sources: It is considered a secondary pollutant because it is formed through photochemical reactions between NOx and VOCs in the presence of sunlight. Ozone levels are generally higher in summer than in winter owing to favourable environmental conditions that increase ozone formation.
Figure A3 presents the distribution of ozone across Canada in 2016, as measured at National Air Pollution Surveillance (NAPS) stations. Annual average ambient concentrations generally vary between 30 and 40 parts per billion (ppb), reaching values above 40 ppb at stations located in southern Ontario. Average ozone concentrations over the last decade do not indicate any trend. By contrast, peak ozone concentrations, as indicated by the 4th highest daily maximum 8-hour average ozone concentration, shows a slight downward trend (from 68 ppb in 2002 to 57 ppb in 2016, a 0.75% annual decrease).

Figure A3 Description
Source: ECCC 2018
A map of Canada showing the average concentrations of fine particulate matter in 2016 by monitoring station. Stations are categorized by the annual concentration of fine particulate matter measured in the air. Concentrations of 0 to 25 parts per billion were observed in British Columbia and Saskatchewan. Concentrations of 25 to 30 parts per billion were observed in Nova Scotia, Saskatchewan, and British Columbia. 30 to 35 parts per billion were observed in New Brunswick, Nova Scotia, PEI, Newfoundland, Quebec, Ontario, Manitoba, Saskatchewan, Alberta, and British Columbia. 35 to 40 parts per billion were observed in southern regions of Alberta and Ontario. Concentrations of 40 or more parts per billion were observed in southern Ontario.
Health effects
Exposure to ozone is associated with respiratory symptoms (e.g. throat irritation, coughing, shortness of breath and reduced lung function) and can aggravate existing conditions like asthma or other chronic lung diseases. Exposure to ozone also increases the risk of premature death. Sensitive populations (e.g. children and people with respiratory or cardiovascular conditions) are at higher risk (Health Canada 2013).
Nitrogen dioxide
Emissions in Canada
NO2 and other NOx compounds are formed primarily through the burning of fossil fuels. Although a large fraction of NOx is released as NO, the latter reacts quickly in the atmosphere and converts to NO2. At higher concentrations, NO2 has a strong, harsh odour and can form a brownish haze in polluted urban air.
In 2015–2017, approximately 1.7 Mt of NOx were emitted in Canada (Table A2). The largest contributions were associated with transportation and mobile equipment, which accounted for 51% of total NOx emissions on average, followed by emissions from the oil and gas industry (28%) and electric power generation (9%).
| Sectors | 2015 | 2016 | 2017 |
|---|---|---|---|
| Ore and Mineral Industries | 81,000 | 78,000 | 86,000 |
| Oil and Gas Industry | 480,000 | 470,000 | 480,000 |
| Electric Power Generation (Utilities) | 150,000 | 150,000 | 150,000 |
| Manufacturing | 69,000 | 69,000 | 70,000 |
| Transportation and Mobile Equipment | 890,000 | 840,000 | 880,000 |
| Agriculture | 4,100 | 4,200 | 4,200 |
| Commercial/Residential/Institutional | 80,000 | 77,000 | 79,000 |
| Incineration and Waste | 4,200 | 4,200 | 5,200 |
| Paints and Solvents | 23 | 23 | 17 |
| Dust | - | - | - |
| Fires | 2,000 | 1,700 | 990 |
| Total | 1,800,000 | 1,700,000 | 1,700,000 |
| Source: Canada’s Air Pollutant Emissions Inventory Report 2020: chapter 2.3, Environment and Climate Change Canada. | |||
Figure A4 presents the distribution of NOx emission sources, excluding natural source emissions. Figure A5 presents the trends in NOx emission for major source sectors from 1990 to 2016. A considerable decrease in mobile source emissions has been observed since 2000, driven by decreases in emissions from light-duty gasoline trucks and vehicles following the adoption of increasingly stringent vehicle regulations. Upstream oil and gas industry and marine transportation are the sectors where NOx emissions have increased in recent decades, which can be attributed to expansion and growth in activity (ECCC 2018).
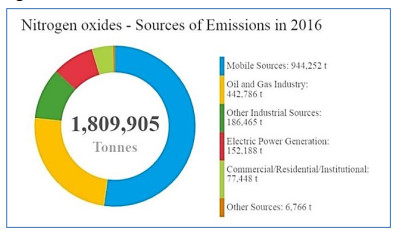
Figure A4 Description
Source: Canada’s Air, Canadian Council of Ministers of the Environment.
Emissions of air pollutants come from human activities and natural causes. This chart presents emissions for nitrogen oxides from human-activities only in 2016. Percentages are measured against a Canada-wide total which excludes open sources (like road dust) and natural sources (like forest fires). Mobile sources comprise 52.2%, the oil and gas industry comprises 24.5%, Other industrial sources make up 10.3%, Electrical power generation accounts for 8.4%, Commercial/residential/institutional sources comprise 4.3%, and other sources account for 0.4%.

Figure A5 Description
Source: Canada’s Air, Canadian Council of Ministers of the Environment.
This chart shows air emissions for nitrogen oxides from key sectors between 1990 and 2016. The five contributors are the following: Transportation and Mobile Equipment, Oil and Gas Industry, Electric Power Generation, Other Industrial Sources, and Other Sources. The following table displays the contributions (in tonnes) for the years 1990 to 2016.
Health effects
Short-term exposure to NO2 can provoke a range of adverse respiratory effects, including decreased lung function, increased respiratory symptoms, and airway inflammation, and can aggravate respiratory diseases, particularly asthma and chronic obstructive pulmonary disease. Short-term exposure to NO2 also increases the risk of premature death. Long-term exposure to NO2 may contribute to allergic responses, asthma development and may increase susceptibility to respiratory infections. Further investigations are needed to characterize and confirm relationships between exposure to NO2 and health outcomes (Health Canada 2016).
Volatile organic compounds
Emissions in Canada
VOCs are organic chemicals that vaporize under normal atmospheric conditions. VOCs exposed to sunlight react photochemically with NOx, producing ozone and organic aerosols, two key components of smog. VOCs include a range of chemicals that can be found in natural emissions (biogenic emissions), combustion products (e.g. engine exhaust) and evaporative emissions from consumer products (e.g. oil-based paint, cleaning products, solvents).
Between 2015 and 2017, approximately 1.8 Mt of VOCs were released in Canada (Table A3). The largest human sources are related to oil and gas extraction (37% of total VOC emissions), the use of paints and solvents (21% of total VOC emissions), and transportation and home firewood burning (each 16% of total VOC emissions) (Table A3 and Figure 6). Footnote 24
From 1990 to 2018, VOC emissions decreased by 37% (1.1 Mt) (ECCC 2018). This decrease was driven by increasingly stringent regulations targeting off-road spark ignition engines (i.e. those powered by gasoline, liquefied petroleum gas or compressed natural gas), as demonstrated in Figure A7 (covering 1990–2016). Reductions in VOC emissions from on-road light-duty gasoline vehicles and trucks also contributed to the downward trend. By contrast, emissions from the oil and gas industry have increased slightly over time.
| Sectors | 2015 | 2016 | 2017 |
|---|---|---|---|
| Ore and Mineral Industries | 11,000 | 11,000 | 11,000 |
| Oil and Gas Industry | 730,000 | 660,000 | 660,000 |
| Electric Power Generation (Utilities) | 1,600 | 1,600 | 1,300 |
| Manufacturing | 110,000 | 100,000 | 100,000 |
| Transportation and Mobile Equipment | 300,000 | 280,000 | 290,000 |
| Agriculture | 110,000 | 110,000 | 120,000 |
| Commercial/Residential/Institutional | 290,000 | 290,000 | 290,000 |
| Incineration and Waste | 9,900 | 10,000 | 10,000 |
| Paints and Solvents | 360,000 | 360,000 | 370,000 |
| Dust | - | - | - |
| Fires | 5,900 | 4,900 | 2,900 |
| Grand Total | 1,900,000 | 1,800,000 | 1,800,000 |
| Source: Canada’s Air Pollutant Emissions Inventory Report 2020: chapter 2.4, Environment and Climate Change Canada. | |||

Figure A6 Description
Source: Canada’s Air, Canadian Council of Ministers of the Environment.
Emissions of air pollutants come from human activities and natural causes. This chart presents volatile organic compound emissions from human-activities only. Percentages are measured against a Canada-wide total which excludes open sources (like road dust) and natural sources (like forest fires). The oil and gas industry comprise 35.9%, paints and solvents account for 19%, mobile sources make up 18.3%, home firewood burning account for 13.5%, other industrial sources comprise 9.1% and other sources account for 4.1%.
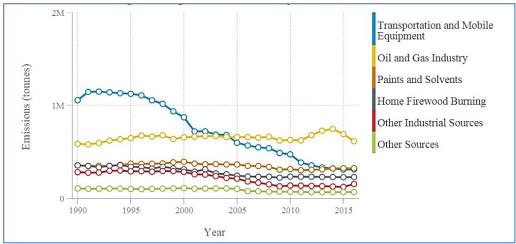
Figure A7 Description
Source: Canada’s Air, Canadian Council of Ministers of the Environment.
This chart shows volatile organic compound emissions from key sectors between 1990 and 2016. The six contributors are the following: Transportation and Mobile Equipment, Oil and Gas Industry, Paints and Solvents, Home Firewood Burning, Other Industrial Sources, and Other Sources.
References
[ECCC] Environment and Climate Change Canada. 2018. Canadian Environmental Sustainability Indicators – Air quality. Cat. EN4-144/57-2018E-PDF. Available at: www.canada.ca/en/environment-climate-change/services/environmental-indicators/air-quality.html
ECCC. 2020. Canada’s air pollutant emissions inventory report. Cat. En81-30E-PDF. Available at: www.canada.ca/en/environment-climate-change/services/air-pollution/publications/emissions-inventory-report-2020.html
Health Canada. 2013. Canadian smog science assessment – Volume 2: Health Effects. Air Health Sciences Division. Cat. En88-5/2-2013E-PDF. 533 pp.
Health Canada. 2016. Human health risk assessment for ambient nitrogen dioxide. Water and air quality Bureau, Safe Environments Directorate. Cat. H144-31/2016E-PDF. 288 pp.
Appendix B. NO2, ozone and PM2.5 concentration-response functions in AQBAT version 3.0
Pollutant: NO2
Endpoint: Acute exposure mortality
Source(s): Burnett et al. (2004) Results from model with four gases provided by R.T. Burnett, in addition to published results
DetailsFootnote a: Analysis of air pollution and mortality in 12 Canadian cities. The lead author provided results from additional multi-pollutant models not reported in the paper; the four-gas model was selected based on the overall t-value among the candidate models. Percent excess mortality (associated with the mean pollutant concentration) from Poisson regression models for CO, NO2, ozone and SO2, respectively, was 0.19% (t = 0.73, 1.0 ppm), 1.69% (t = 3.00, 22.4 ppb), 2.60% (t = 6.16, 30.6 ppb) and 0.23% (t = 2.09, 5.0 ppb). These results translate into regression coefficients (SE) of 0.00190 (0.00260), 0.000748 (0.000249), 0.000839 (0.000136) and 0.000459 (0.000220) for the same four pollutants, respectively. Although this multi-pollutant model excluded PM, it was selected as the model that best reflected the impact of the overall air pollution mix. Because of multi-co-linearity among pollutants, this model should nonetheless still reflect impacts of PM. In any case, the effects of PM in this study were reduced substantially when it was modelled together with NO2, the effect of which predominated in this analysis. The AQBAT CRF is applied to all members of all age groups.
Averaging period: 24 h
Regression type: Log(RR) or Log(OR)
FormFootnote a: Normal
Mean betaFootnote b: 7.48E-04
SE betaFootnote c: 2.49E-04
Pollutant: Ozone
Endpoint: Acute exposure mortality
Source(s): Burnett et al. (2004). Results from model with four gases provided by R.T. Burnett, in addition to published results.
DetailsFootnote a: Analysis of air pollution and mortality in 12 Canadian cities. The lead author provided results from additional multi-pollutant models not reported in the paper; the four-gas model was selected based on the overall t-value among the candidate models. Percent excess mortality (associated with the mean pollutant concentration) from Poisson regression models for CO, NO2, ozone and SO2, respectively, was 0.19% (t = 0.73, 1.0 ppm), 1.69% (t = 3.00, 22.4 ppb), 2.60% (t = 6.16, 30.6 ppb) and 0.23% (t = 2.09, 5.0 ppb). These results translate into regression coefficients (SE) of 0.00190 (0.00260), 0.000748 (0.000249), 0.000839 (0.000136) and 0.000459 (0.000220) for the same four pollutants, respectively. Although this multi-pollutant model excluded PM, it was selected as the model that best reflected the impact of the overall air pollution mix. Because of multi-co-linearity among pollutants, this model should nonetheless still reflect impacts of PM. In any case, the effects of PM in this study were reduced substantially when it was modelled together with NO2, the effect of which predominated in this analysis. The AQBAT CRF is applied to all members of all age groups.
Averaging period: 1h
Regression type: Log(RR) or Log(OR)
FormFootnote a: Normal
Mean betaFootnote b: 8.39E-04
SE betaFootnote c: 1.36E-04
Pollutant: Ozone (May–Sept.)
Endpoint: Respiratory mortality
Source(s): Jerrett et al. (2009)
DetailsFootnote a: Jerrett et al. (2009) analyzed data from the American Cancer Society cohort study. The relative risk of death from respiratory causes was 1.040 (95% CI 1.010–1.067) per 10 ppb ozone in a model with PM2.5; exposure was based on average of quarterly averages with ≥ 75% of daily values. This translates into a coefficient of 0.00392 with SE 0.00132. The AQBAT CRF is applied to the Canadian population ≥ 25 years of age.
Averaging period: 1h
Regression type: Log(RR) or Log(OR)
FormFootnote a: Normal
Mean betaFootnote b: 3.92E-03
SE betaFootnote c: 1.32E-03
Pollutant: Ozone (May–Sept.)
Endpoint: Acute respiratory symptom days
Source(s): Krupnick et al. (1990)
DetailsFootnote a: The authors reported on the association between ozone and the occurrence of acute respiratory symptoms in a panel of California families. They employed a Markov model that accounted for the occurrence of symptoms on the previous day and adjusted for Coefficient of Haze (CoH)Footnote d, NO2 and SO2 as co-pollutants. The incremental change in frequency of symptoms was calculated by substituting the coefficient from table VI, column 3, divided by 10 to convert from pphm to ppb, together with the transitional probabilities, p1 = 0.775 and p2 = 0.0468 (provided by the authors), into equation 3 on page 12 of the paper. The baseline frequency of symptoms was calculated by substituting p1 and p0 into equation 2. Thus, the proportional change per 1 ppb ozone is the output from equation 3 divided by that of equation 2, 0.000786 (SE 0.000386). The AQBAT CRF is applied to adults and nonasthmatic (85.7%) children aged 5–19 years.
Averaging period: 1h
Regression type: Linear
FormFootnote a: Normal
Mean betaFootnote b: 7.86E-04
SE betaFootnote c: 3.86E-04
Pollutant: Ozone (May–Sept.)
Endpoint: Asthma symptom days
Source(s): Mortimer et al. (2002) Schildcrout et al. (2006)
DetailsFootnote a: Numerous panel studies have been conducted on the association between ozone and asthma exacerbations in children. Several of these were carried out in summer camps, which may not reflect typical exposure conditions, in that campers would be expected to spend more time outdoors compared with non-campers. Others have been conducted in locations such as Mexico City and Los Angeles, which experience very high ozone concentrations not representative of conditions in Canada. We therefore selected two large multicentre North American panel studies as the source of the CRF. Mortimer et al. (2002) analyzed data collected in summer 1993 for 846 inner-city children aged 4–9 years from eight American cities. The average 8 h maximum ozone concentration among all cities was 48 ppb. The odds ratio for morning asthma symptoms was 1.16 (95% CI 1.02–1.30) in relation to a 15 ppb increment in average of lag 1–5 day ozone. This was reduced to 1.07 (0.92–1.26) in a joint model with NO2 in seven cities and to 1.04 (0.70–1.55) in a joint model with PM10 based on three cities (table 5). Schildcrout et al. (2006) analyzed data collected from 1993 to 1995 for 990 children aged 5–13 years, also from eight cities and including Toronto, and only with Baltimore in common with the Mortimer et al. (2002) analysis. Median 1 h maximum ozone concentrations ranged from 43 to 65.8 ppb. The odds ratio for asthma symptoms was 1.06 (95% CI 0.92–1.23) in relation to a 30 ppb increment in lag 0 ozone (the largest effect among lags considered; figure 1). Joint models with other pollutants were not run. The log odds ratio from Mortimer et al. (2002) based on the 8 h maximum (joint model with NO2) was multiplied by 1.13 (the ratio of 1 h maximum to 8 h maximum in Canadian cities) and pooled with the Schildcrout et al. (2006) result to obtain an odds ratio of 1.05 (95% CI 0.96–1.14) per 20 ppb. The same baseline frequency of asthma symptoms and prevalence of current wheeze as for PM2.5 was applied to 14.3% of children aged 5–19 years.
Averaging period: 1h
Regression type: Log(RR) or Log(OR)
FormFootnote a: Normal
Mean betaFootnote b: 2.38E-03
SE betaFootnote c: 2.19E-04
Pollutant: Ozone (May–Sept.)
Endpoint: Minor restricted activity days
Source(s): Ostro and Rothschild (1989)
DetailsFootnote a: Ostro and Rothschild (1989) reported an association between ozone and minor reduced activity days based on an analysis of data from the US Health Interview Survey. They reported results by year for 1976–1981 based on a Poisson regression model including both ozone and PM2.5 (table 5, column 2). Coefficients were pooled using a random effect model; a pooled estimate of 0.000530 (SE 0.00291) per 1 ppb daily 1 h maximum ozone was obtained. The baseline daily rate of minor reduced activity days per person was 7.8/365 = 0.0214. The AQBAT CRF is applied to adults and nonasthmatic (85.7%) children aged 5–19 years.
Averaging period: 1h
Regression type: Log(RR) or Log(OR)
FormFootnote a: Normal
Mean betaFootnote b: 5.30E-04
SE betaFootnote c: 2.91E-03
Pollutant: Ozone (May–Sept.)
Endpoint: Respiratory emergency room visits
Source(s): Burnett et al. (1997) Stieb et al. (2000)
DetailsFootnote a: Substantially more data are available pertaining to air pollution and hospital admissions in Canada relative to emergency department visits. We therefore elected to represent the effects of air pollution on respiratory emergency department visits using the results for hospital admissions scaled up in number based on the relative frequency of hospital admissions and emergency visits for these conditions. Thus, the coefficient per unit air pollution was the same as for hospital admissions based on Burnett et al. (1997), i.e. 0.000791 (SE 0.000355) per 1 ppb. The baseline rate of emergency visits is equal to the baseline rate of hospital admissions divided by 0.198, the proportion of visits resulting in hospital admission as reported by Stieb et al. (2000). The AQBAT CRF is applied to all members of all age groups.
Averaging period: 1h
Regression type: Log(RR) or Log(OR)
FormFootnote a: Normal
Mean betaFootnote b: 7.91E-04
SE betaFootnote c: 3.55E-04
Pollutant: Ozone (May–Sept.)
Endpoint: Respiratory hospital admissions
Source(s): Burnett et al. (1997)
DetailsFootnote a: Burnett et al. (1997) reported the results of a study on ozone and respiratory hospital admissions in 16 Canadian cities. Based on results from a Poisson regression model, which simultaneously adjusted for dew point temperature, CO and CoH, they reported a relative risk of 1.024 (p = 0.0258) per 30 ppb daily 1 h maximum ozone. Taking the natural logarithm of the relative risk and dividing by 30 yields a coefficient of 0.000791 (SE 0.000355) per 1 ppb. The AQBAT CRF is applied to all members of all age groups.
Averaging period: 1h
Regression type: Log(RR) or Log(OR)
FormFootnote a: Normal
Mean betaFootnote b: 7.91E-04
SE betaFootnote c: 3.55E-04
Pollutant: PM2.5
Endpoint: Acute respiratory symptom days
Source(s): Krupnick et al. (1990)
DetailsFootnote a: The authors reported on the association between CoH and the occurrence of acute respiratory symptoms in a panel of California families. They employed a Markov model that accounted for the occurrence of symptoms on the previous day and adjusted for ozone, NO2 and SO2 as co-pollutants. The incremental change in frequency of symptoms was calculated by substituting the coefficient from table VI, column 3, multiplied by 0.211 to convert from CoH to PM2.5, together with the transitional probabilities, p1 = 0.775 and p2 = 0.0468 (provided by the authors), into equation 3 on page 12 of the paper. The conversion from CoH to PM2.5 was calculated by dividing the ratio of CoH to TSP (0.116) provided by the authors by the ratio of PM10 to TSP (0.55) provided by Environment Canada. This assumes that the toxicity of PM2.5 per 1 µg/m3 is the same as that of PM10. The baseline frequency of symptoms was calculated by substituting p1 and p0 into equation 2. Thus, the proportional change per 1 µg/m3 PM2.5 is the output from equation 3 divided by that of equation 2, 0.00266 (SE 0.00139). The AQBAT CRF is applied to adults and nonasthmatic (85.7%) children aged 5–19 years.
Averaging period: 24h
Regression type: Linear
FormFootnote a: Normal
Mean betaFootnote b: 2.66E-03
SE betaFootnote c: 1.39E-03
Pollutant: PM2.5
Endpoint: Adult chronic bronchitis cases
Source(s): Abbey et al. (1995)
DetailsFootnote a: Abbey et al. (1995) reported the results of a cohort study of air pollution and the development of chronic lung disease among non-smoking Seventh Day Adventists living in California. Based on a logistic regression model, which also included personal characteristics, they reported an odds ratio of 1.81 (95% CI 0.98–3.25) for the development of chronic bronchitis per 45 µg/m3 PM2.5 (table 2, row 2). Taking the natural log of the odds ratio and dividing by 45 yields a coefficient of 0.0132 (SE 0.006 80) per 1 µg/m3 PM2.5. They reported that the 10-year incidence of chronic bronchitis was 6.26% (117 new cases occurred among 1868 subjects for whom PM2.5 exposures could be estimated). We calculate the annual incidence, p1, from the expression: 0.0626 = 1 − (1 − p1)10, so that p1 = 0.006 44. The AQBAT CRF is applied to the Canadian population ≥ 25 years of age.
Averaging period: 24h
Regression type: Log(RR) or Log(OR)
FormFootnote a: Normal
Mean betaFootnote b: 1.32E-02
SE betaFootnote c: 6.80E-03
Pollutant: PM2.5
Endpoint: Asthma symptom days
Source(s): Weinmayr et al. (2010) Ward and Ayres (2004) Dell et al. (2010)
DetailsFootnote a: These parameters are derived using the same approach as described in the Health Risk of Air Pollution in Europe project of the WHO European Centre for Environment and Health. Weinmayr et al. (2010) conducted a systematic review and meta-analysis based on 36 studies of the association between air pollution and asthma symptoms in children. The pooled odds ratio was 1.028 (95% CI 1.006–1.051) per 10 µg/m3 PM10 (table 2) based on a random effect model including all studies. This is based on single pollutant models, as results from multi-pollutant models were not consistently available. However, the derived effect size is nonetheless much smaller than that observed in a multi-pollutant model for North American cities in Mortimer et al. (2002). In order to derive an odds ratio for PM2.5, we multiplied the log odds ratio for PM10 by 2.37, which is the average of the ratio of log pooled odds ratios for PM2.5 vs. PM10 for cough and other respiratory symptoms reported by Ward and Ayres (2004; tables 4 and 5) in their earlier meta-analysis. The result is an odds ratio for PM2.5 of 1.07 (95% CI 1.01–1.12). The baseline daily frequency of asthma symptoms in asthmatic children varies widely in panel studies. We have conservatively estimated it at 20%. The population to which this is applicable is based on the prevalence of current wheeze in Canada from the National Longitudinal Survey of Children and Youth (14.3%; Dell et al. 2010). This is applied to asthmatic children (14.3%) aged 5–19 years.
Averaging period: 24h
Regression type: Log(RR) or Log(OR)
FormFootnote a: Normal
Mean betaFootnote b: 6.545E-03
SE betaFootnote c: 2.646E-03
Pollutant: PM2.5
Endpoint: Cardiac emergency room visits
Source(s): Burnett et al. (1995) Stieb et al. (2000)
DetailsFootnote a: Substantially more data are available pertaining to air pollution and hospital admissions in Canada relative to emergency department visits. We therefore elected to represent the effects of air pollution on cardiac emergency department visits using the results for hospital admissions scaled up in number based on the relative frequency of hospital admissions and emergency visits for these conditions. Thus, the change in frequency per unit air pollution was the same as for hospital admissions based on Burnett et al. (1995) – i.e. 0.0711% (SE 0.0170) increase per 1 µg/m3. The baseline rate of emergency visits is equal to the baseline rate of hospital admissions divided by 0.760, the proportion of visits resulting in hospital admission as reported by Stieb et al. (2000). The AQBAT CRF is applied to all members of all age groups.
Averaging period: 24h
Regression type: Linear
FormFootnote a: Normal
Mean betaFootnote b: 7.11E-04
SE betaFootnote c: 1.70E-04
Pollutant: PM2.5
Endpoint: Cardiac hospital admissions
Source(s): Burnett et al. (1995)
DetailsFootnote a: Burnett et al. (1995) reported a 3.3% (95% CI 1.7–4.8) increase in cardiac hospital admissions per 13 µg/m3 sulphate based on a linear regression model that also included ozone and temperature (table 6, row 2). Multiplying by the average ratio of sulphate to PM2.5 of 0.28 (Environment Canada), this equates to a 0.0711% (SE 0.0170) increase per 1 µg/m3 PM2.5. The AQBAT CRF is applied to all members of all age groups.
Averaging period: 24h
Regression type: Linear
FormFootnote a: Normal
Mean betaFootnote b: 7.11E-04
SE betaFootnote c: 1.70E-04
Pollutant: PM2.5
Endpoint: Child acute bronchitis episodes
Source(s): Hoek et al. (2012) Dockery et al. (1996)
DetailsFootnote a: These parameters are derived using the same approach as described in the Health Risk of Air Pollution in Europe project of the WHO European Centre for Environment and Health. Hoek et al. (2012) conducted a meta-analysis of eight cross-sectional studies from Europe and North America, including the 24 cities study, which included data from several Canadian communities. The random effect pooled estimate of the odds ratio was 1.08 (95% CI 0.98–1.19) per 10 µg/m3 PM10 (table 4), adjusted for age, sex, maternal education, paternal education, household crowding, current parental smoking, mother smoking during pregnancy, gas cooking, unvented gas/oil/kerosene heater, mould, nationality, birth order and “ever had a pet.” The effect size was reduced based on joint models with SO2, but this was based on only three studies (table 5). The average prevalence of bronchitis among the studies was 18.6% (table 2). In the 24 cities study, the odds ratio for bronchitis for PM2.5 was identical to that for PM10 across the exposure difference between highest- and lowest-exposure communities, 17.3 and 14.9 µg/m3 for PM10 and PM2.5, respectively (tables 1 and 5). We therefore multiply the log of the pooled odds ratios for PM10 by this ratio (1.16) in order to derive a log odds ratio per 10 µg/m3 PM2.5, resulting in an odds ratio of 1.09 (95% CI 0.98–1.22). This is applied to the population of children 5–19 years of age.
Averaging period: 24h
Regression type: Log(RR) or Log(OR)
FormFootnote a: Normal
Mean betaFootnote b: 8.927E-03
SE betaFootnote c: 5.745E-03
Pollutant: PM2.5
Endpoint: Chronic obstructive pulmonary disease mortality
Source(s): H. Shin, personal communication, Health Canada, 2013
DetailsFootnote a: Parameters were derived from a meta-analysis of cohort studies of air pollution and cause-specific mortality. The central estimate was set at the result of the American Cancer Society cohort study, and the CIs were based on a gamma distribution reflecting the distribution of results from other studies. The values specified here for beta and SE are actually the alpha and beta parameters of the gamma distribution. The AQBAT CRFs are applied to all Canadians ≥ 25 years of age.
Averaging period: 24h
Regression type: Log(RR) or Log(OR)
FormFootnote a: Gamma
Mean betaFootnote b: 1.457E+01
SE betaFootnote c: 6.010E-04
Pollutant: PM2.5
Endpoint: Chronic exposure cerebrovascular mortality
Source(s): H. Shin, personal communication, Health Canada, 2013
DetailsFootnote a: Parameters were derived from a meta-analysis of cohort studies of air pollution and cause-specific mortality. The central estimate was set at the result of the American Cancer Society cohort study, and the CIs were based on a gamma distribution reflecting the distribution of results from other studies. The values specified here for beta and SE are actually the alpha and beta parameters of the gamma distribution. The AQBAT CRFs are applied to all Canadians ≥ 25 years of age.
Averaging period: 24h
Regression type: Log(RR) or Log(OR)
FormFootnote a: Gamma
Mean betaFootnote b: 4.884E+0
SE betaFootnote c: 3.375E-03
Pollutant: PM2.5
Endpoint: Chronic exposure ischemic heart disease mortality
Source(s): H. Shin, personal communication, Health Canada, 2013
DetailsFootnote a: Parameters were derived from a meta-analysis of cohort studies of air pollution and cause-specific mortality. The central estimate was set at the result of the American Cancer Society cohort study, and the CIs were based on a gamma distribution reflecting the distribution of results from other studies. The values specified here for beta and SE are actually the alpha and beta parameters of the gamma distribution. The AQBAT CRFs are applied to all Canadians ≥ 25 years of age.
Averaging period: 24h
Regression type: Log(RR) or Log(OR)
FormFootnote a: Gamma
Mean betaFootnote b: 1.156E+0
SE betaFootnote c: 2.117E-03
Pollutant: PM2.5
Endpoint: Chronic exposure lung cancer mortality
Source(s): H. Shin, personal communication, Health Canada, 2013
DetailsFootnote a: Parameters were derived from a meta-analysis of cohort studies of air pollution and cause-specific mortality. The central estimate was set at the result of the American Cancer Society cohort study, and the CIs were based on a gamma distribution reflecting the distribution of results from other studies. The values specified here for beta and SE are actually the alpha and beta parameters of the gamma distribution. The AQBAT CRFs are applied to all Canadians ≥ 25 years of age.
Averaging period: 24h
Regression type: Log(RR) or Log(OR)
FormFootnote a: Gamma
Mean betaFootnote b: 4.930E+0
SE betaFootnote c: 3.168E-03
Pollutant: PM2.5
Endpoint: Chronic exposure internal cause mortality
Source(s): Crouse et al. 2012
DetailsFootnote a: Crouse et al. (2012) examined the association between PM2.5 derived from satellite observations and mortality during ten years of follow-up of a cohort of 2.1 million Canadian adults (≥ 25 years of age) based on the 1991 long form census. Using a spatial random-effects Cox model including individual and ecological covariates and an urban/rural indicator, and accounting for spatial autocorrelation among cohort members, they reported a hazard ratio of 1.10 (95% CI 1.05-1.15) per 10 µg/m3 PM2.5. This translates to a β of 0.00953 with standard error 0.00232. [note: choose either 4 specific causes or internal causes, not both].
Averaging period: 24h
Regression type: Log(RR) or Log(OR)
FormFootnote a: Normal
Mean betaFootnote b: 9.53E-3
SE betaFootnote c: 2.32E-03
Pollutant: PM2.5
Endpoint: Chronic exposure internal cause mortality
Source(s): Burnett et al. 2018
DetailsFootnote a: Burnett et al. modelled the association between PM2.5 and mortality in 41 cohorts from 16 countries. Data were analyzed using log linear models employing transformations, T(z), of concentration, which permit a variety of shapes (linear, log linear, supralinear, sublinear, S-shaped) of the concentration response function. The model form is R (z) = exp{θT(z)}, whereT(z) = log(1 + z/α)ω(z). ω(z) = 1/(1 + exp{−(z − µ)/(τr)}) is a logistic weighting function of z, µ and τ where r represents the range in the pollutant concentrations, τ controls the curvature and µ controls the shape of the concentration response. The CRF is applied to all Canadians ≥ 25 years of age. [note: choose either 4 specific causes or internal causes, not both]
Averaging period: 24h
Regression type: Burnett nonlinear
FormFootnote a: Normal
Mean betaFootnote b: Θ =0.143
SE betaFootnote c: SE(θ) = 0.01807
Addtional parameters:
- α = 1.6
- μ = 15.5
- τ * r = 36.8
- threshold concentration = 2.4
Pollutant: PM2.5
Endpoint: Respiratory emergency room visits
Source(s): Burnett et al. (1995) Stieb et al. (2000)
DetailsFootnote a: Substantially more data are available pertaining to air pollution and hospital admissions in Canada relative to emergency department visits. We therefore elected to represent the effects of air pollution on respiratory emergency department visits using the results for respiratory hospital admissions scaled up in number based on the relative frequency of hospital admissions and emergency visits for these conditions. Thus, the change in frequency per unit air pollution was the same as for hospital admissions based on Burnett et al. (1995) – i.e. 0.0754% (SE 0.0132) increase per 1 µg/m3. The baseline rate of respiratory emergency visits is equal to the baseline rate of hospital admissions divided by 0.198, the proportion of visits resulting in hospital admission as reported by Stieb et al. (2000). The AQBAT CRF is applied to all members of all age groups.
Averaging period: 24h
Regression type: Linear
FormFootnote a: Normal
Mean betaFootnote b: 7.54E-04
SE betaFootnote c: 1.32E-04
Pollutant: PM2.5
Endpoint: Respiratory hospital admissions
Source(s): Burnett et al. (1995)
DetailsFootnote a: Burnett et al. (1995) reported a 3.5% (95% CI 2.3–4.7) increase in respiratory hospital admissions per 13 µg/m3 sulphate based on a linear regression model that also included ozone and temperature (table 5, row 2). Multiplying by the average ratio of sulphate to PM2.5 of 0.28 (Environment Canada), this equates to a 0.0754% (SE 0.0132) increase per 1 µg/m3 PM2.5. The AQBAT CRF is applied to all members of all age groups.
Averaging period: 24h
Regression type: Linear
FormFootnote a: Normal
Mean betaFootnote b: 7.54E-04
SE betaFootnote c: 1.32E-04
Pollutant: PM2.5
Endpoint: Restricted activity days
Source(s): Ostro (1987) Ostro and Rothschild (1989) Chestnut et al. (1999)
DetailsFootnote a: Ostro (1987) reported an association between PM2.5 and reduced activity days based on an analysis of data from the US Health Interview Survey. They reported results by year for 1976–1981 based on a Poisson regression model (table IIII, column 2). We pooled these coefficients using a random effect model and obtained a pooled estimate of 0.00481 (SE 0.00101) per 1 µg/m3 PM2.5. The baseline daily rate of reduced activity days per person was 0.052 (Chestnut et al. 1999). Ostro and Rothschild (1989) also reported an analysis of PM2.5 and respiratory reduced activity days, in which they adjusted for the simultaneous effects of ozone. The effects of PM2.5 were unaffected by this adjustment; thus, we opted to use the results from their earlier analysis on the grounds that reduced activity days are a more global outcome than the more narrowly defined respiratory reduced activity days. The AQBAT CRF is applied to adults and nonasthmatic (85.7%) children aged 5–19 years.
Averaging period: 24h
Regression type: Log(RR) or Log(OR)
FormFootnote a: Normal
Mean betaFootnote b: 4.81E-03
SE betaFootnote c: 1.01E-03
References
Abbey DE, Lebowitz MD, Mills PK, Petersen FF, Beeson WL, Burchette RJ. 1995. Long term ambient concentrations of particulates and oxidants and development of chronic disease in a cohort of nonsmoking California residents. Inhal Toxicol 7: 19–34.
Burnett RT, Dales R, Krewski D, Vincent R, Dann T, Brook JR. 1995. Associations between ambient particulate sulphate and admissions to Ontario hospitals for cardiac and respiratory diseases. Am J Epidemiol 142(1): 15–22.
Burnett RT, Brook JR, Yung WT, Dales RE, Krewski D. 1997. Association between ozone and hospitalization for respiratory diseases in 16 Canadian cities. Environ Res 72: 24–31.
Burnett RT, Stieb D, Brook JR, Cakmak S, Dales R, Raizenne M, Vincent R, Dann T. 2004. Associations between short-term changes in nitrogen dioxide and mortality in Canadian cities. Arch Environ Health 59(5): 228–236.
Burnett R, Chen H, Szyszkowicz M et al. 2018. Global estimates of mortality associated with long-term exposure to outdoor fine particulate matter. Proceedings of the National Academy of Sciences 115 (38): 9592–9597.
Chestnut LG, Mills D, Ragland S, Rowe RD. 1999. Air Quality Valuation Model (AQVM 3.0) report 2: Methodology. Final report prepared for Environment Canada and Health Canada by Stratus Consulting Inc.
Crouse DL, Peters PA, van Donkelaar A, Goldberg MS, Villeneuve PJ, Brion O, Khan S, Atari DO, Jerrett M, Pope CA, Brauer M, Brook JR, Martin RV, Stieb D, Burnett RT. 2012. Risk of nonaccidental and cardiovascular mortality in relation to long-term exposure to low concentrations of fine particulate matter: a Canadian national-level cohort study. Environ Health Perspect 120(5): 708–714.
Dell SD, Foty RG, Gilbert NL, Jerret M, To T, Walter SD, Stieb DM. 2010. Asthma and allergic disease prevalence in a diverse sample of Toronto school children: results from the Toronto Child Health Evaluation Questionnaire (T-CHEQ) Study. Can Respir J 17(1): e1–6.
Dockery DW, Cunningham J, Damokosh AI, Neas LM, Spengler JD, Koutrakis P, Ware JH, Raizenne M, Speitzer FE. 1996. Health effects of acid aerosols on North American children: respiratory symptoms. Environ Health Perspect 104: 500–505.
Hoek G, Pattenden S, Willers S, Antova T, Fabianova E, Braun-Fahrländer C, Forastiere F, Gehring U, Luttmann-Gibson H, Grize L, Heinrich J, Houthuijs D, Janssen N, Katsnelson B, Kosheleva A, Moshammer H, Neuberger M, Privalova L, Rudnai P, Speizer F, Slachtova H, Tomaskova H, Zlotkowska R, Fletcher T. 2012. PM10, and children’s respiratory symptoms and lung function in the PATY study. Eur Respir J 40(3): 538–547.
Jerrett M, Burnett RT, Pope CA III, Ito K, Thurston G, Krewski D, Shi Y, Calle E, Thun M. 2009. Long-term ozone exposure and mortality. N Engl J Med 360(11): 1085–1095.
Krupnick AJ, Harrington W, Ostro B. 1990. Ambient ozone and acute health effects: evidence from daily data. J Environ Econ Manage 18(1): 1–18.
Mortimer KM, Neas LM, Dockery DW, Redline S, Tager IB. 2002. The effect of air pollution on inner-city children with asthma. Eur Respir J 19(4): 699–705.
Ostro BD. 1987. Air pollution and morbidity revisited: a specification test. J Environ Econ Manage 14: 87–98.
Ostro BD, Rothschild S. 1989. Air pollution and acute respiratory morbidity: an observational study of multiple pollutants. Environ Res 50: 238–247.
Schildcrout JS, Sheppard L, Lumley T, Slaughter JC, Koenig JQ, Shapiro GG. 2006. Ambient air pollution and asthma exacerbations in children: an eight-city analysis. Am J Epidemiol 164(6): 505–517.
Shin HH, Cohen A, Pope CA III, Ezzati M, Lim SS, Hubbell B, Burnett RT. 2013. Critical issues in combining disparate sources of information to estimate the global burden of disease attributable to ambient fine particulate matter exposure. Presented at Methods for Research Synthesis: A Cross-Disciplinary Workshop, October 2, 2013, Harvard Center for Risk Analysis, Cambridge, MA. 24 pp.
Stieb DM, Beveridge RC, Brook JR, Smith-Doiron M, Burnett RT, Dales RE, Beaulieu S, Judek S, Mamedov A. 2000. Air pollution, aeroallergens and cardiorespiratory emergency department visits in Saint John, Canada. J Expo Anal Environ Epidemiol 10(5): 461–477.
Ward DJ, Ayres JG. 2004. Particulate air pollution and panel studies in children: a systematic review. Occup Environ Med 61(4): e13 (doi:10.1136/oem.2003.007088).
Weinmayr G, Romeo E, De Sario M, Weiland SK, Forastiere F. 2010. Short-term effects of PM10 and NO2 on respiratory health among children with asthma or asthma-like symptoms: a systematic review and meta-analysis. Environ Health Perspect 118(4): 449–457.
Appendix C. Baseline incidence rates for key health endpoints by geographic area, in annual events per million population – 2011 estimates included in AQBAT version 3.0
| Endpoint Population age group |
Acute exposure mortalityFootnote a All |
Acute respiratory symptom days NA 5–19; adults |
Asthma symptom days Asthmatic 5–19 |
Cardiac emergency room visits All |
Child acute bronchitis episodes 5–19 |
Chronic exposure mortalityFootnote b 25+ |
Chronic exposure respiratory mortalityFootnote c 30+ |
Minor restricted activity days NA 5–19; adults |
Respiratory emergency room visits All |
Restricted activity days NA 5–19; adults |
|---|---|---|---|---|---|---|---|---|---|---|
| Canada | 6,730 | 64,000,000 | 73,000,000 | 9,250 | 186,000 | 9,450 | 1,010 | 8,000,000 | 24,500 | 19,000,000 |
| Newfoundland and Labrador | 8,330 | 64,000,000 | 73,000,000 | 12,000 | 186,000 | 11,200 | 1,090 | 8,000,000 | 30,500 | 19,000,000 |
| Prince Edward Island | 7,960 | 64,000,000 | 73,000,000 | 13,600 | 186,000 | 11,200 | 1,420 | 8,000,000 | 37,100 | 19,000,000 |
| Nova Scotia | 8,390 | 64,000,000 | 73,000,000 | 11,400 | 186,000 | 11,500 | 1,350 | 8,000,000 | 26,800 | 19,000,000 |
| New Brunswick | 7,960 | 64,000,000 | 73,000,000 | 14,600 | 186,000 | 10,900 | 1,140 | 8,000,000 | 35,700 | 19,000,000 |
| Quebec | 7,210 | 64,000,000 | 73,000,000 | 10,500 | 186,000 | 9,830 | 1,100 | 8,000,000 | 29,600 | 19,000,000 |
| Ontario | 6,430 | 64,000,000 | 73,000,000 | 8,790 | 186,000 | 9,120 | 915 | 8,000,000 | 20,600 | 19,000,000 |
| Manitoba | 7,610 | 64,000,000 | 73,000,000 | 9,450 | 186,000 | 11,200 | 1,130 | 8,000,000 | 25,800 | 19,000,000 |
| Saskatchewan | 8,010 | 64,000,000 | 73,000,000 | 11,100 | 186,000 | 11,800 | 1,280 | 8,000,000 | 39,600 | 19,000,000 |
| Alberta | 5,340 | 64,000,000 | 73,000,000 | 6,740 | 186,000 | 7,740 | 891 | 8,000,000 | 21,900 | 19,000,000 |
| British Columbia | 6,710 | 64,000,000 | 73,000,000 | 8,360 | 186,000 | 9,250 | 994 | 8,000,000 | 21,400 | 19,000,000 |
| Yukon | 5,110 | 64,000,000 | 73,000,000 | 9,140 | 186,000 | 7,180 | 752 | 8,000,000 | 25,500 | 19,000,000 |
| Northwest Territories | 3,850 | 64,000,000 | 73,000,000 | 7,430 | 186,000 | 5,950 | 794 | 8,000,000 | 40,600 | 19,000,000 |
| Nunavut | 3,580 | 64,000,000 | 73,000,000 | 3,660 | 186,000 | 6,210 | 1,190 | 8,000,000 | 63,900 | 19,000,000 |
NA: nonasthmatic
Footnotes
|
||||||||||
Notes for interpreting the values: Baseline rates can vary among provinces or territories or a single value may apply to all Canadians (where more geographically precise values are unavailable). Values exceeding 1 million indicate that the number of incidences for each individual is greater than 1. For example, each asthmatic child aged 5–19 is associated, on average, with 73 asthma symptom days per year. Thus, the annual baseline rate per 1 million individuals for the target population is 73 million asthma days.
Appendix D. Additional air pollution and health impact estimates
| Province - CD name (identifier) | Population | Deaths per 100,000 |
|---|---|---|
| ON - Toronto (CD3520) | 2,865,131 | 48 |
| BC - Greater Vancouver (CD5915) | 2,504,989 | 34 |
| QC - Montréal (CD2466) | 2,020,217 | 59 |
| AB - Division No. 6 (CD4806) | 1,577,299 | 26 |
| ON - Peel (CD3521) | 1,456,494 | 32 |
| AB - Division No. 11 (CD4811) | 1,434,083 | 40 |
| ON - York (CD3519) | 1,154,377 | 31 |
| ON - Ottawa (CD3506) | 969,510 | 32 |
| MB - Division No. 11 (CD4611) | 729,641 | 41 |
| ON - Durham (CD3518) | 669,507 | 44 |
| QC - Québec (CD2423) | 587,028 | 60 |
| ON - Halton (CD3524) | 566,264 | 44 |
| ON - Hamilton (CD3525) | 564,030 | 67 |
| ON - Waterloo (CD3530) | 549,606 | 45 |
| AB: Alberta; BC: British Columbia; MB: Manitoba; ON: Ontario; QC: Quebec | ||
| Province - CD name (identifier) | Population | Deaths per 100,000 |
|---|---|---|
| BC - Okanagan-Similkameen (CD5907) | 81,347 | 104 |
| ON - Chatham-Kent (CD3536) | 107,275 | 89 |
| ON - Lambton (CD3538) | 131,434 | 87 |
| ON - Niagara (CD3526) | 455,683 | 80 |
| ON - Prince Edward (CD3513) | 25,672 | 78 |
| ON - Haldimand-Norfolk (CD3528) | 113,312 | 74 |
| ON - Essex (CD3537) | 409,070 | 73 |
| BC - Kootenay Boundary (CD5905) | 30,466 | 73 |
| ON - Northumberland (CD3514) | 87,550 | 71 |
| BC - Central Kootenay (CD5903) | 59,462 | 70 |
| ON - Elgin (CD3534) | 91,940 | 69 |
| ON - Brant (CD3529) | 146,231 | 68 |
| QC - Pierre-De Saurel (CD2453) | 51,706 | 68 |
| BC - North Okanagan (CD5937) | 85,110 | 67 |
| BC - Central Okanagan (CD5935) | 197,703 | 67 |
| BC: British Columbia; ON: Ontario; QC: Quebec | ||
| Province - CD name (identifier) | Population | Deaths per 100,000 |
|---|---|---|
| NU - Kitikmeot (CD6208) | 6,728 | 1 |
| NT - Region 1 (CD6101) | 7,041 | 1 |
| NU - Keewatin (CD6205) | 10,883 | 2 |
| NU - Baffin (CD6204) | 19,771 | 2 |
| NL - Division No. 11 (CD1011) | 2,637 | 3 |
| QC - Nord-du-Québec (CD2499) | 45,162 | 3 |
| NT - Region 6 (CD6106) | 21,438 | 3 |
| NL - Division No. 10 (CD1010) | 24,608 | 4 |
| BC - Skeena-Queen Charlotte (CD5947) | 18,317 | 4 |
| MB - Division No. 23 (CD4623) | 9,599 | 4 |
| BC - Central Coast (CD5945) | 3,234 | 4 |
| MB - Division No. 22 (CD4622) | 44,528 | 4 |
| QC - Minganie–Le Golfe-du-Saint-Laurent (CD2498) | 11,607 | 6 |
| BC - Mount Waddington (CD5943) | 11,280 | 7 |
| MB - Division No. 19 (CD4619) | 18,569 | 8 |
| BC - Northern Rockies (CD5959) | 5,796 | 8 |
| NT - Region 2 (CD6102) | 2,455 | 10 |
| BC: British Columbia; MB: Manitoba; NL: Newfoundland and Labrador; NT: Northwest Territories; NU: Nunavut; ON: Ontario; QC: Quebec | ||

Figure D1 Description
Source: Health impacts of air pollution in Canada: estimates of morbidity and premature mortality outcomes, 2019 report, Health Canada.
The map of Canada shows the population-weighted daily fine particulate matter concentrations in ambient air across Canadian census divisions. The concentrations are three-year averages for the 2014–2016 period. Census divisions are categorized by the concentration of fine particulate matter by micrograms per cubic metre. Concentrations of 1 to 3 micrograms are found in Newfoundland, northern Quebec, Nunavut, the northern region of the northwest territories, and the Yukon. 3 to 4 micrograms are found in New Brunswick, Nova Scotia, PEI, southern Quebec, Ontario, Manitoba, southern British Columbia, Nunavut, and the southern regions of the northwest territories. Concentrations of 4 to 5 micrograms can be found in southern Quebec, Ontario, Alberta, and Manitoba, as well as Saskatchewan and British Columbia. Concentrations of 5 to 7 micrograms are present in southern Ontario, Saskatchewan, Alberta, British Columbia, and the Northwest territories. Concentrations of 7 to 10 micrograms are present in northern Alberta.

Figure D2 Description
Source: Health impacts of air pollution in Canada: estimates of morbidity and premature mortality outcomes, 2019 report, Health Canada.
The map of Canada shows the population-weighted daily nitrogen dioxide concentrations in ambient air across Canadian census divisions. The concentrations are three-year averages for the 2014–2016 period. Census divisions are categorized by the concentration of nitrogen dioxide in parts per billion. Concentrations of less than 1 part per billion are found in Newfoundland, PEI, Nova Scotia, New Brunswick, Quebec, Manitoba, Nunavut, the Northwest territories, and the Yukon. Concentrations of 1 to 2 parts are found in southern Quebec, Ontario, northern Manitoba and Alberta, and the western region of British Columbia. Concentrations of 2 to 3 parts can be found in the southern regions of Quebec, Ontario, Manitoba and British Columbia, as well as in the northern region of Alberta. 3 to 5 parts per billion are present in southern Quebec, Alberta, and British Columbia. Concentrations of 5 to 10 parts are present in southern Alberta.

Figure D3 Description
Source: Health impacts of air pollution in Canada: estimates of morbidity and premature mortality outcomes, 2019 report, Health Canada.
The map of Canada shows the population-weighted summer ozone concentrations in ambient air across Canadian census divisions. The concentrations are two-year averages of the daily one-hour maximum for 2014 and 2015. Census divisions are categorized by the concentration of ozone in parts per billion. 25 to 30 parts can be found in the northern regions of Quebec, Ontario, Manitoba, Saskatchewan, and British Columbia, as well as in Nunavut, Yukon, and in the Northwest Territories. Concentrations of 30 to 35 parts per billion can be found in Newfoundland, the southern regions of Quebec, Ontario, Manitoba, and Saskatchewan, as well as the northern region of Alberta, and the eastern regions of British Columbia. Concentrations of 35 to 40 parts per billion in the southern regions of Nova Scotia, Quebec, Ontario, Manitoba, Saskatchewan, and British Columbia, as well in some northern regions of Alberta. 40 to 45 parts per billion can be found in the southern regions of Ontario, Saskatchewan, Alberta, and British Columbia. Concentrations of 45 parts per billion or more can be found in southern Ontario and Alberta.
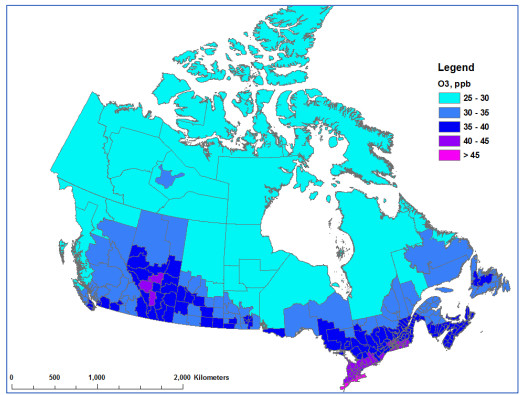
Figure D4 Description
Source: Health impacts of air pollution in Canada: estimates of morbidity and premature mortality outcomes, 2019 report, Health Canada.
The map of Canada shows the population-weighted annual ozone concentrations in ambient air across Canadian census divisions. The concentrations are two-year averages of the daily one-hour maximum for 2014 and 2015. Census divisions are categorized by the concentration of ozone in parts per billion. 25 to 30 parts can be found in the northern regions of Quebec, Ontario, Manitoba, Saskatchewan, and British Columbia, as well as in Nunavut, Yukon, and in the Northwest Territories. Concentrations of 30 to 35 parts per billion can be found in Newfoundland, the southern regions of Quebec, Ontario, Manitoba, British Columbia and Saskatchewan, as well as the northern region of Alberta. Concentrations of 35 to 40 parts per billion in Nova Scotia, the southern regions of New Brunswick, Quebec, Ontario, Manitoba, Saskatchewan, Alberta and British Columbia. 40 to 45 parts per billion can be found in the southern regions of Ontario and Alberta. Concentrations of 45 parts per billion or more can be found in southern Ontario.
Footnotes
- Footnote 1
-
The reference year for the health impact estimates is 2016 and corresponds with the population data considered for analysis.
- Footnote 2
-
All-cause nonaccidental mortality
- Footnote 3
-
The population reference year was 2011 for the Health Canada report published in 2017, 2015 for the report published in 2019, and 2016 for the current analysis.
- Footnote 4
-
It must be noted that multiple risk factors are involved in the development or worsening of adverse health effects. While air pollution can contribute to increased risk of population health impacts, this does not necessarily imply that air pollution is the sole cause. Exposure to air pollution is a contributing risk factor to the development of adverse health effects.
- Footnote 5
-
Institute for Health Metrics and Evaluation (IHME). GBD Country profiles – 2017. (accessed December 12, 2019) - http://www.healthdata.org/canada
- Footnote 6
-
Ibid.
- Footnote 7
-
Although some authors make a distinction between baseline (natural and long-range air pollution contributions) and background (natural contributions only) conditions (TFHTAP 2010), the term “background” is used herein to represent all contributions other than those from North American anthropogenic sources or large natural events such as forest fires. This is comparable to the term “North American Background” (formerly “policy relevant background”) used by the United States Environmental Protection Agency (CRS 2019).
- Footnote 8
-
Estimates of background concentrations are revisited periodically by Environment and Climate Change Canada scientists. An assessment conducted in 2018 determined that the original estimates provided by Judek et al. (2004) were still representative of Canadian background concentrations (Bob Vet, Environment and Climate Change Canada; personal communications).
- Footnote 9
-
Missing data are associated with a small number of census divisions in remote and low-population areas in the North.
- Footnote 10
-
[NASA] National Aeronautics and Space Administration. Aura Satellite - http://aura.gsfc.nasa.gov/
- Footnote 11
-
Guoliang Xu and Dave Stieb; personal communications, Health Canada, 2019
- Footnote 12
-
Nonaccidental causes of death are referred to as (all) internal causes of death in previous Health Canada publications on the health impacts of air pollution in Canada (2017, 2019).
- Footnote 13
-
The user has the option of using the “all-cause” nonaccidental mortality endpoint or the four individual causes.
- Footnote 14
-
The full list of baseline rates is provided with the AQBAT package or can be obtained upon request from Health Canada at hc.air.sc@canada.ca.
- Footnote 15
-
Empirical studies of willingness to pay (WTP) for mortality risk reductions provide estimates of the average monetary amounts that individuals are willing to pay for small reductions in premature mortality. The valuation context or individual circumstances influence WTP values; that is, they may vary for the same amount of risk reduction in different contexts and for different individuals. WTP reflects all the reasons individuals put a value on the reduction of their own risk of death. Therefore, it can exceed the value of the financial impact on an individual associated with the change in risk.
- Footnote 16
-
PM2.5: 2015–2017;ozone: 2014, 2015 and 2017; NO2: 2015–2017
- Footnote 17
-
Values for individual pollutants may not match total because of rounding.
- Footnote 18
-
Annual Economic Indicators, Global Affairs Canada, Government of Canada - https://www.international.gc.ca/economist-economiste/statistics-statistiques/annual_ec_indicators.aspx?lang=eng
- Footnote 19
-
WHO Global Urban Ambient Air Pollution Database, World Health Organization - http://www.who.int/phe/health_topics/outdoorair/databases/cities/en/
- Footnote 20
-
NO2 near-surface estimates were previously based on remote-sensing data from the Scanning Imaging Absorption Spectrometer for Atmospheric Chartography (SCIAMACHY) and Global Ozone Monitoring Experiment-2 (GOME-2) instruments as well as calculations by Geddes et al. (2016). The near-surface estimates were only available up to 2012 with this approach, and were substituted with 2015–2017 OMI vertical column density data.
- Footnote 21
-
It was observed that removing air monitor 100141 from the dataset reduced model error and increased R2 by 2.5%.
- Footnote 22
-
IHME. GBD Compare – 2016 (accessed June 23, 2020) - https://vizhub.healthdata.org/gbd-compare/
- Footnote 23
-
The 2016 OA data could not be used owing to multiple changes to the size and orientation of the GEM-MACH grid over a short period in 2016. The 10-km horizontal resolution of the grid remained unchanged, but the size of the grid varied from 347,116 grid cells (506 × 686) to 366,444 grid cells (522 × 702), and finally 487,176 grid cells (766 × 636). Moreover, the grid orientation was rotated during the last expansion and thus excluded colocalized grid cells among grid versions. Since annual or seasonal metrics for ozone require the interpolation of all data on the same grid, these changes influenced the results, and introduced error and uncertainty in the ozone concentration estimates.
- Footnote 24
-
Values in Table A3 and Figure A6 were obtained from different datasets; slight discrepancies are possible. For example, differences may vary based on rounding and sector combination.
- Footnote Appendix B - a
-
Distribution forms: Normal, Gamma, Discrete, and Triangular
- Footnote Appendix B - b
-
Mean beta: mean of the pollutant coefficient (regression parameter)
- Footnote Appendix B - c
-
SE beta: standard error of the pollutant coefficient
- Footnote Appendix B - d
-
Coefficient of haze is a measure of the atmospheric impedance of light caused by suspended atmospheric particles or aerosols.
Page details
- Date modified: