
Public Health Agency of Canada Quarterly Financial Report – For the quarter ended December 31, 2014
- Introduction
- Highlights of Fiscal Quarter and Fiscal Year-to-Date (YTD) Results
- Risks and Uncertainties
- Significant Changes in Relation to Operations, Personnel and Programs
- Budget 2012 Implementation
- Statement of Authorities (unaudited)
- Departmental budgetary expenditures by Standard Object (unaudited)
1. Introduction
This quarterly financial report has been prepared by management as required by section 65.1 of the Financial Administration Act and in the form and manner prescribed by the Treasury Board (TB), and should be read in conjunction with the Main Estimates and Supplementary Estimates A & B as well as Canada’s Economic Action Plan 2012 (Budget 2012). This quarterly report has not been subject to an external audit or review.
1.1 Public Health Agency of Canada's Program Activities
In September 2004, the Public Health Agency of Canada (the Agency) was created within the federal Health Portfolio to deliver on the Government of Canada's commitment to increase its focus on public health in order to help protect and improve the health and safety of all Canadians and to contribute to strengthening the health care system.
The Agency has the responsibility to: contribute to the prevention of disease and injury, and to the promotion of health; enhance the quality and quantity of surveillance data and expand the knowledge of disease and injury in Canada; provide federal leadership and accountability in managing public health emergencies; serve as a central point for sharing Canada's expertise with the rest of the world and for applying international research and development to Canada's public health programs; and strengthen intergovernmental collaboration on public health and facilitate national approaches to public health policy and planning.
The Agency aims to achieve a strategic outcome of protecting Canadians and empowering them to improve their health as supported through its program activities of: Public Health Infrastructure, Health Promotion and Disease Prevention, Health Security, and Internal Services.
Informed by the Government of Canada priorities, the Agency's domestic and global operating environment, human and financial resource capacity, and existing or emerging corporate risks, the Agency established the following priorities for 2014–2015:
- strengthened public health capacity and science leadership;
- leadership on health promotion and disease prevention;
- enhanced public health security; and
- excellence and innovation in management.
Further details on the Agency’s authority, mandate and program activities may be found at the following links: 2014-2015 Report on Plans and Priorities and 2014-2015 Parts I and II – Main Estimates.
1.2 Basis of Presentation
This quarterly report has been prepared by management using an expenditure basis of accounting. The accompanying Statement of Authorities includes the Agency’s spending authorities granted by Parliament and those used by the Agency, consistent with the 2014–2015 Main Estimates and 2014-2015 Supplementary Estimates. This quarterly report has been prepared using a special-purpose financial reporting framework designed to meet financial information needs with respect to the use of spending authorities.
The authority of Parliament is required before moneys can be spent by the Government. Approvals are given in the form of annually approved limits through appropriation acts or through legislation in the form of statutory spending authority for specific purposes.
Note that the Agency prepares its annual departmental financial statements on a full accrual basis in accordance with the Government's accounting policies, which are based on Canadian public sector accounting standards. However, the spending authorities voted by Parliament are prepared on an expenditure basis.
2. Highlights of Fiscal Quarter and Fiscal Year-to-Date (YTD) Results
This section highlights the significant items that contributed to the net change in resources available for the year and actual expenditures for the quarter ended December 31, 2014.
The following graph provides a comparison of budgetary authorities and expenditures as of
December 31, 2013, and December 31, 2014.
Comparison of Budgetary Authorities and Expenditures as of December 31, 2013, and December 31, 2014
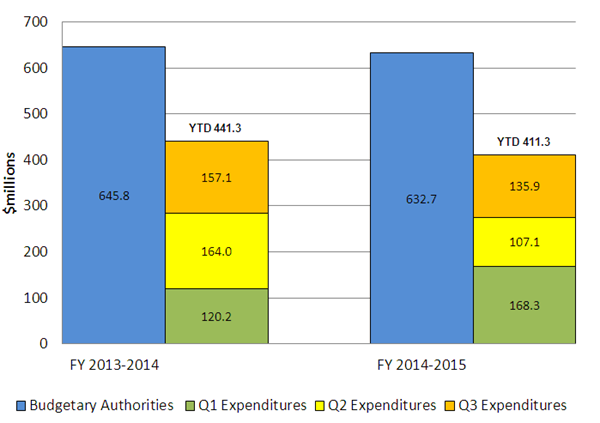
The above graph outlines the net budgetary authorities available for use in fiscal years 2013–2014 and 2014–2015. As of December 31, 2014, the Agency had a total of $632.7 million in authorities available for spending compared to $645.8 million as of December 31, 2013. The Agency’s year-to-date expenditures as of December 31, 2014, were $411.3 million compared to $441.3 million as of December 31, 2013. Both authorities and expenditures will change as the year progresses to reflect additional funding received throughout the year and increased expenditures.
2.1 Significant Changes to Authorities
When compared to the third quarter of the previous fiscal year, the authorities available for spending for the year have decreased by $13.1 million, or 2%, from $645.8 million to $632.7 million. The decrease is primarily attributable to a decrease in the operating and capital votes, which is partially offset by an increase in the grants and contributions vote.
Operating Expenditures (authorities)
Operating authorities available for use in fiscal year 2014–2015 have decreased by $45.1 million, or 12% from $374.8 million in fiscal year 2013–2014 to $329.7 million.
The significant changes to funding levels are as follows:
Decreases due to:
- sunsetting of programs in 2013-2014 for funding related to chronic lung and neurological diseases and short-term replenishment of the National Antiviral Stockpile;
- planned funding profile (no change to the total cost) under Canada’s Clean Air Agenda;
- reprofile of more funding in 2013-2014 compared to 2014-2015 to support the installation of an influenza fill line to secure, protect and improve ongoing domestic vaccine capacity in Canada for seasonal and pandemic influenza;
- Paylist Requirements (for parental benefits and severance payments, etc.) provided in the third quarter of 2013-2014 vs. the fourth quarter of 2014-2015; and
- Budget 2012 implementation.
Increases due to:
- collective bargaining agreements.
The changes above and to the methodology used to calculate Main Estimates account for the majority of the variances in the standard object authorities compared to the previous fiscal year.
Capital Expenditures (authorities)
Capital authorities available for use in fiscal year 2014–2015 have decreased by $5.1 million, or 37% from $13.9 million in fiscal year 2013–2014 to $8.8 million. The decrease is primarily due to the planned funding profile for the data management project under the Human Pathogens and Toxins Act and a smaller capital budget carryforward in 2014-2015 compared to 2013-2014.
Grants and Contributions (authorities)
Grants and Contributions authorities available for use in fiscal year 2014–2015 have increased by $41.4 million, or 20%, from $209.7 million in fiscal year 2013–2014 to $251.1 million. This increase is primarily explained by the final payment for the Hepatitis C Undertaking Initiative. It is partially offset by decreased funding due to Budget 2012 implementation and transfers to other government departments.
Spending of Revenues pursuant to section 4.2 of the Department of Health Act (authorities)
The statutory authority available for use in fiscal year 2014–2015 has decreased by $0.3 million, or 2%, from $14.0 million in fiscal year 2013-2014 to $13.7 million.
2.2 Significant Changes to Expenditures
When compared to the third quarter of the previous fiscal year, the expenditures decreased by $21.2 million, or 13%, from $157.1 million to $135.9 million. The decrease is primarily attributable to a reduction in operating expenditures and is partially offset by an increase in grants and contributions expenditures.
Operating Expenditures
Operating expenditures in the third quarter of fiscal year 2014–2015 were $67.2 million, a decrease of $52.6 million, or 44%, from $119.8 million in the same quarter of the previous year. This decrease is primarily due to the Agency paying Health Canada for services provided under the Shared Services Partnership Framework Agreement in the third quarter for fiscal year 2013-2014 versus the first quarter for fiscal year 2014-2015, as well as purchases in 2013-2014 for the National Emergency Stockpile System and the National Anti-viral Stockpile. The above differences also account for the majority of the variances in the standard object expenditures compared to the same quarter of the previous fiscal year.
Capital Expenditures
Capital expenditures for the third quarter of fiscal year 2014–2015 and 2013-2014 were identical at $0.8 million.
Grants & Contributions Expenditures
Grants & Contributions expenditures for the third quarter of fiscal year 2014–2015 were $56.4 million, an increase of $36.7 million, or 187%, from $19.7 million over the same quarter in the previous year. The increase is primarily due to payments being processed in the third quarter of 2014-2015 vs. the second quarter of 2013-2014.
Spending of Revenues pursuant to section 4.2 of the Department of Health Act (expenditures)
The Agency charged $4.1 million for the third quarter of fiscal year 2014–2015 to Health Canada for services provided to Health Canada under the Shared Services Partnership Framework Agreement, a decrease of $4.6 million, or 53%, from $8.7 million in the same quarter of the previous year. The decrease in mainly due to timing as the Agency has not yet processed additional charges.
3. Risks and Uncertainties
The dominant financial risks faced by the Agency relate to the nature of its mandate and the need to respond to unforeseeable events such as an influenza pandemic. Significant surge capacity would need to be activated in these instances.
To manage this financial risk, the Agency continues to strengthen its preparation and responsiveness to public health emergencies and public health capacity. Currently, the Agency is closely tracking costs related to the Ebola outbreak in West Africa; the response to which has required significant Agency resources. In an emergency situation, the Agency would first consider internal re-allocation of resources in order to address unforeseeable events. The federal government also has systems and processes in place for departments to access funds, should an emergency arise.
4. Significant Changes in Relation to Operations, Personnel and Programs
Budget 2014 did not identify any significant changes affecting the Agency. Please see below for the significant changes resulting from Budget 2012.
5. Budget 2012 Implementation
This section provides an overview of the savings measures announced in Budget 2012 that are being implemented in order to refocus government and programs; make it easier for Canadians and business to deal with their government; and, modernize and reduce the back office.
The Agency will achieve Budget 2012 savings of $68.0 million by fiscal year 2014–2015 through efficiency measures and program reductions that align resources to its core mandate, scaling back where there is a need; transforming how it works internally; and by consolidating and streamlining.
The Agency has achieved savings of $13.7 million in 2012-2013 and $35.7 million in 2013–2014. The savings increased to $68.0 million starting in 2014–2015.
There are no new significant financial risks and uncertainties related to the implementation of initiatives and savings measures from Budget 2012 for the current quarter.
More information on these savings measures can be found at the following link: Supplementary Data on Budget 2012 Implementation .Approved by:
President
February 24, 2015
Chief Financial Officer
| Fiscal year 2014-2015 | Fiscal year 2013-2014 | |||||
|---|---|---|---|---|---|---|
| Total available for use for the year ending March 31, 2015 Table 1 - Footnote * | Used during the quarter ended December 31, 2014 | Year to date used at quarter-end | Total available for use for the year ended March 31, 2014 Table 1 - Footnote * | Used during the quarter ended December 31, 2013 | Year to date used at quarter-end |
|
|
||||||
| Vote 1 - Operating expenditures | 329,744 | 67,230 | 225,978 | 374,823 | 119,829 | 241,115 |
| Vote 5 - Capital expenditures | 8,760 | 826 | 1,919 | 13,849 | 834 | 3,181 |
| Vote 10 - Grants and contributions | 251,102 | 56,413 | 155,708 | 209,742 | 19,669 | 164,172 |
| (S) Contributions to employee benefit plans | 29,394 | 7,343 | 22,031 | 33,341 | 8,030 | 24,091 |
| (S) Spending of proceeds from the disposal of surplus Crown assets | 54 | 20 | 48 | 59 | 4 | 46 |
| (S) Spending of Revenues pursuant to section 4.2 of the Department of Health Act | 13,680 | 4,080 | 5,640 | 14,027 | 8,703 | 8,703 |
| Total authorities | 632,734 | 135,912 | 411,324 | 645,841 | 157,069 | 441,308 |
| Fiscal year 2014-2015 | Fiscal year 2013-2014 | |||||
|---|---|---|---|---|---|---|
| Planned expenditures for the year ending March 31, 2015 | Expended during the quarter ended December 31, 2014 | Year to date used at quarter-end | Planned expenditures for the year ended March 31, 2014 | Expended during the quarter ended December 31, 2013 | Year to date used at quarter-end | |
| Expenditures: | ||||||
| Personnel | 219,027 | 56,483 | 153,073 | 246,073 | 56,220 | 163,292 |
| Transportation and communications | 7,434 | 2,173 | 5,279 | 13,297 | 2,043 | 5,339 |
| Information | 10,983 | 649 | 10,308 | 9,034 | 9,796 | 10,608 |
| Professional and special services | 106,098 | 15,011 | 64,509 | 98,592 | 55,882 | 73,785 |
| Rentals | 2,435 | -795 | 1,551 | 10,159 | -431 | 1,532 |
| Repair and maintenance | 3,244 | 824 | 2,334 | 13,245 | 280 | 1,491 |
| Utilities, materials and supplies | 19,335 | 4,087 | 8,569 | 26,034 | 13,263 | 17,625 |
| Acquisition of lands, buildings and works | 574 | 2 | 2 | 1,763 | 0 | 0 |
| Acquisition of machinery and equipment | 11,716 | 1,074 | 2,799 | 14,236 | 1,206 | 3,344 |
| Transfer payments | 251,102 | 56,413 | 155,708 | 209,742 | 19,669 | 164,172 |
| Other subsidies and payments | 1,360 | 224 | 7,767 | 4,240 | -522 | 469 |
| Total gross budgetary expenditures | 633,308 | 136,145 | 411,899 | 646,415 | 157,406 | 441,657 |
| Less Revenues netted against expenditures: | ||||||
| Services Non-Regulatory | 574 | 233 | 575 | 574 | 337 | 349 |
| Total Revenues netted against expenditures | 574 | 233 | 575 | 574 | 337 | 349 |
| Total net budgetary expenditures | 632,734 | 135,912 | 411,324 | 645,841 | 157,069 | 441,308 |
Page details
- Date modified: