
Chapter 3: The Health of Canada's Young People: a mental health focus – Home
Home
by Matthew King and Carolyn Hoessler
What is the home setting?
The home and family in the context of this report are specifically related to the parents or guardians of the students surveyed. Family relationships are characterized by relationships with mothers and fathers or their partners in the event students do not live with their birth parents. Although the family dynamic includes siblings and others in the home, these relationships are not captured in this report.
Why does the home setting matter?
The family provides the first socializing context in a young person's development. It is recognized as having the central role in socialization (Parke & Buriel, 2006). Children learn and develop values and norms based on those modeled, taught, and enforced within the family environment. Children who are exposed to a parenting style that combines warmth, control and affection throughout their childhood are more likely to be self-reliant, responsible, and friendly and achieve high academic standing at school (Kail & Barnfield, 2009). Parents also exercise key influence on youth choices. For example, research has found that strong parental support buffers the influence peers have on a child's engagement in risky behaviours such as substance abuse (Bremner et al., 2011).
Adolescence is typically a time when young people begin to challenge parental controls and values and also begin to be influenced by their peers (Collins & Steinberg, 2006). This growth in personal autonomy during the period of adolescence can result in varying degrees of conflict with parents. Relationships with parents, including communication and connectedness with family, are an important source of support throughout adolescence and have been demonstrated to be highly correlated to reduced delinquent behaviour, depression, and psychosomatic symptoms (Currie, 2008). Positive parenting practices build protective factors for young people. Gribble et al. (1993) showed that strong parent-child relationships were associated with resilient outcomes among children exposed to major life stressors. Additionally, parental involvement and support greatly increases a teenager's self-esteem as well as other psychological indicators of well‑being during adolescence (Bulanda & Majumdar, 2009).
Having a happy home life, characterized by open and respectful communication with parents and siblings, relates to better adolescent well‑being and self-esteem and fewer emotional problems and delinquent behaviours.
—Gutman & Eccles, 2007
Possible effects of the home setting on mental health
Living with both parents is associated with a number of factors such as increased socioeconomic status and decreased family disruption that are expected to be related to more positive mental health outcomes. When changes within the family take place, poorer mental health outcomes such as depression and anxiety can result (Nunes-Costa, Lamela, & Figueiredo, 2009). Young people who have positive relationships with parents that provide emotional support and encouragement, and with an absence of conflict, are expected to be more likely to have more positive outcomes on the mental health and well‑being measures (Morris, Silk, Steinberg, Myers, & Robinson, 2007; Steinberg, 2001). It is anticipated that parent relationships will be an important determinant of mental health.
What are we reporting in this chapter?
The 2010 survey asked participating students to identify who they lived with and whether or not they had a second home. From these data, a measure identifying family make-up was created. Students were asked specific questions about how well they could communicate with their parents about things that really bother them, to what extent they felt understood and trusted by their parents, attached importance to parental opinion, felt the weight of parental expectations, argued with parents, disobeyed their parents, and had thoughts of leaving home.
New in 2010, survey respondents were also asked how many days a week they sat down to dinner with their parents. This is a measure of family connectedness that is an important dimension of a protective home environment and contributes to adolescent resiliency, which in turn is related to a spectrum of health outcomes. Longitudinal studies of children and adolescents find that regularly having dinners together with the family each evening not only promotes better eating behaviours and physical health, but also relates to better cognitive, emotional, and social competencies (Weinstein, 2005; Woodruff & Hanning, 2009).
In this chapter we examine living with both parents, ease of communication with father and mother, whether students have a lot of arguments with their parents, and how often students eat dinner as a family in relation to the four mental health measures: (1) emotional well‑being; (2) prosocial behaviours; (3) emotional problems; and (4) behavioural problems.
Living arrangements of Canadian students
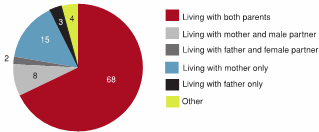
![[Click to enlarge Figure 3.1]](/content/dam/phac-aspc/migration/phac-aspc/hp-ps/dca-dea/publications/hbsc-mental-mentale/assets/images/fig_3-1_lg-eng.gif)
[Text Equivalent, Figure 3.1]
Figure 3.1 shows the percentage of students belonging to various family structures. The graph shows that 68% of students live with both parents, compared to 15% who live with their mother only, 8% who live with their mother and her male partner, 3% who live with their father only, 2% who live with their father and his female partner, and 4% who live in other family structures.
Approximately two out of every three students in Canada live with both parents (Figure 3.1). An additional 23% live with their mother only or their mother and a male partner. Whether or not students live with one or both parents does not necessarily impose a risk for poor mental health. There are however a number of associated factors, such as lower socio e conomic status, family conflict, parent availability and contact, shared custody issues, and other family disruptions that tend to be associated with poorer mental health outcomes.
Reports of happiness at home
3.2 Students who report having a happy home life, by grade and gender (%)
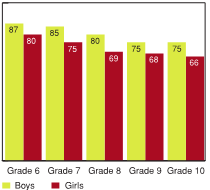
![[Click to enlarge Figure 3.2]](/content/dam/phac-aspc/migration/phac-aspc/hp-ps/dca-dea/publications/hbsc-mental-mentale/assets/images/fig_3-2_lg-eng.gif)
[Text Equivalent, Figure 3.2]
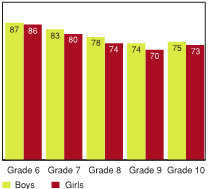
Figure 3.2 shows the percentage of students who report having a happy home life, by grade and gender. The graph shows that 87% of Grade 6 boys report that they have a happy home life, compared to 85% of Grade 7 boys, 80% of Grade 8 boys, 75% of Grade 9 boys, and 75% of Grade 10 boys. On the same question, 80% of Grade 6 girls report that they have a happy home life, compared to 75% of Grade 7 girls, 69% of Grade 8 girls, 68% of Grade 9 girls, and 66% of Grade 10 girls.
The vast majority of students reported that they had a happy home life (Figure 3.2). For both boys and girls however, there was a decrease in the proportions agreeing that they had a happy home life from Grade 6 to 10. Despite the decrease as students got older, 75% of Grade 10 boys and 66% of girls still reported they had a happy home life. Overall boys were much more likely than girls to feel this way.
Parental communication, understanding, and trust
3.3 Father is easy or very easy to talk to, by grade and gender (%)
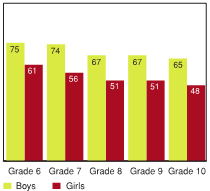
![[Click to enlarge Figure 3.3]](/content/dam/phac-aspc/migration/phac-aspc/hp-ps/dca-dea/publications/hbsc-mental-mentale/assets/images/fig_3-3_lg-eng.gif)
[Text Equivalent, Figure 3.3]
Figure 3.3 shows the percentage of students who agree that their fathers are easy or very easy to talk to, by grade and gender. The graph shows that 75% of Grade 6 boys report that their fathers are easy or very easy to talk to, compared to 74% of Grade 7 boys, 67% of Grade 8 boys, 67% of Grade 9 boys, and 65% of Grade 10 boys. On the same question, 61% of Grade 6 girls report that their fathers are easy or very easy to talk to, compared to 56% of Grade 7 girls, 51% of Grade 8 girls, 51% of Grade 9 girls, and 48% of Grade 10 girls.
![[Click to enlarge Figure 3.4]](/content/dam/phac-aspc/migration/phac-aspc/hp-ps/dca-dea/publications/hbsc-mental-mentale/assets/images/fig_3-4_lg-eng.gif)
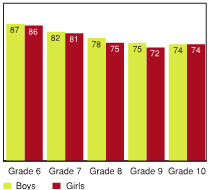
[Text Equivalent, Figure 3.4]
Figure 3.4 shows the percentage of students who agree that their mothers are easy or very easy to talk to, by grade and gender. The graph shows that 87% of Grade 6 boys report that their mothers are easy or very easy to talk to, compared to 82% of Grade 7 boys, 78% of Grade 8 boys, 75% of Grade 9 boys, and 74% of Grade 10 boys. On the same question, 86% of Grade 6 girls report that their mothers are easy or very easy to talk to, compared to 81% of Grade 7 girls, 75% of Grade 8 girls, 72% of Grade 9 girls, and 74% of Grade 10 girls.
Students were asked how easy it was to talk to their mother and father about things that really bother them (Figure 3.3 and Figure 3.4). Some interesting patterns in where young people go to for support were revealed. Overall, both boys and girls were more likely to find it easier to communicate with their mothers than their fathers about things that really bother them. Boys and girls were quite similar across the grades in finding it easy to talk to their mothers and there was an overall decrease in this comfort level for both boys and girls as students got older. Though boys were more likely to find it easy to talk to their mothers than their fathers, they were much more likely than girls to find it easy to talk to their fathers. For both boys and girls, ease of talking to their father decreased significantly as they got older.
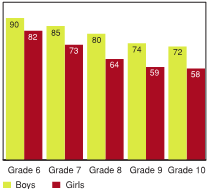
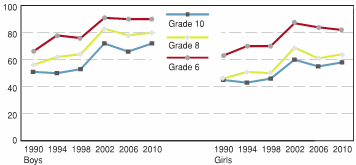
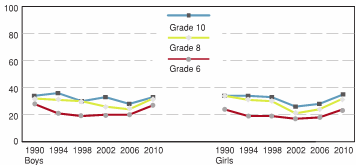
Younger students were much more likely than older students to feel understood by their parents, with 90% of Grade 6 boys and 82% of Grade 6 girls agreeing with the item "My parents understand me," compared to 72% of boys and only 58% of girls by Grade 10 (Figure 3.5). Boys were substantially more likely than girls to agree that they were understood by their parents at all grades. These patterns have been consistent across the six cycles of data collection from 1990 to 2010 (Figure 3.6). Overall, the proportions of students indicating they felt understood by their parents rose steadily from 1990 to 2002, lowered from 2002 to 2006 and leveled off or increased slightly for each of the grade and gender groups in 2010. The increase in the proportions of young people feeling understood by their parents today relative to the early years of the survey is substantial and suggests that youth have much more positive relationships with their parents in recent years.
3.5 Students who report being understood by parents, by grade and gender (%)
![[Click to enlarge Figure 3.5]](/content/dam/phac-aspc/migration/phac-aspc/hp-ps/dca-dea/publications/hbsc-mental-mentale/assets/images/fig_3-5_lg-eng.gif)
[Text Equivalent, Figure 3.5]
Figure 3.5 shows the percentage of students who report being understood by their parents, by grade and gender. The graph shows that 90% of Grade 6 boys report being understood by their parents, compared to 85% of Grade 7 boys, 80% of Grade 8 boys, 74% of Grade 9 boys, and 72% of Grade 10 boys. On the same question, 82% of Grade 6 girls report being understood by parents, compared to 73% of Grade 7 girls, 64% of Grade 8 girls, 59% of Grade 9 girls, and 58% of Grade 10 girls.
![[Click to enlarge Figure 3.6]](/content/dam/phac-aspc/migration/phac-aspc/hp-ps/dca-dea/publications/hbsc-mental-mentale/assets/images/fig_3-6_lg-eng.gif)
[Text Equivalent, Figure 3.6]
Figure 3.6 is a line graph that shows the approximate percentage of students who report being understood by their parents, by grade, gender, and year of survey. The graph shows that among Grade 6 boys, approximately 65% reported being understood by their parents in 1990, compared to approximately 79% in 1994, approximately 77% in 1998, approximately 92% in 2002, approximately 91% in 2006, and approximately 91% in 2010. Among Grade 8 boys, approximately 57% reported being understood by their parents in 1990, compared to approximately 62% in 1994, approximately 63% in 1998, approximately 82% in 2002, approximately 79% in 2006, and approximately 80% in 2010. Among Grade 10 boys, approximately 52% reported being understood by their parents in 1990, compared to approximately 50% in 1994, approximately 53% in 1998, approximately 73% in 2002, approximately 65% in 2006, and approximately 71% in 2010. On the same question, among Grade 6 girls, approximately 62% reported being understood by their parents in 1990, compared to approximately 70% in 1994, approximately 70% in 1998, approximately 88% in 2002, approximately 83% in 2006, and approximately 81% in 2010. Among Grade 8 girls, approximately 45% reported being understood by their parents in 1990, compared to approximately 51%, approximately 50% in 1998, approximately 68% in 2002, approximately 61% in 2006, and approximately 63% in 2010. Among Grade 10 girls, approximately 45% reported being understood by their parents in 1990, compared to approximately 42% in 1994, approximately 46% in 1998, approximately 60% in 2002, approximately 55% in 2006, and approximately 58% in 2010.
In contrast, the proportions of boys and girls agreeing that their parents trusted them were similar across the grades (Figure 3.7). Younger students were more likely than older students to indicate they felt trusted by their parents. The general trend over time was for the proportions of young people feeling trusted by their parents to increase from 1990 to 2002 and then to remain relatively unchanged from 2002 to 2010 (Figure 3.8). Compared to the time the first survey was taken in 1990, young people in 2010 were much more positive in this regard.
3.7 Students who report being trusted by parents, by grade and gender (%)
![[Click to enlarge Figure 3.7]](/content/dam/phac-aspc/migration/phac-aspc/hp-ps/dca-dea/publications/hbsc-mental-mentale/assets/images/fig_3-7_lg-eng.gif)
[Text Equivalent, Figure 3.7]
Figure 3.7 shows the percentage of students who report being trusted by their parents, by grade and gender. The graph shows that 87% of Grade 6 boys report being trusted by their parents, compared to 83% of Grade 7 boys, 78% of Grade 8 boys, 74% of Grade 9 boys, and 75% of Grade 10 boys. On the same question, 86% of Grade 6 girls report being trusted by their parents, compared to 80% of Grade 7 girls, 74% of Grade 8 girls, 70% of Grade 9 girls, and 73% of Grade 10 girls.

![[Click to enlarge Figure 3.8]](/content/dam/phac-aspc/migration/phac-aspc/hp-ps/dca-dea/publications/hbsc-mental-mentale/assets/images/fig_3-8_lg-eng.gif)
[Text Equivalent, Figure 3.8]
Figure 3.8 is a line graph that shows the approximate percentage of students who report being trusted by their parents, by grade, gender, and year of survey. The graph shows that among Grade 6 boys, approximately 77% reported being trusted by their parents in 1990, compared to approximately 82% in 1994, approximately 83% in 1998, approximately 87% in 2002, approximately 87% in 2006, and approximately 87% in 2010. Among Grade 8 boys, approximately 77% reported being trusted by their parents in 1990, compared to approximately 77% in 1994, approximately 78% in 1998, approximately 84% in 2002, approximately 80% in 2006, and approximately 79% in 2010. Among Grade 10 boys, approximately 68% reported being trusted by their parents in 1990, compared to approximately 68 in 1994, approximately 76% in 1998, approximately 77% in 2002, approximately 78% in 2006, and approximately 77% in 2010. On the same question, among Grade 6 girls, approximately 80% reported being trusted by their parents in 1990, compared to approximately 81% in 1994, approximately 81% in 1998, approximately 88% in 2002, approximately 85% in 2006, and approximately 85% in 2010. Among Grade 8 girls, approximately 65% reported being trusted by their parents in 1990, compared to approximately 69% in 1994, approximately 71% in 1998, approximately 78% in 2002, approximately 75% in 2006, and approximately 74% in 2010. Among Grade 10 girls, approximately 61% reported being trusted by their parents in 1990, compared to approximately 64% in 1994, approximately 71% in 1998, approximately 71% in 2002, approximately 75% in 2006, and approximately 75% in 2010.
Parental opinion and expectations
3.9 Students who report that what their parents think of them is important, by grade and gender (%)
![[Click to enlarge Figure 3.9]](/content/dam/phac-aspc/migration/phac-aspc/hp-ps/dca-dea/publications/hbsc-mental-mentale/assets/images/fig_3-9_lg-eng.gif)
[Text Equivalent, Figure 3.9]
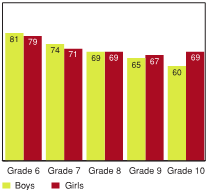
Figure 3.9 shows the percentage of students who report that what their parents think of them is important, by grade and gender. The graph shows that 81% of Grade 6 boys report that what their parents think of them is important, compared to 74% of Grade 7 boys, 69% of Grade 8 boys, 65% of Grade 9 boys, and 60% of Grade 10 boys. On the same question, 79% of Grade 6 girls report that what their parents think of them is important, compared to 71% of Grade 7 girls, 69% of Grade 8 girls, 67% of Grade 9 girls, and 69% of Grade 10 girls.
Four in five Grade 6 students agreed that what their parents thought of them was important (Figure 3.9). For girls, this proportion dropped at Grade 7 but varied little across Grades 7 to 10. For boys, the proportion indicating that parent approval was important to them steadily declined from Grade 6 through 10. Boys and girls are not dissimilar at any or the reported ages except at Grade 10 where more girls than boys valued their parents' approval.
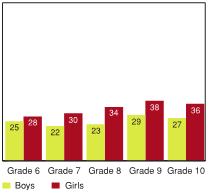
3.10 Students who think parents expect too much of them, by grade and gender (%)
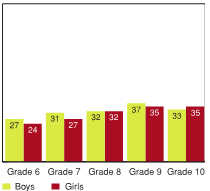
![[Click to enlarge Figure 3.10]](/content/dam/phac-aspc/migration/phac-aspc/hp-ps/dca-dea/publications/hbsc-mental-mentale/assets/images/fig_3-10_lg-eng.gif)
[Text Equivalent, Figure 3.10]
Figure 3.10 shows the percentage of students who think their parents expect too much of them, by grade and gender. The graph shows that 27% of Grade 6 boys think their parents expect too much, compared to 31% of Grade 7 boys, 32% of Grade 8 boys, 37% of Grade 9 boys, and 33% of Grade 10 boys. On the same question, 24% of Grade 6 girls think their parents expect too much, compared to 27% of Grade 7 girls, 32% of Grade 8 girls, 35% of Grade 9 girls, and 35% of Grade 10 girls.
Students were asked to report on both parent expectations generally and parents' expec tations related to school. Approximately one-third of the students surveyed indicated they felt their parents expected too much of them (Figure 3.10). Expectations generally increased from Grade 6 to Grade 9. Gender differences were small.
Higher proportions of students indicated their parents expected too much of them in 2010 than in 2006 (Figure 3.11). Compared to parents' expectations generally, higher proportions of students in all grades felt their parents expected too much of them at school (Figure 3.12). Boys felt more pressure than girls to do well at school. For girls there was a clear pattern of increasing pressure as they got older, while for boys the highest proportion agreeing that school pressure from parents was too great was 44% in Grade 9.
3.11 Students who think parents expect too much of them, by grade, gender and year of survey (%)
![[Click to enlarge Figure 3.11]](/content/dam/phac-aspc/migration/phac-aspc/hp-ps/dca-dea/publications/hbsc-mental-mentale/assets/images/fig_3-11_lg-eng.gif)
[Text Equivalent, Figure 3.11]
Figure 3.11 is a line graph that shows the approximate percentage of students who think their parents expect too much of them, by grade, gender, and year of survey. The graph shows that among Grade 6 boys, approximately 28% reported that their parents expect too much of them in 1990, compared to approximately 21% in 1994, approximately 20% in 1998, approximately 21% in 2002, approximately 21% in 2006, and approximately 27% in 2010. Among Grade 8 boys, approximately 33% reported that their parents expect too much of them in 1990, compared to approximately 32% in 1994, approximately 30% in 1998, approximately 25% in 2002, approximately 23% in 2006, and approximately 33% in 2010. Among Grade 10 boys, approximately 35% reported that their parents expect too much of them in 1990, compared to approximately 37% in 1994, approximately 30% 1998, approximately 34% in 2002, approximately 28% in 2006, and approximately 34% in 2010. On the same question, among Grade 6 girls, approximately 23% reported that their parents expect too much of them in 1990, compared to approximately 20% in 1994, approximately 20% 1998, approximately 18% in 2002, approximately 19% in 2006, and approximately 23% in 2010. Among Grade 8 girls, approximately 35% reported that their parents expect too much of them in 1990, compared to approximately 34% in 1994, approximately 32% 1998, approximately 21% in 2002, approximately 24% in 2006, and approximately 32% in 2010. Among Grade 10 girls, approximately 35% reported that their parents expect too much of them in 1990, compared to approximately 35% in 1994, approximately 34% in 1998, approximately 28% in 2002, approximately 29% in 2006, and approximately 37% in 2010.
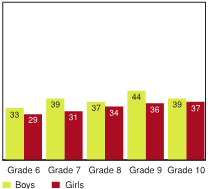
![[Click to enlarge Figure 3.12]](/content/dam/phac-aspc/migration/phac-aspc/hp-ps/dca-dea/publications/hbsc-mental-mentale/assets/images/fig_3-12_lg-eng.gif)
[Text Equivalent, Figure 3.12]
Figure 3.12 shows the percentage of students who think parents expect too much of them at school, by grade and gender. The graph shows that 33% of Grade 6 boys report that their parents expect too much of them at school, compared to 39% of Grade 7 boys, 37% of Grade 8 boys, 44% of Grade 9 boys, and 39% of Grade 10 boys. On the same question, 29% of Grade 6 girls report that their parents expect too much of them at school, compared to 31% of Grade 7 girls, 34% of Grade 8 girls, 36% of Grade 9 girls, and 37% of Grade 10 girls.
Sometimes it feels like parents are against you; don't let you learn from your own mistakes...but at the end of the day things are still ok… We can talk about problems, and reach an understanding.
—Youth, Healthy Advice Workshop
Conflict with parents
For Grade 6s, the trend has been for students to improve in this regard from 1990 to 2002, with boys changing little in the subsequent years and the proportion of girls having a lot of arguments with their parents increasing from 2002 to 2010. Grade 8 boys generally improved on this measure from 1990 to 2010, while girls have gone up and down on the measure before leveling out at 28% for each of the last three years. For Grade 10s, the percentages of both boys and girls remained about the same for the first three cycles of the survey, and lowered but remained consistent across the last three cycles three years of the survey.
3.13 Students who report having a lot of arguments with their parents, by grade and gender (%)
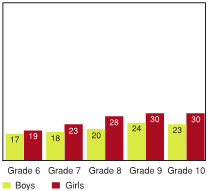
![[Click to enlarge Figure 3.13]](/content/dam/phac-aspc/migration/phac-aspc/hp-ps/dca-dea/publications/hbsc-mental-mentale/assets/images/fig_3-13_lg-eng.gif)
[Text Equivalent, Figure 3.13]
Figure 3.13 shows the percentage of students who report having a lot of arguments with their parents, by grade and gender. The graph shows that 17% of Grade 6 boys report arguing a lot with their parents, compared to 18% of Grade 7 boys, 20% of Grade 8 boys, 24% of Grade 9 boys, and 23% of Grade 10 boys. On the same question, 19% of Grade 6 girls report arguing a lot with their parents, compared to 23% of Grade 7 girls, 28% of Grade 8 girls, 30% of Grade 9 girls, and 30% of Grade 10 girls.
The pattern of students indicating they had a lot of arguments with their parents had an inverse relationship to the patterns related to feeling understood by their parents (Figure 3.13). Girls had more conflict with their parents than boys and there was an increase in the conflict between students and their parents as they got older, particularly for girls. Across the six cycles of the survey, the pattern of Grade 10 girls having more arguments with their parents than boys has been consistent (Figure 3.14).
3.14 Students who report having a lot of arguments with their parents, by grade, gender, and year of survey (%)

![[Click to enlarge Figure 3.14]](/content/dam/phac-aspc/migration/phac-aspc/hp-ps/dca-dea/publications/hbsc-mental-mentale/assets/images/fig_3-14_lg-eng.gif)
[Text Equivalent, Figure 3.14]
Figure 3.14 is a line graph that shows the approximate percentage of students who report having a lot of arguments with their parents, by grade, gender, and year of survey. The graph shows that among Grade 6 boys, approximately 25% reported arguing a lot with their parents in 1990, compared to approximately 20% in 1994, approximately 19% in 1998, approximately 15% in 2002, approximately 18% in 2006, and approximately 18% in 2010. Among Grade 8 boys, approximately 25% reported arguing a lot with their parents in 1990, compared to approximately 23% in 1994, approximately 24% in 1998, approximately 20% in 2002, approximately 20% in 2006, and approximately 20% in 2010. Among Grade 10 boys, approximately 31% reported arguing a lot with their parents in 1990, compared to approximately 32% in 1994, approximately 30% in 1998, approximately 27% in 2002, approximately 23% in 2006, and approximately 23% in 2010. On the same question, among Grade 6 girls, approximately 22% reported arguing a lot with their parents in 1990, compared to approximately 21% in 1994, approximately 18% in 1998, approximately 15% in 2002, approximately 17% in 2006, and approximately 19% in 2010. Among Grade 8 girls, approximately 22% reported arguing a lot with their parents in 1990, compared to approximately 33% in 1994, approximately 35% in 1998, approximately 29% in 2002, approximately 29% in 2006, and approximately 29% in 2010. Among Grade 10 girls, approximately 37% reported arguing a lot with their parents in 1990, compared to approximately 36% in 1994, approximately 38% in 1998, approximately 31% in 2002, approximately 33% in 2006, and approximately 31% in 2010.
Between 22% and 38% of students across the grade and gender groups reported there were times they would like to leave home (Figure 3.15). Girls were much more likely to feel this way than boys and there was a general increase in the number who considered leaving home as students got older. Students were asked to respond to the item "I disobey my parents" using a six point scale with "definitely like me" at one end and "definitely not like me" at the other end (Figure 3.16). There was a very clear pattern of students indicating "definitely not like me" across the grade groups with a drop from 63% in Grade 6 to 36% in Grade 10. Boys and girls responded similarly to one another within each grade.
3.15 Students who report wanting to leave home at times, by grade and gender (%)
![[Click to enlarge Figure 3.15]](/content/dam/phac-aspc/migration/phac-aspc/hp-ps/dca-dea/publications/hbsc-mental-mentale/assets/images/fig_3-15_lg-eng.gif)
[Text Equivalent, Figure 3.15]
Figure 3.15 shows the percentage of students who report wanting to leave their home at times, by grade and gender. The graph shows that 25% of Grade 6 boys report wanting to leave their home at times, compared to 22% of Grade 7 boys, 23% of Grade 8 boys, 29% of Grade 9 boys, and 27% of Grade 10 boys. On the same question, 28% of Grade 6 girls report wanting to leave their home at times, compared to 30% of Grade 7 girls, 34% of Grade 8 girls, 38% of Grade 9 girls, and 36% of Grade 10 girls.
3.16 Students who respond "Definitely not like me," to the statement "I disobey my parents," by grade and gender (%)
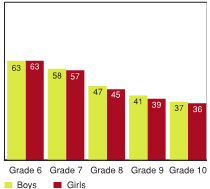
![[Click to enlarge Figure 3.16]](/content/dam/phac-aspc/migration/phac-aspc/hp-ps/dca-dea/publications/hbsc-mental-mentale/assets/images/fig_3-16_lg-eng.gif)
[Text Equivalent, Figure 3.16]
Figure 3.16 shows the percentage of students who respond "Definitely not like me" to the statement "I disobey my parents", by grade and gender. The graph shows that 63% of Grade 6 boys report that it is definitely not like them to disobey their parents, compared to 58% of Grade 7 boys, 47% of Grade 8 boys, 41% of Grade 9 boys, and 37% of Grade 10 boys. On the same question, 63% of Grade 6 girls report that it is definitely not like them to disobey their parents, compared to 57% of Grade 7 girls, 45% of Grade 8 girls, 39% of Grade 9 girls, and 36% of Grade 10 girls.
Eating dinner with family
3.17 On average, your family sits down to dinner together five or more times per week, by grade and gender (%)
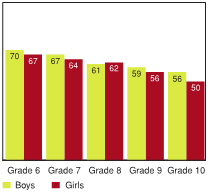
![[Click to enlarge Figure 3.17]](/content/dam/phac-aspc/migration/phac-aspc/hp-ps/dca-dea/publications/hbsc-mental-mentale/assets/images/fig_3-17_lg-eng.gif)
[Text Equivalent, Figure 3.17]
Figure 3.17 shows the percentage of students who report that, on average, their family sits down to dinner together five or more times per week, by grade and gender. The graph shows that 70% of Grade 6 boys report sitting down for dinner with their family five or more times per week, compared to 67% of Grade 7 boys, 61% of Grade 8 boys, 59% of Grade 9 boys, and 56% of Grade 10 boys. On the same question, 67% of Grade 6 girls report sitting down for dinner with their family five or more times per week, compared to 64% of Grade 7 girls, 62% of Grade 8 girls, 56% of Grade 9 girls, and 50% of Grade 10 girls.
In Grade 6, over two-thirds of students indicated they sat down to dinner with their families on average five or more times a week (Figure 3.17). This percentage declined to just over half of Grade 10 students. Grade 10 girls were least likely to have dinner regularly with their families. Certainly involvement in various extracurricular activities can have an impact on this, but overall the measure is an important indicator of family dynamics. Sitting down to dinner as a family is indicative of a greater degree of family connectedness.
Relationships between home/parent relationships and mental health
In the introductory chapter, four measures of mental health are identified. Perhaps most illustrative of the strong relationship between the home and mental health is the fact that one of the individual items that makes up the emotional well‑being scale is, do you agree or disagree with the statement "I have a happy home life". Happiness at home is in itself a key dimension of emotional well‑being.
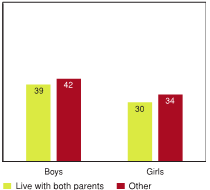
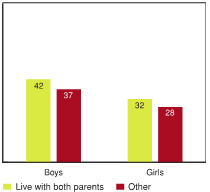
3.18 Students reporting high levels of behavioural problems by live with both parents, by gender (%) 1
![[Click to enlarge Figure 3.18]](/content/dam/phac-aspc/migration/phac-aspc/hp-ps/dca-dea/publications/hbsc-mental-mentale/assets/images/fig_3-18_lg-eng.gif)
[Text Equivalent, Figure 3.18]
Figure 3.18 shows the percentage of students reporting high levels of behavioural problems based on their living arrangements, by gender. The graph shows that 39% of boys who live with both parents report high levels of behavioural problems, compared to 42% of boys with other living arrangements. On the same question, 30% of girls living with both parents report high levels of behavioural problems compared to 34% of girls with other living arrangements.
3.19 Students reporting high levels of emotional well‑being by live with both parents, by gender (%)
![[Click to enlarge Figure 3.19]](/content/dam/phac-aspc/migration/phac-aspc/hp-ps/dca-dea/publications/hbsc-mental-mentale/assets/images/fig_3-19_lg-eng.gif)
[Text Equivalent, Figure 3.19]
Figure 3.19 shows the percentage of students reporting high levels of emotional well‑being based on their living arrangements, by gender. The graph shows that 42% of boys who live with both parents report high levels of emotional well‑being, compared to 37% of boys with other living arrangements. On the same question, 32% of girls who live with both parents report high levels of emotional well‑being, compared to 28% of girls with other living arrangements.
Though both boys and girls who lived with both parents were less likely to be in the highest group on the behavioural problems measure than those who didn't live with both parents, differences were small (Figure 3.18). Contrary to what one might expect, whether or not young people lived with both their parents was not a strong predictor of behavioural problems. It should be noted however, that this analysis controls for socio-economic status (SES). Emotional well‑being was higher for those living with both their parents than for others (Figure 3.19).
Your life will be successful if your parents are by your side.
—Youth, Healthy Advice Workshop
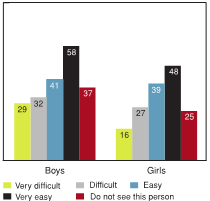
There was a very strong relationship between young people's ease of talking to their father and being in the highest group on the emotional problems measure (Figure 3.20). Almost half of boys and over half of girls who found it very difficult to talk to their father had a high level of emotional problems compared to less than one-quarter of boys and less than one-third of girls who found it easy or very easy to talk to their father. Interestingly, both boys and girls who found it easy to talk to their father were less likely to have emotional problems than those who found it very easy to talk to their father. The easier students found it to talk to their father about things that bothered them, the more likely they were to be in the highest category on emotional well‑being (Figure 3.21). Emotional problems were lower and emotional well‑being was higher for those who didn't have a father or didn't see him than for those who did see their father, but found it very difficult to communicate with him.
3.20 Students reporting high levels of emotional problems by ease of talking to father, by gender (%)

![[Click to enlarge Figure 3.20]](/content/dam/phac-aspc/migration/phac-aspc/hp-ps/dca-dea/publications/hbsc-mental-mentale/assets/images/fig_3-20_lg-eng.gif)
[Text Equivalent, Figure 3.20]
Figure 3.20 shows the percentage of students reporting high levels of emotional problems based on how easy it is for them to talk to their father, by gender. The graph shows that 45% of boys who find it very difficult to talk to their fathers report high levels of emotional problems, compared to 31% of boys who find it difficult, 19% of boys who find it easy, 23% of boys who find it very easy, and 32% of boys who do not see their father. On the same question, 58% of girls who find it very difficult to talk to their father report high levels of emotional problems, compared to 44% of girls who find it difficult, 29% of girls who find it easy, 32% of girls who find it very easy, and 48% of girls who do not see their father.
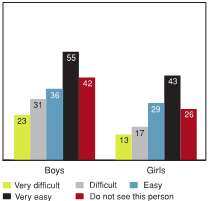
3.21 Students reporting high levels of emotional well‑being by ease of talking to father, by gender (%)
![[Click to enlarge Figure 3.21]](/content/dam/phac-aspc/migration/phac-aspc/hp-ps/dca-dea/publications/hbsc-mental-mentale/assets/images/fig_3-21_lg-eng.gif)
[Text Equivalent, Figure 3.21]
Figure 3.21 shows the percentage of students reporting high levels of emotional well‑being based on how easy it is for them to talk to their father, by gender. The graph shows that 29% of boys who find it very difficult to talk to their father report high levels of emotional well‑being, compared to 32% of boys who find it difficult, 41% of boys who find it easy, 58% of boys who find it very easy, and 37% of boys who do not see their father. On the same question, 16% of girls who find it very difficult to talk to their father report high levels of emotional well‑being, compared to 27% of girls who find it difficult, 39% of girls who find it easy, 48% of girls who find it very easy, and 25% of girls who do not see their father.
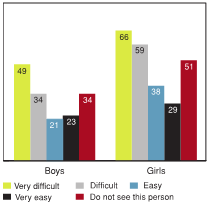
There was a powerful relationship between the ease of communicating with their mother around serious issues and all four mental health measures. For boys, those who found it very difficult to communicate with their mother were twice as likely as those who found it "easy" or "very easy" to have high levels of emotional problems (Figure 3.22). The differences for girls between the "very difficult" and "very easy" categories on the com m unication with mother item were even greater. It is noteworthy that half of the girls who didn't have a mother or didn't see their mother also indicated they had high levels of emotional problems. Inversely, both boys and girls who found it easy to talk to their mother were much more likely to report high levels of emotional well‑being than those who found it difficult (Figure 3.23). Being able to communicate with their mother about problems is obviously a considerable asset in fostering positive emotional health and well‑being for young people.
3.22 Students reporting high levels of emotional problems by ease of talking to mother, by gender (%)
![[Click to enlarge Figure 3.22]](/content/dam/phac-aspc/migration/phac-aspc/hp-ps/dca-dea/publications/hbsc-mental-mentale/assets/images/fig_3-22_lg-eng.gif)
[Text Equivalent, Figure 3.22]
Figure 3.22 shows the percentage of students reporting high levels of emotional problems based on how easy it is for them to talk to their mother, by gender. The graph shows that 49% of boys who find it very difficult to talk to their mother report high levels of emotional problems, compared to 34% of boys who find it difficult, 21% of boys who find it easy, 23% of boys who find it very easy, and 34% of boys who do not see their mother. On the same question, 66% of girls who find it very difficult to talk to their mother report high levels of emotional problems, compared to 59% of girls who find it difficult, 38% of girls who find it easy, 29% of girls who find it very easy, and 51% of girls who do not see their mother.
3.23 Students reporting high levels of emotional well‑being by ease of talking to mother, by gender (% )
![[Click to enlarge Figure 3.23]](/content/dam/phac-aspc/migration/phac-aspc/hp-ps/dca-dea/publications/hbsc-mental-mentale/assets/images/fig_3-23_lg-eng.gif)
[Text Equivalent, Figure 3.23]
Figure 3.23 shows the percentage of students reporting high levels of emotional well‑being based on how easy it is for them to talk to their mother, by gender. The graph shows that 23% of boys who find it very difficult to talk to their mother report high levels of emotional well‑being, compared to 31% of boys who find it difficult, 36% of boys who find it easy, 55% of boys who find it very easy, and 42% of boys who do not see their mother. On the same question, 13% of girls who find it very difficult to talk to their mother report high levels of emotional well‑being, compared to 17% of girls who find it difficult, 29% of girls who find it easy, 43% of girls who find it very easy, and 26% of girls who do not see their mother.
Because I have support at home and my parents help me, I know how it feels when you have that, it feels good. Because I know how it feels I want to let others who may not have that support and parents who don't help them get that good feeling of how it feels to have someone there. So in conclusion when you have a good relationship with your parents you tend to help others. That's how I see it.
—Youth, Healthy Advice Workshop
3.24 Students reporting high levels of emotional problems by agreement to "I have lots of arguments with my parents", by gender (%)
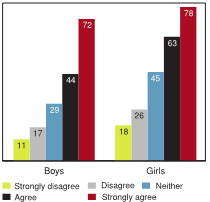
![[Click to enlarge Figure 3.24]](/content/dam/phac-aspc/migration/phac-aspc/hp-ps/dca-dea/publications/hbsc-mental-mentale/assets/images/fig_3-24_lg-eng.gif)
[Text Equivalent, Figure 3.24]
Figure 3.24 shows the percentage of students reporting high levels of emotional problems based on their agreement with the statement that "I have lots of arguments with my parents", by gender. The graph shows that 11% of boys who strongly disagree with this statement report high levels of emotional problems, compared to 17% of boys who disagree, 29% of boys who neither agree nor disagree, 44% of boys who agree, and 72% of boys who strongly agree. On the same question, 18% of girls who strongly disagree with this statement report high levels of emotional problems, compared to 26% of girls who disagree, 45% of girls who neither agree nor disagree, 63% of girls who agree, and 78% of girls who strongly agree.
Students who had a home environment with conflict, where they had a lot of arguments with their parents, were much more likely to have emotional problems than those who didn't have such an environment (Figure 3.24). As with many of the interrelationships explored in this chapter, there is extremely powerful evidence to suggest this aspect of young people's relationships is critical to their mental health.
3.25 Students reporting high levels of emotional problems by "How often do you sit down to dinner with your family?", by gender (%)
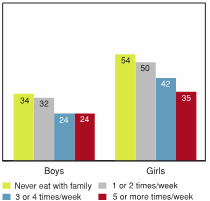
![[Click to enlarge Figure 3.25]](/content/dam/phac-aspc/migration/phac-aspc/hp-ps/dca-dea/publications/hbsc-mental-mentale/assets/images/fig_3-25_lg-eng.gif)
[Text Equivalent, Figure 3.25]
Figure 3.25 shows the percentage of students reporting high levels of emotional problems based on how often they sit down to eat dinner with their family, by gender. The graph shows that 34% of boys who never sit down to eat dinner with their family report high levels of emotional problems, compared to 32% of boys who do it once or twice per week, 24% of boys who do it 3 or 4 times per week, and 24% of boys who do it 5 or more times per week. On the same question, 54% of girls who never sit down to eat dinner with their family report high levels of emotional problems, compared to 50% of girls who do it once or twice per week, 42% of girls who do it 3 or 4 times per week, and 35% of girls who do it 5 or more times per week.
Students who reported sitting down to dinner together with their family more often were less likely to have emotional problems than those who didn't. This was true for both boys and girls, but the relationship was especially strong for girls (Figure 3.25). Students were also substantially more likely to report emotional well‑being, with similar increases for both boys and girls, as the frequency of eating dinner as a family increased (Figure 3.26). Students eating dinner more regularly with their families were also more likely to respond positively on the prosocial behavior measure (Figure 3.27).
Home is important. It provides security and makes me feel safe.
—Youth, Healthy Advice Workshop
3.26 Students reporting high levels of emotional well‑being by "How often do you sit down to dinner with your family?", by gender (%)
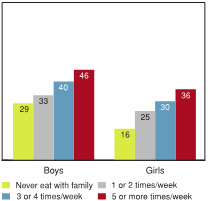
![[Click to enlarge Figure 3.26]](/content/dam/phac-aspc/migration/phac-aspc/hp-ps/dca-dea/publications/hbsc-mental-mentale/assets/images/fig_3-26_lg-eng.gif)
[Text Equivalent, Figure 3.26]
Figure 3.26 shows the percentage of students reporting high levels of emotional well‑being based on how often they sit down to eat dinner with their family. The graph shows that 29% of boys who never sit down to eat dinner with their family report high levels of emotional well‑being, compared to 33% of boys who do it once or twice per week, 40% of boys who do it 3 or 4 times per week, and 46% of boys who do it five or more times per week. On the same question, 16% of girls who never sit down to eat dinner with their family report high levels of emotional well‑being, compared to 25% of girls who do it once or twice a week, 30% of girls who do it 3 or 4 times per week, and 36% of girls who do it 5 or more times per week.
3.27 Students reporting high levels of prosocial behaviour by "How often do you sit down to dinner with your family?", by gender (%)
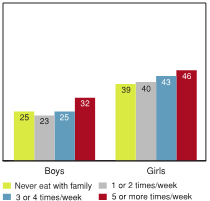
![[Click to enlarge Figure 3.27]](/content/dam/phac-aspc/migration/phac-aspc/hp-ps/dca-dea/publications/hbsc-mental-mentale/assets/images/fig_3-27_lg-eng.gif)
[Text Equivalent, Figure 3.27]
Figure 3.27 shows the percentage of students reporting high levels of prosocial behaviour based on how often they sit down to eat dinner with their family. The graph shows that 25% of boys who never sit down to eat dinner with their family report high levels of prosocial behaviour, compared to 23% of boys who do it once or twice per week, 25% of boys who do it 3 or 4 times per week, and 32% of boys who do it 5 or more times per week. On the same question, 39% of girls who never sit down to eat dinner with their family report high levels of prosocial behaviour, compared to 40% of girls who do it once or twice a week, 43% of girls who do it 3 or 4 times per week, and 46% of girls who do it 5 or more times per week.
What young people thought about these findings
Contrary to all the apparent evidence of young people rebelling against parental control and influence over their lives, the youth attending the workshop were almost unanimous in their acknowledgement of the important roles that parents and positive home environments play in influencing the health and happiness of young people.
Youth attending the workshop provided examples from their own lives. They also talked about their peers, citing examples where they felt negative home environments were responsible for poor health choices and risky behaviour. The overriding theme, however, seemed to be how supportive parents, that young people could count on, were so very important to their mental health. Safety was a theme that some young people touched on. The fact that home could be a safe place, a refuge from life's problems, was a recurring idea.
The importance of having a parent or parents to confide in and go to for advice and consolation was also raised. The young people pointed out the importance of parents as role models, for how they conducted themselves, in shaping their personal morals and ethics, and influencing how they interacted with others in their formative years. There was a clear recognition that young people are the products of their home environments, good or bad, and the lessons they learn from their home environment are critical to their own life choices and behaviours. Perhaps somewhat surprisingly, there was a clear message of appreciation for parents and the value of a positive home environment as a critical foundation for their own health and well‑being.
Summary and implications
Key issues of concern
- About one-third of young people feel that their parents' expectations of them are too high both generally and at school.
- Adolescent girls are less positive than boys on many of the measures of relationships with parents and a positive home life.
- The strong relationship between mental health and a positive home life has clearer negative implications for the mental health of girls relative to that of boys.
- Though boys and girls are equally likely to feel they can talk to their mother about things that really bother them, girls are much less likely to find it easy to talk to their father.
Key issues to celebrate
- The vast majority of young Canadians have positive relationships with their parents and have a happy home life.
- Three-quarters or more of both boys and girls in all grade groups find it easy to talk to their mother about things that really bother them.
- There has been considerable improvement in students' relationships with their parents in the 2000s, compared to how students felt about these relationships from 1990 to 1998.
- The vast majority of young people, and particularly boys, have a positive home life that contributes to positive mental health.
Commentary
The descriptive findings that appear in this chapter highlight that the majority of Canadian youth have positive home environments and relationships with their parents. On the general measure of "I have a happy home life", the vast majority of boys, but fewer girls (between 7% and 11% less for each of the grade levels) agree with this statement. Students are less likely to indicate they have a happy home life as they get older.
Almost one-third of the students participating in the survey indicated that they were not living with both birth parents. It is perhaps not a great discovery that for young people not living with both parents, there can be negative implications for mental health. It is worth noting though, that when socio-economic status is controlled for, the negative implications are small.
This chapter reports on a number of specific aspects of relationships with parents. Being able to go to parents for advice and consolation around the problems young people face, and for communication around everyday issues, are each important facets of relationships with parents. The vast majority of young people find it easy to talk to at least one parent. This ease in communicating, like the sense of emotional well‑being and prosocial behavior, diminishes as they get older. Students are more likely to find it easy to talk to their mother than their father and father/daughter communication is particularly difficult. Young people who find it easier to communicate with their father and mother are less likely to have emotional or behavioural problems and more likely have emotional well‑being and report high levels of prosocial behavior. There is a clear connection between better mental health status and being able to communicate with parents.
Girls respond more negatively than boys on many of the measures of relationships with parents. For the items, having a happy home life, ease of talking to father, feeling understood by their parents, having a lot of arguments with their parents, and feeling they want to leave home at times, girls are much more likely than boys to respond negatively. There is also a tendency for the gap between boys and girls to increase with age.
The proportion of young people sitting down for dinner together with their families five of more days a week, is less than three-quarters for both boys and girls for all grades and decreases as they get older to the point where only half of Grade 10 girls and 56% of Grade 10 boys eat dinner as a family regularly. Eating dinner more regularly as a family has a strong positive relationship with young people's mental health across all four of the measures examined.
Supportive and caring parenting practices are crucial to the positive development of children and youth. Evidence shows that a strong and nurturing caregiver-child relationship supports the development of a child who is physically, psychologically, intellectually, and socially healthy and who is more resilient to determinants of ill health.
—Kail & Barnfield, 2009
Data are presented on trends over time for four parent relationship items. With one exception, the results are indicative of a general historical pattern where there was an increase in the positivity of student responses in 2002 over the years 1990 to 1998 and a leveling out over the last three cycles from 2002 to 2010. Student responses for 2010 are similar to how they felt about their relationships with parents in 2002 and 2006.
In summary, this chapter provides simple descriptive information on some of the key dimensions of the relationships young Canadians have with their parents, and examines how these relationships relate to mental health. The home environment is clearly a critical foundation for young people's mental health and is necessarily an important consideration in any strategy aimed at improving these aspects of young people's lives. In short, parenting and the quality of home environments are clearly of vital importance to the lives of young people in Canada.
References
- Bremner, P., Burnett, J., Nunney, F., Ravat, M. & Mistral, W. (2011). Young People, Alcohol and Influences. Joseph Rowntree Foundation. Available at: http://www.jrf.org.uk/publications/young-people-alcohol-and-influences, Accessed June, 2011.
- Bulanda, R. and Majumdar, D. (2009). Perceived parent-child relations and adolescent self-esteem. Journal of Child and Family Studies, 18:203-212.
- Collins, W.A. & Steinberg, L. (2006). Adolescent development in interpersonal context. In W. Damon, & R. M. Lerner (Eds.), Handbook of Child Psychology (pp. 1003-1067). Hoboken, NJ: John Wiley & Sons Inc.
- Currie, C, Nic Gabhainn, S., Godeau, E., Roberts, C., Smith, R., Currie, D., Pickett, W., Richter, M., Morgan, A. & Barnekow, V. (Eds.) (2008) Inequalities in young people's health: HBSC international report from the 2005/06 survey. Health Policy for children and adolescents, No. 5 (pp. 21-25), WHO Regional Office for Europe, Copenhagen, Denmark.
- Gribble, A., Cowen, E.L., Wyman, P.A., Work, W.C, Wannon, M. & Raog, A. (1993). "Parent and Child Views of Parent-Child Relationship, Qualities and Residual Outcomes among Urban Children." Journal of Child Psychology and Psychiatry, 34:507-519.
- Gutman, L.M., & Eccles, J.S. (2007). Stage-environment fit during adolescence: Trajectories of family relations and adolescent outcomes. Developmental Psychology, 43:522-537.
- Kail, R.V. & Barnfield. A.M.C. (2009). Children and their development (Canadian ed). Toronto, ON: Pearson Canada.
- Morris, A.S., Silk, J.S., Steinberg, L., Myers, S.S., & Robinson, L.R. (2007). The role of the family context in the development of emotion regulation. Social Development, 16:361-388.
- Nunes-Costa, R.A., Lamela, D.J.P.V., & Figueiredo, B.F.C. (2009). Psychosocial adjustment and physical health in children of divorce. Jornal de Pediatria, 85:385-396.
- Parke, R.D., & Buriel, R. (2006). Socialization in the family: Ethnic and ecological perspectives. In W. Damon, & R. M. Lerner (Eds.), Handbook of Child Psychology (pp. 429-504). Hoboken, NJ: John Wiley & Sons Inc.
- Steinberg, L. (2001). We know some things: Parent-adolescence relationships in retrospect and prospect. Journal of Research on Adolescence, 11:1-19.
- Weinstein, M. (2005). The surprising power of family meals: How eating together makes us smarter, stronger, healthier, and happier. Hanover, NH: Steerforth Press.
- Woodruff, S. J., & Hanning, R.M. (2009). Associations between family dinner frequency and specific food behaviors among grade six, seven, and eight students from Ontario and Nova Scotia. Journal of Adolescence, 44:431-436.
Page details
- Date modified: