
Chapter 8: The Health of Canada's Young People: a mental health focus – Healthy living
Healthy living
by Ian Janssen, Mariane Héroux, and Valerie Carson
What is healthy living?
Healthy living refers to the engagement in behaviours that are consistent with supporting, improving, maintaining, and/or enhancing health. This chapter will focus on physical activity, sedentary behaviours, and healthy eating. Other negative aspects of healthy living, such as smoking, alcohol, and drug use are covered in Chapter 10.
What is physical activity?
In its simplest sense, physical activity is defined as any bodily movement produced by the muscles that result in an increase in energy expenditure. Physical activity therefore includes non-vigorous tasks, such as light walking, and moderate or vigorous tasks, such as brisk walking, jogging/running, bicycling, playing soccer, and playing basketball. In general, physical activities of moderate-to-vigorous intensity will make the individual breathe more deeply and rapidly and increase his or her body temperature (e.g., make them feel warm and sweat).
In young people, physical activity needs to be of at least a moderate intensity to generate health benefits.
—Janssen & LeBlanc, 2010.
Although routine engagement in physical activity has numerous health benefits, these benefits do not motivate young people to be physically active. Rather, young people participate in physical activity for fun and enjoyment, and for social reasons. However, parents, health-care practitioners, and policy-makers are interested in the health benefits that young people receive when they engage in an appropriate amount of physical activity. The physical health benefits of regular physical activity in young people include improved fitness, and the development of healthy and strong bones, as well as the regulation of body weight and chronic-disease risk factors (e.g., high blood pressure, elevated blood cholesterol, Janssen & LeBlanc, 2010). For more information on the appropriate volume, intensity, and types of physical activity needed for health benefits, please refer to Canada's new Physical Activity Guidelines for Children and Youth .
What is sedentary behaviour?
Sedentary behaviour is different from physical activity and consists of activities in which there is little movement or energy expenditure (Tremblay, Colley et al., 2010). These activities include watching television, playing video games, using the computer, doing homework, reading, and motorized travel. It is impossible for anyone to be physically active during all waking hours. Thus, the goal is not to eliminate all sedentary behaviour, but rather to keep young people's sedentary behaviour to a reasonable and healthy level. Increased time spent engaging in sedentary behaviour, especially screen-time activities, such as watching television, using the computer, and playing video games, has been linked to several negative health outcomes. For example, obesity, unhealthy eating, decreased fitness, and substance use and abuse are all thought to be associated with excessive screen time (Tremblay, Colley et al., 2010). It is important to note that sedentary behaviours are related to these health outcomes independent of moderate-to-vigorous physical activity levels (Tremblay, Colley et al., 2010). Many people who engage in a considerable amount of sedentary behaviour also engage in moderate-to-vigorous activity (Tremblay, Colley et al., 2010). Refer to Canada's new Sedentary Behaviour Guidelines for Children and Youth .
Healthy eating
Food frequency. Food frequency refers to the number of times a person eats a given food item over a period of time (e.g., day, week, month). Healthy and nutritious food items need to be part of a healthy eating pattern. Eating Well with Canada's Food Guide describes what amount of food people need and what type of food is part of a healthy eating pattern. Following the eating pattern in Canada's Food Guide will help children two years and older get the nutrients and calories they need for healthy growth and development. An important step towards better health and a healthy body weight is to eat the recommended amount and type of food each day and to limit the consumption of unhealthy foods and beverages that are high in calories, fat, sugar or salt.
Eating behaviours. Eating behaviours refer to the habits of when, what, where, and why one eats. Excessive snacking while watching TV or while playing video games, should be avoided as the foods eaten during these activities tend to be high in fat, sugar, and salt, and can contribute to excessive weight gain and obesity (Gore, Foster et al., 2003). Youth should also avoid frequently eating at fast food restaurants, as most of the foods sold at these establishments, while affordable, are high in calories and linked to obesity and poor health (Bowman, Gortmaker et al., 2004).
What are we reporting in this chapter?
We asked students to indicate how many days in a typical week they were physically active at a moderate-to-vigorous intensity for at least 60 minutes. Young people who reported 60 minutes or more of physical activity seven days of the week were considered to be physically active, while those participating in lesser amounts were considered to be physically inactive (Janssen & LeBlanc, 2010). Students also reported the number of hours in a typical week in which they exercised or were physically active during class time at school, during free time at school, and during free time outside of school hours. Information about the frequency of exercise in free time outside of school hours was also gathered. Also, a new item was added to the 2010 HBSC regarding students' primary mode of transportation to school. Active transportation (e.g., walking or cycling) to school provides an additional opportunity, outside of sport and play, for young people to accumulate physical activity during their day.
A series of questions was used to determine how many hours in an average day young people engaged in the following sedentary behaviours: watching television (including videos and DVDs), playing video games on a computer or console (Playstation, Xbox, GameCube, etc.), and using a computer in free time (including doing homework, chatting online, internet browsing, emailing, etc.). Two hours or more per day for each of these screen-time activities was considered excessive (Canadian Paediatric Society, 2003).
Students were asked to report how frequently they consumed a number of foods and beverages. For each food or beverage, response options ranged from as low as 'never' to as high as 'more than once per day'. Within the HBSC study, young people who consumed a given food or beverage once per day or more often were considered to be high consumers.
To assess eating behaviours, three questions were included for the first time in the 2010 HBSC. Two of these questions assessed how often youth eat while watching TV and while using a computer or video game console. The third question asked was how frequently they eat at fast food restaurants.
Effects of healthy living on mental health
Along with several benefits to a young person's physical health, engagement in healthy living behaviours has numerous mental health benefits. For example, regular physical activity in young people is associated with improved self-efficacy and self-image and a decrease in depression symptoms (Janssen & LeBlanc, 2010). Excessive sedentary behaviour on the other hand is associated with violent and aggressive behaviours, body image issues, and poor self-esteem (Tremblay, Colley et al., 2010). Food choices and eating behaviours can also impact mental health, although the causal direction of these relationships is not always clear. For instance, eating unhealthy foods may contribute to the development of mental health issues, and mental health issues may also impact the food choices and eating behaviours a young person makes.
Physical activity
Physical activity levels of young Canadians
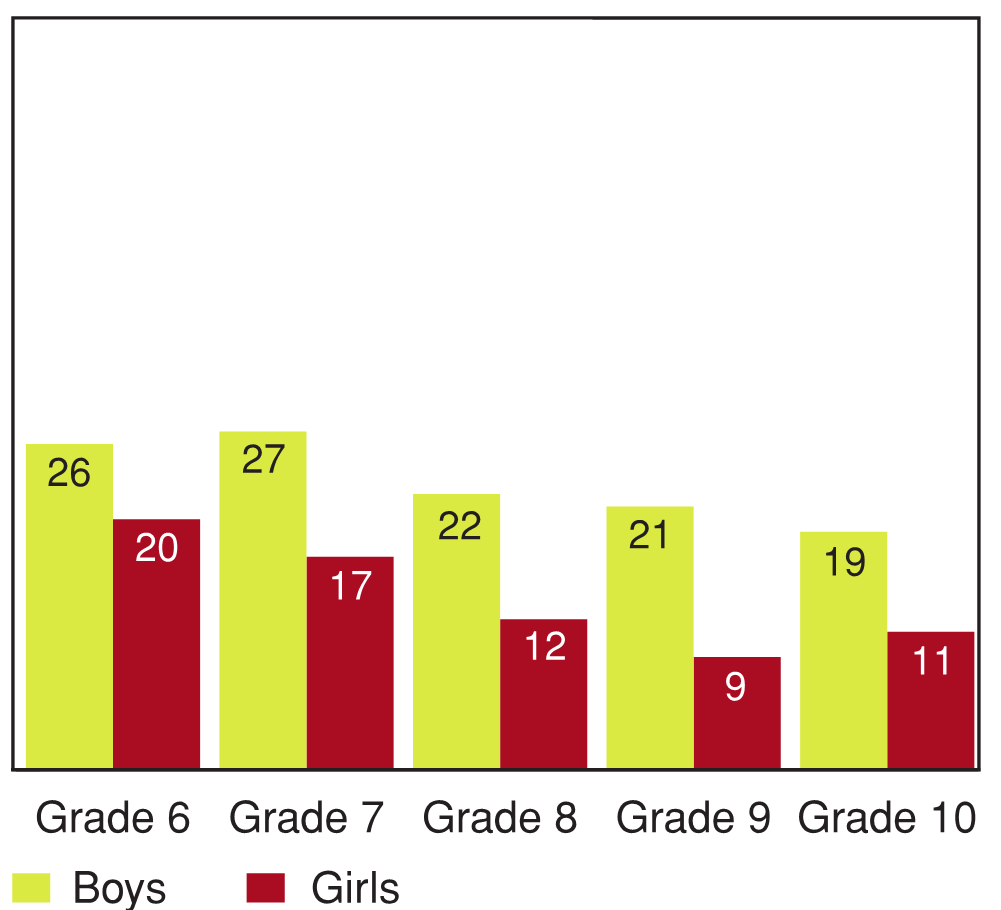
8.1 Students who are physically active daily during a typical week for at least 60 minutes per day, by grade and gender (%)
[Text Equivalent, Figure 8.1]
8.1 Students who are physically active daily during a typical week for at least 60 minutes per day, by grade and gender (%)
Figure 8.1 shows the percentage of students who are physically active on a daily basis during a typical week for at least 60 minutes per day, by grade and gender. The graph shows that 26% of Grade 6 boys are physically active on a daily basis for at least 60 minutes per day, compared to 27% of Grade 7 boys, 22% of Grade 8 boys, 21% of Grade 9 boys, and 19% of Grade 10 boys. On the same question, 20% of Grade 6 girls are physically active on a daily basis for at least 60 minutes per day, compared to 17% of Grade 7 girls, 12% of Grade 8 girls, 9% of Grade 9 girls, and 11% of Grade 10 girls.
Figure 8.1 shows that between 19 and 27% of boys are physically active for at least 60 minutes on a daily basis. Only 9 to 20% of girls achieve this level of activity. The proportion of students who were physically active at this level declined between Grade 6 and Grade 10 for both boys and girls.
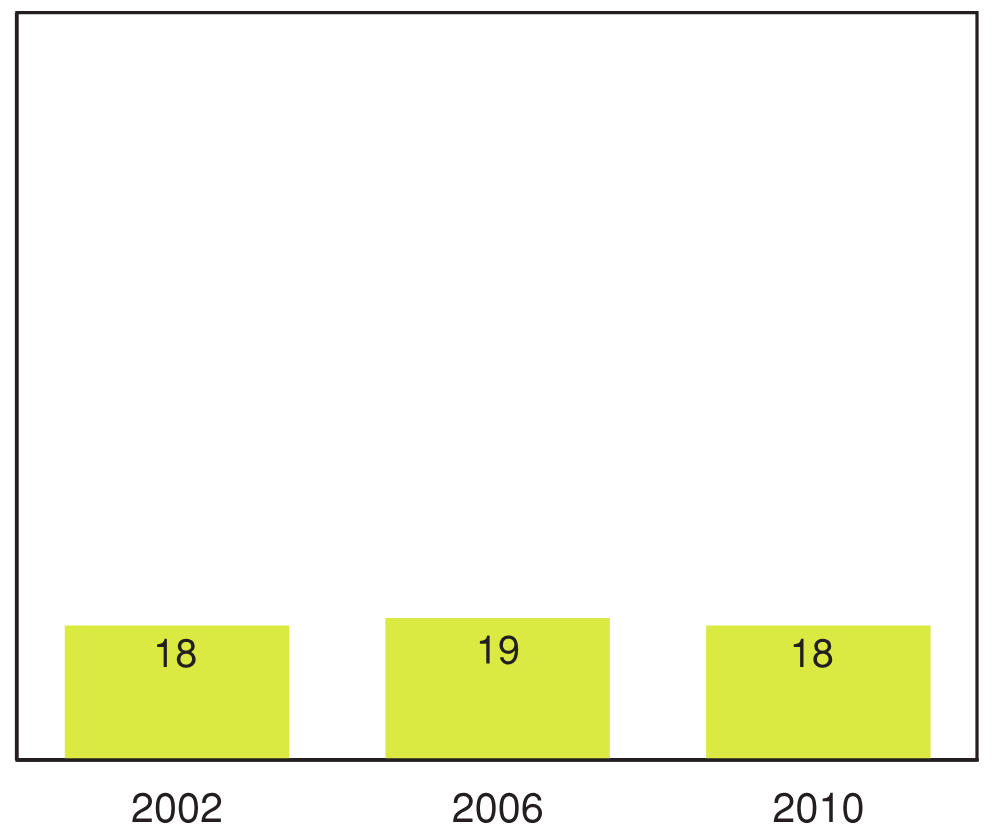
8.2 Students who are physically active daily during a typical week for at least 60 minutes per day, in 2002, 2006 and 2010 (%)
[Text Equivalent, Figure 8.2]
8.2 Students who are physically active daily during a typical week for at least 60 minutes per day, in 2002, 2006 and 2010 (%)
Figure 8.2 shows the percentage of students who are physically active on a daily basis during a typical week for at least 60 minutes per day, by year of survey. The graph shows that in 2002, 18% of students were physically active on a daily basis for at least 60 minutes per day, compared to 19% in 2006 and 18% in 2010.
The proportion of students who accumulated 60 minutes of physical activity on a daily basis remained stable (within 1 percentage point) between the 2002, 2006, and 2010 HBSC surveys (Figure 8.2).
8.3 Spending four or more hours per week doing physical activities in class time at school, by grade and gender (%)
[Text Equivalent, Figure 8.3]
8.3 Spending four or more hours per week doing physical activities in class time at school, by grade and gender (%)
Figure 8.3 shows the percentage of students who spend four or more hours per week doing physical activities during class time at school, by grade and gender. The graph shows that 29% of Grade 6 boys spend four or more hours per week doing physical activities during class time, compared to 27% of Grade 7 boys, 27% of Grade 8 boys, 34% of Grade 9 boys, and 36% of Grade 10 boys. On the same question, 23% of Grade 6 girls spend four or more hours per week doing physical activities during class time, compared to 25% of Grade 7 girls, 21% of Grade 8 girls, 28% of Grade 9 girls, and 22% of Grade 10 girls.
Figure 8.3 shows that 27-36% of boys and 21-28% of girls reported participating in four or more hours of moderate-to-vigorous physical activities in the past week during class time at school. Boys were more likely than girls to accumulate four or more hours of physical activity in class time at school in all grades.
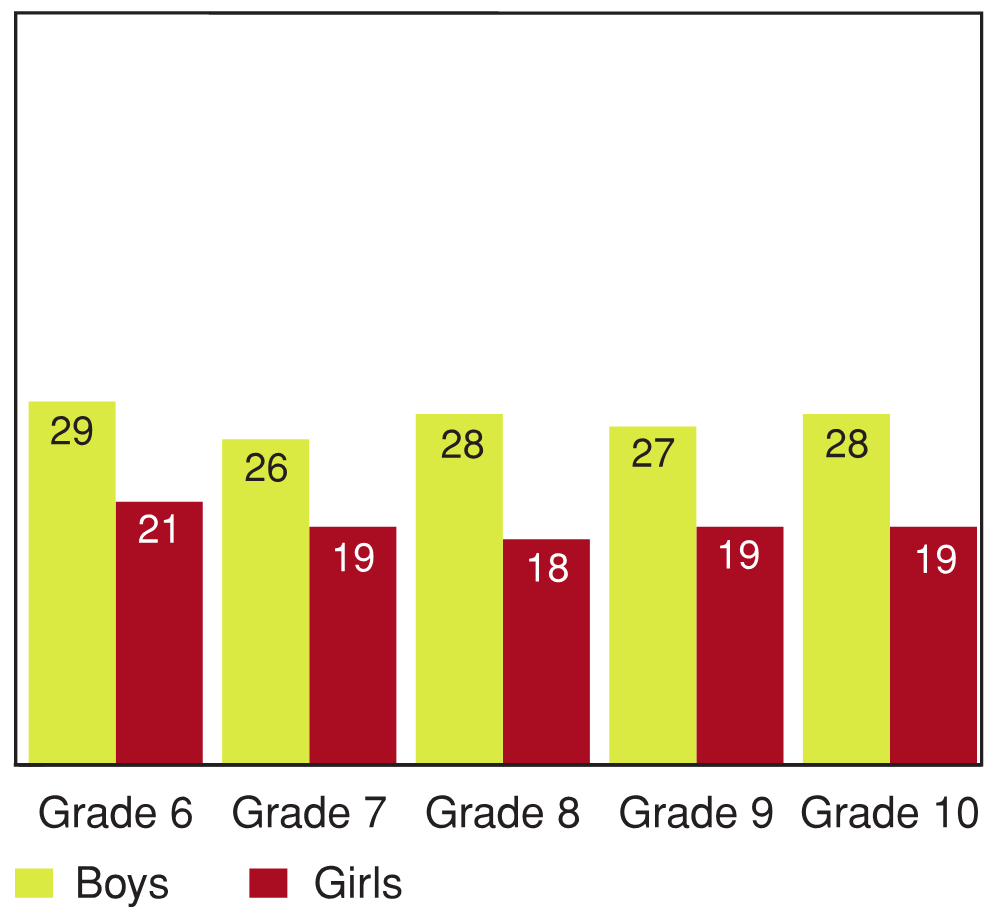
8.4 Spending four or more hours per week doing physical activities in free time at school, by grade and gender (%)
[Text Equivalent, Figure 8.4]
8.4 Spending four or more hours per week doing physical activities in free time at school, by grade and gender (%)
Figure 8.4 shows the percentage of students spending four or more hours per week doing physical activities during free time at school, by grade and gender. The graph shows that 29% of Grade 6 boys spend four or more hours per week doing physical activities during free time at school, compared to 26% of Grade 7 boys, 28% of Grade 8 boys, 27% of Grade 9 boys, and 28% of Grade 10 boys. On the same question, 21% of Grade 6 girls spend four or more hours per week doing physical activities during free time at school, compared to 19% of Grade 7 girls, 18% of Grade 8 girls, 19% of Grade 9 girls, and 19% of Grade 10 girls.
On average, 28% of boys and 19% of girls reported participating in four or more hours of moderate-to-vigorous physical activities in the past week in their free time at school (Figure 8.4). Boys were more likely than girls to accumulate four or more hours per week of physical activity in free time at school in all grades. Physical activity participation rates in free time at school remained relatively stable (within 3 percentage points) from Grade 6 to Grade 10 for both boys and girls.
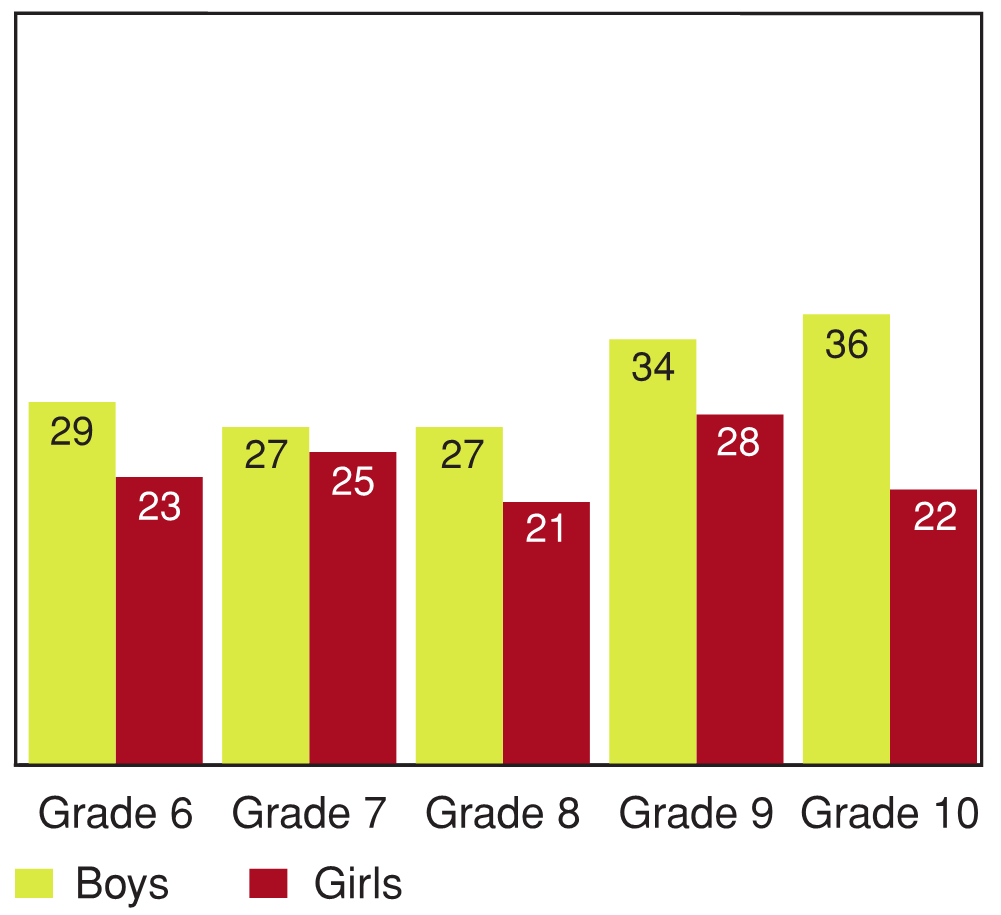
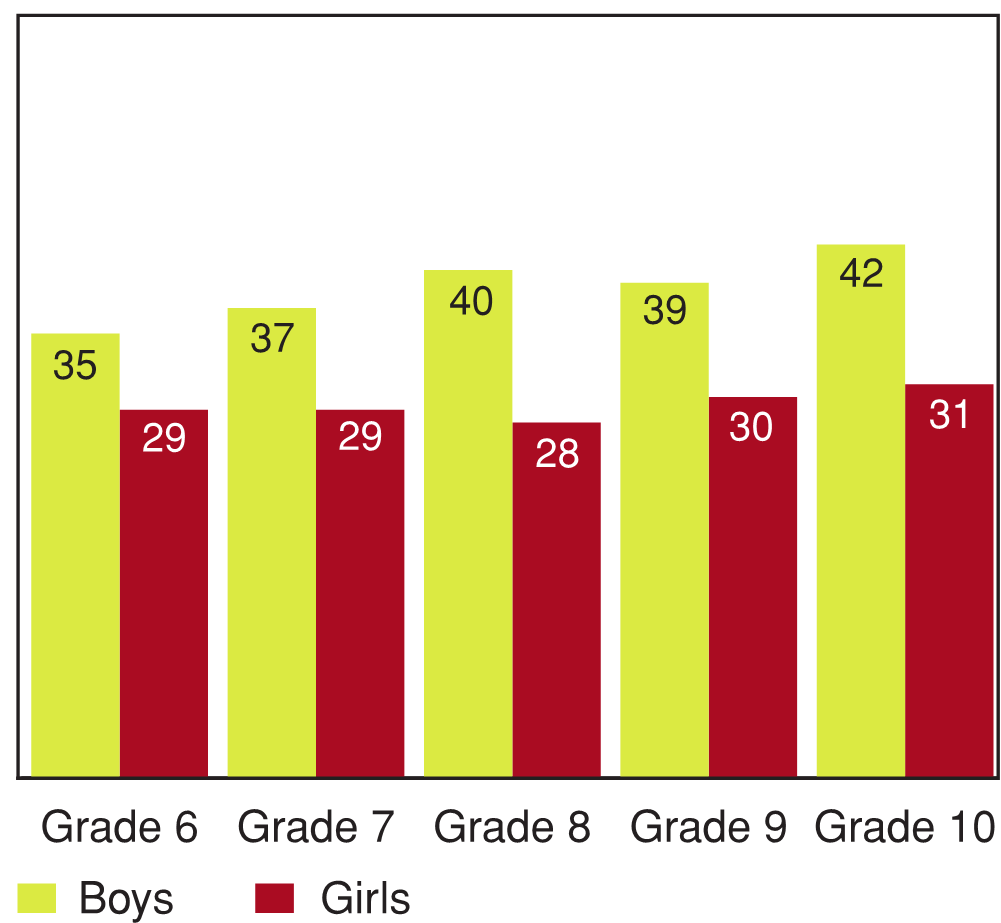
8.5 Spending four or more hours per week doing physical activities outside of school hours, by grade and gender (%)
[Text Equivalent, Figure 8.5]
8.5 Spending four or more hours per week doing physical activities outside of school hours, by grade and gender (%)
Figure 8.5 shows the percentage of students spending four or more hours per week doing physical activities outside of school hours, by grade and gender. The graph shows that 35% of Grade 6 boys spend four or more hours per week doing physical activities outside of school hours, compared to 37% of Grade 7 boys, 40% of Grade 8 boys, 39% of Grade 9 boys, and 42% of Grade 10 boys. On the same question, 29% of Grade 6 girls spend four or more hours per week doing physical activities outside of school hours, compared to 29% of Grade 7 girls, 28% of Grade 8 girls, 30% of Grade 9 girls, and 31% of Grade 10 girls.
From 35 to 42% of boys across the grades and approximately 30% of girls reported participating in four or more hours of moder-ate-to-vigorous physical activities in the past week outside of school hours (Figure 8.5). As with physical activity at school, rates of physical activity participation outside of school were higher for boys than for girls in all grades.
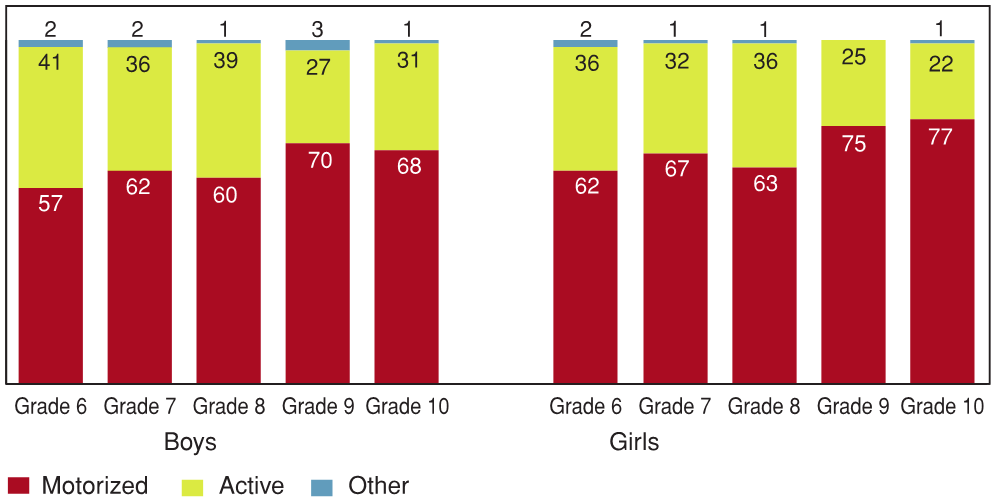
[Text Equivalent, Figure 8.6]
8.6 Transportation to school, by grade and gender (%)
Figure 8.6 shows the type of transportation used by students to get to school, by grade and gender, expressed as a percentage. The graph shows that 57% of Grade 6 boys use motorized transportation to get to school, compared to 62% of Grade 7 boys, 60% of Grade 8 boys, 70% of Grade 9 boys, and 68% of Grade 10 boys. 41% of Grade 6 boys use active transportation to get to school, compared to 36% of Grade 7 boys, 39% of Grade 8 boys, 27% of Grade 9 boys, and 31% of Grade 10 boys. 2% of Grade 6 boys use other forms of transportation to get to school, compared to 2% of Grade 7 boys, 1% of Grade 8 boys, 3% of Grade 9 boys, and 1% of Grade 10 boys. On the same question, 62% of Grade 6 girls use motorized transportation to get to school, compared to 67% of Grade 7 girls, 63% of Grade 8 girls, 75% of Grade 9 girls, and 77% of Grade 10 girls. 36% of Grade 6 girls use active transportation to get to school, compared to 32% of Grade 7 girls, 36% of Grade 8 girls, 25% of Grade 9 girls, and 22% of Grade 10 girls. 2% of Grade 6 girls use other forms of transportation to get to school, compared to 1% of Grade 7 girls, 1% of Grade 8 girls, 0% of Grade 9 girls, and 1% of Grade 10 girls.
Figure 8.6 shows that 57 to 77% of boys and girls across grades used motorized transport for the main part of their journey to school. Only 27 to 41% of boys and 22 to 36% of girls used active transport (e.g., walking or bicycling) for the main part of their journey to school.
Sedentary behaviours of Canadian young people
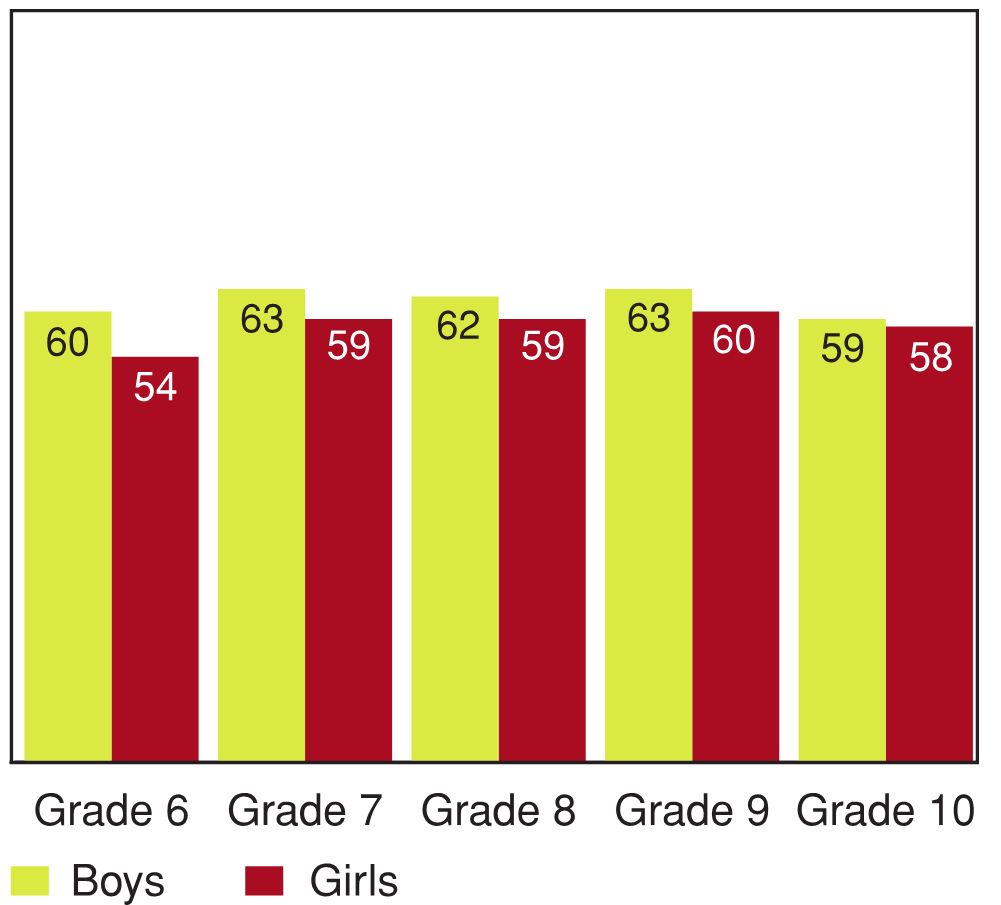
8.7 Watching two or more hours of television per day, by grade and gender (%)
[Text Equivalent, Figure 8.7]
8.7 Watching two or more hours of television per day, by grade and gender (%)
Figure 8.7 shows the percentage of students who watch two or more hours of television per day, by grade and gender. The graph shows that 60% of Grade 6 boys watch two or more hours of television per day, compared to 63% of Grade 7 boys, 62% of Grade 8 boys, 63% of Grade 9 boys, and 59% of Grade 10 boys. On the same question, 54% of Grade 6 girls watch two or more hours of television per day, compared to 59% of Grade 7 girls, 59% of Grade 8 girls, 60% of Grade 9 girls, and 58% of Grade 10 girls.
Figure 8.7 illustrates that more than 50% of young people across gender and grade categories reported watching two or more hours of television per day. Slightly more boys than girls watch two or more hours of television per day.
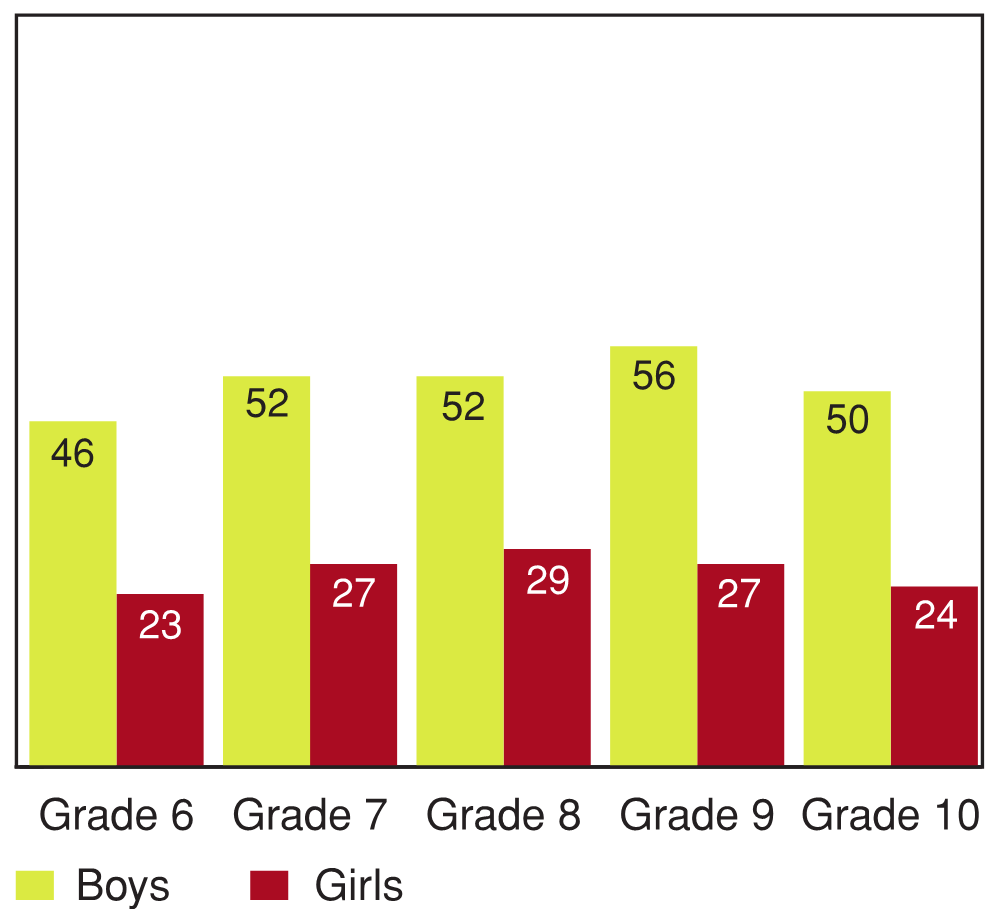
8.8 Playing video games for two hours or more per day, by grade and gender (%)
[Text Equivalent, Figure 8.8]
8.8 Playing video games for two hours or more per day, by grade and gender (%)
Figure 8.8 shows the percentage of students who play video games for two hours or more per day, by grade and gender. The graph shows that 46% of Grade 6 boys play video games for two hours or more per day, compared to 52% of Grade 7 boys, 52% of Grade 8 boys, 56% of Grade 9 boys, and 50% of Grade 10 boys. On the same question, 23% of Grade 6 boys play video games for two hours or more per day, compared to 27% of Grade 7 girls, 29% of Grade 8 girls, 27% of Grade 9 girls, and 24% of Grade 10 girls.
About one-half of boys and one-quarter of girls play video games for two hours or more per day on average (Figure 8.8). Approximately twice as many boys than girls play video games for two or more hours per day, irrespective of grade.
8.9 Using the computer in free time for two hours or more per day, by grade and gender (%)
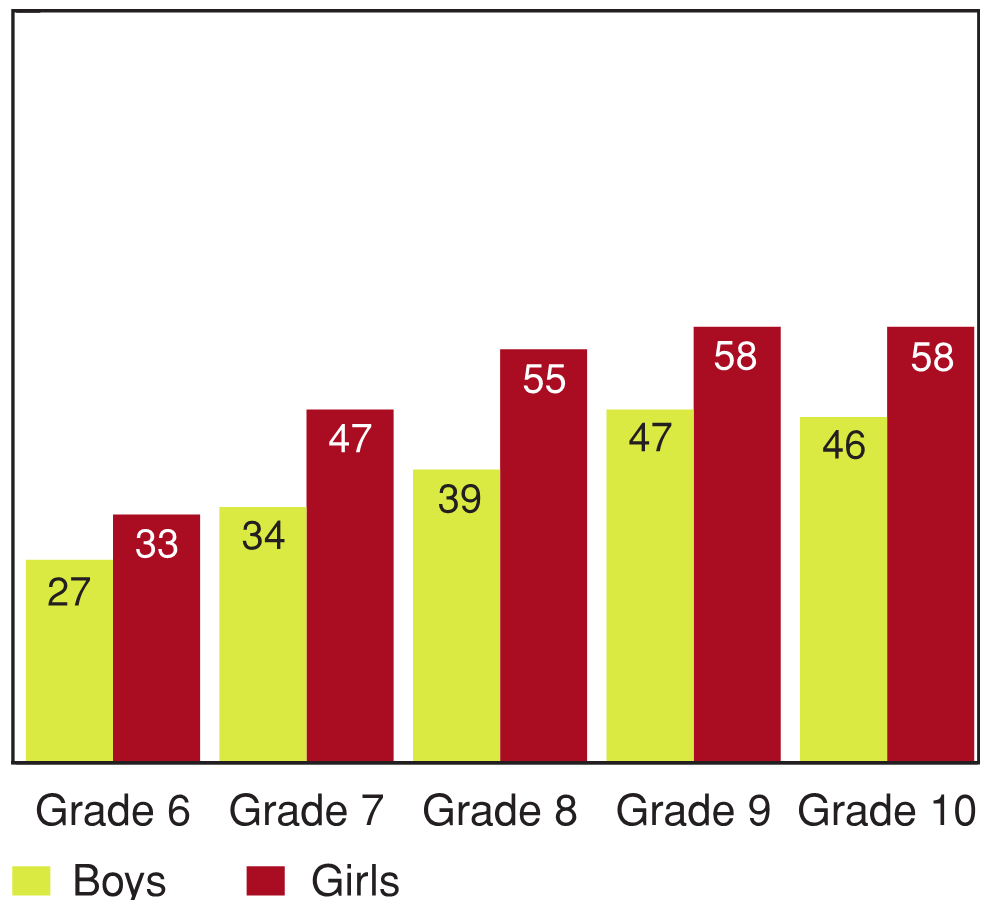
[Text Equivalent, Figure 8.9]
8.9 Using the computer in free time for two hours or more per day, by grade and gender (%)
Figure 8.9 shows the percentage of students who use computers in their free time for two hours or more per day, by grade and gender. The graph shows that 27% of Grade 6 boys use computers in their free time for two hours or more per day, compared to 34% of Grade 7 boys, 39% of Grade 8 boys, 47% of Grade 9 boys, and 46% of Grade 10 boys. On the same question, 33% of Grade 6 girls use computers in their free time for two hours or more per day, compared to 47% of Grade 7 girls, 55% of Grade 8 girls, 58% of Grade 9 girls, and 58% of Grade 10 girls.
As illustrated in Figure 8.9, the percentage of students using the computer in their free time for two or more hours per day, on average, was higher in girls (up to 58%) than in boys (up to 47%). The percentage of students using the computer in their free time for two or more hours per day increased by 25% between Grade 6 and Grade 10 in girls, and by 19% between Grade 6 and Grade 10 in boys.
Food frequency patterns in Canadian young people
Table 8.1 lists the percentage of students who consume various food and beverage items once or more per day. Compared to boys, a higher percentage of girls consume fruits and vegetables at least once daily. In all gender and grade categories, 53% or fewer of the students surveyed indicated that they consumed fruits or vegetables at least once a day (Table 8.1). Although food frequency rates do not provide information on portion sizes and the total number of servings, the fact that only half of Canadian young people report eating fruits and vegetables at least once a day is of concern given that Canada's Food Guide recommends that children and teens (between 9 and 18 years of age) eat between six and eight servings of fruits and vegetables per day.
| Food Item | Gender | Grade | ||||
|---|---|---|---|---|---|---|
| Grade 6 | Grade 7 | Grade 8 | Grade 9 | Grade 10 | ||
| Fruits | Boys | 44 | 41 | 40 | 36 | 37 |
| Girls | 53 | 50 | 47 | 43 | 46 | |
| Fruit juice | Boys | 41 | 39 | 39 | 36 | 36 |
| Girls | 44 | 41 | 42 | 38 | 39 | |
| Vegetables | Boys | 40 | 39 | 40 | 38 | 39 |
| Girls | 50 | 47 | 48 | 46 | 49 | |
| Dark green vegetables (broccoli, spinach, chard, etc.) | Boys | 15 | 14 | 14 | 11 | 13 |
| Girls | 17 | 16 | 17 | 14 | 16 | |
| Orange vegetables (carrots, squash, sweet potato, etc.) | Boys | 20 | 15 | 15 | 12 | 13 |
| Girls | 21 | 17 | 16 | 13 | 16 | |
| Whole grain breads or cereals (oatmeal, muesli, etc.) | Boys | 43 | 42 | 42 | 37 | 37 |
| Girls | 43 | 38 | 40 | 38 | 40 | |
| Meat alternatives (beans, lentils, tofu, eggs, peanut butter, etc.) | Boys | 29 | 33 | 33 | 32 | 31 |
| Girls | 35 | 37 | 37 | 31 | 30 | |
| Game from hunting (moose, caribou, venison, etc.) | Boys | 5 | 5 | 4 | 5 | 5 |
| Girls | 3 | 2 | 2 | 3 | 3 | |
| Sweets (candy or chocolate) | Boys | 17 | 16 | 18 | 21 | 20 |
| Girls | 13 | 19 | 19 | 18 | 20 | |
| Cakes, pastries or donuts | Boys | 4 | 5 | 6 | 6 | 7 |
| Girls | 2 | 4 | 4 | 3 | 5 | |
| Potato chips | Boys | 4 | 5 | 6 | 7 | 5 |
| Girls | 3 | 5 | 4 | 4 | 3 | |
| French fries | Boys | 3 | 3 | 4 | 4 | 3 |
| Girls | 1 | 3 | 2 | 1 | 1 | |
| Coke or other soft drinks that contain sugar | Boys | 10 | 14 | 16 | 19 | 17 |
| Girls | 6 | 9 | 10 | 10 | 12 | |
| Diet Coke or diet soft drinks | Boys | 3 | 4 | 5 | 5 | 6 |
| Girls | 3 | 4 | 3 | 4 | 3 | |
| Energy drinks | Boys | 2 | 3 | 4 | 4 | 3 |
| Girls | 1 | 2 | 3 | 1 | 2 | |
| Sport drinks | Boys | 7 | 8 | 8 | 8 | 6 |
| Girls | 3 | 4 | 3 | 2 | 2 | |
8.10 Eating fruits, vegetables, sweets, and sugared soft drinks once per day or more often, by year of survey (%)

[Text Equivalent, Figure 8.10]
8.10 Eating fruits, vegetables, sweets, and sugared soft drinks once per day or more often, by year of survey (%)
Figure 8.10 shows the percentage of students eating fruits, vegetables, sweets, and sugared soft drinks at least once per day, by year of survey. The graph shows that 38% of students ate fruit at least once per day in 2002, compared to 38% in 2006, and 44% in 2010. 42% of students ate vegetables at least once per day in 2002, compared to 41% of students in 2006, and 44% of students in 2010. 23% of students ate sweets at least once per day in 2002, compared to 20% in 2006, and 18% in 2010. 22% of students drank sugared soft drinks at least once per day in 2002, compared to 15% in 2006, and 12% in 2010.
Vegetable consumption was fairly stable from the 2002, 2006, and 2010 survey years (Figure 8.10). There was a positive trend in the proportion of students who ate fruit at least once a day between the 2006 and 2010 HBSC surveys (Figure 8.10).
Approximately 40% of young people reported eating whole grain breads and cereals at least once per day (Table 8.1). Although this rate does not provide direct information on total servings of these food items, the 40% rate of young people who reported eating whole grain breads and cereals at least once daily is quite low since Canada's Food Guide recommends that children and teens consume between 6 and 7 servings of grain products per day, with at least half coming from whole grains.
Regarding the unhealthy food and beverages (e.g., those high in calories and/or low in nutrients) reported in Table 8.1, 13 to 21% of students reported consuming sweets (candy or chocolate) once or more per day, with consumption rates being about the same for boys and girls, but increasing from Grade 6 to Grade 10. Sugared soft drink consumption is higher for boys than girls and higher for Grade 10 students than Grade 6 students. The percentage of students eating potato chips, cakes/pastries, and french fries once or more per day is 10% or lower. Furthermore, the percentage of students drinking diet soft drinks, energy drinks and sports drinks at least once per day is also below 10% in all gender and grade groups. It is encouraging that the percentage of frequent consumers of candy and sugared soft drinks has decreased between the 2002 and 2010 HBSC cycles (Figure 8.10).
Eating behaviours in Canadian young people
8.11 Snacking while watching TV (including videos and DVDs), by gender (%)
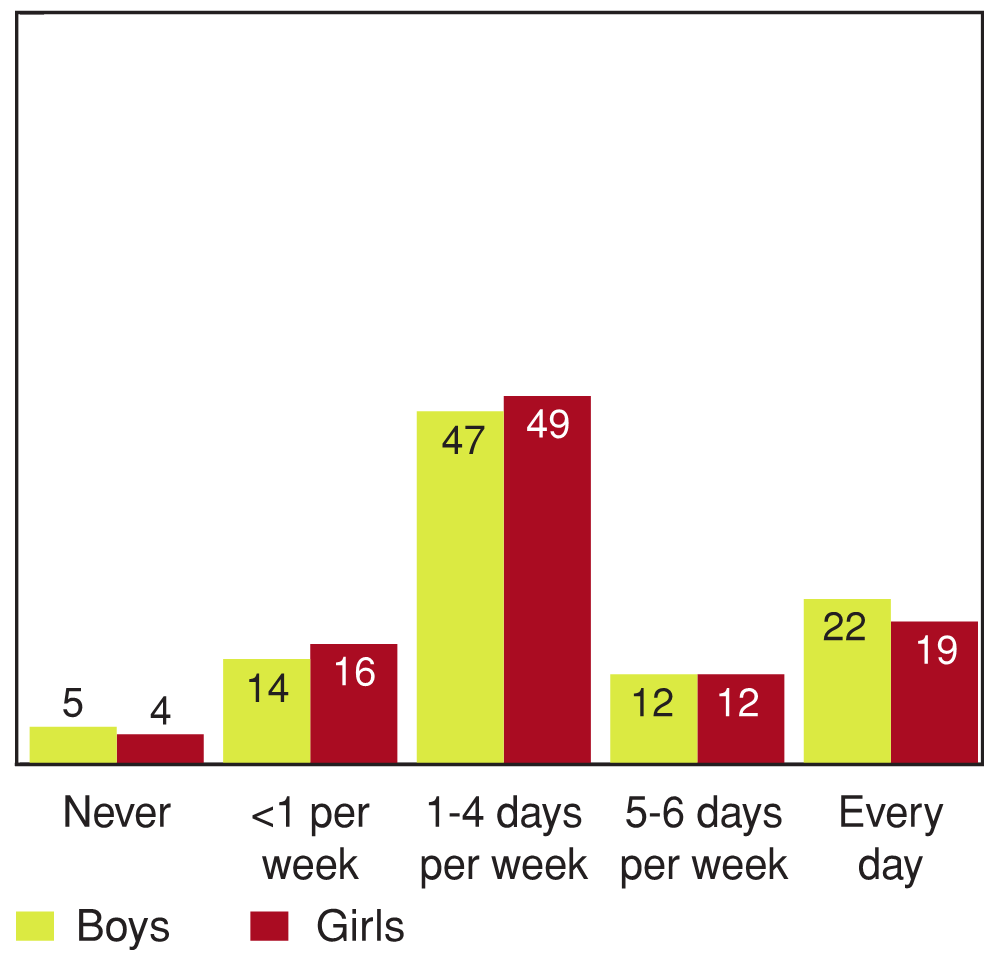
[Text Equivalent, Figure 8.11]
8.11 Snacking while watching TV (including videos and DVDs), by gender (%)
Figure 8.11 shows the percentage of students who snack while watching TV (including videos and DVDs), by gender. The graph shows that 5% of boys report never snacking while watching TV, compared to 14% less than once per week, 47% 1 to 4 days per week, 12% 5 to 6 days per week, and 22% every day. On the same question, 4% of girls report never snacking while watching TV, compared to 16% less than once per week, 49% 1 to 4 days per week, 12% 5 to 6 days per week, and 19% every day.
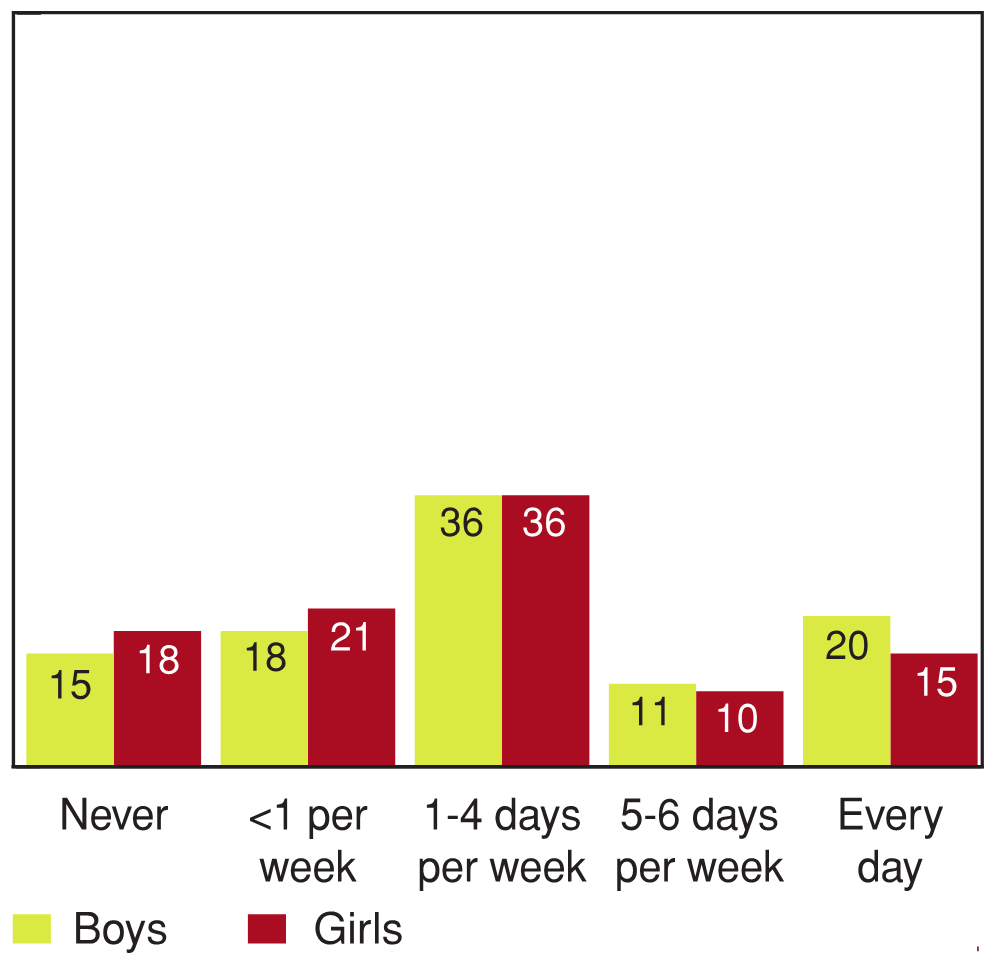
[Text Equivalent, Figure 8.12]
8.12 Snacking while working or playing on a computer or video games console, by gender (%)
Figure 8.12 shows the percentage of students who report snacking while working or playing on a computer or video games console, by gender. The graph shows that 15% of boys report never snacking while working or playing on a computer or video games console, compared to 18% less than once a week, 36% 1 to 4 days per week, 11% 5 to 6 days per week, and 20% every day. On the same question, 18% of girls never snacking while working or playing on a computer or video games console, compared to 21% less than once per week, 36% 1 to 4 days per week, 10% 5-6 days per week, and 15% every day.
Approximately eight in ten Canadian youth snack while watching TV at least once a week, and about one in four do so on a daily basis (Figure 8.11). These proportions are similar in boys and girls. Approximately six in ten Canadian youth snack while playing on the computer or a games console at least once a week, and slightly less than one in four do so on a daily basis (Figure 8.12). Proportions are similar between boys and girls.
8.13 How often do you eat in a fast food restaurant, by gender (%)
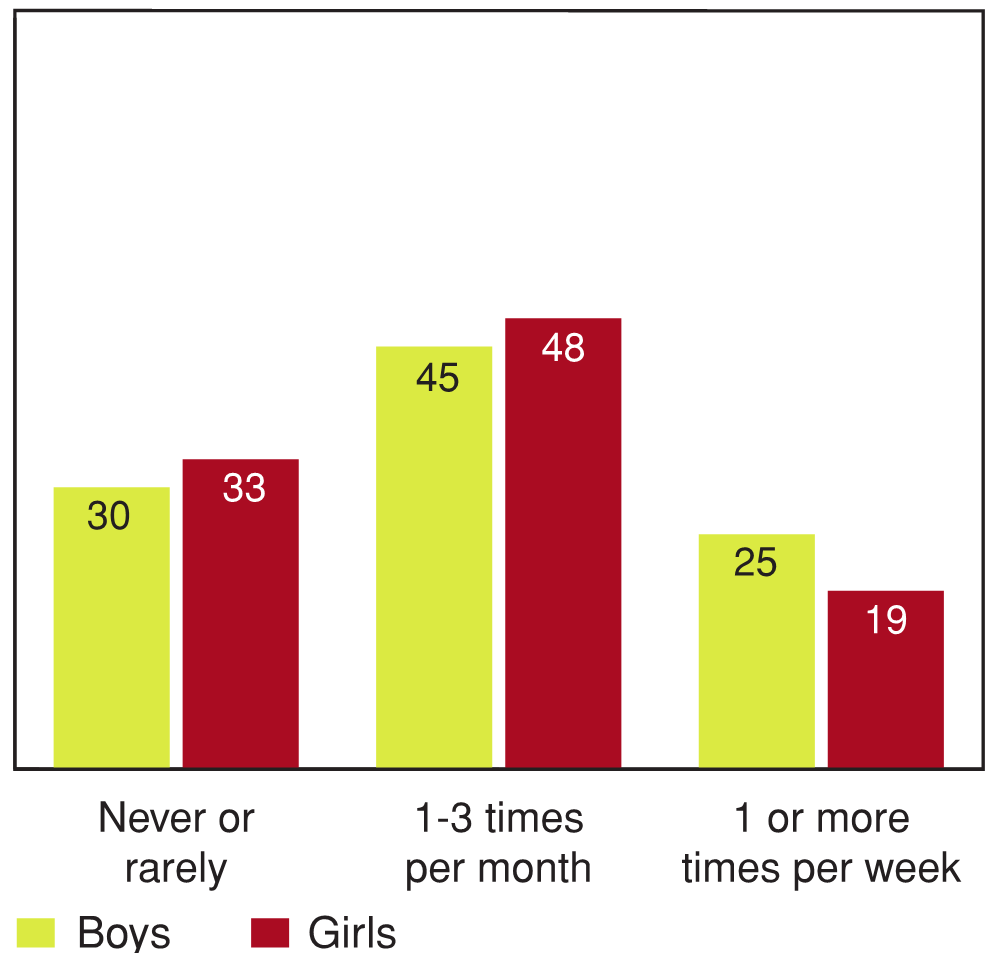
[Text Equivalent, Figure 8.13]
8.13 How often do you eat in a fast food restaurant, by gender (%)
Figure 8.13 shows how often students report eating in a fast food restaurant, by gender and expressed as a percentage. The graph shows that 30% of boys report never or rarely eating in a fast food restaurant, compared to 45% 1 to 3 times per month, and 25% 1 or more times per week. On the same question, 33% of girls report never or rarely eating in a fast food restaurant, 48% 1 to 3 times per month, and 19% 1 or more times per week.
Approximately seven in ten Canadian youth eat in a fast food restaurant at least once a month, and about one in four do so at least once a week (Figure 8.13). More boys than girls eat in a fast food restaurant at least once a week.
Relations between healthy living and mental health
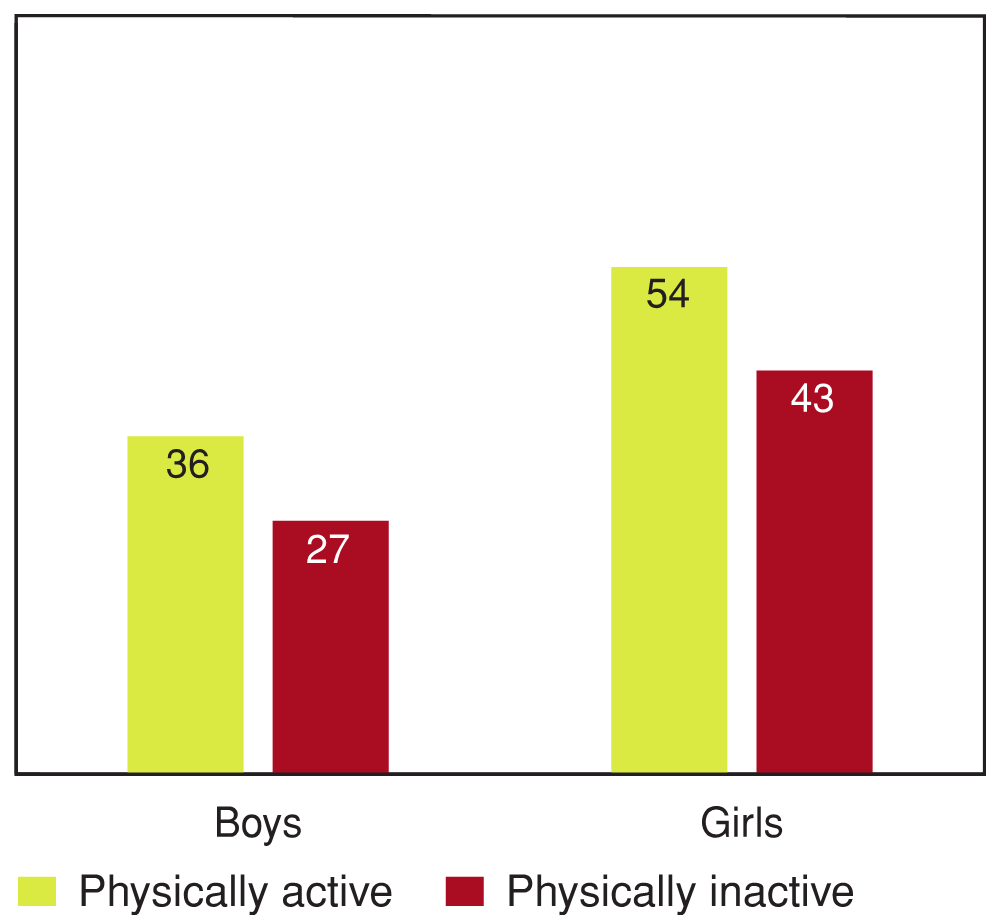
8.14 Students reporting high levels of prosocial behaviour by physical activity level, by gender (%)Footnote 1
[Text Equivalent, Figure 8.14]
8.14 Students reporting high levels of prosocial behaviour by physical activity level, by gender (%) *
Figure 8.14 shows the percentage of students who report high levels of prosocial behaviours by physical activity level, by gender. The graph shows that 36% of boys who are physically active report high levels of prosocial behaviour, compared to 27% of boys who are physically inactive. On the same question, 54% of girls who are physically active report high levels of prosocial behaviour, compared to 43% of girls who are physically inactive.
Engagement in moderate-to-vigorous physical activity was related to all four of the mental health outcomes. An example describing the relationship between physical activity and prosocial behaviour in Canadian boys and girls is shown in Figure 8.14. The proportion of physically active youth who had high prosocial behaviour scores was 9-11% higher than the proportion of physically inactive youth who had high prosocial behaviour scores.
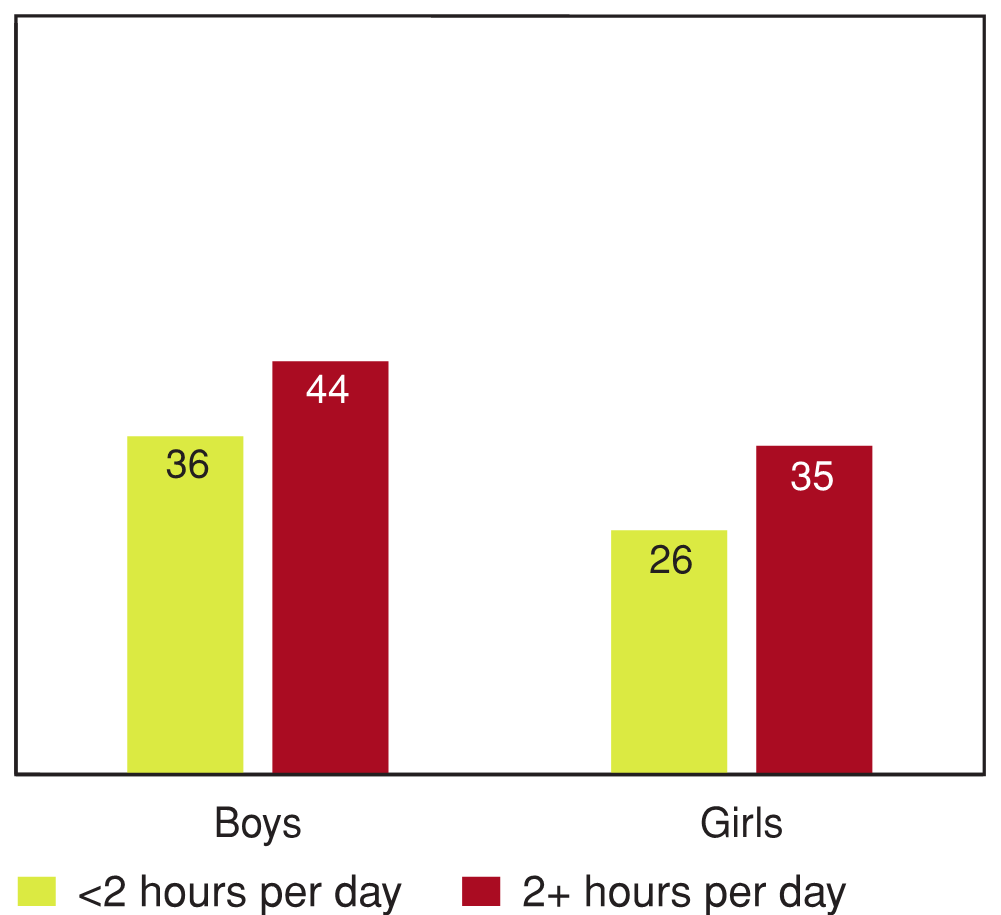
8.15 Students reporting high levels of behavioural problems by computer use in free-time, by gender (%)
[Text Equivalent, Figure 8.15]
8.15 Students reporting high levels of behavioural problems by computer use in free-time, by gender (%)
Figure 8.15 shows the percentage of students reporting high levels of behavioural problems by computer use in free time, by gender. The graph shows that 36% of boys who spend less than two hours per day using computers in their free time report high levels of behavioural problems, compared to 44% of boys who use computers in their free time for two or more hours per day. On the same question, 26% of girls who spend less than two hours per day using computers in their free time report high levels of behavioural problems, compared to 35% of girls who use computers in their free time for two or more hours per day.
The three sedentary behaviour measures (T.V., computer, video games) were also related to most of the mental health variables. An example of the relationship between computer use (in free time) and behavioural problems is shown in Figure 8.15. The proportion of youth who used the computer for less than two hours a day who had high behaviour problem scores was 8-9% lower than the proportion of youth who used the computer for two or more hours a day.
When we are active and in shape we are also healthy and happy. When we sit in the living room watching television all the time we are unhealthy, tired, and impatient with others.
—Youth, Healthy Advice Workshop
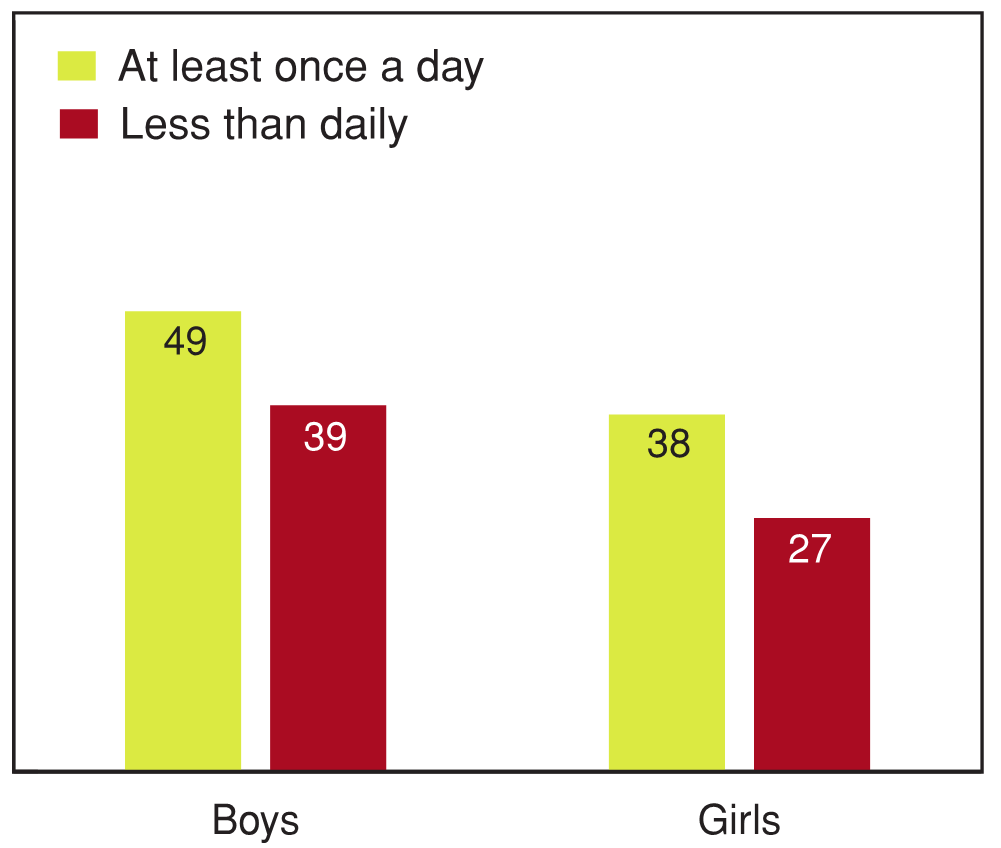
Relationships were also observed between the food frequency and eating behaviour variables and the mental health variables. Youth who ate fruit (Figure 8.16) and vegetables (Figure 8.17) at least once a day were more likely to have high emotional well‑being scores in comparison to youth who ate fruit and vegetables less frequently. The frequencies of drinking sugared soft drinks (Figure 8.18) and eating in fast food restaurants (Figure 8.19) were associated with behavioural problems, in that frequent soft drink and fast food consumers were more likely to have high behavioural problem scores.
8.16 Students reporting high levels of emotional well‑being by frequency of eating fruit, by gender (%)
[Text Equivalent, Figure 8.16]
8.16 Students reporting high levels of emotional well‑being by frequency of eating fruit, by gender (%)
Figure 8.16 shows the percentage of students reporting high levels of emotional well‑being by frequency of eating fruit, by gender. The graph shows that 49% of boys who eat fruit at least once per day report high levels of emotional well‑being, compared to 39% of boys who eat fruit less than once per day. On the same question, 38% of girls who eat fruit at least once a day report high levels of emotional well‑being, compared to 27% of girls who eat fruit less than once per day.
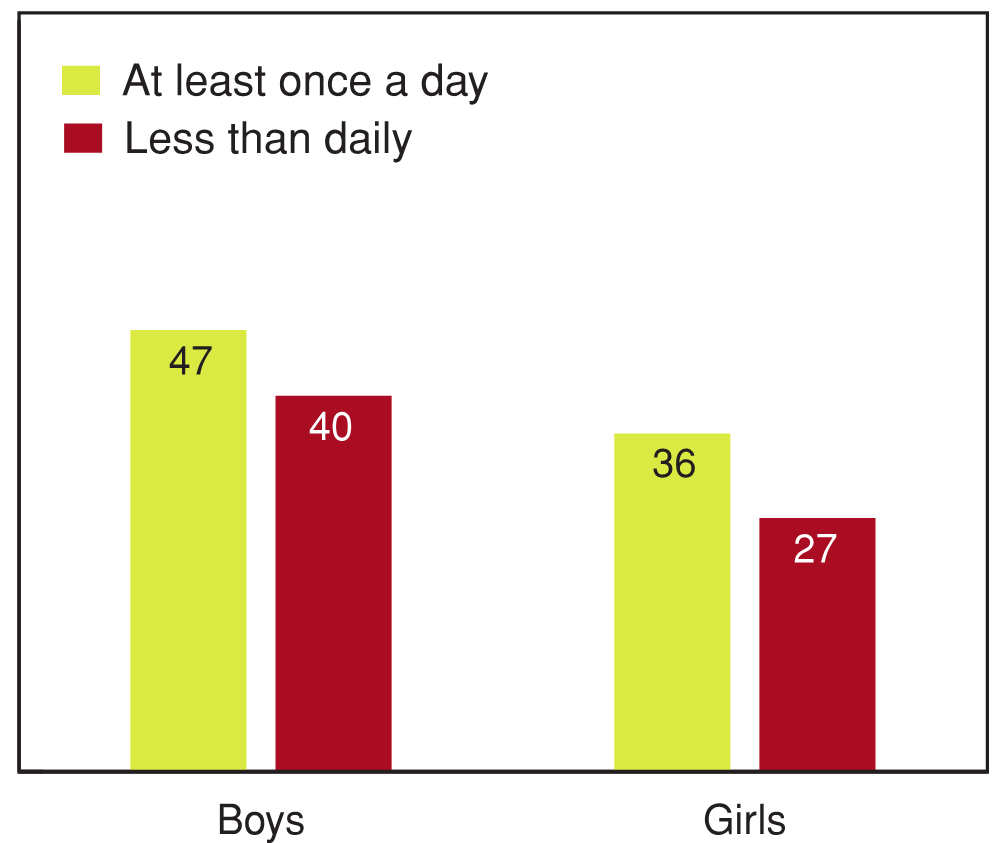
[Text Equivalent, Figure 8.17]
8.17 Students reporting high levels of emotional well‑being by frequency of eating vegetables, by gender (%)
Figure 8.17 shows the percentage of students reporting high levels of emotional well‑being by frequency of eating vegetables, by gender. The graph shows that 47% of boys who eat vegetables at least once per day report high levels of emotional well‑being, compared to 40% of boys who eat vegetables less than once per day. On the same question, 36% of girls who eat vegetables at least once per day report high levels of emotional well‑being, compared to 27% of girls who eat vegetables less than once per day.
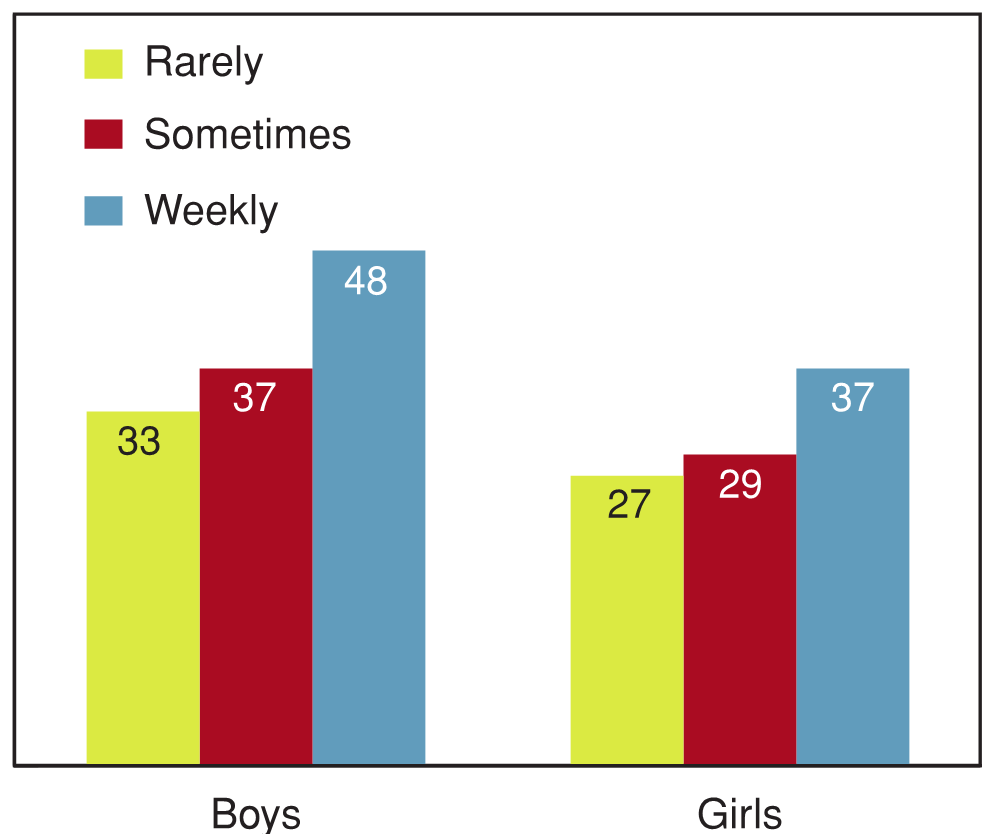
8.18 Students reporting high levels of behavioural problems by frequency of drinking sugared soft drinks, by gender (%)
[Text Equivalent, Figure 8.18]
8.18 Students reporting high levels of behavioural problems by frequency of drinking sugared soft drinks, by gender (%)
Figure 8.18 shows the percentage of students reporting high levels of behavioural problems by frequency of drinking sugared soft drinks, by gender. The graph shows that 53% of boys who drink sugared soft drinks at least once per day report high levels of behavioural problems, compared to 37% of boys who drink sugared soft drinks less than once per day. On the same question, 44% of girls who drink sugared soft drinks at least once per day report high levels of behavioural problems, compared to 30% of girls who drink sugared soft drinks less than once per day.
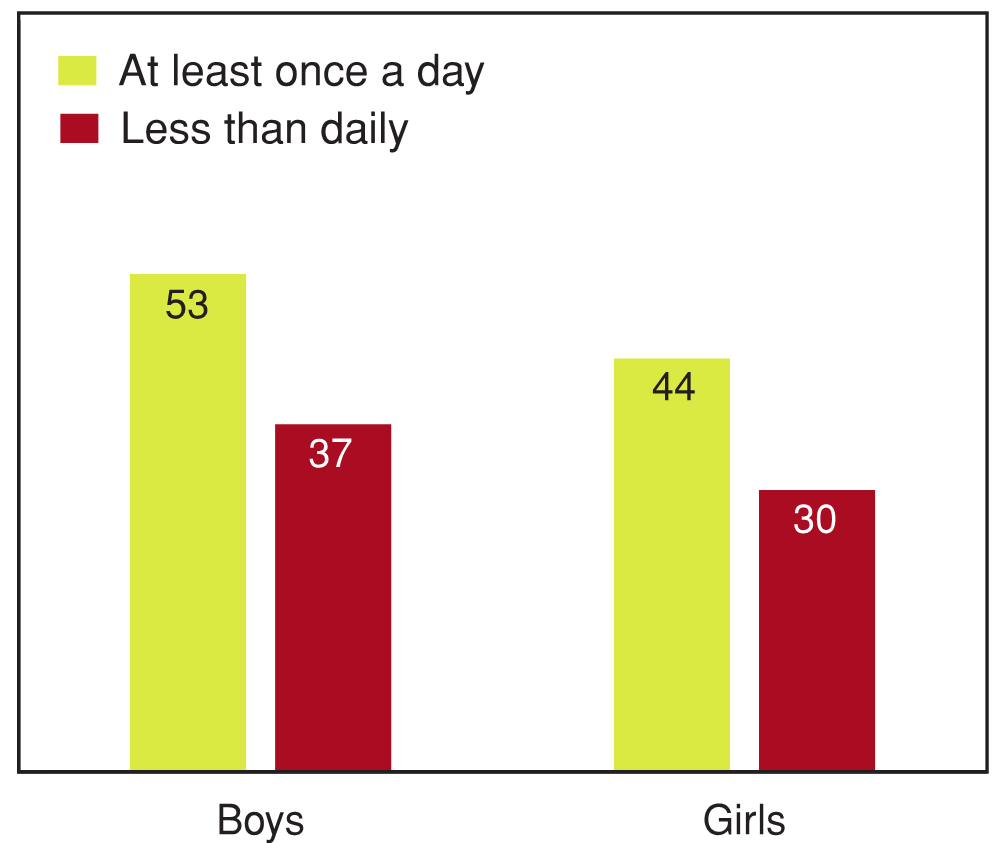
8.19 Students reporting high levels of behavioural problems by frequency of eating in a fast food restaurant, by gender (%)
[Text Equivalent, Figure 8.19]
8.19 Students reporting high levels of behavioural problems by frequency of eating in a fast food restaurant, by gender (%)
Figure 8.19 shows the percentage of students reporting high levels of behavioural problems by frequency of eating in a fast food restaurant, by gender. The graph shows that 33% of boys who rarely eat in fast food restaurants report high levels of behavioural problems, compared to 37% of boys who do it sometimes, and 48% of boys who do it weekly. On the same question, 27% of girls who rarely eat in fast food restaurants report high levels of behavioural problems, compared to 29% of girls who do it sometimes, and 37% of girls who do it weekly.
When we eat fruits and vegetables we feel better inside than when we eat fast food and junk food.
—Youth, Healthy Advice Workshop
What young people thought about these findings
A diverse group of Canadian youth participated in the workshop where the key findings of the 2010 HBSC were presented and discussed. One of the goals of this workshop was to gain young people's perspectives on the relations that were observed between healthy living behaviours and mental health variables.
The young people that attended the workshop recognized that a lack of physical activity, too much screen time, and unhealthy eating (e.g., eating too much high calorie, low nutrient foods and not enough nutritious foods) can all have a negative influence on their mental health. The young people in attendance also recognized that playing sports can help them make social connections, and they felt that this was a key way that physical activity influences their mental health. Conversely, they felt that young people who spend too much free time on the computer, playing video games, or watching TV tend to have poor social relationships and more mental health problems.
The youth workshop participants pondered the directionality of the relationships between the healthy living variables with the mental health variables. They asked three critical questions. Does a lack of physical activity, too much screen time, and unhealthy eating lead to poor mental health? Does poor mental health lead to a sedentary lifestyle and unhealthy eating? Or, are both situations possible?
Summary and implications
Key issues of concern
- Less than one in five Canadian youth accumulate enough physical activity to meet Canada's new physical activity guidelines (i.e., 60 minutes of moderate-to-vigorous intensity physical activity every day).
- Screen time levels are extremely high, particularly within high school boys. More than half of these boys watch TV at least two hours per day, use the computer in their free time for at least two hours per day, and play video games for at least two hours per day.
- In all gender and grade categories, 53% or fewer students report that they consume fruits or vegetables at least once a day.
Key issues to celebrate
- There have been some notable improvements in the food consumption patterns between the 2002 and 2010 cycles of the HBSC.
- The frequency of fruit consumption has gone up while the frequency of candy and sugared soft drink consumption has gone down.
- While many Canadian young people eat at fast food restaurants regularly, about one in three do so rarely or never.
Commentary
The descriptive findings that appear in this chapter highlight that the majority of Canadian youth do not engage in appropriate or sufficient healthy living behaviours. This includes their lack of participation in moderate-to-vigorous intensity physical activity, coupled with excessive levels of screen time, their lack of consumption of the foods recommended in Canada's Food Guide, and their consumption of many unhealthy foods and/or beverages. These unhealthy lifestyle behaviours are likely contributors to the weight and obesity problems that are discussed in Chapter 9 of this report.
Data collected for the first time in the 2010 HBSC survey provide new information on how children travel to school and their eating behaviours, such as snacking at the TV or computer and eating at fast food restaurants. The new data indicate that only one in three Canadian youth travel to school in an active way such as walking or biking. The rest get there by car or bus, and this represents a lost opportunity for many young people to accumulate some physical activity. The new data also indicate that approximately one in five young people snack while watching TV or while using the computer on a daily basis, and that approximately one in five eat at a fast food restaurant at least once a week. These particular eating behaviours are associated with unhealthy food choices and can contribute to obesity and reduced mental health.
Indeed, as shown in this chapter, young people who frequently eat at fast food restaurants have more mental health problems than young people who never or rarely eat at fast food restaurants. Conversely, young people who eat fruits and vegetables more frequently have better mental health scores. Although food item and eating behaviours are related to mental health, it is important to recognize that the causal direction of these relationships is not always known. This is also true for the relationships observed between physical activity and screen time with mental health.
In summary, this chapter provides simple descriptive information on the healthy living behaviours of young Canadians, and examines how these behaviours relate to mental health. Despite their appreciated health benefits, the majority of Canadian youth do not engage in the appropriate healthy living behaviours. Physical activity and healthy eating are obvious public health priorities within Canada.
References
- Bowman, S.A., Gortmaker, S.L., Ebbeling, C.B., Pereira, M.A. & Ludwig, D.S. (2004). Effects of fast-food consumption on energy intake and diet quality among children in a national household survey. Pediatrics, 113:112-118.
- Canadian Paediatric Society (2003). Impact of media use on children and youth. Paediatrics & Child Health, 8:301-306.
- Gore, S.A., Foster, J.A., DiLillo, V.G., Kirk, K. & Smith West, D. (2003). Television viewing and snacking. Eating Behaviors, 4:399-405.
- Janssen, I. & LeBlanc, A.G. (2010). Systematic review of the health benefits of physical activity and fitness in school-aged children and youth. International Journal of Behavioral Nutrition & Physical Activity, 7:40.
- Tremblay, M.S., Colley, R.C., Saunders, T.J., Healy, G.N. & Owen, N. (2010). Physiological and health implications of a sedentary lifestyle. Applied Physiology, Nutrition & Metabolism, 35:725-740.
Page details
- Date modified: