Chapter 7: The Health of Canada's Young People: a mental health focus – Injury
Injury
by William Pickett
What is injury?
Injury is defined as any physical harm to the body caused typically by an external force. The most common causes of injury are physical forces, and in young people these often happen while playing sports, during motor vehicle collisions, while cycling, or during physical fights (Molcho et al., 2006). Injuries can also include poisoning and ingestions, as well as burns.
Why does injury matter?
Injury is recognized as a leading public health issue in populations of young people around the world (Peden et al., 2008). This is certainly the case in Canada. Injuries are also costly to society in terms of health care expenditures and time lost from productive activities for both adolescents and the adults who care for them when they are injured (Ameratunga, 2009; Leitch, 2007; Peden et al., 2008).
Because of the enormous burden of injuries in terms of pain and suffering, permanent disability and even death, the Government of Canada has identified injury as a major prevention priority.
—Leitch, 2007; Public Health Agency of Canada, 2009
Possible relationships between injury and mental health
While injuries may cause obvious physical health effects such as pain and disability, the extent to which injuries may relate to mental health is not well known. This is a relatively new area of research. Recovery from injury can be a challenging process. Not only may injured youth experience ongoing pain and inconvenience, they may be prevented from engaging in their usual activities such as sports, music, and other recreational activities. These life changes are not trivial, and they may take a significant emotional toll. It is also possible that a young person's mental health status may impact risks for injury, (i.e., those who are suffering from emotional problems may be more prone to injury through a variety of risk-taking and other mechanisms). For these reasons, it is important to examine associations between various types of injury and mental health.
What are we reporting in this chapter?
In this chapter, we report on the percentage of students who experience at least one injury in a year, on the percentage of those who experience multiple injuries, and on the seriousness of these injuries. We define injuries as any injury event reported in the last 12 months that resulted in treatment by a doctor or nurse. One year represents the standard time period over which it is believed that young people can recall their injury experiences accurately (Harel et al., 1994).We define serious injuries as those that resulted in significant medical treatment such as the placement of a cast, stitches or an overnight admission to hospital. We also describe injuries leading to at least five days missed from school or usual activities. We describe patterns of injury by grade level and gender, and whether the serious injury problem appears to be getting better or worse compared with past HBSC surveys. Common activities and locations of injury are highlighted. Finally, the burden of injuries is reported in terms of time lost from school or other usual activities. We also examine some key behaviours that are known to protect young people from injury, or alternatively, cause great harm. Key protective behaviours include bicycle helmet use, and helmet use while operating ATVs, snowmobiles, and dirt bikes. The key risk behaviours examined were riding in a car or other motor vehicle operated by someone who had been drinking or using drugs, or alternatively driving a car or other motor vehicle under the same conditions. Finally, we examine injury in relation to the four standard indicators of mental health.
Description of the injury problem
The size of the injury problem in Canada
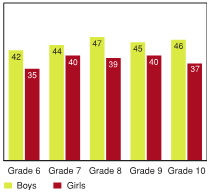
7.1 Students reporting an injury requiring medical treatment, by grade and gender (%)
[Text Equivalent, Figure 7.1]
Figure 7.1 shows the percentage of students reporting an injury requiring medical treatment in the past 12 months, by grade and gender. The graph shows that 42% of Grade 6 boys reported an injury requiring medical treatment, compared to 44% of Grade 7 boys, 47% of Grade 8 boys, 45% of Grade 9 boys, and 46% of Grade 10 boys. On the same question, 35% of Grade 6 girls reported an injury requiring medical treatment, compared to 40% of Grade 7 girls, 39% of Grade 8 girls, 40% of Grade 9 girls, and 37% of Grade 10 girls.
Figure 7.1 shows the overall proportions of students who reported at least one injury in the past 12 months. Across the grades, 42 to 47% of boys reported experiencing at least one injury requiring medical treatment, compared to 35 to 40% of girls. In every grade, boys reported more injuries than girls. There was no strong observable pattern in the occurrence of injuries across the five grades.
7.2 Students reporting multiple injuries, by grade and gender (%)

[Text Equivalent, Figure 7.2]
Figure 7.2 shows the percentage of students reporting multiple injuries over 12 months, by grade and gender. The graph shows that 21% of Grade 6 boys reported multiple injuries, compared to 20% of Grade 7 boys, 22% of Grade 8 boys, 23% of Grade 9 boys, and 26% of Grade 10 boys. On the same question, 16% of Grade 6 girls reported multiple injuries, compared to 20% of Grade 7 girls, 21% of Grade 8 girls, 21% of Grade 9 girls, and 20% of Grade 10 girls.
Some young people reported experiencing more than one injury over the course of a year, and this is shown in Figure 7.2. Reports of multiple injuries ranged from 20 to 26% for boys and 16 to 21% for girls. In general, there were no strong increases or decreases in the occurrence of injury across the different grades. These patterns were quite similar to past cycles (e.g., 2006) of the HBSC.
Injuries happen, they are part of life, part of growing up. I don't want to give up playing soccer or basketball or hanging out just because I might get hurt. But I do understand the need to be careful … to be smart about the risks that I take.
—Youth, Healthy Advice Workshop
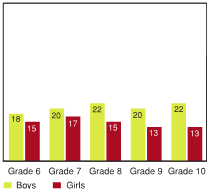
7.3 Students reporting one or more serious injuries requiring significant medical treatment, by grade and gender (%)
[Text Equivalent, Figure 7.3]
Figure 7.3 shows the percentage of students reporting one or more serious injuries requiring significant medical treatment in the past 12 months, by grade and gender. The graph shows that 18% of Grade 6 boys reported serious injuries, compared to 20% of Grade 7 boys, 22% of Grade 8 boys, 20% of Grade 9 boys, and 22% of Grade 10 boys. On the same question, 15% of Grade 6 girls reported serious injuries, compared to 17% of Grade 7 girls, 15% of Grade 8 girls, 13% of Grade 9 girls, and 13% of Grade 10 girls.
Figure 7.3 shows that at each grade level, a greater proportion of boys (18 to 22%) compared to girls (13 to 17%) reported a serious injury requiring placement of a cast, stitches, surgery, or an overnight admission to hospital in the past 12 months.
Impact of injury on young people's lives
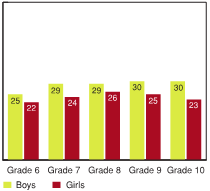
7.4 Missing one or more days from school or usual activities due to an injury, by grade and gender (%)
[Text Equivalent, Figure 7.4]
Figure 7.4 shows the percentage of students who reported missing one or more days from school or usual activities due to an injury, by grade and gender. The graph shows that 25% of Grade 6 boys reported missing school or usual activities due to an injury, compared to 29% of Grade 7 boys, 29% of Grade 8 boys, 30% of Grade 9 boys, and 30% of Grade 10 boys. On the same question, 22% of Grade 6 girls reported missing school or usual activities due to an injury, compared to 24% of Grade 7 girls, 26% of Grade 8 girls, 25% of Grade 9 girls, and 23% of Grade 10 girls.
The impact of students' injuries extends beyond their immediate physical consequences. In 2010, about 1 in 4 students typically missed one or more days of school or other usual activities due to an injury, with slightly higher percentages reported by boys in the older grades (Figure 7.4). There were no strong age-related patterns observed for girls.
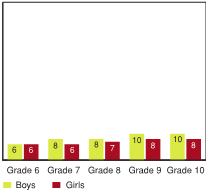
7.5 Missing five or more days of school or usual activities due to an injury, by grade and gender (%)
[Text Equivalent, Figure 7.5]
Figure 7.5 shows the percentage of students who report missing five or more days of school or usual activities due to an injury, by grade and gender. The graph shows that 6% of Grade 6 boys report missing five or more days of school or usual activities due to an injury, compared to 8% of Grade 7 boys, 8% of Grade 8 boys, 10% of Grade 9 boys, and 10% of Grade 10 boys. On the same question, 6% of Grade 6 girls report missing five or more days of school or usual activities due to an injury, compared to 6% of Grade 7 girls, 7% of Grade 8 girls, 8% of Grade 9 girls, and 8% of Grade 10 girls.
Between 6 to 10% of students reported missing a week or more of school or usual activities due to an injury (Figure 7.5).
Trends in injury over time
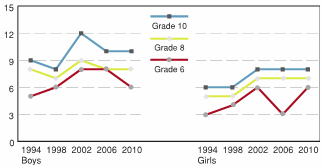
7.6 Injuries resulting in five or more days lost from school or usual activities reported over the last five cycles of the HBSC Survey, by grade and gender (%)
[Text Equivalent, Figure 7.6]
Figure 7.6 is a line graph that shows the percentage of students who reported injuries resulting in five or more days of lost from school or usual activities by grade, gender, and year of survey. The graph shows that 5% of Grade 6 boys reported injuries resulting in five or more days lost from school or usual activities in 1994, compared to 6% in 1998, 8% in 2002, 8% in 2006, and 6% in 2010. Among Grade 8 boys, 8% reported injuries resulting in five or more days lost from school or usual activities in 1994, compared to 7% in 1998, 9% in 2002, 8% in 2006, and 8% in 2010. Among Grade 10 boys, 9% reported injuries resulting in five or more days lost from school or usual activities in 1994, compared to 8% in 1998, 12% in 2002, 10% in 2006, and 10% in 2010. On the same question, among Grade 6 girls, 3% reported injuries resulting in five or more days lost from school or usual activities in 1994, compared to 4% in 1998, 6% in 2002, 3% in 2006, and 6% in 2010. Among Grade 8 girls, 5% reported injuries resulting in five or more days lost from school or usual activities in 1994, compared to 5% in 1998, 7% in 2002, 7% in 2006, and 7% in 2010. Among Grade 10 girls, 6% reported injuries resulting in five or more days lost from school or usual activities in 1994, compared to 6% in 1998, 8% in 2002, 8% in 2006, and 8% in 2010.
Trends in the occurrence of serious injuries reported by young people are summarized in Figure 7.6. There was no clear trend in the occurrence of reported injuries across the five HBSC survey cycles representing 16 years. This is despite the fact that injury has been recognized as an important public health issue in Canada, and considerable resources have been put into prevention efforts. This is of obvious concern to public health officials in Canada.
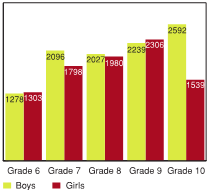
7.7 Total days missed of school or usual activities due to an injury per 1000 students per year, by grade and gender
[Text Equivalent, Figure 7.7]
Figure 7.7 shows the total days missed of school or usual activities due to an injury per 1000 students per year, by grade and gender. The graph shows that Grade 6 boys missed 1278 days of school or usual activities per 1000 students, compared to 2096 days for Grade 7 boys, 2027 days for Grade 8 boys, 2239 days for Grade 9 boys, and 2592 days for Grade 10 boys. On the same question, Grade 6 girls missed 1303 days of school or usual activities per 1000 students, compared to 1798 days for Grade 7 girls, 1980 days for Grade 8 girls, 2306 days for Grade 9 girls, and 1539 days for Grade 10 girls.
Figure 7.7 describes the burden of injury in the HBSC sample, estimated per 1000 participating students. Cumulatively, these injury events resulted in an enormous amount of time lost to students in all grades.
How are young people injured?
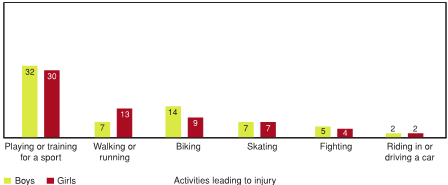
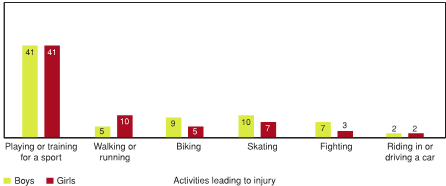
Injuries to young people occurred during many different activities. Figures 7.8 to 7.10 show that sports and recreational activities including walking or running, biking and skating are leading causes of injury. While fighting injuries are less common, the effects of violence on mental health will likely be more serious than the effect of recreational injuries due to the emotional impact of the violent event. Similarly, while motor vehicle injuries and occupational injuries account for smaller percentages in all age groups, they are still notable because they can be traumatic and disabling, thereby affecting the mental health of the victim.
7.8 Leading activities that result in injury to Grade 6 students, by gender (% of all activities; note: percentages do not add to 100%)
[Text Equivalent, Figure 7.8]
Figure 7.8 shows the leading activities that result in injury to Grade 6 students, by gender. Note: the percentages do not add up to 100%. The graph shows that 32% of Grade 6 boys were injured while playing or training for a sport, compared to 7% who were injured while walking or running, 14% who were injured while biking, 7% who were injured while skating, 5% who were injured while fighting, and 2% who were injured while riding in or driving a car. On the same question, 30% of Grade 6 girls were injured while playing or training for a sport, compared to 13% who were injured while walking or running, 9% who were injured while biking, 7% who were injured while skating, 4% who were injured while fighting, and 2% who were injured while riding in or driving a car.
7.9 Leading activities that result in injury to Grade 8 students, by gender (% of all activities; note: percentages do not add to 100%)
[Text Equivalent, Figure 7.9]
Figure 7.9 shows the leading activities that result in injury to Grade 8 students, by gender. Note: the percentages do not add up to 100%. The graph shows that 41% of Grade 8 boys were injured while playing or training for a sport, compared to 5% who were injured while walking or running, 9% who were injured while biking, 10% who were injured while skating, 7% who were injured while fighting, and 2% who were injured while riding in or driving a car. On the same question, 41% of Grade 8 girls were injured while playing or training for a sport, compared to 10% who were injured while walking or running, 5% who were injured while biking, 7% who were injured while skating, 3% who were injured while fighting, and 2% who were injured riding in or driving a car.
7.10 Leading activities that result in injury to Grade 10 students, by gender (% of all activities; note: percentages do not add to 100%)
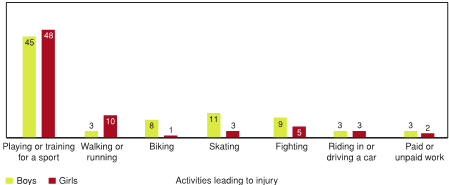
[Text Equivalent, Figure 7.10]
Figure 7.10 shows the leading activities that result in injury to Grade 10 students, by gender. Note: the percentages do not add up to 100%. The graph shows that 45% of Grade 10 boys were injured while playing or training for a sport, compared to 3% who were injured while walking or running, 8% who were injured while biking, 11% who were injured while skating, 9% who were injured while fighting, 3% who were injured while riding in or driving a car, and 3% who were injured while doing paid or unpaid work. On the same question, 48% of Grade 10 girls were injured while playing or training for a sport, compared to 10% who were injured while walking or running, 1% who were injured while biking, 3% who were injured while skating, 5% who were injured while fighting, 3% who were injured while riding in or driving a car, and 2% who were injured while doing paid or unpaid work.
Where are young people injured?
Table 7.1 shows that the leading places where injuries to young people occurred include sports facilities or fields (21 to 41%), and at school during regular hours (12 to 19%). Injuries at sports facilities appeared to increase in older grades, while injuries that happened at home or in schools declined with age.
| Grade 6 | Grade 7 | Grade 8 | Grade 9 | Grade 10 | ||||||
|---|---|---|---|---|---|---|---|---|---|---|
| Boys | Girls | Boys | Girls | Boys | Girls | Boys | Girls | Boys | Girls | |
| Home or yard | 27 | 36 | 27 | 27 | 18 | 26 | 18 | 25 | 15 | 22 |
| Sports facility or field | 27 | 21 | 31 | 27 | 39 | 30 | 39 | 37 | 41 | 36 |
| School during school hours |
19 | 19 | 15 | 16 | 13 | 18 | 14 | 12 | 12 | 13 |
| School outside hours | 3 | 3 | 3 | 5 | 4 | 5 | 5 | 4 | 5 | 7 |
| Street or parking lot | 6 | 4 | 7 | 7 | 9 | 6 | 9 | 7 | 9 | 5 |
| Other | 17 | 17 | 18 | 17 | 17 | 15 | 16 | 15 | 19 | 17 |
Which activities lead to the most serious injuries?
Figure 7.11 shows that the types of injury-causing activities most likely to lead to significant medical treatment (any of placement of a cast, stitches, or an overnight admission to hospital) include motor vehicle injuries, cycling injuries, and fighting. This is consistent with what is known about major causes of adolescent injury that result in death and hospitalization. While less common than sports injuries, these types of injury are important due to their relative severity.
7.11 Injuries requiring significant medical treatment, by activity (%)

[Text Equivalent, Figure 7.11]
Figure 7.11 shows the types of injury-causing activities most likely to lead to significant medical treatment. The graph shows that 52% of injuries from riding in or driving a car require significant medical treatment, compared to 51% from biking, 47% from fighting, 43% from skating, 39% from walking or running, 38% from paid or unpaid work, 36% from playing or training for a sport, and 48% from other causes.
Risk and protective factors
Helmet use
There were large differences observed in the use of helmets while cycling (Figure 7.12). While about 60% of Grade 6 cyclists wore a helmet most or all of the time, less than 20% of Grade 10 students reported this protective behaviour. Percentages of adolescents reporting bicycle helmet use were roughly equivalent between boys and girls in all age groups. Figure 7.13 suggests that while proportions of young people reporting helmet use were generally consistent between populations from urban and rural areas, lower proportions of reported use were observed in smaller urban centres among Grade 8 participants.
7.12 Students wearing a bicycle helmet most or all of the time when cycling in the last 12 months, by grade and gender (%)
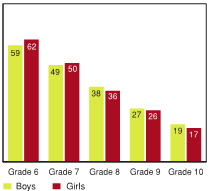
[Text Equivalent, Figure 7.12]
Figure 7.12 shows the percentage of students wearing bicycle helmets most or all of the time when cycling in the last 12 months, by grade and gender. The graph shows that 59% of Grade 6 boys report wearing a bicycle helmet while cycling, compared to 49% of Grade 7 boys, 38% of Grade 8 boys, 27% of Grade 9 boys, and 19% of Grade 10 boys. On the same question, 62% of Grade 6 girls report wearing a bicycle helmet while cycling, compared to 50% of Grade 7 girls, 36% of Grade 8 girls, 26% of Grade 9 girls, and 17% of Grade 10 girls.
7.13 Students wearing a bicycle helmet most or all of the time when cycling in the last 12 months, urban vs. rural schools (%)
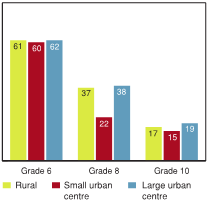
[Text Equivalent, Figure 7.13]
Figure 7.13 shows the percentage of students in urban versus rural schools who report wearing bicycle helmets most or all of the time when cycling in the last 12 months, by grade. The graph shows that 61% of Grade 6 students in rural schools report wearing a bicycle helmet most or all of the time when cycling, compared to 60% of Grade 6 students in small urban centres, and 62% of Grade 6 students in large urban centres. Among Grade 8 students, 37% in rural schools report wearing a bicycle helmet most or all of the time when cycling, compared to 22% in small urban centres, and 38% in large urban centres. Among Grade 10 students, 17% in rural schools report wearing a bicycle helmet most or all of the time when cycling, compared to 15% in small urban centres, and 19% in large urban centres.
Figure 7.14 shows that the majority of young people reported use of a helmet most or all of the time when they were riding motorized vehicles such as snowmobiles, dirt bikes, and all-terrain vehicles. However, substantial proportions of these students (21-46%) did not report helmet use and this risk behaviour increased in the older age groups. This pattern was similar for boys and girls. The pattern of responses to this question were quite similar in urban versus rural respondents.
7.14 Students wearing a helmet most or all of the time when riding other vehicles (e.g., snowmobile, ATV, dirt bike) in the last 12 months, urban vs. rural schools, by grade (%)
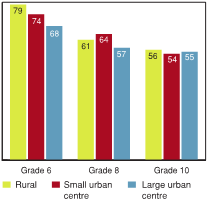
[Text Equivalent, Figure 7.14]
Figure 7.14 shows the percentage of students in urban versus rural schools who report wearing helmets most or all of the time when riding other vehicles (e.g., snowmobile, ATV, dirt bike) in the last 12 months, by grade. The graph shows that 79% of Grade 6 students in rural schools report wearing a bicycle helmet most or all of the time when riding other vehicles, compared to 74% of Grade 6 students in small urban centres, and 68% of Grade 6 students in large urban centres. Among Grade 8 students, 61% in rural schools report wearing a helmet most or all of the time when riding other vehicles, compared to 64% in small urban centres, and 57% in large urban centres. Among Grade 10 students, 56% in rural schools report wearing a helmet most or all of the time when riding other vehicles, compared to 54% in small urban centres, and 55% in large urban centres.
Drinking, drug use and driving
7.15 Students reporting riding in a car or other vehicle driven by someone who had been drinking alcohol or using drugs in the past 30 days, (% of Grade 9 and 10 students)
[Text Equivalent, Figure 7.15]
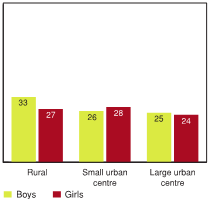
Figure 7.15 shows the percentage of Grade 9 and Grade 10 students who reported riding in a car or other vehicle driven by someone who had been drinking alcohol or using drugs in the past 30 days. The graph shows that 33% of boys in rural areas reported riding in a car or other vehicle driven by someone who had been drinking alcohol or using drugs in the past 30 days, compared to 26% of boys in small urban centres, and 25% of boys in large urban centres. On the same question, 27% of girls in rural areas reported riding in a car or other vehicle driven by someone who had been drinking alcohol or using drugs in the past 30 days, compared to 28% of girls in small urban centres, and 24% of girls in large urban centres.
Driving a motor vehicle while under the influence of alcohol or drugs is an obvious and serious cause of major injury in Canada. Therefore, it is disturbing to see that substantial proportions of boys and girls reported riding in a motor vehicle driven by someone who had been using drugs or alcohol in the past 30 days. Figure 7.15 presents the percentages for Grade 9 and 10 students, who reported this behavior most frequently. This was especially a problem in rural student populations.
7.16 Grades 9 and 10 students reporting driving a vehicle after drinking alcohol or using drugs in the past 30 days, urban vs. rural schools, by gender (%)

[Text Equivalent, Figure 7.16]
Figure 7.16 shows the percentage of Grade 9 and Grade 10 students reporting driving a vehicle after drinking alcohol or using drugs in the past 30 days, urban vs. rural schools, by gender. The graph shows that 24% of boys in rural areas reported driving a vehicle after drinking alcohol or using drugs in the past 30 days, compared to 18% of boys in small urban centres, and 15% of boys in large urban centres. On the same question, 12% of girls in rural areas reported driving a vehicle after drinking alcohol or using drugs in the past 30 days, compared to 15% of girls in small urban centres, and 8% of girls in large urban centres.
Equally disturbing are the proportions of Grade 9 and 10 students who reported driving a motor vehicle when they had been drinking alcohol or using drugs. Again, the highest reports of this behaviour were observed among boys in rural areas (Figure 7.16). However, 15% of girls from small urban centres also reported this behaviour, which was considerably higher than those from large urban centres.
Injury and mental health
For many different reasons, it is possible that young people who report injuries may also report different types of mental health experiences, both positive and negative. On the one hand, injuries can cause pain and suffering. Prolonged experiences with pain can take a toll, and potentially have consequences in terms of poorer levels of mental health. On the other hand, relationships between specific types of injury and the mental health indicators are affected by the context in which the injury occurred.
An injury that occurred during a fight or other act of violence will have obvious detrimental effects on a young person's mental health. This may, however, be an artifact of the violent encounter, and not necessarily the injury itself. On the other hand, an injury that occurred during physical activity (including sports) may have positive relations with mental health outcomes, as the positive effects of this activity may outweigh any negative consequences of the injury itself.
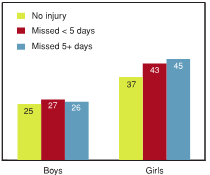
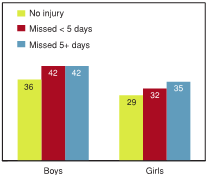
Figure 7.17 demonstrates that girls reporting injuries also reported increases in the most negative responses on the emotional problem scale. Both boys and girls reporting injuries also reported higher scores on the behavioural problem scale (Figure 7.18). This suggests that overall, injury experiences are associated with some negative aspects of mental health.
7.17 Students reporting high levels of emotional problems, by days missed due to injury, by gender (%) 1
[Text Equivalent, Figure 7.17]
Figure 7.17 shows the percentage of students reporting high levels of emotional problems, by days missed due to injury, by gender. The graph shows that 25% of boys who missed no days due to injury reported high levels of emotional problems, compared to 27% of boys who missed less than five days, and 26% of boys who missed five days or more. On the same question, 37% of girls who missed no days reported high levels of emotional problems, compared to 43% of girls who missed less than five days, and 45% of girls who missed five days or more.
7.18 Students reporting high levels of behavioural problems by days missed due to injury, by gender (%)
[Text Equivalent, Figure 7.18]
Figure 7.18 shows the percentage of students reporting high levels of behavioural problems by days missed due to injury, by gender. The graph shows that 36% of boys who missed no days due to injury reported high levels of behavioural problems, compared to 42% of boys who missed less than five days, and 42% of boys who missed five days or more. On the same question, 29% of girls who missed no days due to injury reported high levels of behavioural problems, compared to 32% of girls who missed less than five days, and 35% of girls who missed five days or more.
When these relationships are broken down for specific types of injury, quite a different pattern emerges.
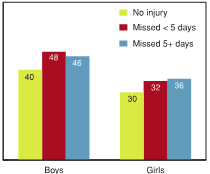
Higher rates of emotional well‑being are associated with the reporting of a physical activity injury (Figure 7.19), most likely attributable to the benefits of exercise and participation in sports.
7.19 Students reporting high levels of emotional well‑being by days missed due to physical activity injury, by gender (%)
[Text Equivalent, Figure 7.19]
Figure 7.19 shows the percentage of students reporting high levels of emotional well‑being by days missed due to physical activity injury, by gender. The graph shows that 40% of boys who missed no days due to physical activity injury reported high levels of emotional well‑being, compared to 48% of boys who missed less than five days, and 46% of boys who missed five days or more. On the same question, 30% of girls who missed no days due to physical activity injury reported high levels of emotional well‑being, compared to 32% of girls who missed less than five days, and 36% of girls who missed five days or more.
If you get in a fight and are seriously injured, you might be in trouble with your parents, which can really have an impact on your emotional health.
—Youth, Healthy Advice Workshop
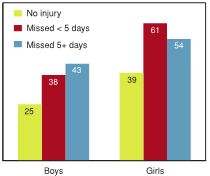
When injuries caused by fighting were examined (Figure 7.20), strong relationships were observed between boys with injuries caused by fighting and higher scores on the emotional problem scale, while the pattern observed among girls was less consistent. Emotional well‑being also appeared to decline in association with reports of fighting injuries among boys, whereas no such pattern appeared among girls (Figure 7.21).
7.20 Students reporting high levels of emotional problems by days missed due to fighting injury, by gender (%)
[Text Equivalent, Figure 7.20]
Figure 7.20 shows the percentage of students reporting high levels of emotional problems by days missed due to fighting injury, by gender. The graph shows that 25% of boys who missed no days due to fighting injury reported high levels of emotional problems, compared to 38% of boys who missed less than five days, and 43% of boys who missed five days or more. On the same question, 39% of girls who missed no days due to fighting injury reported high levels of emotional problems, compared to 61% who missed less than five days, and 54% who missed five days or more.
7.21 Students reporting high levels of emotional well‑being by days missed from school or usual activities due to fighting injury, by gender (%)

[Text Equivalent, Figure 7.21]
Figure 7.21 shows the percentage of students reporting high levels of emotional well‑being by days missed due to injuries caused by fighting, by gender. The graph shows that 42% of boys who missed no days due to injuries caused by fighting reported high levels of emotional well‑being, compared to 37% of boys who missed less than five days, and 26% of boys who missed five days or more. On the same question, 24% of girls who missed no days due to injuries caused by fighting reported high levels of emotional well‑being, compared to 11% of girls who missed less than five days, and 33% of girls who missed five days or more.
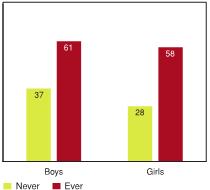
7.22 Students reporting high levels of behavioural problems by whether they have ridden in a car with an impaired operator, by gender (%)
[Text Equivalent, Figure 7.22]
Figure 7.22 shows the percentage of students reporting high levels of behavioural problems by whether they have ridden in a car with an impaired operator, by gender. The graph shows that 37% of boys who never rode in a car with an impaired driver reported high levels of behavioural problems, compared to 61% of boys who had. On the same question, 28% of girls who never rode in a car with an impaired driver reported high levels of behavioural problems, compared to 58% of girls who had.
Finally, it is clear that some indicators of negative mental health, such as the behavioural problem scale, can be linked with risk-taking behaviours that have very serious consequences. For example, strong relationships were observed between those with a high score on the behavioural problem scale and drinking and driving behaviours, such as riding in a car or other vehicle while the operator was impaired (Figure 7.22).
What young people thought about these findings
While young people appreciated the importance of injury as a public health problem, their views on its relative importance might vary somewhat from adults, especially adult professionals who are responsible for the development of injury prevention programs. The immediate consequences of injuries in terms of pain, suffering, and inconvenience seem to be understood, at least conceptually. Nevertheless, the long-term costs of injury in terms of its effects on society, or even its immediate effects on mental health, are less well understood. As a priority, it seemed that many youth attending the workshop ranked injury behind other leading public health issues (e.g., obesity, physical inactivity, violence), in terms of the need for urgent government action.
In addition, there are many obvious and well-established risk-taking behaviours that can lead to injury. Some of these include drinking and driving or riding in a vehicle with an impaired driver. Others include non-use of helmets while riding bicycles or other recreational vehicles such as snowmobiles, ATVs, and dirtbikes. Many young people that responded to the HBSC in Canada reported recent engagement in such risky behaviours, despite what is known about such risks and their effects on injury. There is a consequent need to redouble efforts to educate young people about the importance of preventing injury in their young lives, and how to manage and prevent the overt risk-taking that can lead to trauma.
Summary and implications
Key issues of concern
- Injury remains a leading cause of ill-health in all HBSC age groups.
- Important percentages of young people report engagement in known risk-taking behaviours that can lead to major injury, despite widespread knowledge of the potential consequences of these behaviours.
- Emotional problems, and lower emotional well‑being are each strongly associated with the occurrence of fighting injury.
Key issues to celebrate
- Helmet use appears to be a normative behaviour among a majority of younger (Grade 6) children.
- The leading activity associated with the occurrence of injury to young people remains "playing or training for a sport". Injuries are a negative side effect of a group of activities that generally have positive effects on the health of young people.
Commentary
The descriptive findings that appear in this chapter mirror those found in previous HBSC cycles and reports. Injury remains a leading public health priority in terms of the prevalence of injury events reported, and the extent and consistency of the problem observed in groups of young people across the country. Injury also exacts a significant toll in terms of the numbers of young people who seek formal medical care from the health care system, and in terms of the extensive amount of time lost to school or other usual activities. These facts are well understood by Canadian authorities, including the Public Health Agency of Canada which has identified injury as one of its leading priority health issues during recent years (Leitch, 2007; Public Health Agency of Canada, 2009).
What is new in the 2010 HBSC Study is the documentation on a population basis of some key risk-taking behaviours that have the potential to result in major injury. Substantial proportions of students in Grade 9 and 10 (e.g., up to 25% of rural boys) report the recent operation of a car or other vehicle after consuming alcohol. Even higher proportions (25% to 33%) of young people report riding in a car or other vehicle driven by someone who had been drinking or using drugs. While the majority (about 60%) of Grade 6 children report wearing a helmet while cycling at least most of time, this drops to only 20% by the time young people enter Grade 10. And about 45% of Grade 10's report at least some non-use of helmets while riding on other recreational vehicles such as ATVs or snowmobiles. All populations of young people seemed to share in these risks. Efforts to prevent young people from engaging in these known and obvious risks remain a leading priority for the prevention of major injury in Canada.
While some forms of injury may take an important toll on the mental health of young people, it is also clear that the causal relationship between injuries and mental health outcomes is not always straightforward. Injury can lead to poor mental health outcomes. Poor mental health outcomes can also lead some young people to take increased risks leading to injury. Exploratory analyses of these relationships, such as those presented in this chapter, require confirmation in longitudinal studies to sort out the correct temporal sequence. It is also clear that context plays a role in the nature and effects of these relationships. Injuries that occur in different settings and contexts might have very different effects on standard indicators of mental health. These do not represent clear-cut relationships, and the context in which the injury occurred seems to matter.
In summary, injury remains a leading public health priority among populations of young people in Canada. This chapter provides simple descriptive insights into the ongoing nature of this problem in our country. It also points to some obvious priorities for prevention that were documented during the 2010 HBSC cycle.
References
- Ameratunga, S. (2009). Which pill should we take? Bulletin of the World Health Organization, 87:399.
- Harel, Y., Overpeck, M.D., Jones, D.H., Scheidt, P.C., Bijur, P.E., Trumble, A.C. & Anderson, J. (1994). The effects of recall on estimating annual nonfatal injury rates for children and adolescents. American Journal of Public Health, 84:599-605.
- Leitch, K. (2007). Reaching for the top: A report by the advisor on healthy children and youth. Ottawa:
Ministry of Health Canada. - Molcho, M., Harel, Y., Pickett, W., Scheidt, P.C., Mazur, J., Overpeck, M.D. & HBSC Violence and Injury Writing Group (2006). The epidemiology of non fatal injuries among 11, 13 and 15 year old youth in 11 Countries: Findings from the 1998 WHO-HBSC cross national survey. International Journal of Injury Control and Safety Promotion, 13:205-211.
- Peden, M., Oyegbite, K., Ozanne-Smith, J., Hyder, A.A., Branche, C., Rahman, F., AKM, Rivara, F. & Bartolomeos, K. (2008). World Report on Child Injury Prevention. Geneva: WHO and UNICEF.
- Public Health Agency of Canada (2009). Child and youth injury in review, 2009 edition - Spotlight on consumer product safety. Ottawa: Government of Canada.
- 25% of boys who did not see a doctor or nurse for an injury in the past 12 months report relatively high levels of behavioural problems, compared with 27% of boys who saw a doctor or nurse for an injury in the last 12 months, but missed fewer than 5 days of school or other usual activities due to the injury. A full explanation of how to interpret the figures that relate to mental health is provided in Chapter 1.
Page details
- Date modified: