ARCHIVED: Chapter 10: Young people in Canada: their health and well-being – Emotional Health
Emotional health should be of concern to all Canadians. Approximately 20 percent of the Canadian population will have some sort of mental health condition during their lifetime (depression, schizophrenia, psychosis, etc.). An estimated 2.5 million Canadians over the age of 18 will experience a depressive disorder (Canadian Mental Health Association, 2002). Additionally, a high proportion (66 percent) of Canada's homelessness (Canadian Mental Health Association, 2002) and suicides (Moscicki, 1999) are related to poor emotional health. Even such high numbers may underestimate the true extent of the problem, given that people may not always be willing to admit they are suffering from emotional health difficulties. This relatively high percentage of persons suffering from emotional health problems has both financial and societal costs. A recent report indicated that $14.4 billion is spent annually on treating mental illness in Canada (Joubert and Stephens, 2001), with this amount expected to increase to the point that mental illness will represent the leading health cost in the country by 2020 (Canadian Psychiatric Association, 2001).
Emotional health problems that arise in adolescents need not continue throughout their lifespan (Elder and Crosnoe, 2002). With proper treatment, such as personal and/or group counselling or medication, most individuals can lead healthy and productive lives (Diverty and Beaudet, 1997). Therefore, it is essential that we gain an understanding of the extent of emotional health problems among Canadian adolescents and what contributes to them so that they can be treated appropriately.
The 2002 HBSC survey measured emotional health across Grades 6 to 10 in two ways: symptomatically and globally. At a symptomatic level, an eight-item checklist of psychosomatic complaints was used. The scale had four items measuring psychological indicators of emotional health (feeling depressed or low, irritability or bad mood, feeling nervous, feeling dizzy) and four items measuring somatic factors (headache, stomach ache, backache, difficulties getting to sleep). The scale is flexible in that both summary scores (Haugland, Wold, Stevenson, AarØ, and Woynarowska, 2001) and individual item scores (Torsheim and Wold, 2001) are meaningful. For each of these emotional health indicators, adolescents were asked how often they had experienced the complaint in the past six months ("about every day," "more than once a week," "about every week," "about every month," and "rarely or never").
Two global questions were also used to ask students how they viewed their health. The first item on life satisfaction asked students to rate their life on an 11-point ladder scale, with "10" representing the best possible life and "0" the worst possible life. This life satisfaction ladder has been shown to be a valid instrument in judging life satisfaction in adults (Cantril, 1965), although it has yet to be validated as a measure of adolescent life satisfaction. A second question on perceived health simply asked youth to indicate whether their health was "excellent," "good," "fair," or "poor;" this item has been a useful measure of emotional health in large epidemiological surveys (Idler and Benyamini, 1997).
Psychosomatic Indicators of Emotional Health
For this report, we examined four individual symptoms of emotional health (two somatic and two psychological): headaches, backaches, feeling depressed or low, and irritability or bad mood. These symptoms were selected on the basis of their having been the focus of previous HBSC reports in Canada (e.g., King, Boyce, and King, 1999).
Headaches
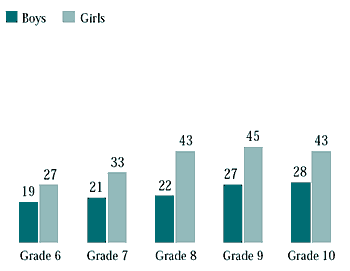
Headaches are an increasing focus of research in recent years, as their relationship to adolescent stress has been strongly documented (Reynolds, O'Koon, Papademetriou, and Szczygiel, 2001; Waldie, 2001). Figure 10.1 shows the percentage of adolescents who reported having a headache at least weekly. At each grade level, substantially greater numbers of girls than boys reported weekly headaches. For example, while 19 percent of Grade 6 boys reported at least weekly headaches, 27 percent of girls reported this level of headaches. The number of reported headaches grew with grade level for both boys and girls. This increase was most precipitous for girls between Grades 7 and 8 (33 percent and 43 percent, respectively).
The downward trend in headaches noted in the previous report (King et al., 1999) continued in 2002, with the exception of Grade 8 girls and Grade 10 boys (Figure 10.2). For these two groups, the level of headaches was higher than in the two HBSC previous surveys. For Grade 8 boys - the only group in which headaches increased from 1994 to 1998 - headaches were at the lowest level in the past three surveys.
Figure 10.2
Students who had headaches at least once a week in the past six months, by year of survey (%)

Backaches
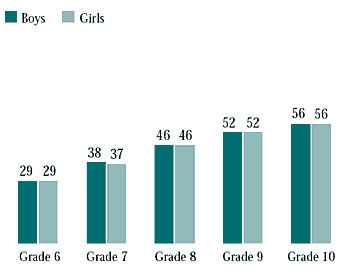
Unlike most other indicators of emotional health, reports of backaches were similar for boys and girls (Figure 10.3). The number of backaches grew steadily by grade, with the steepest increase occurring after Grade 7 (similar to what was found for girls in terms of headaches).
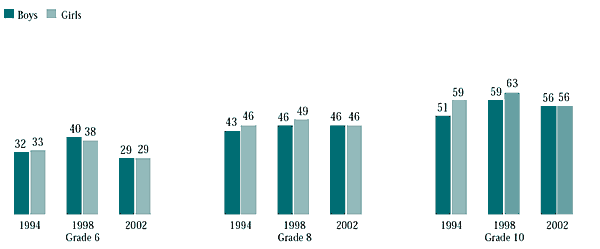
The trend analysis for backaches (Figure 10.4) indicated no systematic pattern over the past three surveys. However, at each grade level, the number of reported backaches decreased for both boys and girls since 1998. The only exception to this pattern was Grade 8 boys, whose report of backaches remained steady at 46 percent. The largest drop between surveys was among Grade 6 students, decreasing from 40 percent to 29 percent among boys and from 38 percent to 29 percent among girls.
Figure 10.4
Students who had backaches at least once a month in the past six months, by year of survey (%)
Feeling Depressed or Low
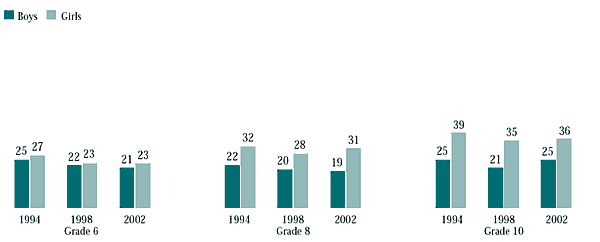
Figure 10.5 indicates the percentage of students who reported that they felt depressed or low at least weekly during the past six months. For Grade 6 to 10 boys, the self-reported incidence of depression increased only marginally from 21 percent to 25 percent, while the incidence rose sharply for girls from 23 percent to 36 percent. These self-reports of depression were congruent with, but slightly higher than, the incidence of diagnosable psychiatric disorders of almost 20 percent reported for children and youth by the Canadian Mental Health Association (2002). The gender differences were also similar to those identified using clinical measures of depression (Wade, Cairney, and Pevalin, 2002). Analysis of previous surveys indicate that self-reports of depression or feeling low remained essentially unchanged across the years (Figure 10.6).
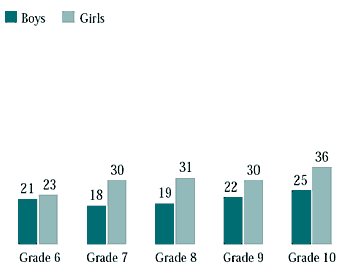
Figure 10.6
Students who felt depressed or low at least once a week in the past six months, by year of survey (%)
Irritability or Bad Mood
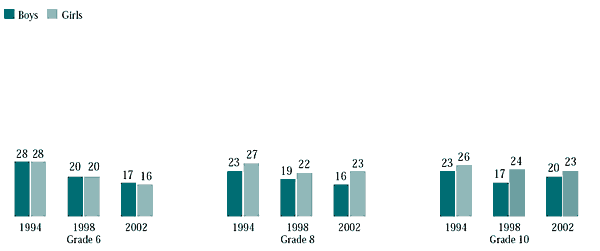
The differences between boys and girls noted for headaches and feeling depressed were less pronounced for irritability or bad mood (see Figure 10.7). In Grade 8, more girls than boys reported irritability or bad mood (23 percent, compared with 16 percent), while gender differences were not significant at the other grade levels. Being in a bad mood increased the most for girls between Grades 7 and 8 (from 17 percent to 23 percent), similar to the pattern found earlier for headaches and backaches.

Figure 10.8 reveals a strong downward trend in self-reports of irritability more than once a week among Grade 6 students from 1994 to 2002. Both boys and girls in Grade 6 reported fewer episodes of irritability over the past three surveys. Such a trend was also evident for Grade 8 boys and, to a lesser extent, for Grade 10 girls. Reasons behind this continuing trend are not immediately apparent.
Figure 10.8
Students who were in a bad mood or irritable at least once a week in the past six months, by year of survey (%)
Global Views of Emotional Health
Life Satisfaction
Across grade levels, relatively few students rated their life satisfaction as "10" (Figure 10.9). Grade 10 girls were particularly unlikely to give this highest rating for their life satisfaction (4 percent). In contrast, 18 percent of Grade 6 boys were perfectly satisfied (a rating of "10") with their lives.
Figure 10.9
How students rated life out of 10 (%)
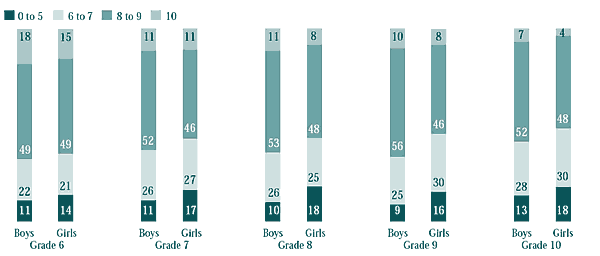
Although relatively few adolescents rated their life satisfaction as "10," the majority in each group gave themselves at least "8" on life satisfaction. Once again, the most satisfied group was Grade 6 boys (67 percent gave themselves "8" to "10"), and the least satisfied group was Grade 10 girls (52 percent gave themselves "8" to "10"). Indeed, life satisfaction was consistently higher for boys than for girls across all grade levels, while life satisfaction decreased progressively across grades.
Table 10.1 relates student life satisfaction to other measures from the study. The numbers presented are Pearson Correlation Coefficients that indicate the strength of the relationship between the measures across the entire range of the scales, with higher correlations designating stronger relationships; no relationship is indicated by a zero, while a perfect relationship is one. The wording of the items identified the direction of the relationships.
As might be expected, life satisfaction was positively associated with other measures of emotional health, such as perceived health and absence of psychosomatic symptoms (Table 10.1). In addition, adolescents who were satisfied with their lives tended to have higher levels of self-esteem. The strongest influence on life satisfaction was students' relationship with parents. Families may act as a foundation for experience in the social world through providing a sense of security (Chubb and Fertman, 1992) and by encouraging an adolescent to develop a strong sense of identity (Noller and Callan, 1991). Family functioning in terms of good parental problem solving (Vuchinich and de Baryshe, 1997), family responsibility taking (Taylor et al., 1997), and positive parental treatment (DeHaan and MacDermid, 1998) all may contribute to positive emotional health as measured by life satisfaction.
In contrast, being well integrated socially was less strongly related to life satisfaction for students in the survey. Being well integrated socially reflects only the degree of social integration and not the nature of peer influence used in the related measure employed in Chapter 4, The Peer Group. Some authors have argued that during adolescence, social needs shift, with an increased requirement for interpersonal intimacy (Erdley, Nangle, Newman, and Carpenter, 2001); however, the apparent contribution of social integration to life satisfaction in the HBSC sample was low. This greater influence of family in comparison with peers may be related to the fact that parents provide an ongoing support for their children through many years and also that emotional health develops over an extended period.
To see whether adolescents who had higher levels of life satisfaction were less prone to psychosomatic symptoms, the mean number of symptoms (ranging from 0 to 8) experienced by a student once a week or more was calculated. As expected, the more satisfied that students were with their lives, the less likely they were to experience emotional health complaints (Figure 10.10). The contrast in symptoms was especially dramatic between those who were least satisfied and those who were most satisfied with their lives. For example, girls who rated their life satisfaction as "10" had an average of 1.3 psychosomatic symptoms. In comparison, those who rated their life satisfaction as "0" had an average of 5.8 symptoms. For boys, the comparable averages were 1.1 and 4.2 symptoms. The highest levels of psychosomatic symptoms reported by boys were for those who rated their life satisfaction as "1"; the highest levels of psychosomatic symptoms for girls were for those who rated their life satisfaction as "2."
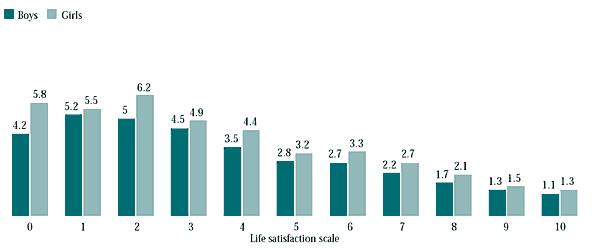
In addition, regardless of life satisfaction, girls experienced more emotional health complaints. The steep increase in health complaints for girls along the life satisfaction scale indicates that psychosomatic symptoms may be a better means of distinguishing girls who are at risk for emotional health problems than is a general life satisfaction scale.
Perceived Health
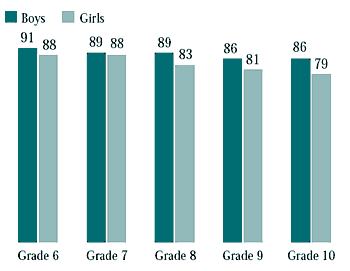
The self-reported perceived health of adolescents provided a second measure of their emotional health (Figure 10.11). Across grade levels, boys more frequently than girls, rated their health as "excellent" or "good." However, while the difference between genders was slight in the younger grades (91 percent versus 88 percent in Grade 6; 89 percent versus 88 percent in Grade 7), the difference increased in Grades 8 to 10. This sudden change between Grade 7 and Grade 8 for girls was also seen in the psychosomatic symptoms. Girls in Grades 7 and 8 may be at a particularly difficult transition point in their lives as is evident in the decrease in their perceived health. This, perhaps, can be attributed to developmental and pubertal changes and the associated physical and emotional symptoms that accompany menarche, such as headache, stomach ache, backache, depression, and irritability.
The factors associated with perceived health mirrored those associated with life satisfaction (Table 10.2). Like life satisfaction, parent relationships played a stronger role in promoting perceived health than did social integration.
Major Findings
- Girls were more likely to report somatic (headache) and psychological (depression) symptoms, and this increased with age.
- Students reporting fewer psychosomatic symptoms were more satisfied with their lives.
- Poor emotional health of students was associated with lower life satisfaction and lower subjective health in higher grades.
- Good parent and peer relationships were related to global measures of life satisfaction and overall health.
- Life satisfaction was more strongly related to positive relationships with parents than to social integration with peers.
Page details
- Date modified: