
Osteoporosis and related fractures in Canada: Report from the Canadian Chronic Disease Surveillance System 2020
Download in PDF format
(6.67 MB, 85 pages)
Organization: Public Health Agency of Canada
Published: February 2024
ISBN: 978-0-660-68808-4
Cat.: HP35-123/2023E-PDF
Pub.: 230575
Table of Contents
- Executive Summary
- 1. Introduction
- 2. Osteoporosis burden
- 3. Primary complications
- 4. Osteoporosis care gap
- 5. Bone health promotion strategies
- 6. Closing remarks
- Appendix A - Canadian Chronic Disease Surveillance System
- Appendix B - Osteoporosis and related fracture case definitions
- Appendix C - Osteoporosis care gap
- Appendix D - Methods
- Appendix E - Limitations
- Glossary
- Acronyms
- Acknowledgments
- References
Executive Summary
Introduction
Osteoporosis, a metabolic bone disease characterized by low bone density and an increased risk of fracture, is a major public health concern in Canada and worldwide. It is more common among older people and among women. With a growing and aging Canadian population, the prevalence of osteoporosis is predicted to increase. The main public health challenge lies in the fractures associated with the disease. Such fractures are associated with significant morbidity, mortality and costs. Despite interventions that have been shown to substantially reduce the risk of osteoporotic fractures, most individuals at high risk of fracture do not undergo appropriate screening or treatment.
Purpose of this report
The purpose of this report is to provide a national overview on diagnosed osteoporosis, related fractures and the osteoporosis care gap among Canadians 40 years and older. It reports on administrative health data from the Canadian Chronic Disease Surveillance System (CCDSS) from fiscal year 2015–2016 as well as trend data spanning a surveillance period of 15 years (2000–2001 to 2015–2016). This information is intended to enhance understanding of osteoporosis and related fractures in the Canadian population and build the evidence base required to drive public health action.
Key findings
Osteoporosis burden
Osteoporosis affects a large proportion of the adult Canadian population. In 2015–2016, approximately 2.2 million (or 11.9%) Canadians aged 40 years and older were living with diagnosed osteoporosis; about 80% were women. Prevalence of diagnosed osteoporosis increased with age. The age-standardized prevalence of diagnosed osteoporosis increased over the surveillance period.
Primary complications
Over the surveillance period, more than 1.8 million fractures at skeletal sites most commonly attributable to osteoporosis were identified among Canadians 40 years and older. In 2015–2016 alone, there were a total of 130,000 fractures. Fractures of the forearm were the most common followed by fractures of the hip, spine, humerus and pelvis. Fracture rates were higher among women than men and increased with age among both sexes. Forearm fractures were the most common among adults between 40 and 79 years old, whereas hip fractures were the most common among those aged 80 years and older.
Hip fractures are considered among the most serious fractures in light of the life-threatening complications that often ensue. There were 147 hip fractures per 100,000 Canadians 40 years and older in 2015–2016. Almost one-quarter (22.8%) of those who had a hip fracture died of any cause within the year following their fracture event. While women were 2 times more likely to fracture a hip, men were 1.3 times more likely to die of any cause within a year of a hip fracture.
Over the surveillance period, the age-standardized annual fracture rates decreased for the forearm and hip, remained stable for the humerus and increased for spine and pelvis; however, the absolute number of each of these types of fractures increased. Age-standardized all-cause mortality rates—deaths due to any cause—following a fracture decreased over the observation period.
Osteoporosis care gap
Of those who had an osteoporosis-related fracture, less than 20% received an osteoporosis diagnosis, underwent a bone mineral density (BMD) test or received a prescription for an osteoporosis-related medication within one year of the fracture. At 7.8%, the percentage of those who had a BMD test within one year of a fracture was particularly low. Men were less likely than women to receive any intervention following a fracture.
With a growing and aging Canadian population, prevention and appropriate care is essential to reduce the number of osteoporosis-related fractures. While secondary fracture prevention is a logical first step (i.e., targeting those individuals with a new fracture first as they are the most readily identifiable group and at highest risk for future fractures), few Canadians receive the appropriate follow-up. Expanded efforts with a focus on educating all stakeholders and integrating hospital and community health services are essential for improving osteoporosis care following a fracture. Furthermore, promoting the adoption of a bone-healthy lifestyle at all ages is necessary to prevent the development of osteoporosis and related fractures.
Osteoporosis and related fractures in Canada
Osteoporosis occurs when bone tissue loss is faster than normal, causing it to become weak and fracture easily. Often people are not aware they have osteoporosis until a fracture occurs. Common fracture sites include forearm, hip, spine, humerus and pelvis. Hip fractures are among the most serious.
Text description
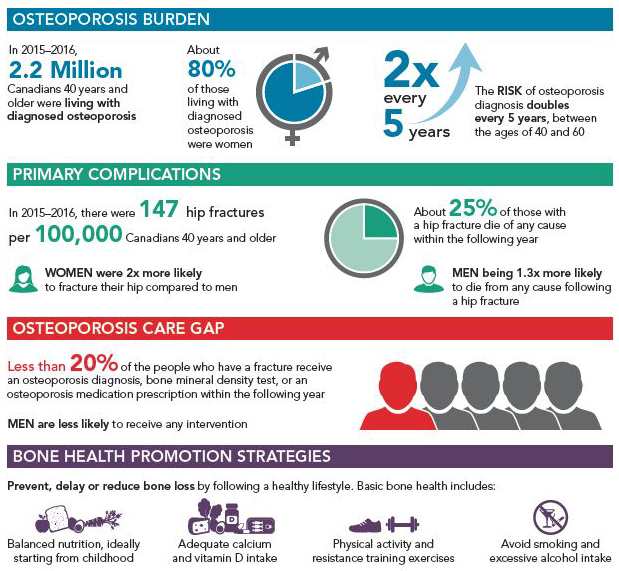
Osteoporosis BurdenFootnote 1
- In 2015-2016, 2.2 million Canadians 40 years and older were living with diagnosed osteoporosis
- About 80 % living with diagnosed osteoporosis were women
- 2x every 5 years - The risk of an osteoporosis diagnosis doubles every 5 years between the age of 40 and 60
Primary ComplicationsFootnote 1
- In 2015-2016, there were 147 hip fractures per 100,000 Canadians 40 years and older
- Women were 2x more likely to fracture their hip compared to men
- About 25% of those with a hip fracture die of any cause within the following year
- Men being 1.3x more likely to die from any cause following a hip fracture
Osteoporosis Care GapFootnote 2
- Less than 20% of the people who have a fracture receive an osteoporosis diagnosis, bone mineral density test, or an osteoporosis medication prescription within the following year
- Men are less likely to receive any intervention
Bone Health Promotion Strategies
Prevent, delay or reduce bone loss by following a healthy lifestyle. Basic bone health includes:
- Balanced nutrition, ideally starting from childhood
- Adequate calcium and vitamin D intake
- Physical activity and resistance training exercises
- Avoid smoking and excessive alcohol intake
Data Source: Footnote 1Canadian Chronic Disease Surveillance System (CCDSS), July 2018: rates do not include data from Yukon or Saskatchewan for the last year of reportable data. Coverage for the osteoporosis care gap outcomes varies by jurisdiction. Footnote 2CCDSS, August 2022: coverage for the osteoporosis care gap outcomes varies by jurisdiction. CCDSS data are based on health administrative data and capture people with osteoporosis who had contact with the health system during the data collection period. This may underestimate the total number of people diagnosed with osteoporosis during a lifetime.
Acknowledgment: This work was made possible through collaboration between PHAC and all Canadian provincial and territorial governments, and expert contribution from the CCDSS Osteoporosis Working Group.
1. Introduction
1.1 Osteoporosis defined
Our bones are constantly renewed through a natural process in which new bone cells replace old bone. As we age, however, this process becomes less efficient and we begin to gradually lose bone tissue. Osteoporosis is a metabolic disease where bone loss occurs faster than normal, causing bones to become thin and weak over time. It is often referred to as "the silent thief" as bone can deteriorate over a number of years without any symptoms.

Text Description
The figure on the left shows the cross-section of a normal bone. It reveals a scaffolding structure with tight honeycomb like bonds. The figure on the right shows the cross-section of an osteoporotic bone. The bone structure is more porous compared to the normal bone. It presents larger honeycombs, which result in reduced bone density and quality.
When bones become severely weakened by osteoporosis, a simple movement (such as bending over to pick up a bag of groceries) or a minor trauma (such as a fall from standing height) can lead to a break or crack in the bone. The most common sites for such fragility fractures are the forearm, hip, spine, humerus and pelvis.
1.2 Risk factors
Although osteoporosis is more common in women and older individuals, it can affect people of all ages. Several factors play a role in the development of osteoporosis, and the more risk factors a person has, the greater their risk.
Modifiable risk factors associated with osteoporosis include a diet low in calcium, vitamin D and other important nutrients related to bone health; low body weight (< 60 kg) or major weight loss > 10% of body weight documented at age 25); physical inactivity; smoking; and excessive alcohol intake (more than three drinks per day).
Non-modifiable risk factors include a personal history of fragility fracture after age 40 years, parental hip fracture, older age, female sex and ethnicity. Other risk factors include hormonal deficits such as in the case of hypogonadism (i.e., reduction or absence of hormone secretion or other physiological activity of the testes or ovaries) or premature menopause (< 45 years); long-term use of specific medications (e.g., glucocorticoids); and certain medical conditions (e.g., primary hyperparathyroidism, chronic inflammatory conditions, malabsorption states or conditions).Footnote 1
Since bone loss occurs without symptoms, a bone mineral density (BMD) test is often done to confirm a diagnosis of osteoporosis. BMD should be measured with dual-energy x-ray absorptiometry (DXA) when an individual has any of the indicators for low bone density shown in Table 1.
Table 1. Indications for measuring bone mineral density (BMD)Footnote 1
- Younger adults (< 50 years)
- Fragility fracture
- Prolonged use of glucocorticoids or other high-risk medication
- Hypogonadism or premature menopause (< 45 years)
- Malabsorption states or conditions
- Primary hyperparathyroidism
- Other disorders strongly associated with rapid bone loss and/or fracture
- Older adults (50–64 years)
- Fragility fracture
- Prolonged use of glucocorticoids or other high-risk medication
- Parental hip fracture
- Vertebral fracture or osteopenia identified on radiography
- Excessive alcohol intake
- Smoking
- Low body weight (< 60 kg) or major weight loss (> 10% of body weight at age 25)
- Rheumatoid arthritis
- Other disorders strongly associated with osteoporosis
- Seniors (≥ 65 years)
- All men and women
1.3 Impacts
Fractures due to osteoporosis can seriously affect an individual's overall well-being and quality of life.Footnote 2Footnote 3Footnote 4 The consequences of sustaining these fractures can vary greatly and may depend on many factors including, but not limited to, age, sex and the fracture site.Footnote 5
Physical effects can include chronic pain, reduced mobility, loss of height, disability and premature death.Footnote 3Footnote 6Footnote 7 Furthermore, psychological consequences often ensue.Footnote 8 One of the most commonly reported is anxiety due to fear of future fractures, consequent impairment and worries about falling. Depression, another common emotional reaction among individuals living with a chronic illness, is also associated with osteoporosis. Moreover, there are social consequences including loss of social role and social isolation. Both are strongly influenced by the physical and psychological challenges associated with the disease and its complications.
Fractures, as a result of osteoporosis, also represent a major socioeconomic burden due to the high prevalence of post-fracture hospitalization and rehabilitation, and increased risk of long-term disability and long-term care.Footnote 9Footnote 10Footnote 11 In 2014, the total economic burden of osteoporosis was estimated at $4.6 billionFootnote 6. Direct health care costs, including acute care, physician services, prescription drugs, rehabilitation, complex continuing care, home care, long-term care and mobility devices, were approximately $4.3 billion; while, indirect costs due to productivity losses were close to $305 million.
Despite the serious consequences of osteoporotic fractures, there are pharmacological and non-pharmacological interventions that can reduce fracture risk.Footnote 1 Unfortunately, most individuals at high risk of fracture do not undergo appropriate assessment or treatment.Footnote 9Footnote 10Footnote 11
1.4 Purpose of this report
The purpose of this report is to provide a national perspective on diagnosed osteoporosis, related fractures and the osteoporosis care gap among Canadians 40 years and older. It reports on administrative health data from the Canadian Chronic Disease Surveillance System (CCDSS) from fiscal year 2015–2016 as well as trend data spanning 15 years (2000–2001 to 2015–2016). Data from all provinces and territories, with the exception of Yukon and Nunavut prior to 2005–2006 and Saskatchewan for 2015–2016, were available for this report.
The CCDSS is the result of a collaborative network of provincial and territorial surveillance systems supported by the Public Health Agency of Canada (PHAC). It collects data on all residents who are eligible for provincial or territorial health insurance and can generate national estimates and trends over time for over 20 chronic diseases and other selected health outcomes. To identify people with chronic diseases, validated case definitions are applied to linked health administrative databases (i.e., provincial and territorial health insurance registry records, physician billing claims and hospital discharge abstract records) using a unique personal identifier.
The information in this report helps to fulfill PHAC's commitment to conduct surveillance on chronic diseases in Canada and build the evidence base required to support the planning of health services and the development of health policies and programs. Technical and methodological notes about the CCDSS, including definitions used to identify osteoporosis and related fracture cases, can be found in Appendices A–E. The data presented, and subsequent updates, can be accessed online through PHAC's Public Health Infobase.
2. Osteoporosis burden
Osteoporosis, a metabolic bone disease characterized by low bone density and elevated risk of fracture, affects a large proportion of the adult Canadian population. In this chapter, the prevalence and incidence (new cases) of diagnosed osteoporosis as well as, all-cause mortality with and without the disease are presented for those age 40 years and older. The estimates within likely underestimate the true burden of osteoporosis as not all eligible cases are included in the CCDSS. Those who did not seek care and remain undiagnosed; those who were diagnosed prior to the observation period but did not seek care during the observation period; those who sought care but did not receive a relevant diagnostic code; those seen by a salaried physician who does not "shadow bill"; and those who exclusively sought privately funded care are not captured (refer to Appendix E for more information). Definitions used to identify osteoporosis cases can be found in Appendix B.
2.1 Prevalence of diagnosed osteoporosis
2.1.1 Age and sex distribution in 2015–2016
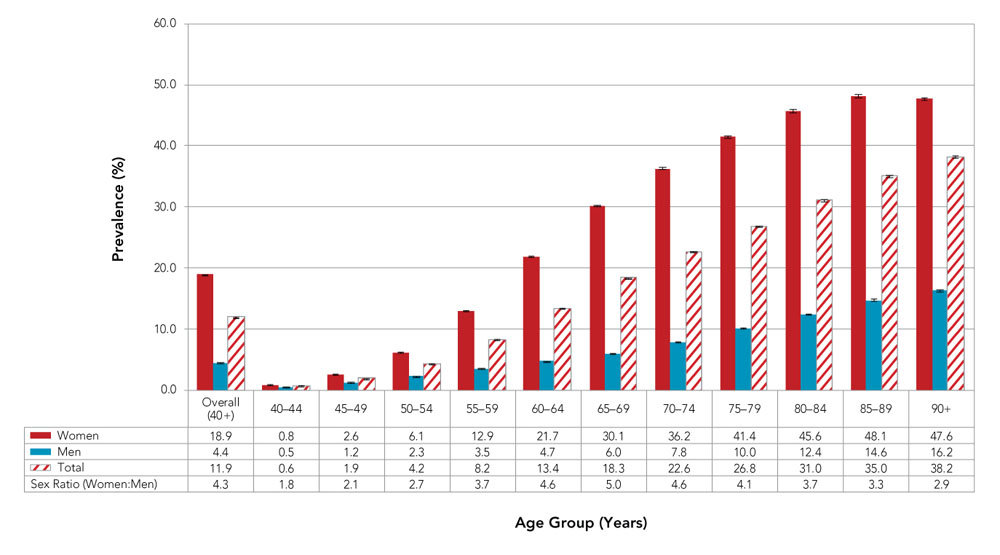
- About 2.2 million (1.8 million women; 400,000 men) or 11.9% of Canadians 40 years and older were living with diagnosed osteoporosis (excluding Yukon and Saskatchewan) (Figure 1).
- Diagnosed osteoporosis prevalence increased with age with the risk of a diagnosis doubling every five years between the ages of 40 and 60. The highest overall prevalence was among those aged 90 years and older (38.2%).
- Women had a higher prevalence of diagnosed osteoporosis than men overall and in all age groups. The largest relative difference was among those aged 65–69 years (sex ratio of 5.0).
- Figure 1 Footnote a
-
Data from YT and SK were not available.
Notes: The 95% confidence interval shows an estimated range of values that is likely to include the true prevalence 19 times out of 20.
Source: Public Health Agency of Canada, using Canadian Chronic Disease Surveillance System data files contributed by provinces and territories, July 2018. Public Health Agency of Canada, using Canadian Chronic Disease Surveillance System data files contributed by provinces and territories, July 2018.
Text description
| Age group (years) | ||||||||||||
|---|---|---|---|---|---|---|---|---|---|---|---|---|
| Overall (40+) | 40-44 | 45-49 | 50-54 | 55-59 | 60-64 | 65-69 | 70-74 | 75-79 | 80-84 | 85-89 | 90+ | |
| Women | 18.9 | 0.8 | 2.6 | 6.1 | 12.9 | 21.7 | 30.1 | 36.2 | 41.4 | 45.6 | 48.1 | 47.6 |
| Men | 4.4 | 0.5 | 1.2 | 2.3 | 3.5 | 4.7 | 6.0 | 7.8 | 10.0 | 12.4 | 14.6 | 16.2 |
| Total | 11.9 | 0.6 | 1.9 | 4.2 | 8.2 | 13.4 | 18.3 | 22.6 | 26.8 | 31.0 | 35.0 | 38.2 |
| Sex Ratio (Women:Men) | 4.3 | 1.8 | 2.1 | 2.7 | 3.7 | 4.6 | 5.0 | 4.6 | 4.1 | 3.7 | 3.3 | 2.9 |
2.1.2 Trends over time
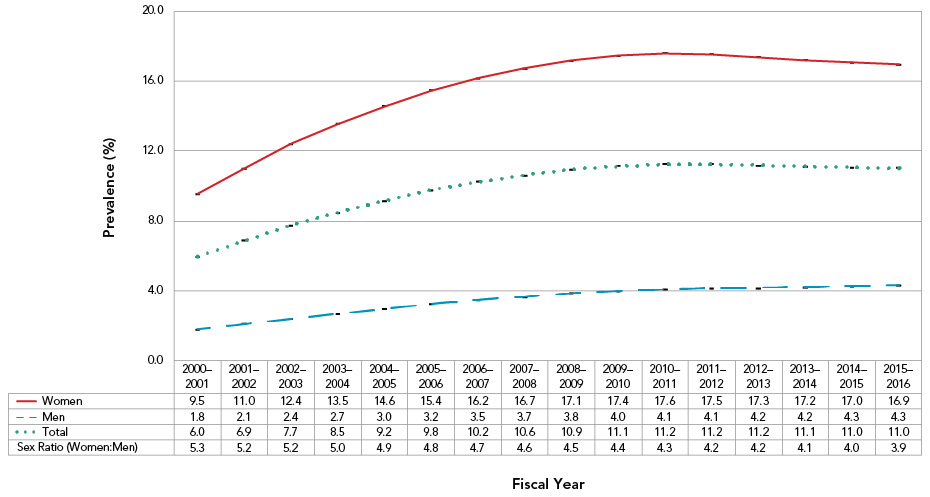
Overall, the age-standardized prevalence of diagnosed osteoporosis among Canadians 40 years and older increased from 6.0% in 2000–2001 to 11.0% in 2015–2016 (Figure 2). Trends over time differed between women and men.
- Among women, the age-standardized prevalence increased substantially over the first three years [annual percent change (APC) = 12.9%, p < 0.001]; to a lesser degree between 2003–2004 and 2008–2009 (APC = 4.5%, p < 0.001); and then decreased slightly for the remainder of the surveillance period (APC = −0.4%, p = 0.01).
- Among men, the age-standardized prevalence increased over the duration of the surveillance period: the change was considerable over the first four years (APC = 13.1%, p < 0.001); to a lesser extent between 2004–2005 and 2008–2009 (APC = 6.7%, p < 0.001); and slight thereafter (APC = 1.4%, p < 0.001).
- The age-standardized prevalence was, on average, about 4.5 times higher among women than men over the surveillance period; however, sex differences decreased over time.
Figure 2: Age-standardizedFigure 2 Footnote a prevalence of diagnosed osteoporosis among Canadians 40 years and older, by sex, Canada,Figure 2 Footnote b 2000–2001 to 2015–2016
- Figure 2 Footnote a
-
Age-standardized to 2011 Canadian population using life-course age groups.
- Figure 2 Footnote b
-
Data from YT were not available. Data from NU were excluded before fiscal year 2005–2006. Data from SK were not available for 2015–2016.
Notes: The 95% confidence interval shows an estimated range of values that is likely to include the true prevalence 19 times out of 20.
Source: Public Health Agency of Canada, using Canadian Chronic Disease Surveillance System data files contributed by provinces and territories, July 2018. Public Health Agency of Canada, using Canadian Chronic Disease Surveillance System data files contributed by provinces and territories, July 2018.
Text description
| Fiscal Year | ||||||||||||||||
|---|---|---|---|---|---|---|---|---|---|---|---|---|---|---|---|---|
| 2000-2001 | 2001-2002 | 2002-2003 | 2003-2004 | 2004-2005 | 2005-2006 | 2006-2007 | 2007-2008 | 2008-2009 | 2009-2010 | 2010-2011 | 2011-2012 | 2012-2013 | 2013-2014 | 2014-2015 | 2015-2016 | |
| Women | 9.5 | 11 | 12.4 | 13.5 | 14.6 | 15.4 | 16.2 | 16.7 | 17.1 | 17.4 | 17.6 | 17.5 | 17.3 | 17.2 | 17.0 | 16.9 |
| Men | 1.8 | 2.1 | 2.4 | 2.7 | 3.0 | 3.2 | 3.5 | 3.7 | 3.8 | 4.0 | 4.1 | 4.1 | 4.2 | 4.2 | 4.3 | 4.3 |
| Total | 6.0 | 6.9 | 7.7 | 8.5 | 9.2 | 9.8 | 10.2 | 10.6 | 10.9 | 11.1 | 11.2 | 11.2 | 11.2 | 11.1 | 11.0 | 11.0 |
| Sex Ratio (Women:Men) | 5.3 | 5.2 | 5.2 | 5.0 | 4.9 | 4.8 | 4.7 | 4.6 | 4.5 | 4.4 | 4.3 | 4.2 | 4.2 | 4.1 | 4.0 | 3.9 |
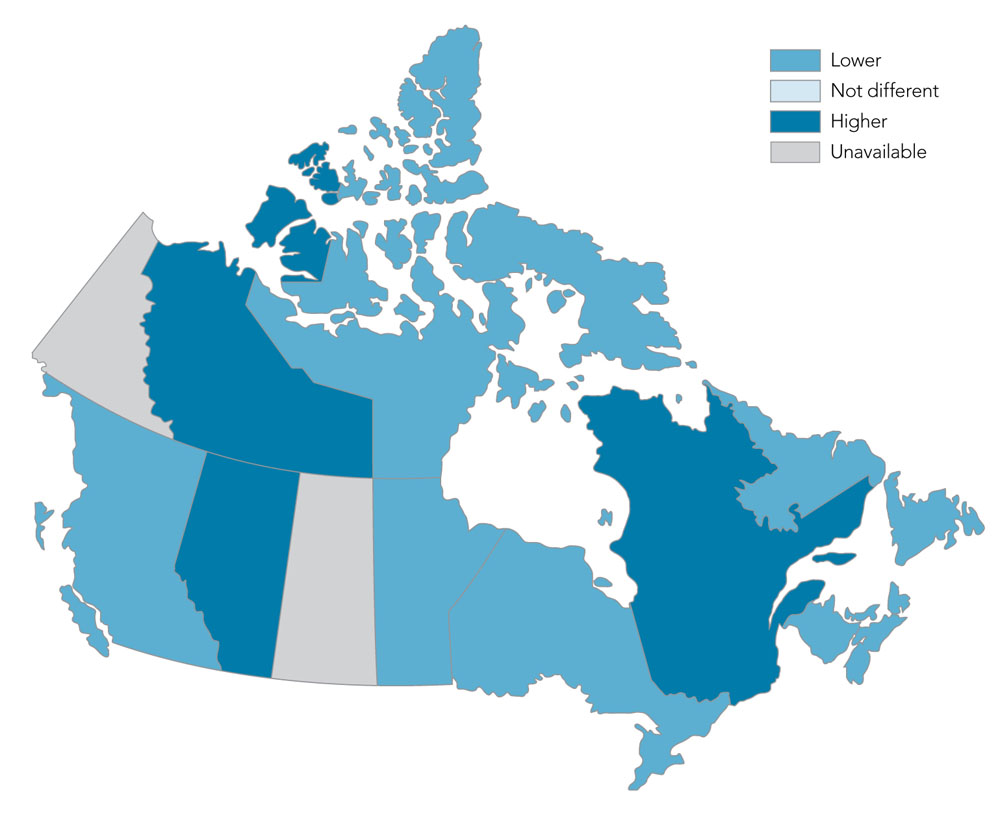
2.1.3 Provincial and territorial distribution in 2015–2016
Across Canada, diagnosed osteoporosis prevalence varied by province/territory. All differences from the national average presented are statistically significant.
- Age-standardized prevalence of diagnosed osteoporosis ranged from a low of 5.3% in Nunavut to a high of 13.9% in Alberta (Figure 3).
- Rates were higher than the national average in the Northwest Territories, Alberta and Quebec, while rates were lower than the national average in Nunavut, British Columbia, Manitoba, Ontario and the Atlantic provinces.
Figure 3: Age-standardizedFigure 3 Footnote a prevalence of diagnosed osteoporosis among Canadians 40 years and older, by province/territory, Canada,Figure 3 Footnote b 2015–2016
- Figure 3 Footnote a
-
Age-standardized to 2011 Canadian population using life-course age groups.
- Figure 3 Footnote b
-
Data from YT were not available. Data from NU were excluded before fiscal year 2005–2006. Data from SK were not available for 2015–2016.
Notes: The 95% confidence interval shows an estimated range of values that is likely to include the true prevalence 19 times out of 20.
Source: Public Health Agency of Canada, using Canadian Chronic Disease Surveillance System data files contributed by provinces and territories, July 2018. Public Health Agency of Canada, using Canadian Chronic Disease Surveillance System data files contributed by provinces and territories, July 2018.
Text description
| Province/Territory | Age-standardizedFigure 3 Footnote a Prevalence (%) | 95% Confidence Interval |
|---|---|---|
| YT | NA | NA |
| NT | 12.6 | 12.0–13.2 |
| NU | 5.3 | 4.6–6.0 |
| BC | 9.2 | 9.1–9.2 |
| AB | 13.9 | 13.8–13.9 |
| SK | NA | NA |
| MB | 8.8 | 8.7–8.9 |
| ON | 11.0 | 11.0–11.0 |
| QC | 12.5 | 12.5–12.5 |
| NB | 6.3 | 6.2–6.3 |
| NS | 8.6 | 8.5–8.7 |
| PE | 7.2 | 7.0–7.3 |
| NL | 7.1 | 7.0–7.2 |
| CanadaFigure 3 Footnote b | 11.0 | 11.0–11.0 |
2.2 Incidence (new cases) of diagnosed osteoporosis
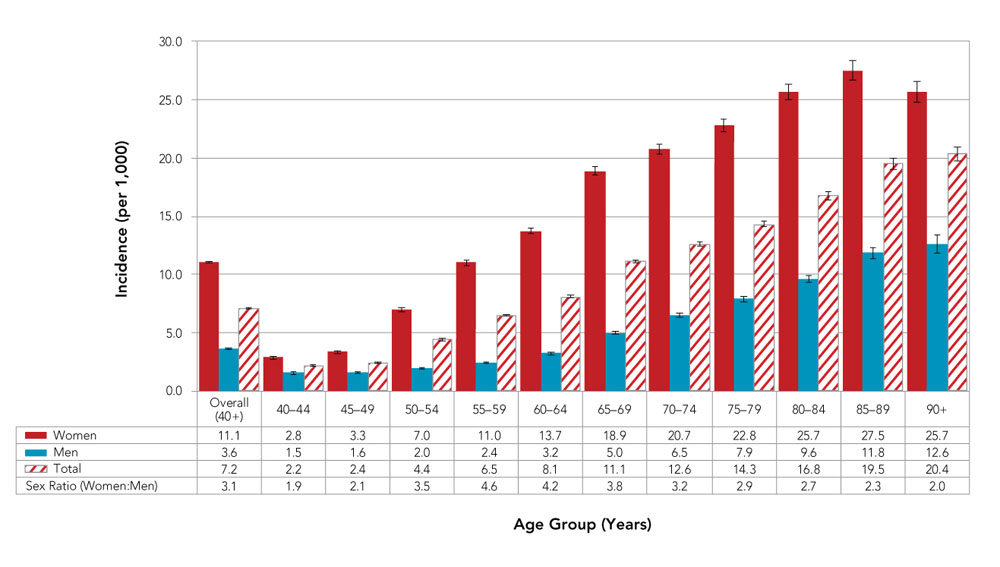
2.2.1 Age and sex distribution in 2015–2016
- Approximately 119,000 (or 7.2 per 1,000) Canadians 40 years and older were newly diagnosed with osteoporosis (excluding Yukon and Saskatchewan) (Figure 4).
- Diagnosed osteoporosis incidence increased with age, with the highest overall incidence among those aged 90 years and older (20.4 new cases per 1,000).
- Women had a higher incidence of diagnosed osteoporosis than men overall and in all age groups. The largest relative difference in incidence was among those aged 55–59 years (sex ratio: 4.6).
Figure 4. Incidence of diagnosed osteoporosis among Canadians 40 years and older, by age group and sex, Canada,Figure 4 Footnote a 2015–2016
- Figure 4 Footnote a
-
Data from YT and SK were not available.
Notes: The 95% confidence interval shows an estimated range of values that is likely to include the true prevalence 19 times out of 20.
Source: Public Health Agency of Canada, using Canadian Chronic Disease Surveillance System data files contributed by provinces and territories, July 2018.
Text description
| Age group (years) | ||||||||||||
|---|---|---|---|---|---|---|---|---|---|---|---|---|
| Overall (40+) | 40-44 | 45-49 | 50-54 | 55-59 | 60-64 | 65-69 | 70-74 | 75-79 | 80-84 | 85-89 | 90+ | |
| Women | 11.1 | 2.8 | 3.3 | 7.0 | 11.0 | 13.7 | 18.9 | 20.7 | 22.8 | 25.7 | 27.5 | 25.7 |
| Men | 3.6 | 1.5 | 1.6 | 2.0 | 2.4 | 3.2 | 5.0 | 6.5 | 7.9 | 9.6 | 11.8 | 12.6 |
| Total | 7.2 | 2.2 | 2.4 | 4.4 | 6.5 | 8.1 | 11.1 | 12.6 | 14.3 | 16.8 | 19.5 | 20.4 |
| Sex Ratio (Women:Men) | 3.1 | 1.9 | 2.1 | 3.5 | 4.6 | 4.2 | 3.8 | 3.2 | 2.9 | 2.7 | 2.3 | 2.0 |
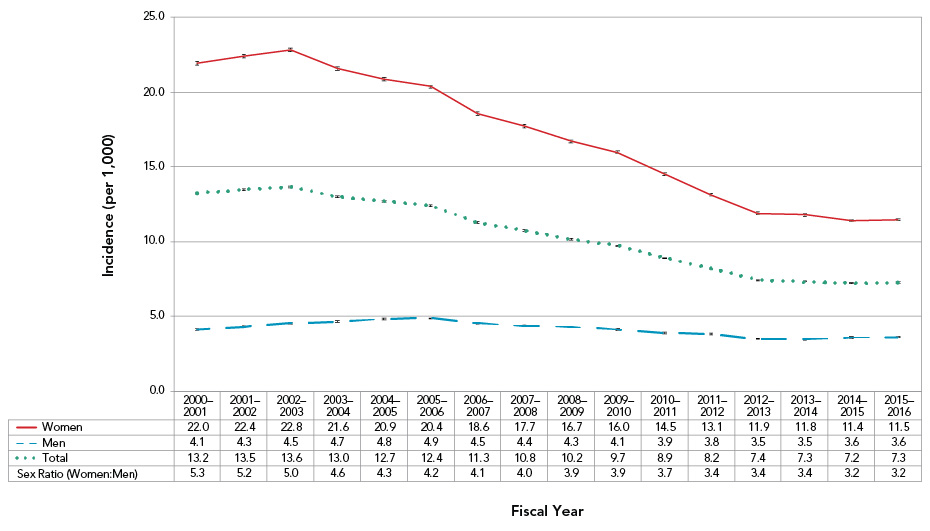
2.2.2 Trends over time
Overall, the age-standardized incidence (per 1,000) of diagnosed osteoporosis among Canadians 40 years and older decreased from 13.2 in 2000–2001 to 7.3 in 2015–2016 (Figure 5). This decrease was largely driven by a decline in new cases among women.
- Among women, the age-standardized incidence decreased slightly in the first five years
- (APC = −1.8, p = 0.04) and more substantially between 2005–2006 and 2012–2013
- (APC = −7.2, p < 0.001) and stabilized thereafter.
- In men, the age-standardized incidence increased in the first four years (APC = 4.7, p < 0.001), decreased between 2004–2005 and 2013–2014 (APC = −3.8, p < 0.001) and then stabilized for the remainder of the surveillance period.
- On average, the age-standardized incidence was about 4.1 times higher among women than men; however, sex differences gradually decreased over the surveillance period.
Figure 5. Age-standardizedFigure 5 Footnote a incidence of diagnosed osteoporosis among Canadians 40 years and older, by sex, Canada,Figure 5 Footnote b 2000–2001 to 2015–2016
- Figure 5 Footnote a
-
Age-standardized to 2011 Canadian population using life-course age groups.
- Figure 5 Footnote b
-
Data from YT were not available. Data from NU were excluded before fiscal year 2005–2006. Data from SK were not available for 2015–2016.
Notes: The 95% confidence interval shows an estimated range of values that is likely to include the true prevalence 19 times out of 20.
Source: Public Health Agency of Canada, using Canadian Chronic Disease Surveillance System data files contributed by provinces and territories, July 2018.
Text description
| Fiscal Year | ||||||||||||||||
|---|---|---|---|---|---|---|---|---|---|---|---|---|---|---|---|---|
| 2000-2001 | 2001-2002 | 2002-2003 | 2003-2004 | 2004-2005 | 2005-2006 | 2006-2007 | 2007-2008 | 2008-2009 | 2009-2010 | 2010-2011 | 2011-2012 | 2012-2013 | 2013-2014 | 2014-2015 | 2015-2016 | |
| Women | 22.0 | 22.4 | 22.8 | 21.6 | 20.9 | 20.4 | 18.6 | 17.7 | 16.7 | 16.0 | 14.5 | 13.1 | 11.9 | 11.8 | 11.4 | 11.5 |
| Men | 4.1 | 4.3 | 4.5 | 4.7 | 4.8 | 4.9 | 4.5 | 4.4 | 4.3 | 4.1 | 3.9 | 3.8 | 3.5 | 3.5 | 3.6 | 3.6 |
| Total | 13.2 | 13.5 | 13.6 | 13.0 | 12.7 | 12.4 | 11.3 | 10.8 | 10.2 | 9.7 | 8.9 | 8.2 | 7.4 | 7.3 | 7.2 | 7.3 |
| Sex Ratio (Women:Men) | 5.3 | 5.2 | 5.0 | 4.6 | 4.3 | 4.2 | 4.1 | 4.0 | 3.9 | 3.9 | 3.7 | 3.4 | 3.4 | 3.4 | 3.2 | 3.2 |
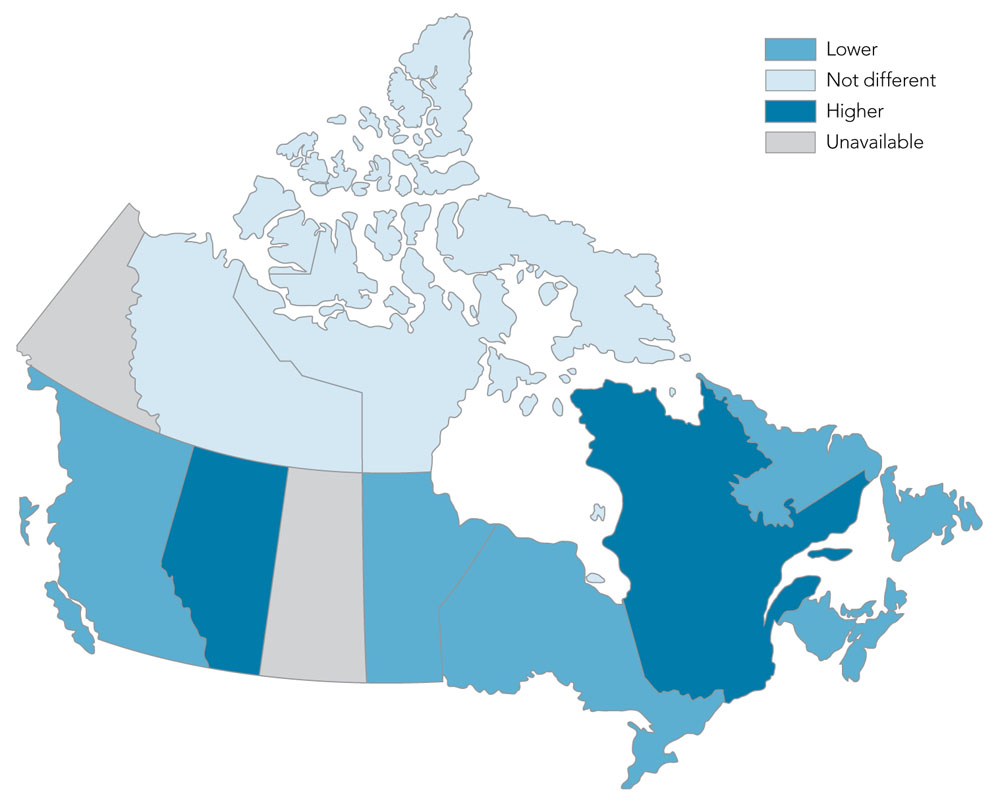
2.2.3 Provincial and territorial distribution in 2015–2016
Across Canada, diagnosed osteoporosis incidence varied by province/territory. All differences from the national average presented are statistically significant.
- Age-standardized incidence of diagnosed osteoporosis ranged from a low of 3.9 per 1,000 in New Brunswick to a high of 9.5 per 1,000 in Alberta (Figure 6).
- Rates were higher than the national average in Alberta and Quebec, while rates in British Columbia, Manitoba, Ontario and the Atlantic provinces were lower than the national average. Rates in Northwest Territories and Nunavut were not statistically different from Canada as a whole.
Figure 6. Age-standardizedFigure 6 Footnote a incidence of diagnosed osteoporosis among Canadians 40 years and older, by province/territory, Canada,Figure 6 Footnote b 2015–2016
- Figure 6 Footnote a
-
Age-standardized to 2011 Canadian population using life-course age groups.
- Figure 6 Footnote b
-
Data from YT and SK were not available.
E Interpret with caution, coefficient of variation between 16.6% and 33.3%.
Notes: % = percentage. NA = not available. The 95% confidence interval shows an estimated range of values that is likely to include the true prevalence 19 times out of 20.
Source: Public Health Agency of Canada, using Canadian Chronic Disease Surveillance System data files contributed by provinces and territories, July 2018.
Text description
| Province/Territory | Age-standardizedFigure 6 Footnote a Incidence (per 1,000) |
95% Confidence Interval |
|---|---|---|
| YT | NA | NA |
| NT | 7.1 | 5.6–9.1 |
| NU | 4.5E | 2.8–7.5E |
| BC | 6.9 | 6.7–7.0 |
| AB | 9.5 | 9.3–9.6 |
| SK | NA | NA |
| MB | 6.1 | 5.9–6.3 |
| ON | 6.5 | 6.4–6.6 |
| QC | 9.1 | 9.0–9.2 |
| NB | 3.9 | 3.7–4.1 |
| NS | 5.0 | 4.8–5.2 |
| PE | 5.2 | 4.8–5.8 |
| NL | 4.8 | 4.5–5.0 |
| CanadaFigure 6 Footnote b | 7.3 | 7.2–7.3 |
2.3 All-cause mortality among those with and without diagnosed osteoporosis
2.3.1 Age and sex distribution in 2015–2016
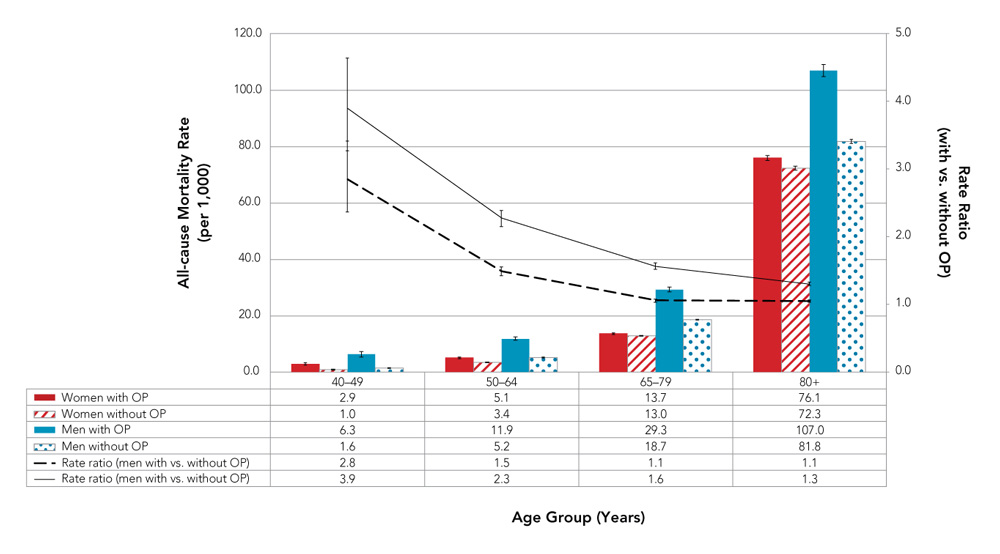
- About 65,000 (or 29.3 per 1,000) Canadians 40 years and older with diagnosed osteoporosis died of any cause (excluding Yukon and Saskatchewan).
- Deaths due to any cause, irrespective of disease status, were more frequent among older age groups. However, upon comparing those with, versus without, diagnosed osteoporosis, the all-cause mortality rate ratios were greater among younger age groups (Figure 7).
- Men had higher all-cause mortality rates and rate ratios than women regardless of the age group. The largest relative difference in rate ratios between men and women was among those aged 50–64 years.
Figure 7. All-cause mortality rates and rate ratios among Canadians 40 years and older with and without diagnosed osteoporosis, by age group and sex, Canada,Figure 7 Footnote a 2015–2016
- Figure 7 Footnote a
-
Data from YT and SK were not available.
Notes: OP = osteoporosis. The 95% confidence interval shows an estimated range of values that is likely to include the true prevalence 19 times out of 20.
Source: Public Health Agency of Canada, using Canadian Chronic Disease Surveillance System data files contributed by provinces and territories, July 2018.
Text description
| Age Group (Years) | ||||
|---|---|---|---|---|
| 40-49 | 50-64 | 65-79 | 80+ | |
| Women with OP | 2.9 | 5.1 | 13.7 | 76.1 |
| Women without OP | 1.0 | 3.4 | 13.0 | 72.3 |
| Men with OP | 6.3 | 11.9 | 29.3 | 107.0 |
| Men without OP | 1.6 | 5.2 | 18.7 | 81.8 |
| Rate ratio (women with vs. without OP) | 2.8 | 1.5 | 1.1 | 1.1 |
| Rate ratio (men with vs. without OP) | 3.9 | 2.3 | 1.6 | 1.3 |
2.3.2 Trends over time
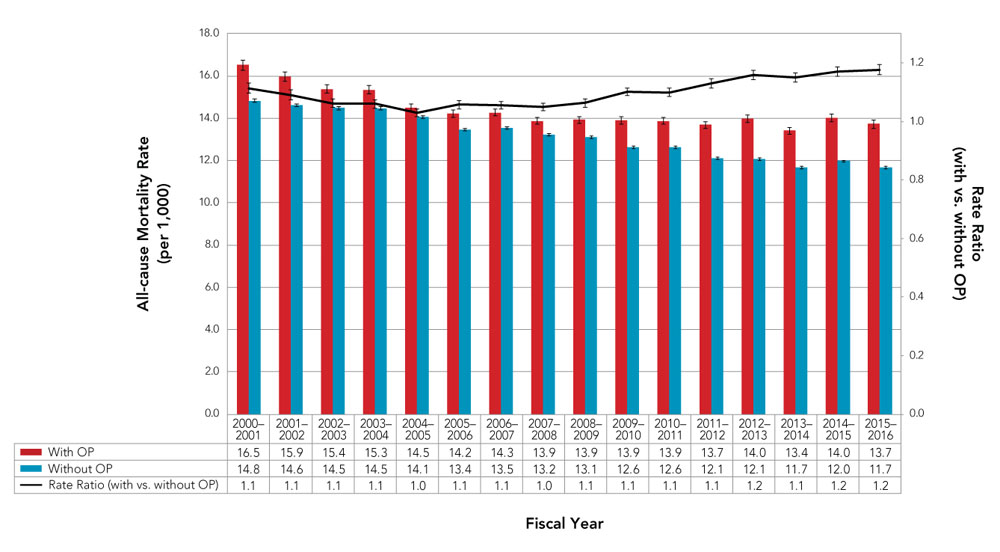
- Among Canadians 40 years and older with diagnosed osteoporosis, age-standardized all-cause mortality rates decreased within the first five years (APC = −3.1%, p < 0.001), but stabilized thereafter, while among those without diagnosed osteoporosis, the rates decreased over the entire time period (APC = −1.7%, p < 0.001) (Figure 8).
- Overall, the age-standardized all-cause mortality rate ratios (i.e., with, versus without, diagnosed osteoporosis) were relatively low (average rate ratio of 1.1); however, increased significantly between 2007–2008 and 2015–2016.
Figure 8. Age-standardizedFigure 8 Footnote a all-cause mortality rates and rate ratios among Canadians 40 years and older, with and without diagnosed osteoporosis, Canada,Figure 8 Footnote b 2000–2001 to 2015–2016
- Figure 8 Footnote a
-
Age-standardized to 2011 Canadian population using life-course age groups.
- Figure 8 Footnote b
-
Data from YT were not available. Data from NU were excluded before fiscal year 2005–2006. Data from SK were not available for 2015–2016.
Notes: OP = osteoporosis. The 95% confidence interval shows an estimated range of values that is likely to include the true prevalence 19 times out of 20.
Source: Public Health Agency of Canada, using Canadian Chronic Disease Surveillance System data files contributed by provinces and territories, July 2018.
Text description
| Fiscal Year | ||||||||||||||||
|---|---|---|---|---|---|---|---|---|---|---|---|---|---|---|---|---|
| 2000-2001 | 2001-2002 | 2002-2003 | 2003-2004 | 2004-2005 | 2005-2006 | 2006-2007 | 2007-2008 | 2008-2009 | 2009-2010 | 2010-2011 | 2011-2012 | 2012-2013 | 2013-2014 | 2014-2015 | 2015-2016 | |
| Women | 16.5 | 15.9 | 15.4 | 15.3 | 14.5 | 14.2 | 14.3 | 13.9 | 13.9 | 13.9 | 13.9 | 13.7 | 14.0 | 13.4 | 14.0 | 13.7 |
| Men | 14.8 | 14.6 | 14.5 | 14.5 | 14.1 | 13.4 | 13.5 | 13.2 | 13.1 | 12.6 | 12.6 | 12.1 | 12.1 | 11.7 | 12.0 | 11.7 |
| Rate Ratio (with vs. without OP)) | 1.1 | 1.1 | 1.1 | 1.1 | 1.0 | 1.1 | 1.1 | 1.0 | 1.1 | 1.1 | 1.1 | 1.1 | 1.2 | 1.1 | 1.2 | 1.2 |
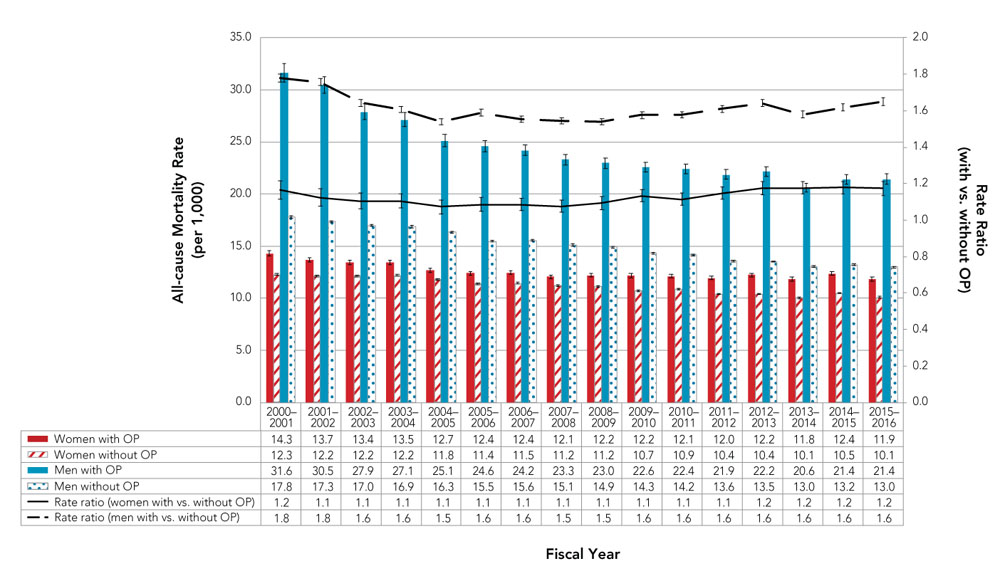
Sex differences in the age-standardized all-cause mortality rates and rate ratios among those with and without diagnosed osteoporosis were observed (Figure 9).
- Among women with diagnosed osteoporosis, rates decreased during the first five years of the surveillance period (APC = −2.8, p < 0.001), but stabilized thereafter, while among women without diagnosed osteoporosis, rates decreased over the entire time period (APC = −1.4, p < 0.001).
- Among men with diagnosed osteoporosis, rates decreased over the surveillance period (APC = −5.3, p < 0.001 between 2000–2001 and 2005–2006 and APC = −1.5, p < 0.001 thereafter), while among men without diagnosed osteoporosis, rates decreased during the first 13 years (APC = −2.3, p < 0.001) but stabilized thereafter.
- The age-standardized all-cause mortality rate ratios (i.e., with, versus, without, diagnosed osteoporosis) were considerably higher among men than women over the entire surveillance period (average rate ratio of 1.6 versus 1.1, respectively).
Figure 9. Age-standardizedFigure 9 Footnote a all-cause mortality rates and rate ratios among Canadians 40 years and older, with and without diagnosed osteoporosis, by sex, Canada,Figure 9 Footnote b 2000–2001 to 2015–2016
- Figure 9 Footnote a
-
Age-standardized to 2011 Canadian population using life-course age groups.
- Figure 9 Footnote b
-
Data from YT were not available. Data from NU were excluded before fiscal year 2005–2006. Data from SK were not available for 2015–2016.
Notes: OP = osteoporosis. The 95% confidence interval shows an estimated range of values that is likely to include the true prevalence 19 times out of 20.
Source: Public Health Agency of Canada, using Canadian Chronic Disease Surveillance System data files contributed by provinces and territories, July 2018.
Text description
| Fiscal Year | ||||||||||||||||
|---|---|---|---|---|---|---|---|---|---|---|---|---|---|---|---|---|
| 2000-2001 | 2001-2002 | 2002-2003 | 2003-2004 | 2004-2005 | 2005-2006 | 2006-2007 | 2007-2008 | 2008-2009 | 2009-2010 | 2010-2011 | 2011-2012 | 2012-2013 | 2013-2014 | 2014-2015 | 2015-2016 | |
| Women with OP | 14.3 | 13.7 | 13.4 | 13.5 | 12.7 | 12.4 | 12.4 | 12.1 | 12.2 | 12.2 | 12.1 | 12.0 | 12.2 | 11.8 | 12.4 | 11.9 |
| Women without OP | 12.3 | 12.2 | 12.2 | 12.2 | 11.8 | 11.4 | 11.5 | 11.2 | 11.2 | 10.7 | 10.9 | 10.4 | 10.4 | 10.1 | 10.5 | 10.1 |
| Men with OP | 31.6 | 30.5 | 27.9 | 27.1 | 25.1 | 24.6 | 24.2 | 23.3 | 23.0 | 22.6 | 22.4 | 21.9 | 22.2 | 20.6 | 21.4 | 21.4 |
| Men without OP | 17.8 | 17.3 | 17.0 | 16.9 | 16.3 | 15.5 | 15.6 | 15.1 | 14.9 | 14.3 | 14.2 | 13.6 | 13.5 | 13.0 | 13.2 | 13.0 |
| Rate Ratio (women with vs. without OP) | 1.2 | 1.1 | 1.1 | 1.1 | 1.1 | 1.1 | 1.1 | 1.1 | 1.1 | 1.1 | 1.1 | 1.1 | 1.2 | 1.2 | 1.2 | 1.2 |
| Rate Ratio (men with vs. without OP) | 1.8 | 1.8 | 1.6 | 1.6 | 1.5 | 1.6 | 1.6 | 1.5 | 1.5 | 1.6 | 1.6 | 1.6 | 1.6 | 1.6 | 1.6 | 1.6 |
2.4 Discussion
Osteoporosis—an age- and sex-related disease
Osteoporosis affects a large proportion of the adult Canadian population. In 2015–2016, approximately 2.2 million (or 11.9%) Canadians 40 years and older were living with diagnosed osteoporosis; about 80% were women. Prevalence of diagnosed osteoporosis increased with age with the risk of a diagnosis doubling every five years between the ages of 40 and 60.
As we age, the process of bone remodeling (i.e., bone formation and bone resorption) becomes less efficient and we gradually begin to lose bone mass. This age-related bone loss increases the risk of developing osteoporosis. Women are especially susceptible due to a number of factors including differences in:Footnote 12Footnote 13
- bone density—women tend to have lower bone density than their male peers;
- sex hormone production—especially the abrupt decline of estrogen, a hormone that protects bones, during menopause; and
- life expectancy—women typically live longer than men, placing them at a greater risk of age-related bone loss.Footnote 14
Although osteoporosis is more common in postmenopausal women, older men have poorer health outcomes related to osteoporotic fractures.Footnote 14Footnote 15Footnote 16 In addition, men are less likely than women to be assessed or treated for osteoporosis after a fracture.Footnote 17 These issues are discussed later in the report.
Osteoporosis burden underestimated
The levelling off of the prevalence of diagnosed osteoporosis in the last seven years of the surveillance period is largely driven by the significant decline in incidence from 2004–2005 to 2013–2014. This decrease may be due to a combination of factors including:
- a general shift from diagnosing osteoporosis based on BMD tests to fracture risk assessment;Footnote 18
- media attention on rare side-effects associated with certain antiresorptive drugs that slow down bone loss, particularly bisphosphonates, and the absence of strong evidence in support of their long-term use;Footnote 9Footnote 10Footnote 11 if physicians are less likely to treat, they are less likely to screen for or diagnose osteoporosis; and
- improvement in underlying risk factors, namely BMD, on a population level, as evidenced by the global decline in hip fracture.Footnote 19Footnote 20
In light of these insights, and the fact that not all individuals with osteoporosis are captured in the CCDSS (refer to Appendix E), the findings presented in this report likely underestimate the total (real) burden of osteoporosis in Canada.
3. Primary complications
Fractures are the clinical consequence of osteoporosis. Fracture sites most attributable to osteoporosis include the forearm, hip, spine, humerus and pelvis.Footnote 21Footnote 22 Hip fractures are among the most serious in light of the life-threatening complications that often ensue. In this chapter, we present annual forearm, hip, spine, humerus and pelvis fracture rates as well as all-cause mortality rates 12 months following a hip fracture among Canadians 40 years and older.
Even though we captured fractures at sites most attributable to osteoporosis, we did not have knowledge of the populations' severity of osteoporotic fracture or injury risk. However, this lack of information is less of a concern given that:
- the vast majority of fractures at these sites (over 80%) are associated with low bone density and predict future fractures;Footnote 23Footnote 24
- the uncertainty surrounding the usefulness of trauma classifications such as low- versus high-impact fractures for determining whether a fracture is related to low bone density or indicates an increased risk of future fracture;Footnote 25 and
- the recent shift in thinking that all fractures in older adults warrant careful evaluation in an effort to reduce the risk of future fractures.Footnote 26 (Refer to Appendix E for more information).
Definitions used to identify osteoporosis-related fractures presented in this chapter can be found in Appendix B. A fracture event was defined by a 6-month episode period where any like fracture codes during this period were considered part of the same event. Therefore, an individual can have more than one fracture in a given fiscal year.
3.1 Osteoporosis-related fractures
3.1.1 Age and sex distribution in 2015–2016
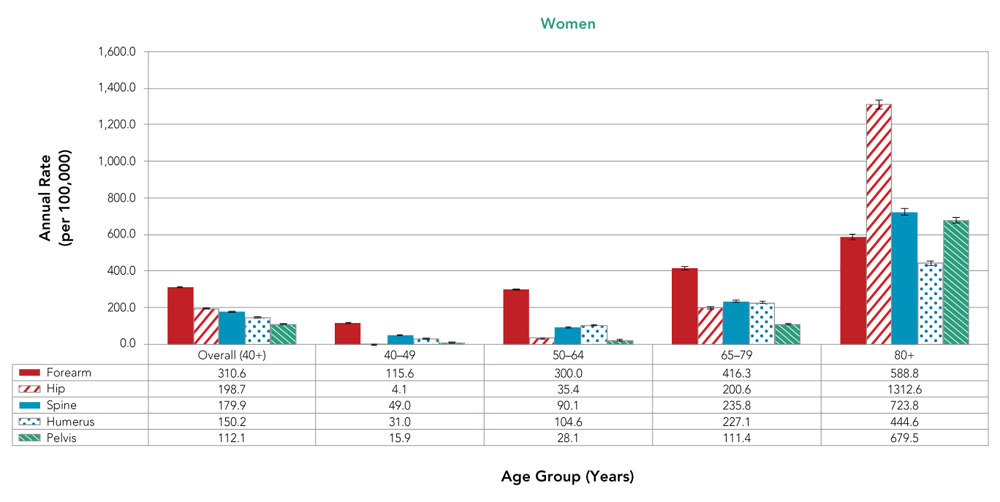
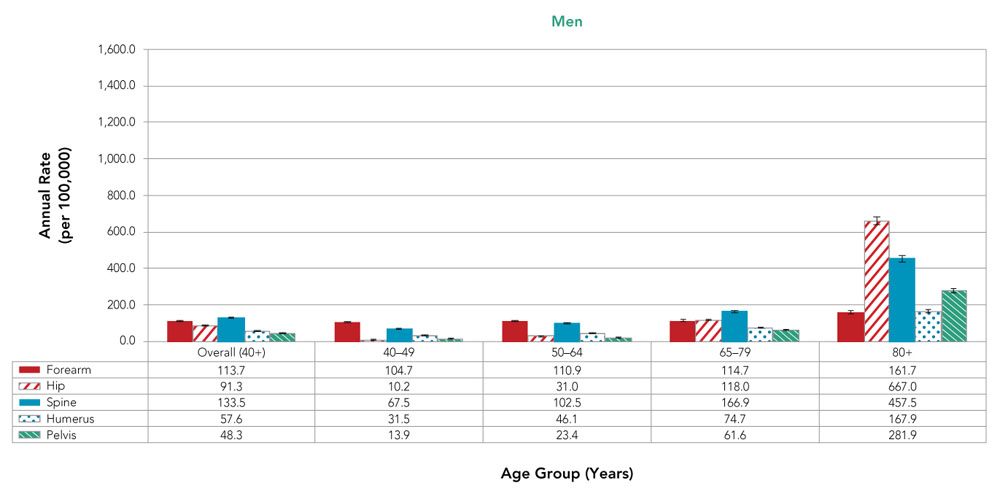
- Canadians 40 years and older (excluding Yukon and Saskatchewan) had approximately 40,200 forearm fractures (215.1 per 100,000); 27,500 hip fractures (146.6 per 100,000); 29,400 spine fractures (157.4 per 100,000); 19,700 humeral fractures (105.2 per 100,000); and 15,200 pelvic fractures (81.1 per 100,000).
- Fracture rates increased with age. Forearm fractures were the most common among Canadians aged 40–79 years and hip fractures were the most common among those aged 80 years and older (Figure 10).
- Women had higher fracture rates than men irrespective of the fracture site. Women were 3 times as likely to fracture their forearm and humerus, more than 2 times as likely to fracture their pelvis and hip and 1.3 times as likely to fracture their spine compared to men.
Figure 10. Annual rates of osteoporosis-related fractures among Canadians 40 years and older, by sex, fracture site and age group, Canada,Figure 10 Footnote a 2015–2016
Text description
| Age Group (Years) | |||||
|---|---|---|---|---|---|
| Overall (40+) | 40-49 | 50-64 | 65-79 | 80+ | |
| Forearm | 310.6 | 115.6 | 300.0 | 416.3 | 588.8 |
| Hip | 198.7 | 4.1 | 35.4 | 200.6 | 1312.6 |
| Spine | 179.9 | 49.0 | 90.1 | 235.8 | 723.8 |
| Humerus | 150.2 | 31.0 | 104.6 | 227.1 | 444.6 |
| Pelvis | 112.1 | 15.9 | 28.1 | 111.4 | 679.5 |
Text description
| Age Group (Years) | |||||
|---|---|---|---|---|---|
| Overall (40+) | 40-49 | 50-64 | 65-79 | 80+ | |
| Forearm | 113.7 | 104.7 | 110.9 | 114.7 | 161.7 |
| Hip | 91.3 | 10.2 | 31.0 | 118.0 | 667.0 |
| Spine | 133.5 | 67.5 | 102.5 | 166.9 | 457.5 |
| Humerus | 57.6 | 31.5 | 46.1 | 74.7 | 167.9 |
| Pelvis | 48.3 | 13.9 | 23.4 | 61.6 | 281.9 |
- Figure 10 Footnote a
-
Data from YT and SK were not available.
Notes: The 95% confidence interval shows an estimated range of values that is likely to include the true prevalence 19 times out of 20.
Source: Public Health Agency of Canada, using Canadian Chronic Disease Surveillance System data files contributed by provinces and territories, July 2018.
3.1.2 Trends over time
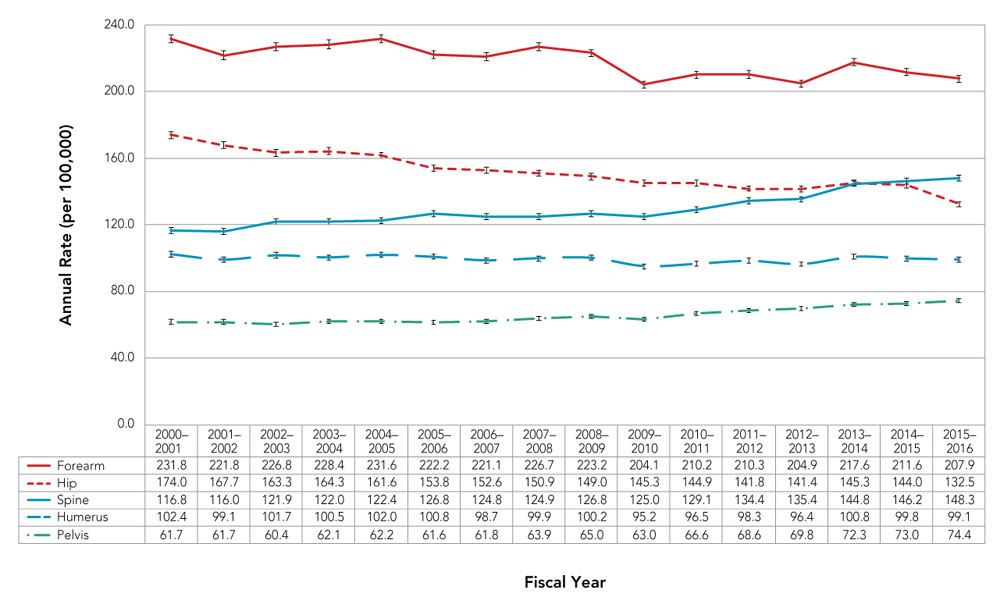
- Age-standardized annual fracture rates among Canadians 40 years and older were highest for forearm, followed by hip, spine, humerus and pelvis, although fracture rates for the hip and spine converged within the last five years, with spine fracture rates exceeding those of hip in 2015–2016 (Figure 11).
- Age-standardized annual fracture rates among Canadians 40 years and older decreased over the entire time period for the forearm (APC = −0.7%, p < 0.001) and hip (APC = −1.4%, p < 0.001); remained stable for the humerus; and increased for spine (APC = 0.9%, p < 0.001 up to 2010–2011 and APC = 3.0%, p < 0.001 thereafter) and pelvis (APC = 0.7%, p = 0.003 up to 2009–2010 and APC = 2.6%, p < 0.001 thereafter). However, the absolute number of fractures at each site increased over the surveillance period.
Figure 11. Age-standardizedFigure 11 Footnote a annual rates of osteoporosis-related fractures among Canadians 40 years and older, by fracture site, Canada,Figure 11 Footnote b 2000–2001 to 2015–2016
- Figure 11 Footnote a
-
Age-standardized to 2011 Canadian population using life-course age groups.
- Figure 11 Footnote b
-
Data from YT were not available. Data from NU were excluded before fiscal year 2005–2006. Data from SK were not available for 2015–2016.
Notes: The 95% confidence interval shows an estimated range of values that is likely to include the true prevalence 19 times out of 20.
Source: Public Health Agency of Canada, using Canadian Chronic Disease Surveillance System data files contributed by provinces and territories, July 2018.
Text description
| Fiscal Year | ||||||||||||||||
|---|---|---|---|---|---|---|---|---|---|---|---|---|---|---|---|---|
| 2000-2001 | 2001-2002 | 2002-2003 | 2003-2004 | 2004-2005 | 2005-2006 | 2006-2007 | 2007-2008 | 2008-2009 | 2009-2010 | 2010-2011 | 2011-2012 | 2012-2013 | 2013-2014 | 2014-2015 | 2015-2016 | |
| Forearm | 231.8 | 221.8 | 226.8 | 228.4 | 231.6 | 222.2 | 221.1 | 226.7 | 223.2 | 204.1 | 210.2 | 210.3 | 204.9 | 217.6 | 211.6 | 207.9 |
| Hip | 174.0 | 167.7 | 163.3 | 164.3 | 161.6 | 153.8 | 152.6 | 150.9 | 149.0 | 145.3 | 144.9 | 141.8 | 141.4 | 145.3 | 144.0 | 132.5 |
| Spine | 116.8 | 116.0 | 121.9 | 122.0 | 122.4 | 126.8 | 124.8 | 124.9 | 126.8 | 125.0 | 129.1 | 134.4 | 135.4 | 144.8 | 146.2 | 148.3 |
| Humerus | 102.4 | 99.1 | 101.7 | 100.5 | 102.0 | 100.8 | 98.7 | 99.9 | 100.2 | 95.2 | 96.5 | 98.3 | 96.4 | 100.8 | 99.8 | 99.1 |
| Pelvis | 61.7 | 61.7 | 60.4 | 62.1 | 62.2 | 61.6 | 61.8 | 63.9 | 65.0 | 63.0 | 66.6 | 68.6 | 69.8 | 72.3 | 73.0 | 74.4 |
3.1.3 Provincial and territorial distribution in 2015–2016
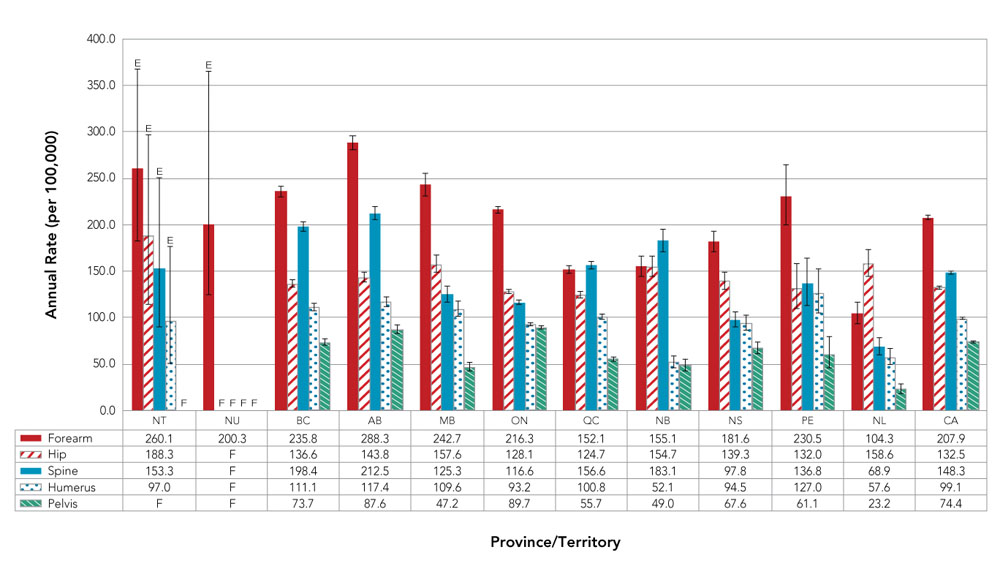
Age-standardized annual fracture rates among Canadians 40 years and older varied greatly across the country (excluding Yukon and Saskatchewan) (Figure 12). Rates (per 100,000) for each of the fracture sites ranged as follows:
- Forearm—highest in Alberta (288.3) and lowest in Newfoundland and Labrador (104.3);
- Hip—highest in Northwest Territories (188.3) and lowest in Quebec (124.7);
- Spine—highest in Alberta (212.5) and lowest in Newfoundland and Labrador (68.9);
- Humerus—highest in Prince Edward Island (127.0) and lowest in New Brunswick (52.1); and
- Pelvis—highest in Ontario (89.7) and lowest in Newfoundland and Labrador (23.2).
Figure 12. Age-standardizedFigure 12 Footnote a annual rates of osteoporosis-related fractures among Canadians 40 years and older, by fracture site and province/territory, Canada,Figure 12 Footnote b 2015–2016
- Figure 12 Footnote a
-
Age-standardized to 2011 Canadian population using life-course age groups.
- Figure 12 Footnote b
-
Data from YT and SK were not available.
F Unreleasable due to small numbers and/or coefficients of variation greater than 33.3%.
Notes: The 95% confidence interval shows an estimated range of values that is likely to include the true prevalence 19 times out of 20.
Source: Public Health Agency of Canada, using Canadian Chronic Disease Surveillance System data files contributed by provinces and territories, July 2018.
Text description
| Province/ Territory | ||||||||||||
|---|---|---|---|---|---|---|---|---|---|---|---|---|
| NT | NU | BC | AB | MB | ON | QC | NB | NS | PE | NL | CA | |
| Forearm | 260.1 | 200.3 | 235.8 | 288.3 | 242.7 | 216.3 | 152.1 | 155.1 | 181.6 | 230.5 | 104.3 | 207.9 |
| Hip | 188.3 | F | 136.6 | 143.8 | 157.6 | 128.1 | 124.7 | 154.7 | 139.3 | 132.0 | 158.6 | 132.5 |
| Spine | 153.3 | F | 198.4 | 212.5 | 125.3 | 116.6 | 156.6 | 183.1 | 97.8 | 136.8 | 68.9 | 148.3 |
| Humerus | 97.0 | F | 111.1 | 117.4 | 109.6 | 93.2 | 100.8 | 52.1 | 94.5 | 127.0 | 57.6 | 99.1 |
| Pelvis | F | F | 73.7 | 97.6 | 47.2 | 89.7 | 55.7 | 49.0 | 67.6 | 61.1 | 23.2 | 74.4 |
Provincial and territorial forearm, spine, humeral and pelvic fracture rates are based on hospital discharge abstract records or physician billing claims data. The differences may, in part, be due to variations in coding practices. Given that hip fracture rates, which are derived from hospital discharge record data only, are less susceptible to jurisdictional coding practice differences, we opted to explore the geographical distribution of hip fractures in more detail.
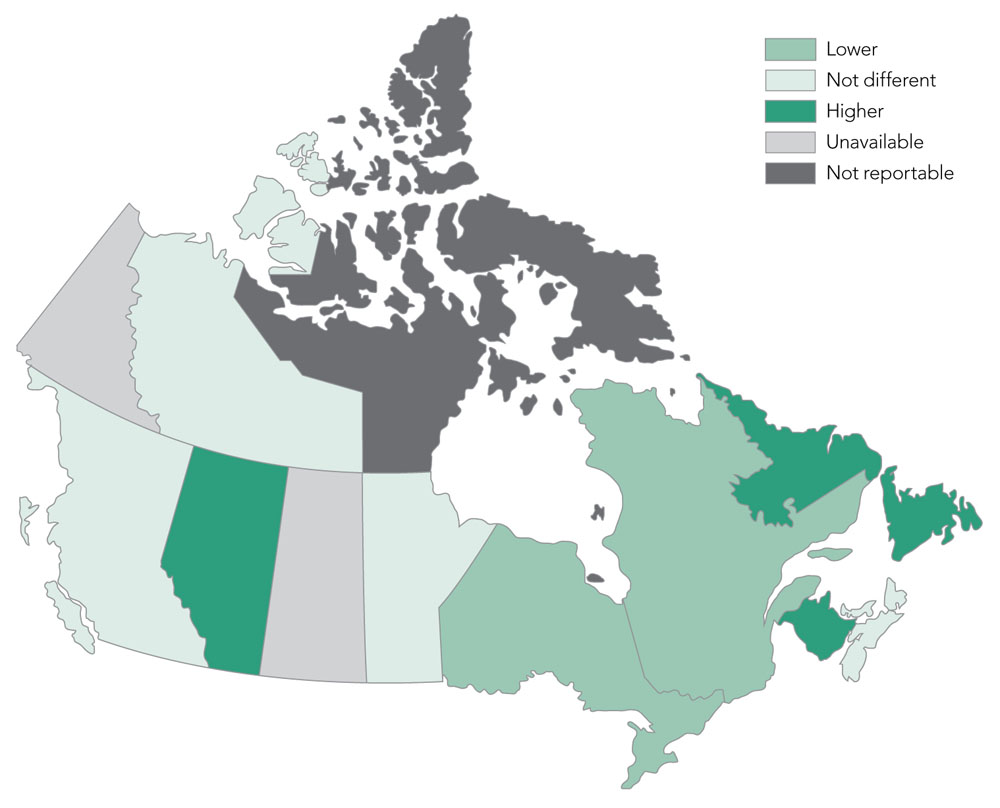
Across Canada (excluding Yukon and Saskatchewan), hip fracture rates varied by province/ territory (Figure 13). All differences from the national average are statistically significant.
- Age-standardized annual hip fracture rates were lowest in Quebec (124.7 per 100,000) and highest in the Northwest Territories (188.3 per 100,000).
- Rates were higher than the national average in Alberta, New Brunswick and Newfoundland and Labrador and lower than the national average in Ontario and Quebec. Rates in the remaining provinces/territories (i.e., Northwest Territories, British Columbia, Manitoba, Nova Scotia, Prince Edward Island) were not statistically different from Canada as a whole.
Figure 13. Age-standardizedFigure 13 Footnote a annual hip fracture rates among Canadians 40 years and older, by province/territory, Canada,Figure 13 Footnote b 2015–2016
- Figure 13 Footnote a
-
Age-standardized to 2011 Canadian population using life-course age groups.
- Figure 13 Footnote b
-
Data from YT and SK were not available.
E Interpret with caution, coefficient of variation between 16.6% and 33.3%.
F Unreleasable due to small numbers and/or coefficients of variation greater than 33.3%.
Notes: % = percentage. NA = not available. The 95% confidence interval shows an estimated range of values that is likely to include the true prevalence 19 times out of 20.
Source: Public Health Agency of Canada, using Canadian Chronic Disease Surveillance System data files contributed by provinces and territories, July 2018.
Text description
| Province/Territory | Age-standardizedFigure 13 Footnote a Annual Hip Fracture Rates (per 100,000) | 95% Confidence Interval |
|---|---|---|
| YT | NA | NA |
| NT | 188.3E | 114.6–297.2E |
| NU | F | F |
| BC | 136.6 | 132.4–140.9 |
| AB | 143.8 | 138.4–149.3 |
| SK | NA | NA |
| MB | 157.6 | 148.6–167.0 |
| ON | 128.1 | 125.7–130.5 |
| QC | 124.7 | 121.7–127.9 |
| NB | 154.7 | 143.9–166.1 |
| NS | 139.3 | 130.3–148.8 |
| PE | 132.0 | 109.7–157.8 |
| NL | 158.6 | 144.9–173.2 |
| CanadaFigure 13 Footnote b | 132.5 | 131.0–134.1 |
3.2 All-cause mortality 12 months following a hip fracture
The first year after a hip fracture is considered to be the most critical time in terms of an increased risk in mortality. In this section, the number of Canadians 40 years and older who died of any cause 12 months following a hip fracture is presented. The latest year of data (i.e., 2015–2016) is not included to ensure all individuals that had a hip fracture had an equal opportunity to be followed up for the full 12-month period.
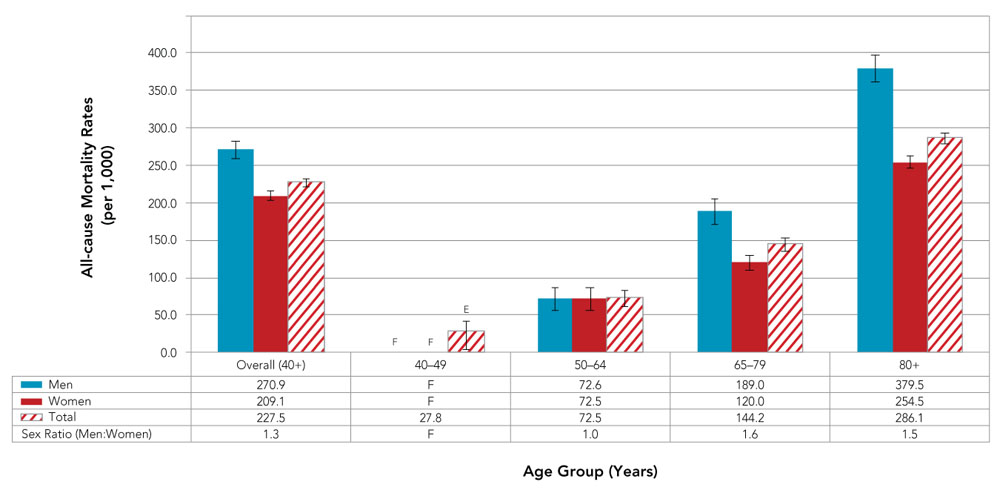
3.2.1 Age and sex distribution in 2014–2015
- About 6,600 (227.5 per 1,000 or 22.8%) Canadians 40 years and older died of any cause within 12 months following hip fracture (excluding Yukon and Saskatchewan) (Figure 14).
- Death due to any cause increased with age with the highest overall death rate among those aged 80 years and older (286.1 per 1,000 or 28.6%).
- Overall, men were 1.3 times more likely than women to die of any cause within 12 months of a hip fracture, with men having significantly higher all-cause mortality rates than women as of age 65 years and older.
Figure 14. All-cause mortality rates among Canadians 40 years and older with hip fracture in previous 12 months, by age group and sex, CanadaFigure 14 Footnote a, 2014–2015
- Figure 14 Footnote a
-
Data from YT and SK were not available.
F Unreleasable due to small numbers and/or coefficients of variation greater than 33.3%.
Notes: The 95% confidence interval shows an estimated range of values that is likely to include the true prevalence 19 times out of 20.
Source: Public Health Agency of Canada, using Canadian Chronic Disease Surveillance System data files contributed by provinces and territories, July 2018.
Text description
| Age Group (Years) | |||||
|---|---|---|---|---|---|
| Overall (40+) | 40-49 | 50-64 | 65-79 | 80+ | |
| Men | 270.9 | F | 72.6 | 189.0 | 379.5 |
| Women | 209.1 | F | 72.5 | 120.0 | 254.5 |
| Total | 227.5 | 27.8 | 72.5 | 144.2 | 286.1 |
| Sex Ratio (Men:Women) | 1.3 | F | 1.0 | 1.6 | 1.5 |
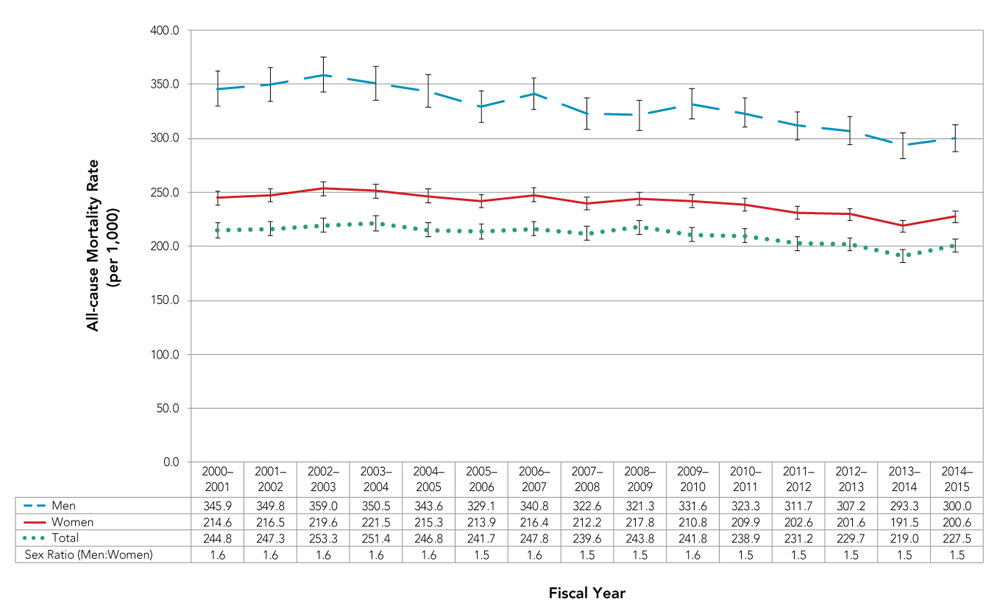
3.2.2 Trends over time
Overall, the age-standardized all-cause mortality rate (per 1,000) among Canadians 40 years and older who had a hip fracture in the previous 12 months decreased from 244.8 in 2000–2001 to 227.5 in 2014–2015 (Figure 15). Trends over time differed between women and men.
- Age-standardized all-cause mortality rates decreased among men over the surveillance period (APC = −1.3%, p < 0.001), while rates decreased among women between 2008–2009 and 2014–2015 only (APC = −1.6%, p = 0.004).
- On average, the age-standardized all-cause mortality rates were about 1.6 times higher among men than women over the surveillance period
Figure 15. Age-standardizedFigure 15 Footnote a all-cause mortality rates among Canadians 40 years and older with hip fracture in previous 12 months, by sex, Canada,Figure 15 Footnote b 2000–2001 to 2014–2015
- Figure 15 Footnote a
-
Age-standardized to 2011 Canada population age 40+ with hip fracture using life-course age groups.
- Figure 15 Footnote b
-
Data from YT were not available. Data from NU were excluded before fiscal year 2005–2006. Data from SK were not available for 2014–2015.
Notes: The 95% confidence interval shows an estimated range of values that is likely to include the true prevalence 19 times out of 20.
Source: Public Health Agency of Canada, using Canadian Chronic Disease Surveillance System data files contributed by provinces and territories, July 2018.
Text description
| Fiscal Year | |||||||||||||||
|---|---|---|---|---|---|---|---|---|---|---|---|---|---|---|---|
| 2000-2001 | 2001-2002 | 2002-2003 | 2003-2004 | 2004-2005 | 2005-2006 | 2006-2007 | 2007-2008 | 2008-2009 | 2009-2010 | 2010-2011 | 2011-2012 | 2012-2013 | 2013-2014 | 2014-2015 | |
| Women | 345.9 | 349.8 | 359 | 350.5 | 343.6 | 329.1 | 340.8 | 322.6 | 321.3 | 331.6 | 323.3 | 311.7 | 307.2 | 293.3 | 300.0 |
| Men | 214.6 | 216.5 | 219.6 | 221.5 | 215.3 | 213.9 | 216.4 | 212.2 | 217.8 | 210.8 | 209.9 | 202.6 | 201.6 | 191.5 | 200.6 |
| Total | 244.8 | 247.3 | 253.3 | 251.4 | 246.8 | 241.7 | 247.8 | 239.6 | 243.8 | 241.8 | 238.9 | 231.2 | 229.7 | 219.0 | 227.5 |
| Sex Ratio (Women:Men) | 1.6 | 1.6 | 1.6 | 1.6 | 1.6 | 1.5 | 1.6 | 1.5 | 1.5 | 1.6 | 1.5 | 1.5 | 1.5 | 1.5 | 1.5 |
3.3 Discussion
Fracture rates stabilizing, but the fracture burden remains high
Over the surveillance period, forearm and hip fracture rates declined, with hip fracture rates declining more rapidly than forearm fracture rates. Humeral fracture rates were relatively stable and spine and pelvis fracture rates increased.
Studies examining temporal trends also demonstrate that hip fracture rates are decreasing in CanadaFootnote 20Footnote 27Footnote 28 and in many other countries.Footnote 19 Although fewer studies have examined trends in fracture rates other than in the hip, similar decreasing trends in forearm fracture ratesFootnote 29Footnote 30 as well as increasing trends in spineFootnote 30Footnote 31 and pelvis fracture ratesFootnote 31Footnote 32 have been reported. The apparent increase in spine fracture rates may reflect more recent efforts to promote and facilitate the diagnosis and reporting of these fractures.Footnote 33 Increases in pelvic fracture rates may also be due to improvements in detection as a result of increased use of medical imaging.Footnote 34
In general, the dramatic increases in fracture rates observed decades ago appear to have stabilized and, for some fracture types, have begun declining.Footnote 30 Many factors likely contribute to the observed trends, including:Footnote 19
- a change in prevalence of risk factors associated with fracture (site specific) later in life;
- a change in the frequency of risk factors influencing bone strength early in life; and
- changes in the demographic structure of the population.
The extent to which these factors contribute to the trends remains unclear. Nevertheless, given the growing and aging Canadian population, the absolute number of fractures of the forearm, hip, spine, humerus and pelvis increased over the 15-year surveillance period (from 95,000 in 2000–2001 to 132,000 in 2015–2016). Therefore, the need for treatment resources will continue to be high.
High all-cause mortality risk 12 months following a hip fracture although mortality rates are steadily improving
Hip fractures are of particular concern in light of the associated morbidity, mortality and costs to the health care system.Footnote 7Footnote 35Footnote 36Footnote 37Footnote 38 Almost one-quarter (227.5 per 1,000 or 22.8%) of those who fractured a hip in 2014–2015 died of any cause within the following 12 months. A recent meta-analysis found that older adults have 5- to 8-fold risk of death during the first 3 months following a hip fracture, and while the risk decreased substantially after the first two years following fracture, it remained elevated even after 10 years of follow- up compared to age- and sex-matched controls.Footnote 39 Contributing factors for this elevated risk of death includes post-fracture complications and multiple comorbid conditions predisposing to fracture.Footnote 39Footnote 40
While women were 2 times more likely to fracture their hip, men were 1.3 times more likely to die of any cause within 12 months following their hip fracture. The increased risk of death following a hip fracture among men has been well documented; however, the contributing factors that may help explain this sex difference warrant further investigation.Footnote 39
Age- and sex-standardized all-cause mortality rates following a hip fracture improved over the surveillance period. Other studies have also found declining trends in all-cause mortality rates in the year following a hip fracture.Footnote 41 These findings suggest improvements in both treatment and rehabilitation of patients with hip fracture, as well as in the prevention of new hip fractures; however, the mortality risk remains high.
4. Osteoporosis care gap
With the aging of the Canadian population, prevention and appropriate care is essential to reduce the number of osteoporosis-related fractures. Secondary fracture prevention is a logical first step, that is, targeting those individuals with a new or previous fracture as they are at highest risk for future fractures.Footnote 42Footnote 43Footnote 44
Figure 16 illustrates an approach to targeting an entire population for fracture risk assessment from the perspective of ease of case finding. This is done by dividing the entire population into those who have a fracture history (secondary prevention) and those who have yet to have a fracture (primary prevention).Footnote 45 Individuals with new fractures will seek medical attention, thereby providing an opportunity for an immediate intervention.
While a range of osteoporosis treatments have been shown to be beneficial and cost- effective for secondary prevention,Footnote 1 a large proportion of individuals who have had osteoporosis-related fractures do not receive the care that they need.
Figure 16. Case finding and fracture risk pyramid
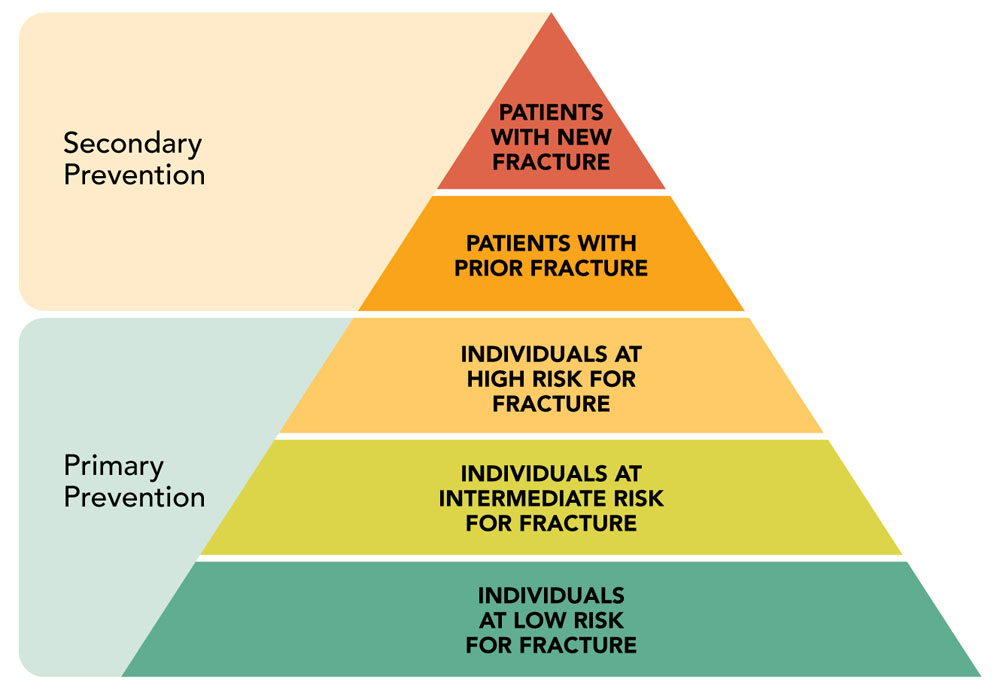
Figure adapted from Figure 2 in Mitchell et al., 2011Footnote 45
Text description
The pyramid is titled "Case finding and fracture risk pyramid", and it shows five levels of risk divided in two categories of prevention. From the base to the peak, the three first levels are included in the "Primary prevention category":
- Level 1, individuals at low risk for fracture.
- Level 2, individuals at intermediate risk for fracture.
- Level 3, individuals at high risk for fracture.
The last two levels are included in the "Secondary prevention category":
- Level 4, patients with a prior fracture.
- Level 5, patients with a new fracture.
In this chapter, we highlight the osteoporosis care gap in Canada by way of reporting on the percentage of Canadians 40 years and older who received an osteoporosis diagnosis, a BMD test or of those 65 years of age or older, a prescription for an osteoporosis-related medication within 12 months of a forearm, hip, spine, humeral or pelvic fracture. All care gap results are cleared for mortality, that is, those who died during the 12-month fracture follow-up period are not included. Also, the latest year of data (i.e., 2015–2016) is not included to ensure that all fracture cases have an equal opportunity to be followed up for a full 12-month period.
The availability of BMD and osteoporosis-related medication prescription data varied extensively across jurisdictions therefore, the generalizability of these results to Canada overall is limited. For more information about the methods to collect the osteoporosis care gap outcomes, see Appendix C.
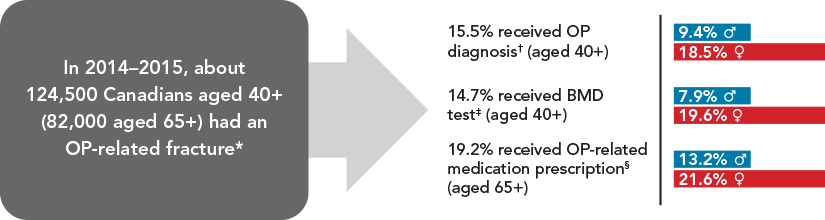
4.1 Osteoporosis care following a fracture
In 2014–2015, about 124,500 Canadians aged 40 years and older (82,000 aged 65 years and older) had a fracture at skeletal sites most attributable to osteoporosis, that is, forearm, hip, spine, humerus or pelvis (Figure 17). Within one year of fracture, only 19.2% received an osteoporosis diagnosis, underwent a BMD test or received a prescription for an osteoporosis- related medication. The percentage of those who had a BMD test one year following a fracture was low (14.7%). Men were less likely than women to receive any intervention after a fracture.
Figure 17. Number of Canadians with an osteoporosis-related fracture (forearm, hip, spine, humerus or pelvis)Figure 17 Footnote a and the percentage who received an osteoporosis diagnosis,Figure 17 Footnote b bone mineral density testFigure 17 Footnote c or osteoporosis-related medication prescriptionFigure 17 Footnote d within 1 year of a fracture, 2014–2015
- Figure 17 Footnote a
-
Data from NT were not available for OP-related fractures.
- Figure 17 Footnote b
-
Data from NT were not available for OP diagnosis.
- Figure 17 Footnote c
-
Data from YT, NT, NU, SK and NS were not available for BMD test.
- Figure 17 Footnote d
-
Data from NT, NU and NB were not available for OP-related medication prescription.
Notes: BMD = bone mineral density; OP = osteoporosis.
Source: Public Health Agency of Canada using Canadian Chronic Disease Surveillance System data files contributed by provinces and territories, August 2022.
Text description
The figure is titled: "Number of Canadians with an osteoporosis-related fracture (forearm, hip, spine, humerus or pelvis) and the percentage who received an osteoporosis diagnosis, bone mineral density test or osteoporosis-related medication prescription within 1 year of fracture, 2014–2015."
In 2014–2015, about 124,500 Canadians aged 40 years and older (82,000 aged 65 years and older) had a fracture.
From these 124,500 Canadians:
- 15.5% received OP diagnosis (aged 40 years and older):
- 9.4% were men;
- 18.5% were women.
14.7% received BMD test (aged 40 years and older):
- 7.9% were men;
- 19.6% were women.
19.2% received OP-related medication prescription (aged 65 years and older):
- 13.2% were men;
- 21.6% were women.
4.1.1 Age and sex distribution in 2014–2015
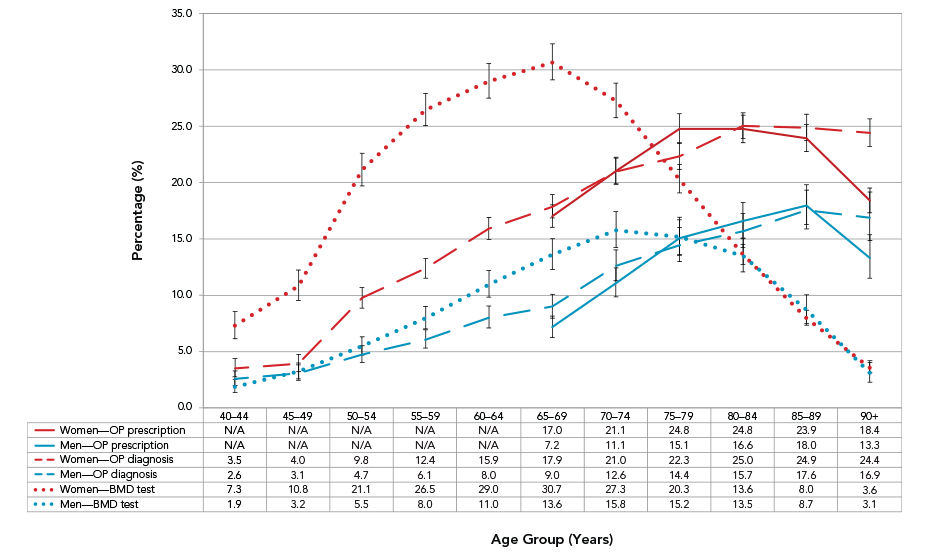
- The percentage of Canadians who received an osteoporosis diagnosis or a prescription for an osteoporosis-related medication within one year of their fracture increased with age (Figure 18). Up to 25.0% of women aged 80-84 years and 17.6% of men aged 85–89 years received an osteoporosis diagnosis, and up to 24.8% of women aged 75–79 years and 18.0% of men aged 85–89 years received a prescription for an osteoporosis-related medication.
- BMD testing within one year of a fracture was highest in women aged 65–69 years (30.7%) and men aged 70–74 years (15.8%). Testing was lowest in the youngest (men) and oldest (both sexes) age groups.
Figure 18. Percentage of CanadiansFigure 18 Footnote a who received an osteoporosis diagnosis,Figure 18 Footnote b bone mineral density testFigure 18 Footnote c or osteoporosis-related medication prescriptionFigure 18 Footnote d within 1 year of an osteoporosis-related fracture (forearm, hip, spine, humerus or pelvis), by age group and sex, 2014–2015
- Figure 18 Footnote a
-
Aged 40+ years for OP diagnosis and BMD test. Aged 65+ years for OP-related medication prescription.
- Figure 18 Footnote b
-
Data from NT were not available for OP diagnosis.
- Figure 18 Footnote c
-
Data from YT, NT, NU, SK and NS were not available for BMD test.
- Figure 18 Footnote d
-
Data from NT, NU and NB were not available for OP-related medication prescription.
Notes: BMD = bone mineral density; NA = not available; OP = osteoporosis. 95% confidence interval shows an estimated range of values that is likely to include the true percentage 19 times out of 20.
Source: Public Health Agency of Canada using Canadian Chronic Disease Surveillance System data files contributed by provinces and territories, August 2022.
Text description
| Age Group (Years) | |||||||||||
|---|---|---|---|---|---|---|---|---|---|---|---|
| 40-44 | 45-49 | 50-54 | 55-59 | 60-64 | 65-69 | 70-74 | 75-79 | 80-84 | 85-89 | 90+ | |
| Women – OP prescription | NA | NA | NA | NA | NA | 17.0 | 21.1 | 24.8 | 24.8 | 23.9 | 18.4 |
| Men – OP prescription | NA | NA | NA | NA | NA | 7.2 | 11.1 | 15.1 | 16.6 | 18.0 | 13.3 |
| Women – OP diagnosis | 3.5 | 4.0 | 9.8 | 12.4 | 15.9 | 17.9 | 21.0 | 22.3 | 25.0 | 24.9 | 24.4 |
| Men – OP diagnosis | 2.6 | 3.1 | 4.7 | 6.1 | 8.0 | 9.0 | 12.6 | 14.4 | 15.7 | 17.6 | 16.9 |
| Women – BMD test | 7.3 | 10.8 | 21.1 | 26.5 | 29.0 | 30.7 | 27.3 | 20.3 | 13.6 | 8.0 | 3.6 |
| Men – BMD test | 1.9 | 3.2 | 5.5 | 8.0 | 11.0 | 13.6 | 15.8 | 15.2 | 13.5 | 8.7 | 3.1 |
4.1.2 Trends over time
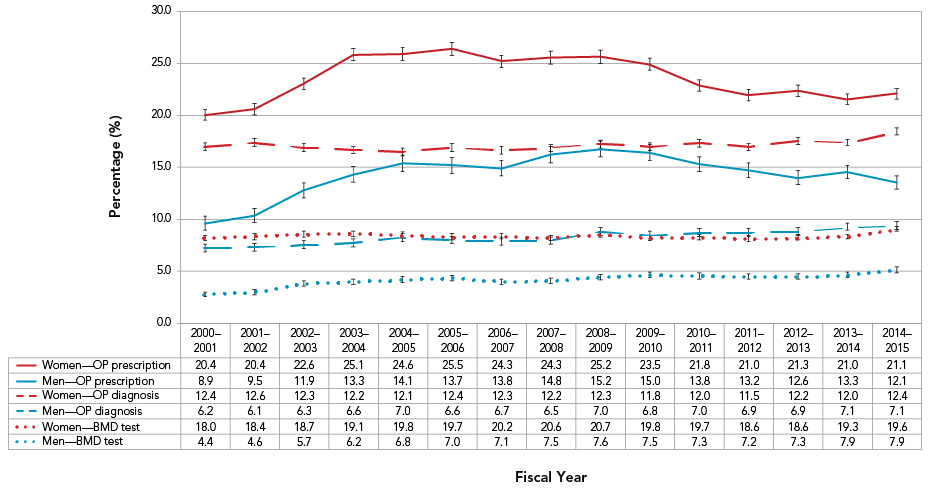
Between 2000–2001 and 2014–2015, the percentage of Canadians who received:
- an osteoporosis diagnosis within one year of fracture was stable among women between 2000–2001 and 2011–2012, but increased between 2011–2012 and 2014–2015 (APC = 2.4%, p = 0.042), and increased among men over the 14-year surveillance period (APC = 1.9%, p < 0.001) (Figure 19);
- a BMD test within one year of fracture increased among women between 2000–2001 and 2008–2009 (APC = 2.0%, p < 0.001), remained fairly stable between 2008–2009 and 2011–2012, but increased thereafter (APC = 4.8%, p < 0.001), and increased substantially among men between 2000–2001 and 2004–2005 (APC = 12.5%, p = 0.001) and steadily thereafter (APC = 1.9%, p = 0.003); and
- a prescription for an osteoporosis-related medication within one year of fracture increased among women between 2000–2001 and 2004–2005 (APC = 8.3%, p < 0.001), after which it decreased (APC = −2.4%, p < 0.001); while among men it increased from 2000–2001 to 2003–2004 (APC = 16.0%, p = 0.003), remained fairly stable between 2003–2004 and 2008–2009 and decreased thereafter (APC = −3.5%, p = 0.004).
Figure 19. Percentage of CanadiansFigure 19 Footnote a who received an osteoporosis diagnosis,Figure 19 Footnote b bone mineral density testFigure 19 Footnote c or osteoporosis medication prescriptionFigure 19 Footnote d within 1 year of an osteoporosis-related fracture (forearm, hip, spine, humerus or pelvis), by sex, Canada, 2000–2001 to 2014–2015
- Figure 19 Footnote a
-
Aged 40+ for OP diagnosis and BMD test. Aged 65+ for OP-related medication prescription.
- Figure 19 Footnote b
-
Data from YT (prior to 2010–2011), NT, NU (prior to 2005–2006) and NL (prior to 2008–2009) were not available for OP diagnosis.
- Figure 19 Footnote c
-
Data from YT, NT, NU, SK, NS and NL (prior to 2008–2009) were not available for BMD test.
- Figure 19 Footnote d
-
Data from YT (prior to 2010–2011), NT, NU, NB and NL (prior to 2008–2009) were not available for OP-related medication prescription.
Notes: BMD = bone mineral density; OP = osteoporosis; 95% confidence interval shows an estimated range of values that is likely to include the true percentage 19 times out of 20.
Source: Public Health Agency of Canada using Canadian Chronic Disease Surveillance System data files contributed by provinces and territories, August 2022.
Text description
| 2000-2001 | 2001-2002 | 2002-2003 | 2003-2004 | 2004-2005 | 2005-2006 | 2006-2007 | 2007-2008 | 2008-2009 | 2009-2010 | 2010-2011 | 2011-2012 | 2012-2013 | 2013-2014 | 2014-2015 | |
|---|---|---|---|---|---|---|---|---|---|---|---|---|---|---|---|
| Women—OP prescription | 20.4 | 20.4 | 22.6 | 25.1 | 24.6 | 25.5 | 24.3 | 24.3 | 25.2 | 23.5 | 21.8 | 21.0 | 21.3 | 21.0 | 21.1 |
| Men—OP prescription | 8.9 | 9.5 | 11.9 | 13.3 | 14.1 | 13.7 | 13.8 | 14.8 | 15.2 | 15.0 | 13.8 | 13.2 | 12.6 | 13.3 | 12.1 |
| Women OP—diagnosis | 12.4 | 12.6 | 12.3 | 12.2 | 12.1 | 12.4 | 12.3 | 12.2 | 12.3 | 11.8 | 12.0 | 11.5 | 12.2 | 12.0 | 12.4 |
| Men OP—diagnosis | 6.2 | 6.1 | 6.3 | 6.6 | 7.0 | 6.6 | 6.7 | 6.5 | 7.0 | 6.8 | 7.0 | 6.9 | 6.9 | 7.1 | 7.1 |
| Women—BMD test | 18.0 | 18.4 | 18.7 | 19.1 | 19.8 | 19.7 | 20.2 | 20.6 | 20.7 | 19.8 | 19.7 | 18.6 | 18.6 | 19.3 | 19.6 |
| Men—BMD test | 4.4 | 4.6 | 5.7 | 6.2 | 6.8 | 7.0 | 7.1 | 7.5 | 7.6 | 7.5 | 7.3 | 7.2 | 7.3 | 7.9 | 7.9 |
4.2 Discussion
Osteoporosis care gap
Canadian clinical practice guidelines recommend BMD testing in all women and men 65 years and older, and in those who have had a fragility fracture after age 40.Footnote 1 In addition, the recommended management model is based on the assessment of fracture risk, which is in part derived from measured BMD. Despite these guidelines and the known consequences of osteoporosis, there is a major gap between best practices and actual care: less than 15% of Canadians 40 years and older had a BMD test within one year of an osteoporosis-related fracture, with men less likely to have a BMD test than women.
Additionally, Canadian clinical practice guidelines recommend pharmacotherapy for high risk individuals including all adults 50 years and older who had a fragility fracture of the hip.Footnote 1 Despite this recommendation, we found that less than 20% of Canadians aged 65 and older received a prescription for an anti-osteoporosis medication within one year following a fracture at skeletal sites most attributable to osteoporosis (i.e., forearm, hip, spine, humerus or pelvis) and less than 26% within one year of a hip fracture (data not shown). Irrespective of fracture site, men were less likely to receive a prescription than women. These findings are in sharp contrast to the treatment of cardiovascular disease, where approximately 80% of patients who had a myocardial infarction (heart attack) received medication (i.e., beta blockers, angiotensin- converting-enzyme inhibitors or statins) to prevent another event.Footnote 46
This osteoporosis care gap exists in many parts of the world. An international prospective study found that only 27% of patients received pharmacological fracture prevention treatment following a hip fracture in ten countries (Australia, Austria, Estonia, France, Italy, Lithuania, Mexico, the Russian Federation, Spain and the United Kingdom).Footnote 47
Multiple factors contribute to the osteoporosis care gap
Many factors contribute to the osteoporosis care gap.Footnote 9Footnote 11Footnote 48 Patient factors include:
- lack of awareness of the increased risk of a subsequent fracture;
- lack of knowledge of pharmacological treatment benefits versus risk, particularly following media attention on rare side-effects associated with certain medications (i.e., bisphosphonates) and the absence of strong evidence in support of their long-term use;
- inadequate access to appropriate testing and treatment; and
- concerns about taking long-term preventive medication.
Many of the patient-related factors also apply to clinicians, but the most significant clinician factor may relate to the lack of clarity surrounding the "ownership" of secondary fracture prevention, given the many different health care professionals involved in such an event.
Societal and health system-related factors include:
- lack of integration between hospital and community health services;
- lack of communication between clinicians;
- lack of specific International Classification of Diseases (ICD) codes, i.e., diagnostic codes that capture fragility fractures used for epidemiological, clinical and health management purposes around the world;Footnote 49
- lack of recognition of the burden of fragility fracture and hence lack of prioritization in terms of management; and
- lack of investment in dedicated coordinated strategies for secondary fracture prevention.
Closing the osteoporosis care gap
Given the numerous factors contributing to the osteoporosis care gap, a multifaceted approach that focuses on educating all stakeholders and ensuring coordination of associated health services is well supported in the literature.
To reduce the burden of preventable fractures, targeted education that enhances both physicians' and patients' understanding of the benefits and risk of available medications is essential.Footnote 10 Also, the care gap could be narrowed by increasing awareness among physicians and patients of newly developed drugs that may be even more effective at reversing bone loss than the existing treatments. Furthermore, an understanding of the need to shift the focus of osteoporosis care from treating low BMD to preventing fractures is crucial.Footnote 1 As outlined in Osteoporosis Canada's 2010 clinical practice guidelines, an integrated approach to identify people who ought to be assessed for osteoporosis and recommended for treatment should be based on high absolute fracture risk, which incorporates clinical risk factors beyond BMD. An update to these guidelines will provide a renewed interest in treating the consequences of osteoporosis (i.e., fractures) as well as a new opportunity to educate all stakeholders.
The International Osteoporosis Foundation (IOF) Capture the Fracture campaign aims to support the implementation of Fracture Liaison Services (FLS), a best practice of fracture care, throughout the world.Footnote 50 This coordinator-based model of care identifies at-risk patients and provides them with the care they need to reduce their risk of subsequent fractures. Systematic reviews and meta-analysis have shown FLS to be more effective than other post-fracture osteoporosis interventions in terms of significant patient outcomes and reduction in health care costs.Footnote 51Footnote 52Footnote 53
In Canada, five provinces (British Columbia, Alberta, Ontario, Quebec and Nova Scotia) have implemented FLS, with 46 hospitals and health care institutions in the FLS registry.Footnote 54 A FLS, according to Osteoporosis Canada, is a specific systems-based model of care for secondary fracture prevention where a dedicated coordinator 1) systematically and proactively identifies patients aged 50 years and older presenting to a hospital with a new fragility fracture and/or with a newly reported vertebral fracture; 2) organizes appropriate investigations to determine the patient's fracture risk; and 3) facilitates the initiation of appropriate osteoporosis medications.Footnote 55 Given the success of secondary fracture prevention and the resulting cost saving benefits,Footnote 51Footnote 52Footnote 53 increasing accessibility to FLS across the country may help to close the existing osteoporosis care gap.
5. Bone health promotion strategies
Bone is a living tissue that is constantly renewed through a natural process of bone remodeling in which bone cells are broken down and replaced. As we age, this cycle becomes less efficient and we gradually begin to lose bone tissue. Osteoporosis is not a normal part of aging; it is a disease state in which bone loss occurs more rapidly than normal, causing bones to become porous and brittle. Nevertheless, bone loss can be prevented, delayed or reduced through lifestyle changes.
Bone health is important at every age but especially during childhood and adolescence when bones are still growing. As most people reach their maximum bone size and strength (known as peak bone mass) by age 30, bone-healthy behaviours are important from an early age in order to optimize bone health and reduce the risk of developing osteoporosis later in life.Footnote 56
Basic bone health includes following a bone-healthy diet (i.e., balanced nutrition, adequate calcium and vitamin D intake); engaging in regular physical activity and resistance training exercises; and avoiding smoking and excessive alcohol consumption. In this chapter, we provide an overview of bone health promotion strategies for all individuals across the life-course.
Balanced nutrition
Good nutrition is an important part of a healthy life. A well-balanced diet containing plenty of fruits and vegetables, protein and whole grain foods provides us with the energy and nutrients needed for daily growth and repair—including maintenance of healthy bones— and reduces the risk of nutrition-related chronic diseases and conditions.Footnote 57Footnote 58
The nutrients in our diets are classified into two groups: macronutrients and micronutrients. Macronutrients are needed in large quantities and include carbohydrates, fats and proteins; micronutrients are needed in smaller quantities and include vitamins and minerals. Foods from both groups are required for basic cellular functions. With some exceptions, eating a variety of healthy foods each day provides the required nutrients for general health, including bone maintenance. Canada's food guide is a good source of information for healthy eating strategies.Footnote 59
Protein is an essential macronutrient for bone health. Bone is mostly composed of collagen and hydroxyapatite. Collagen is the protein that provides bones with elasticity, and hydroxyapatite, which is composed of calcium and phosphate, adds rigidity and strength to the bone.Footnote 60 Although the exact mechanisms remain unclear, dietary proteins are thought to improve bone health by increasing calcium reabsorption, decreasing bone resorption, and improving muscle mass and strength. However, these benefits may only be apparent under conditions of adequate calcium intake.Footnote 61 The many types of protein foods to choose from include legumes, lean meats and lower-fat dairy products. Canada's new food guide emphasizes plant-based protein foods as a way to incorporate more fibre and less saturated fat into the diet.Footnote 62
Increasing dietary intake of specific micronutrients, including magnesium and vitamin K, has been linked to increased bone strength.Footnote 63 Magnesium is required to stimulate production of the hormones involved in preservation and regulation of bone breakdown. Magnesium deficiency can lead to low vitamin D and parathyroid hormone levels, resulting in reduced bone formation and increased risk of fracture.Footnote 64Footnote 65 Sources of magnesium include legumes, whole grains, nuts and seeds.Footnote 66 Vitamin K may also play a role in bone health, working to support the proteins that make up bones.Footnote 67 Low dietary vitamin K levels have been associated with low BMD in postmenopausal women and increased risk of hip fracture.Footnote 63Footnote 68 Broccoli, soybeans and dark leafy vegetables such as kale and spinach are all good sources of vitamin K.Footnote 69
Adequate calcium and vitamin D intake
Part of a bone-healthy diet includes sufficient intake of two other micronutrients, calcium and vitamin D. Calcium and vitamin D have been proven to be the most important nutrients in bone health.Footnote 70 Calcium is an integral part of bone structure and is essential for building and maintaining bones, while vitamin D functions to support the role of calcium absorption in the body. Taken together, they have been shown to increase bone strength and reduce the risk of fractures.Footnote 71Footnote 72
Calcium is essential during adolescence and early adulthood to ensure healthy bone development. Bone is primarily made up of collagen, which provides the soft framework, and calcium phosphate, which adds strength and hardens the framework. Calcium is also needed for many body functions including muscle contraction and normal functioning of the nervous and cardiovascular systems. When we don't have enough calcium to meet these needs, the body starts to take calcium from bones, weakening them in the process.
Since the body cannot make calcium, it is important to get it from the diet. Dietary sources of calcium include milk and milk products (e.g., cheese, yogurt); fish products containing bone (e.g., canned salmon and sardines); calcium-fortified beverages (e.g., orange juice, soy and nut-based beverages); calcium-set tofu; dark leafy greens; and legumes (e.g., soybeans, chickpeas). Dietary reference intakes for calcium, based on evidence related to bone health, vary by age, from between 200 mg/day for an infant up to 6 months old to 1300 mg/day for children 9–18 years old and pregnant or lactating women aged 14–18 years old.Footnote 73
Vitamin D, a fat-soluble vitamin, is needed for bone growth and remodeling. It supports the body's rate of calcium metabolism by increasing intestinal calcium absorption. Vitamin D also plays an active role in the bone formation and remodeling process to regulate the removal and replacement of bone.Footnote 71
Much of the body's vitamin D is produced by the skin following exposure to the ultraviolet (UVB) rays in sunlight. The amount of vitamin D our skin produces can be affected by a number of factors including winter season, use of sunscreen, darker skin tone, older age and extensive clothing coverage. Since too much sunlight can be harmful and cause skin cancer and eye damage, recommendations for vitamin D are made assuming minimal exposure to sunlight.
Fortified foods provide the major dietary source of vitamin D. In Canada, cow's milk and margarine are required to be fortified with vitamin D prior to being made available for sale. Vitamin D may also be found in vitamin D-fortified beverages (e.g., goat's milk, orange juice, soy and nut-based beverages) and some cheeses and yogurts made with fortified milk. Vitamin D is found naturally in fatty fish (e.g., salmon), fish liver oils and egg yolk. Dietary reference intakes for vitamin D, based on evidence related to bone health and assuming minimal sun exposure, vary by age, from between 400 International Units (IU) for an infant up to 12 months old to 800 IU for adults over 70 years old.Footnote 73
If adequate amounts of calcium and vitamin D cannot be obtained from the diet, dietary supplements are recommended.Footnote 1Footnote 57 In fact, obtaining an adequate amount of vitamin D through the diet is difficult given most people's lack of exposure to sunlight during any given day. For this reason, Health Canada advises people over 50 years to take a daily vitamin D supplement of 400 IU in addition to following Canada's food guide as people in this age group find it particularly difficult to meet their vitamin D needs through food alone.Footnote 59Footnote 74
Calcium and vitamin D supplement intake has been shown to slow the rate of BMD loss and lower the risk of fractures, particularly in the hip, among postmenopausal women and older adults.Footnote 75
Physical activity and resistance training exercises
In addition to helping meet the recommended amount of daily physical activity,Footnote 76 weight- bearing exercise (e.g., walking, jogging, hiking) and resistance training (e.g., lifting weights) specifically target the musculoskeletal system, strengthening muscles and improving bone strength. These types of exercise put stress on bones which, in turn, activates bone-forming cells and stimulates calcium deposition, leading to stronger and denser bones.Footnote 77
Improving balance and coordination is also important, especially in older adults and those diagnosed with osteoporosis. The risk of falling increases with age and continues to be the leading cause of injury among people 65 years and older.Footnote 78 Exercise programs with a multicomponent approach that combines resistance and balance training have been shown to be most effective in reducing the risk of falls and fall-related fractures in older adults.Footnote 79 Yoga and Tai-chi, in particular, have been shown to improve balance and coordination and can offer an alternative to more traditional exercise programs.Footnote 80Footnote 81 However, some yoga poses (i.e., those that twist and flex the spine) are not recommended if you have osteoporosis as they may increase the risk of fracture.
Avoid smoking and excessive alcohol intake
Studies have identified an association between smoking and reduced bone density.Footnote 82 Several mechanisms are thought to predispose smokers to bone loss, including changes in calcium absorption and metabolism. The decrease in bone density can be the result of smoking itself or other risk factors common among smokers, for example, decreased physical activity and poor diet. The association between smoking and bone health appears to be influenced by the number of cigarettes smoked and length of time an individual has been smoking, with greater exposure to smoking associated with a greater decline in BMD and increased risk of fracture.Footnote 82
Alcohol use has also been shown to have a dose-response relationship with bone health. Alcohol is thought to interfere with the calcium balance in the body and to affect vitamin D production. Chronic levels of high alcohol consumption (3 or more units per day) are considered a risk factor for low BMD and osteoporotic fracture.Footnote 70Footnote 83 Increased alcohol intake also contributes to increased risk for fallsFootnote 84Footnote 85 and is often associated with poor nutrition.Footnote 85
6. Closing remarks
Osteoporosis and related fractures are a major public health challenge in Canada. Approximately 2.2 million Canadians 40 years and older are living with diagnosed osteoporosis and an estimated 130,000 fractures occur in a single year. These fractures are associated with significant morbidity, mortality and costs. While fracture rates appear to be stabilizing, the absolute number of fractures is increasing because of the growing and aging Canadian population.
A key finding of this report is that despite well-established clinical practice guidelines and initiatives to promote osteoporosis care, screening and treatment initiation rates following a fracture remain very low in Canada. To reduce the number of osteoporosis- related fractures in the future, an ongoing multifaceted intervention with a focus on educating all stakeholders and coordinating hospital and community health services has been suggested and is well supported.
This report represents the first analysis of the osteoporosis care gap on a national level, making Canada an international leader in this regard. The CCDSS provides a unique opportunity to monitor the burden of osteoporosis, associated fractures and the osteoporosis care gap in Canada. The information acquired is intended to inform and/or evaluate population-based approaches aimed at promoting bone health among those at highest risk of future fractures.
It is hoped that the CCDSS methodology will have broader application for other countries where national fracture registries exist or can be created from high quality administrative databases. Knowledge of the current status and trends will be useful for increasing the collective understanding of diagnosed osteoporosis and related complications and will build the evidence base required to further drive public health action to address this emerging chronic health issue.
Appendix A
Canadian Chronic Disease Surveillance System
The Canadian Chronic Disease Surveillance System (CCDSS) is the result of a collaborative network of provincial and territorial chronic disease surveillance systems supported by PHAC. It was established to collect surveillance data related to chronic diseases in a consistent and comparable manner across all provinces and territories (as much as possible) in order to support the planning of health services and the development of health policies and programs.
The CCDSS collects data on all residents who are eligible for provincial or territorial health insurance and can generate national estimates and trends over time for over 20 chronic diseases and other selected health outcomes. While the coverage for the CCDSS is near universal, individuals covered under federal health programs, such as members of the Canadian Armed Forces, eligible veterans, Royal Canadian Mounted Police, federal penitentiary inmates, First Nations living on reserve, Inuit and refugee protection claimants are not included.
To identify people with chronic diseases via the CCDSS, provincial and territorial health insurance registry records are linked to physician billing claims and hospital discharge abstract records (inpatient only) using a unique personal identifier (Figure A.1.). The prescription drug database is also used but only for the identification of dementia, including Alzheimer's disease cases, at this time. Validated case definitions are applied to these linked databases and disease-specific data are then aggregated into 5-year age groups at the provincial and territorial level before being submitted to PHAC for analysis and reporting. Throughout the process, data are managed by the relevant authorities according to custodial obligations to protect patient confidentiality.
Figure A.1. CCDSS data sources and data sets
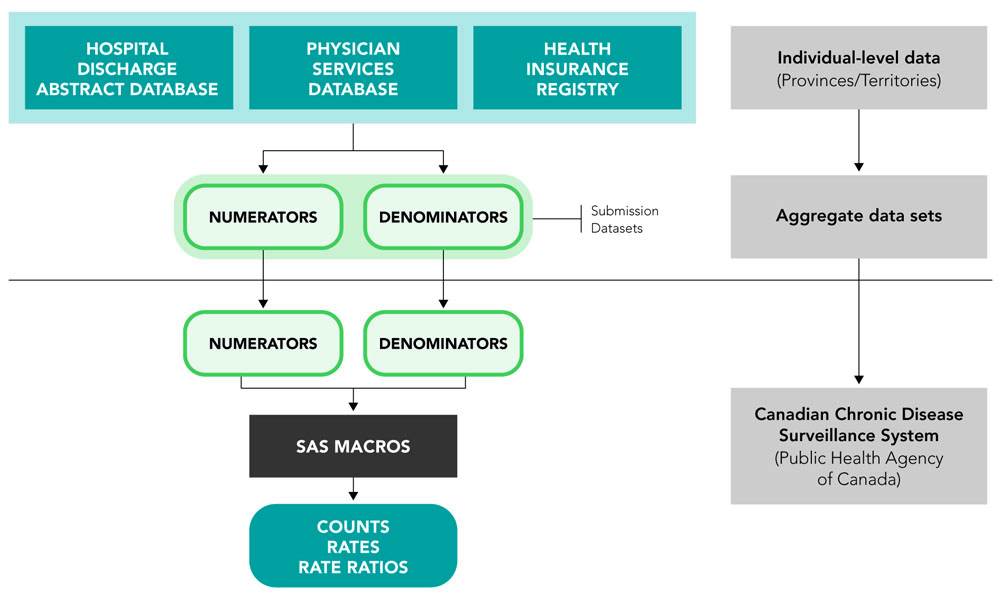
Text description
Individual-level data extraction is conducted in each province and territory by linking their respective health insurance registry to the hospital discharge abstract database and the physician services database. Individual data are aggregated as numerators and denominators data sets in each individual province and territory before being submitted to the Canadian Chronic Disease Surveillance System of the Public Health Agency of Canada. The Canadian Chronic Disease Surveillance System applies SAS macros to the aggregate data sets to calculate and report on counts, rates and rate ratios.
In addition to case identification, the linked databases also provide other health information including demographic data (age, sex, province or territory of residence); all-cause mortality data; and use of health care services (hospitalization, visit to a specialist, visit to a general practitioner). Data collection began in fiscal year 1995–1996 for all provinces and territories with the exception of Quebec, where data collection began in 1996–1997, and in Nunavut, where data can only be reported as of 2005–2006. Nevertheless, the start year for reporting CCDSS data is determined on a disease-by-disease basis to allow enough time to capture all prevalent cases as well as to avoid classifying previously prevalent cases as incident cases. For more information on the CCDSS see The Canadian Chronic Disease Surveillance System—An Overview (fact sheet).
Appendix B
Osteoporosis and related fracture case definitions
The CCDSS captures data on insured individuals diagnosed with osteoporosis and related fractures of the forearm, hip, spine, humerus or pelvis. "Diagnosed" refers to people who have met one of the case definitions defined in Table B.1. These case definitions were developed based on the results from a review of the literature, Canadian validation studies,Footnote 86Footnote 87 feasibility studies,Footnote 88 a national pilot study and recommendations from the CCDSS Osteoporosis Working Group.
Hospital discharge abstract records (inpatient records only) and physician billing claims were used to identify individuals with diagnosed osteoporosis as well as forearm, spine, humeral and pelvic fractures, while only hospital discharge abstract records were used to identify hip fractures. The recommended case criteria were applied to those 40 years of age or older. The case date for identifying osteoporosis and forearm, spine, humeral and pelvic fractures was the date of inpatient hospital admission or the last physician visit, whichever came first; whereas the case date for identifying hip fractures was the date of the hospital admission.
Demographic information including sex, date of birth, date of death and province or territory of residence were abstracted from the health insurance registries; age was calculated as of the end of the fiscal year, on March 31. These registry files were also used to derive the denominators (population under study) for proportion and rate calculations included in this report.
| Chronic disease or health event (Age) | Case definition | Hospital visits | Physician visits | ||
|---|---|---|---|---|---|
| ICD-9-CM | ICD-10-CA | ICD-9 | ICD-10-CATable B.1 Footnote a | ||
Osteoporosis (40+) |
At least one hospital admission listing a diagnostic code for osteoporosis in any diagnostic field |
733.0 |
M80, M81 |
733 |
M80, M81 |
Forearm fracture (40+) |
At least one hospital admission listing a diagnosis for forearm fracture in the first diagnostic field |
813 |
S52 |
813, 814Table B.1 Footnote b |
S52, S62Table B.1 Footnote b |
Hip fracture (40+) |
At least one hospital admission listing a diagnostic code for hip fracture in the first diagnostic field (six month episode periodTable B.1 Footnote c) |
820 |
S72.0, S72.1, S72.2 |
N/A |
N/A |
Spine fracture (40+) |
At least one hospital admission listing a diagnosis for spine fracture in the first diagnostic field |
805.2–805.5 |
S22.0, S22.1, S32.0 |
805 |
S42 |
Humeral fracture (40+) |
At least one hospital admission listing a diagnosis for humeral fracture in the first diagnostic field |
812 |
S42.2, S42.3, S42.4 |
812 |
S42 |
Pelvic fracture (40+) |
At least one hospital admission listing |
808, 805.6, 805.7 |
S32.1, S32.3, S32.4, S32.5 |
808 |
S32 |
The date of the first fracture code of a fracture event is used to establish the end-point of the 6-month episode period. Notes: ICD-9-CM: Clinical Modification of the Ninth Revision of the International Classification of Diseases. ICD-10-CA: International Statistical Classification of Diseases and Related Health Problems—Tenth Revision, Canada. ICD-9: International Classification of Diseases, Ninth Revision. N/A = not applicable. |
|||||
Appendix C
Osteoporosis care gap
The CCDSS measures and tracks the diagnosis and treatment of osteoporosis for up to
12 months following a fracture of the forearm, hip, spine, humerus or pelvis (individually and any one of these fracture types). The CCDSS does this by capturing the following information:
- Number of individuals 40 years and older who received an osteoporosis diagnosis. Cases that received an osteoporosis diagnosis up to 3 years prior to the fracture event were removed. (Refer to Table B.1 for osteoporosis case definition).
- Number of individuals 40 years and older who received a BMD test. Cases that underwent BMD testing up to 3 years prior to the fracture event were removed. (Refer to Table C.1 for provincial and territorial BMD coverage and codes); and
- Number of individuals 65 years and older who received at least one prescription for an osteoporosis-related medication. Cases that received at least one prescription up to 1 year prior to the fracture event were removed. (Refer to Table C.2 for provincial and territorial drug coverage and Table C.3 for Drug Identification Number [DIN] codes).
All care gap results are cleared for mortality, that is, individuals who died during the 12-month fracture follow-up period are not included.
Figure C.1. CCDSS osteoporosis care gap assessment

Figure adapted from Figure 2 in Mitchell et al., 2011Footnote 45
Text description
The pyramid is titled "Case finding and fracture risk pyramid", and it shows five levels of risk divided in two categories of prevention. From the base to the peak, the three first levels are included in the "Primary prevention category":
- Level 1, individuals at low risk for fracture.
- Level 2, individuals at intermediate risk for fracture.
- Level 3, individuals at high risk for fracture.
The last two levels are included in the "Secondary prevention category":
- Level 4, patients with a prior fracture.
- Level 5, patients with a new fracture.
The figure includes an arrow which extends from the pyramid at the fifth level and contains the text: "12-month post fracture follow-up". The follow-up is performed for individuals who fall into the category of patients with a new fracture and looks at the percentage of patients that received:
- An osteoporosis diagnosis; and/or
- A bone mineral density test; and/or
- An osteoporosis-related medication prescription.
| Province/ Territory | Included in CCDSS | Database Name | Fee Code | Description of Fee Code | Coverage by Fiscal Year | Population Coverage |
|---|---|---|---|---|---|---|
| YT | No | NA | NA | NA | NA | NA |
| NT | No | NA | NA | NA | NA | NA |
| NU | No | NA | NA | NA | NA | NA |
| BC | Yes | Physician Claims Database | T08688 | Bone density: single area | 1995 onwards | All residents, and then eligible patients: www2.gov.bc.ca/assets/gov/health/practitioner-pro/medical-services-plan/msc-payment-schedule-2016.pdf |
| T08689 | Bone density: second area | |||||
| T08696 | Bone density: whole body | |||||
| AB | Yes | Physician Claims Database | X128 | Bone mineral content by DPA | 1995 onwards |
All residents |
| SK | No | NA | NA | NA | NA | NA |
| MB | Yes | BMD Clinic Data | 79948 | Bone mineral densitometry with DXA: one or more sites | 1995 onwards |
All residents |
| ON | Yes | OHIP Schedule of Benefits |
x145 | DXA - by axial technique only. Baseline test: one site | 2008 onwards |
All residents, and then eligible patients: www.health.gov.on.ca/ en/pro/programs/ ohip/sob/physserv/ sob_master20181115. pdf |
| x146 | Baseline test: two or more sites | 2008 onwards |
||||
| x152 | Second test—low risk patient: one site | 1998 onwards |
||||
| x153 | Second test—low risk patient: two or more sites | 1998 onwards |
||||
| x142 | Subsequent test—low risk patient: one site | 2010 onwards |
||||
| x148 | Subsequent test—low risk patient: two or more sites | 2010 onwards |
||||
| x149 | Subsequent test—high risk patient: one site | 1999 onwards |
||||
| x155 | Subsequent test—high risk patient: two or more sites | 1999 onwards |
||||
| QC | Yes | Physician Claims Database | 8204 | Bone density measurement | 1996 onwards |
All residents |
| 8243 | Initial exam | |||||
| 8245 | Follow-up: one site | |||||
| 8246 | Follow-up: two sites | |||||
| 8122 | Microradiography of the hands | |||||
| 8247 | Osteodensitometry with pDXA peripheral equipment | |||||
| NB | Yes | Physician Claims Database | 3131 | Bone density (mineral content measurement) | 2001 onwards |
All residents |
| 3225 | Additional sites | |||||
| NS | No | NA | NA | NA | NA | NA |
| PE | Yes | Physician Claims Database | 8852 | Bone Densitometry | 1998 onwards |
All residents |
| NL | Yes | Physician Claims Database | 75084 | Bone mineral density, by single photon method | 1995 onwards |
All residents However, 66% of physicians are fee-for-service; therefore, all patients may not be included. |
| 75086 | Bone mineral content by DPA (single site) | 1995 onwards |
||||
| 75087 | Bone mineral content by DPA (2 or more sites) | 1995 onwards |
||||
| 75088 | Bone mineral content by DPA (with computer data manipulation) | 1995 onwards |
||||
DPA: dual photon absorptiometry |
||||||
| Province/ Territory | Included in the CCDSS | Database Name | Coverage by fiscal year | Population Coverage |
|---|---|---|---|---|
YT |
No |
NA | NA | NA |
NT |
No |
NA | NA | NA |
NU |
No |
NA | NA | NA |
BC |
Yes |
PharmaNet |
1995 onward |
1995–1996: All residents aged 65+ and those receiving income assistance, excluding time spent in hospital and those seen in medical clinics; and 1996 onward: All residents, excluding time spent in hospital and those seen in medical clinics |
AB |
Yes |
Alberta Blue Cross |
1995 onward |
All residents aged 65+, excluding time spent in hospital (approximately 90% of residents aged 65+) |
SK |
Yes |
Saskatchewan Drug Plan |
1995 onward |
All residents aged 65+, excluding time spent in hospital (approximately 97% of residents aged 65+) |
MB |
Yes |
Drug Program Information Network |
1995 onward |
All residents, excluding time spent in hospital, outpatient visits to a cancer center, those in nursing/personal care homes which obtain drugs through a hospital pharmacy, and nursing stations |
ON |
Yes |
Ontario Drug Benefit program |
1995 onward |
1995 onward: All residents aged 65+, excluding time spent in hospital (approximately 11% of residents aged 65+ were hospitalized in 2017); and 1997 onward: Residents aged < 65 years living in a long-term care home or home for special care, receiving home care, or enrolled in one of the following programs: Ontario Works, Ontario Disability Support Program, and Trillium Drug Program (approximately 6% of residents aged < 65 in 2017) |
QC |
Yes |
Régie de l'assurance maladie du Québec |
1996 onward |
All residents aged 65+, excluding those still working and covered by their employer or, those residing in long-term health care facilities (approximately 95% of residents aged 65+). In addition, residents aged < 65 years, excluding those with private insurance (approximately 30–35% of residents under 65) |
NB |
No |
NA | NA | NA |
NS |
Yes |
Pharmacare Program |
1995 onward |
All residents aged 65+, excluding time spent in hospital and those with private insurance (approximately 65% of residents aged 65+) |
PE |
Yes |
Prince Edward Island Drug Information System |
2009 onward |
All residents, excluding time spent in hospital |
NL |
Yes |
Newfoundland and Labrador Prescription Drug Program |
2009 onward |
Residents aged 65+ who receive Old Age Security and the Guaranteed Income Supplement, and low income persons/families, excluding time spent in hospital |
| DIN | Active ingredient | Product name | Strength |
|---|---|---|---|
| 02176017 | Etidronate disodium and calcium carbonate | Didrocal | 400 mg and 500 mg |
| 02247323 | Etidronate disodium and calcium carbonate | Mylan-eti-cal carepac | 400 mg and 500 mg |
| 02263866 | Etidronate disodium and calcium carbonate | Co etidrocal | 400 mg and 500 mg |
| 02353210 | Etidronate disodium and calcium | Etidrocal | 400 mg and 500 mg |
| 02324199 | Etidronate disodium and calcium carbonate | Novo-etidronatecal | 400 mg and 500 mg |
| 02233055 | Alendronate sodium | Fosamax | 5 mg |
| 02248251 | Alendronate sodium | Teva-alendronate | 5 mg |
| 02248727 | Alendronate sodium | Apo-alendronate | 5 mg |
| 02270110 | Alendronate sodium | Gen-alendronate | 5 mg |
| 02288079 | Alendronate sodium | Sandoz alendronate | 5 mg |
| 02303035 | Alendronate sodium | Alendronate-5 | 5 mg |
| 02201011 | Alendronate sodium | Fosamax | 10 mg |
| 02247373 | Alendronate sodium | Teva-alendronate | 10 mg |
| 02248728 | Alendronate sodium | Apo-alendronate | 10 mg |
| 02270129 | Alendronate sodium | Mylan-alendronate | 10 mg |
| 02288087 | Alendronate sodium | Sandoz alendronate | 10 mg |
| 02303043 | Alendronate sodium | Alendronate-10 | 10 mg |
| 02245329 | Alendronate sodium | Fosamax | 70 mg |
| 02248730 | Alendronate sodium | Apo-alendronate | 70 mg |
| 02258110 | Alendronate sodium | Act alendronate | 70 mg |
| 02261715 | Alendronate sodium | Teva-alendronate | 70 mg |
| 02270889 | Alendronate sodium trihydrate | Riva-alendronate | 70 mg |
| 02273179 | Alendronate sodium | Pms-alendronate | 70 mg |
| 02275279 | Alendronate sodium | Ratio-alendronate | 70 mg |
| 02282763 | Alendronate sodium | Dom-alendronate | 70 mg |
| 02282771 | Alendronate sodium | Phl-alendronate | 70 mg |
| 02284006 | Alendronate sodium | Pms-alendronate-fc | 70 mg |
| 02286335 | Alendronate sodium | Mylan-alendronate | 70 mg |
| 02288109 | Alendronate sodium | Sandoz alendronate | 70 mg |
| 02299712 | Alendronate sodium | Alendronate-fc | 70 mg |
| 02302004 | Alendronate sodium | Alendronate | 70 mg |
| 02303078 | Alendronate sodium | Alendronate-70 | 70 mg |
| 02352966 | Alendronic acid | Alendronate | 70 mg |
| 02248625 | Alendronate sodium trihydrate | Fosamax | 70 mg / 75 ml |
| 02401126 | Alendronate sodium | Accel-alendronate | 10 mg |
| 02401134 | Alendronate sodium | Accel-alendronate | 70 mg |
| 02381478 | Alendronate sodium | Ach-alendronate | 5 mg |
| 02381486 | Alendronate sodium | Ach-alendronate | 10 mg |
| 02381494 | Alendronate sodium | Ach-alendronate | 70 mg |
| 02388545 | Alendronate sodium | Auro-alendronate | 10 mg |
| 02388553 | Alendronate sodium | Auro-alendronate | 70 mg |
| 02385031 | Alendronate sodium | Jamp-alendronate | 70 mg |
| 02394863 | Alendronate sodium | Mint-alendronate | 10 mg |
| 02394871 | Alendronate sodium | Mint-alendronate | 70 mg |
| 02372304 | Alendronate sodium trihydrate | Q-alendronate | 70 mg |
| 02384698 | Alendronate sodium | Ran-alendronate | 5 mg |
| 02384701 | Alendronate sodium | Ran-alendronate | 10 mg |
| 02384728 | Alendronate sodium | Ran-alendronate | 70 mg |
| 02428717 | Alendronate sodium | Van-alendronate | 5 mg |
| 02428725 | Alendronate sodium | Van-alendronate | 10 mg |
| 02428733 | Alendronate sodium | Van-alendronate | 70 mg |
| 02314940 | Alendronate acid and vitamin D3 | Fosavance | 70 mg and 5600 unit |
| 02403641 | Alendronic acid and vitamin D3 | Teva-alendronate/cholecalciferol | 70 mg and 5600 unit |
| 02276429 | Alendronate sodium and vitamin D3 | Fosavance | 70 mg and 70 mcg |
| 02403633 | Alendronic acid and vitamin D3 | Teva-alendronate/cholecalciferol | 70 mg and 2800 unit |
| 02429160 | Alendronate acid and vitamin D3 | Sandoz alendronate/cholecalciferol | 70 mg and 5600 unit |
| 02242518 | Risedronate sodium | Actonel | 5 mg |
| 02298376 | Risedronate sodium | Teva-risedronate | 5 mg |
| 02298392 | Risedronate sodium | Teva-risedronate | 35 mg |
| 02246896 | Risedronate sodium | Actonel | 35 mg |
| 02302209 | Risedronate sodium | Pms-risedronate | 35 mg |
| 02319861 | Risedronate sodium | Ratio-risedronate | 35 mg |
| 02327295 | Risedronate sodium | Sandoz risedronate | 35 mg |
| 02353687 | Risedronate sodium | Apo-risedronate | 35 mg |
| 02297787 | Risedronate sodium | Actonel | 75 mg |
| 02316838 | Risedronate sodium | Actonel | 150 mg |
| 02377721 | Risedronate sodium | Apo-risedronate | 150 mg |
| 02397773 | Risedronate sodium | Mylan-risedronate | 150 mg |
| 02413809 | Risedronate sodium | Teva-risedronate | 150 mg |
| 02370417 | Risedronate sodium | Actonel dr | 35 mg |
| 02406306 | Risedronate sodium | Auro-risedronate | 35 mg |
| 02309831 | Risedronate sodium | Dom-risedronate | 35 mg |
| 02368552 | Risedronate sodium | Jamp-risedronate | 35 mg |
| 02357984 | Risedronate sodium | Mylan-risedronate | 35 mg |
| 02424177 | Risedronate sodium | Pms-risedronate | 150 mg |
| 02347474 | Risedronate sodium | Risedronate | 35 mg |
| 02352141 | Risedronate sodium | Risedronate | 35 mg |
| 02370255 | Risedronate sodium | Risedronate | 35 mg |
| 02411407 | Risedronate sodium | Risedronate-35 | 35 mg |
| 02341077 | Risedronate sodium | Riva-risedronate | 35 mg |
| 02279657 | Risedronate sodium and calcium | Actonel plus calcium | 35 mg and 500 mg |
| 02247585 | Calcitonin | Apo-calcitonin nasal spray | 200 u |
| 02261766 | Calcitonin | Sandoz calcitonin ns | 200 u / spray |
| 02311046 | Calcitonin | Pro-calcitonin - 200 | 200 u / spray |
| 02240775 | Calcitonin | Miacalcin Nasal Spray 200 IU | 200 unit / act |
| 02239028 | Raloxifene hydrochloride | Evista | 60 mg |
| 02358921 | Raloxifene hydrochloride | Pms-raloxifene | 60 mg |
| 02279215 | Raloxifene hydrochloride | Apo-raloxifene | 60 mg |
| 02312298 | Raloxifene hydrochloride | Teva-raloxifene | 60 mg |
| 02358840 | Raloxifene hydrochloride | Act raloxifene | 60 mg |
| 02415852 | Raloxifene hydrochloride | Raloxifene | 60 mg |
| 02254689 | Teriparatide | Forteo | 250 mcg / ml |
| 02269198 | Zoledronic acid | Aclasta | 5 mg / 100 ml |
| 02408082 | Zoledronic acid | Zoledronic acid injection | 5 mg / 100 ml |
| 02415100 | Zoledronic acid | Taro-zoledronic acid | 5 mg / 100 ml |
| 02422433 | Zoledronic acid | Zoledronic acid injection | 5 mg / 100 ml |
| 02343541 | Denosumab | Prolia | 60 mg / ml |
Appendix D
Methods
Provinces and territories represented
Data from Yukon and Nunavut prior to fiscal year 2005–2006 and Saskatchewan for fiscal year 2015–2016 were not available for this report. Furthermore, the availability of BMD and osteoporosis-related medication prescription data was limited to those provinces and territories with access to these data (refer to Tables C.1 and C.2).
Years of data included
Estimates within refer to data from fiscal years 2000–2001 to 2015–2016 with the exception of all-cause mortality following a hip fracture and osteoporosis care gap outcomes where the latest year of data (i.e., fiscal year 2015–2016) was not reported to ensure all cases had an equal opportunity to be followed up for a full 12-month period.
Proportion and rate calculations
- Prevalence of diagnosed osteoporosis was calculated by dividing the total number of prevalent cases during the capture period (April 1, 1995–1996 to March 31 of the specified year) by the total number of individuals with valid health insurance in the specified fiscal year, and then multiplying by 100.
- Incidence of diagnosed osteoporosis was determined by dividing the total number of incident (new) cases during the specified fiscal year (April 1 to March 31) by the total number of individuals with valid health insurance in the same fiscal year excluding cases that were prevalent at the beginning of the fiscal year, and then multiplying by 1,000. Cases were defined as incident if the individual was newly diagnosed and never met the osteoporosis case definition in any of the previous available years starting in 1995–1996. Results obtained between 1995–1996 and 1999–2000 were not reported in order to avoid misclassifying prevalent cases as incident cases, given the lack of historical information for individuals prior to the index year.
- Annual fracture rates were calculated by dividing the total number of fracture events in the specified fiscal year (April 1 to March 31) by the total number of individuals with valid health insurance in the same fiscal year, and then multiplying by 100,000. A fracture event was defined by a 6-month episode period where any like fracture codes during this period were considered part of the same event. The date of the first fracture code of a fracture event was used to establish the end-point of the 6-month episode period.
- All-cause mortality rates among those with diagnosed osteoporosis were determined by dividing the total number of individuals with diagnosed osteoporosis who died of any cause in the specified fiscal year (April 1 to March 31) by the total number of people with diagnosed osteoporosis at any time during the capture period (April 1, 1995–1996 to March 31 of the specified year) and then multiplying by 1,000. A similar calculation was used for all-cause mortality rates among those without diagnosed osteoporosis.
- All-cause mortality rate ratios were computed by dividing the all-cause mortality rate among individuals with diagnosed osteoporosis by the all-cause mortality rate among individuals without osteoporosis. A rate ratio greater than one indicates that individuals with the disease have a higher mortality burden than those without, regardless of the cause of death.
- All-cause mortality rates within 12 months following a hip fracture were calculated by dividing the total number of individuals with hip fracture in the previous 12 months who died of any cause in the specified fiscal year (April 1 to March 31) by the total number of individuals with a hip fracture during the same fiscal year, and then multiplying by 1,000.
- Osteoporosis care gap estimates were calculated by dividing the total number of individuals with any osteoporosis-related fracture in the previous 12 months who received an/a: 1) osteoporosis diagnosis; 2) BMD test; or 3) osteoporosis-related medication prescription in the specified fiscal year (April 1 to March 31) by the total number of individuals with any osteoporosis-related fracture in the same fiscal year, and then multiplying by 100. Estimates were calculated for each of the three outcomes separately. Also, the outcomes were not mutually exclusive; thus, an individual could fulfill various combinations of the three within a 12 month period.
Data procedures
Before proportions, rates and ratios were calculated, data were aggregated using life- course age groups (i.e. 40–49, 50–64, 65–79 and 80+ years) with the exception of diagnosed osteoporosis prevalence and incidence as well as, osteoporosis care gap outcomes by age where 5-year age groups were reported. This was necessary in order to accommodate those provinces/territories that aggregated data beyond the standard 5-year increments prior to submitting to PHAC, in order to meet their custodial obligations in protecting patient confidentiality.
In addition, to eliminate the possibility of residual disclosure when reporting data with small cell sizes,Footnote 89 all counts presented in this report were randomly rounded to the nearest multiple of 10. Crude estimates were calculated after random rounding, while age-standardized estimates were based on non-rounded counts.
Numbers presented in the text of the report were rounded to the nearest hundred thousand or the nearest hundred, where relevant.
Analysis
The 2011 Canadian population was used for age-standardization using life-course age groups. All-cause mortality rates 12 months following hip fracture were age-standardized to 2011 Canada population age 40+ years with hip fracture using life-course age groups.
Variance estimates and 95% confidence intervals (95% CI) were computed using an inverse gamma distribution. Estimates with a coefficient of variation between 16.6% and 33.3% should be interpreted with caution. Estimates with a coefficient of variation greater than 33.3% or based on cells with less than 10 counts were not reported.
To objectively quantify trends over time, piecewise exponential functions were fit using a statistical algorithm that identifies the optimal number and location of points where the trend changes (i.e., joinpoints).Footnote 90 The estimated slope(s) from the joinpoint model were used to obtain the annual percent change (APC) for each segment of the joinpoint model or the complete time period when a change in trend was not detected. Joinpoint analyses were performed using Joinpoint Regression Program (Version 4.2.0.2, National Cancer Institute, 2015) with default settings that preclude the identification of short-term fluctuations. When reporting trend results, the terms "increase" or "decrease" were used when APCs were significantly different from zero (p < 0.05) and "stable" when APCs were not significantly different from zero (p < 0.05).
Differences between provincial/territorial and the pan-Canadian estimates were assessed by way of a Z-test and were reported significantly different when p-values were less than 0.001. A more stringent significance threshold was adopted to avoid concluding all differences were statistically significant given the near-universal coverage of the provincial/territorial populations in the CCDSS.
SAS Enterprise Guide (Version 5.1, SAS Institute Inc., 2012) was used for all data analyses with the exception of trend analyses.
Appendix E
Limitations
CCDSS data have several strengths, including near-universal coverage; use of validated case definitions to identify cases; capture of medically diagnosed diseases/conditions/ health events; ability to measure and monitor incidence as well as, trends over time. Nevertheless, CCDSS data are not without limitations, and the findings within this report should be interpreted in light of these.
First, findings within this report likely underestimate the true burden of osteoporosis and related fractures in Canada as not all eligible cases are included in the CCDSS. Among these are people who did not seek care and remain undiagnosed (a particular challenge for osteoporosis surveillance since most individuals are asymptomatic until they experience an osteoporosis-related fracture); those who were diagnosed prior to the observation period but did not seek care during the observation period; those who sought care but did not receive a relevant diagnostic code; those seen by a salaried physician who does not "shadow bill" (currently, the magnitude of this effect at the national level is unknown); and those who exclusively sought privately-funded care.
Second, despite validating and selecting osteoporosis and related fracture case definitions that would minimize the possibility of capturing false positives (incorrectly identifying an individual as having the disease when they do not) and false negatives (incorrectly identifying an individual as not having the disease when they do), the possibility of erroneously including or excluding cases in the CCDSS remains. For instance, results from a study that validated case definitions against results from a regional BMD testing programFootnote 86Footnote 87 demonstrated that the case definition for diagnosed osteoporosis adopted by the CCDSS was acceptable in terms of its performance but may not accurately identify all diagnosed cases (sensitivity of 78.1%, specificity of 91.0%, positive predictive value of 88.4% and negative predictive value of 84.0%).
Third, trends based on CCDSS data may reflect true changes in population health status, but may also be a function of other factors including changes in data collection, coding/ classification systems, clinical practice and/or billing methods. Additional work is needed to fully explore these elements.
Fourth, there were a few challenges with respect to the surveillance of fractures at skeletal sites most attributable to osteoporosis among Canadians 40 years and older. For instance, we did not have knowledge of the populations' severity of osteoporotic fracture or injury risk. Nevertheless, given the vast majority of fractures at these sites (over 80%) are associated with low bone density and predict future fractures;Footnote 23Footnote 24 the uncertainty surrounding the usefulness of trauma classifications such as low- versus high-impact fractures for determining whether a fracture is related to low bone density or indicates an increased risk of future fracture,Footnote 25 and the recent shift in thinking that all fractures in older adults warrant careful evaluation in an effort to reduce the risk of future fractures,Footnote 26 the lack of information regarding osteoporotic fracture and injury risk is less of a concern.
Additionally, some of the fracture codes lacked the level of specificity required to ensure only those fracture sites associated with osteoporosis were captured which may have resulted in an over-capture of fractures, especially in the younger age groups. In contrast, any new fractures that occurred during the six month episode period would not have been counted as a new fracture which may have resulted in an under-capture of fractures.
Lastly, with respect to the osteoporosis care gap findings, the availability and coverage of BMD and drug prescription data varied across the provinces and territories, which may affect the generalizability of the results. In addition, most jurisdictions with access to drug data only had data on individuals aged 65 years and older.
Glossary
- Age-specific proportion or rate:
- Proportion or rate calculated for a specific age group.
- Age-standardized proportion or rate:
- Proportion or rate adjusted for the differences in population age structure between the study population and a reference population. Age-standardized proportions or rates are commonly used in trend analysis or when comparing rates for different geographical areas or different subgroups.
- Annual percent change:
- The annual percent change over several years is used to measure the change in proportions or rates over time. The calculation involves fitting a straight line to the natural logarithm of the data when it is displayed by calendar or fiscal year. The slope of the line, expressed in percentages, represents the annual percent change.
- Case definition:
- In a health surveillance context, the criteria that must be met by an individual to be identified as having a specific condition. More complex case definitions usually include an algorithm that specifies, for example, how many codes, from what data source, and within what time period are required to meet the case definition (e.g. one hospital admission or two or more physician codes for a particular disease or condition during a two-year period).
- Crude proportion or rate:
- Proportion or rate determined by dividing the total number of cases in a given time period by the total number of persons in the population.
- Confidence interval:
- A statistical measurement of the reliability of an estimate. The size of the confidence interval relates to the precision of the estimate with narrow confidence intervals indicating greater precision than those that are wide. The 95% confidence interval shows an estimated range of values that is likely to include the true value 19 times out of 20.
- Feasibility study:
- A study conducted to determine if data are appropriate to use for surveillance purposes.
- Fee-for-service:
- Payment of claims based on submission of individual medical services.
- Health administrative data:
- Collections of information on the delivery of health care services. In Canada, health care databases of the provincial and territorial governments collect and store information relevant to the administration of universal medical care insurance. The main sources of health administrative data pertain to hospital services, physician billings and prescription drugs. Depending on how data concerning specific health conditions are captured, they can also be used for surveillance purposes, such as estimating disease prevalence and incidence.
- Incidence:
- The number of new cases of a disease or condition occurring in a given time period in a population at risk, expressed as a proportion or rate.
- Insured population:
- The total number of individuals who had a valid health insurance number within a selected province or territory at any point during the selected year. Individuals who had less than a full year of coverage, due to immigration, emigration, birth or death during that year are included in the population.
- International Classification of Disease (ICD) code:
- An international standard diagnostic classification for diseases and other health conditions for epidemiological, clinical and health management purposes. For example, it is used to monitor the incidence and prevalence of diseases and other health problems, providing a picture of the general health situation of countries and populations.Footnote 49
- Mortality (all-cause):
- The number of deaths from any cause in a given time period in a population at risk of dying, expressed as a proportion or rate.
- Prevalence:
- The frequency of a disease or condition in a population during a defined period of time expressed as the proportion of that population that has the disease or condition.
- Rate ratio:
- The ratio of two related rate measures, for example, the all-cause mortality rate among those with diagnosed osteoporosis compared to the all-cause mortality rate among those without diagnosed osteoporosis.
- Sex ratio:
- The ratio of a specific measure among women compared to men in a population, for example, the prevalence of diagnosed osteoporosis among women, divided by the prevalence of diagnosed osteoporosis among men.
- Shadow billing:
- An administrative process whereby salaried physicians submit service provision information using provincial and territorial fee codes, even though they are reimbursed by other means of payment. Shadow billing can be used to maintain historical measures of service provision based on fee-for-service claims data.
- Surveillance:
- As used in public health, surveillance is the ongoing systematic collection, analysis and interpretation of data on population health that is used to plan, implement and evaluate public health practice.Footnote 91
Acronyms
- AB
- Alberta
- APC
- Annual Percent Change
- BC
- British Columbia
- BMD
- Bone Mineral Density
- CCDSS
- Canadian Chronic Disease Surveillance System
- DIN
- Drug Identification Number
- DPA
- Dual Photon Absorptiometry
- DXA
- Dual-energy X-ray Absorptiometry
- FLS
- Fracture Liaison Services
- ICD
- International Classification of Diseases
- IOF
- International Osteoporosis Foundation
- MB
- Manitoba
- NB
- New Brunswick
- NL
- Newfoundland and Labrador
- NA
- Not Available
- NS
- Nova Scotia
- NT
- Northwest Territories
- NU
- Nunavut
- ON
- Ontario
- OP
- Osteoporosis
- PE
- Prince Edward Island
- pDXA
- Peripheral Dual-energy X-ray Absorptiometry
- PHAC
- Public Health Agency of Canada
- QC
- Quebec
- SK
- Saskatchewan
- YT
- Yukon Territory
Acknowledgments
The Public Health Agency of Canada wishes to acknowledge and thank the following individuals for their contributions and support in all aspects of this report, from the inception and testing of the idea of using administrative data for osteoporosis and related fracture surveillance, through to reviewing this report.
Public Health Agency of Canada contributors (past and present)
- Siobhan O'Donnell
- Sharon Bartholomew
- Rick Cheung
- Edna Tehranzadeh
- Cynthia Robitaille
- Catherine Pelletier
- Yong Jun Gao
- Su-Bin Park
- Jennette Toews
- Louise McRae
- Joellyn Ellison
- Caroline Doyon
CCDSS osteoporosis working group
- William Leslie, University of Manitoba
- Suzanne Morin, McGill University
- Sonia Jean, Institut national de santé publique du Québec
- Susan Jaglal, University of Toronto
- Lisa Lix, University of Manitoba
- Kerry Siminoski, University of Alberta
- Jacques Brown, Laval University
- Rolf Puchtinger, Saskatchewan Ministry of Health
- Alexandra Papaioannou, McMaster University
- Louis Rochette, Institut national de santé publique du Québec
- Larry Svenson, Alberta Health and Wellness
- Karen Tu, Institute for Clinical Evaluative Sciences
- Pierre Guy, UBC Centre for Hip Health and Mobility
- Kim Reimer, British Columbia Ministry of Healthy Living and Sport
This work was made possible through the collaboration between Public Health Agency of Canada and the respective governments of Yukon, Northwest Territories, Nunavut, British Columbia, Alberta, Saskatchewan, Manitoba, Ontario, Quebec, New Brunswick, Nova Scotia, Prince Edward Island and Newfoundland and Labrador. Results and interpretations reported are those of the authors. No endorsement by the provinces and territories is intended or should be inferred.
References
- Footnote 1
-
Papaioannou A, Morin S, Cheung AM, Atkinson S, Brown JP, Feldman S, et al. 2010 clinical practice guidelines for the diagnosis and management of osteoporosis in Canada: summary. CMAJ 2010 Nov;182(17):1864-1873.
- Footnote 2
-
Adachi J, Ioannidis G, Pickard L, Berger C, Prior J, Joseph L, et al. The association between osteoporotic fractures and health-related quality of life as measured by the Health Utilities Index in the Canadian Multicentre Osteoporosis Study (CaMos). Osteoporos Int 2003 Nov;14(11):895-4
- Footnote 3
-
Papaioannou A, Kennedy C, Ioannidis G, Sawka A, Hopman W, Pickard L, et al. The impact of incident fractures on health-related quality of life: 5 years of data from the Canadian Multicentre Osteoporosis Study. Osteoporos Int 2009 May;20(5):703-714.
- Footnote 4
-
Tarride JE, Burke N, Leslie WD, Morin SN, Adachi JD, Papaioannou A, et al. Loss of health related quality of life following low-trauma fractures in the elderly. BMC Geriatr [Internet]. 2016 Apr [cited 2019 Apr 17];19(16):84. Available from: https://bmcgeriatr.biomedcentral.com/articles/10.1186/ s12877-016-0259-5 DOI: 10.1186/s12877-016-0259-5.
- Footnote 5
-
Cummings SR, Melton LJ. Epidemiology and outcomes of osteoporotic fractures. Lancet 2002 May;359(9319):1761-1767.
- Footnote 6
-
Hopkins R, Burke N, Von Keyserlingk C, Leslie W, Morin S, Adachi J, et al. The current economic burden of illness of osteoporosis in Canada. Osteoporos Int 2016 Oct;27(10):3023-32.
- Footnote 7
-
Ioannidis G, Papaioannou A, Hopman WM, Akhtar-Danesh N, Anastassiades T, Pickard L, et al. Relation between fractures and mortality: results from the Canadian Multicentre Osteoporosis Study. CMAJ 2009 Sep;181(5):265-271.
- Footnote 8
-
Gold DT. The nonskeletal consequences of osteoporotic fractures. Psychologic and social outcomes. Rheum Dis Clin North Am 2001 Feb;27(1):255-262.
- Footnote 9
-
Khosla S, Shane E. A crisis in the treatment of osteoporosis. J Bone Miner Res 2016 Aug;31(8):1485-1487.
- Footnote 10
-
Khosla S, Hofbauer LC. Osteoporosis treatment: recent developments and ongoing challenges. Lancet Diabetes Endocrinol 2017 Nov;5(11):898-907.
- Footnote 11
-
Khosla S, Cauley JA, Compston J, Kiel DP, Rosen C, Saag KG, et al. Addressing the crisis in the treatment of osteoporosis: A Path Forward. J Bone Miner Res 2016 Mar;32(3):424-30.
- Footnote 12
-
Pietschmann P, Rauner M, Sipos W, Kerschan-Schindl K. Osteoporosis: an age-related and gender- specific disease—a mini-review. Gerontology 2009 Jan;55(1):3-12.
- Footnote 13
-
Gambacciani M, Spinetti A, de Simone L, Cappagli B, Maffei S, Taponeco F, et al. The relative contributions of menopause and aging to postmenopausal vertebral osteopenia. J Clin Endocrinol Metab 1993 Nov;77(5):1148-1151.
- Footnote 14
-
Kanis J, Oden A, Johnell O, De Laet C, Jonsson B, Oglesby A. The components of excess mortality after hip fracture. Bone 2003 May;32(5):468-473.
- Footnote 15
-
Orwig DL, Chan J, Magaziner J. Hip fracture and its consequences: differences between men and women. Orthop Clin North Am 2006 Oct;37(4):611-622.
- Footnote 16
-
Pande I, Scott DL, O'Neill TW, Pritchard C, Woolf AD, Davis MJ. Quality of life, morbidity, and mortality after low trauma hip fracture in men. Ann Rheum Dis 2006 Jan;65(1):87-92.
- Footnote 17
-
Feldstein AC, Nichols G, Orwoll E, Elmer PJ, Smith DH, Herson M, et al. The near absence of osteoporosis treatment in older men with fractures. Osteoporos Int 2005 Aug;16(8):953-962.
- Footnote 18
-
Cheung AM, Detsky AS. Osteoporosis and fractures: missing the bridge? JAMA 2008 Mar;299(12):1468-1470.
- Footnote 19
-
Cooper C, Cole ZA, Holroyd CR, Earl SC, Harvey NC, Dennison EM, et al. Secular trends in the incidence of hip and other osteoporotic fractures. Osteoporos Int 2011 May;22(5):1277-1288.
- Footnote 20
-
Leslie WD, Lix LM, Yogendran MS, Morin SN, Metge CJ, Majumdar SR. Temporal trends in obesity, osteoporosis treatment, bone mineral density, and fracture rates: a population-based historical cohort study. J Bone Miner Res 2014 Apr;29(4):952-959.
- Footnote 21
-
Pisani P, Renna MD, Conversano F, Casciaro E, Di Paola M, Quarta E, et al. Major osteoporotic fragility fractures: Risk factor updates and societal impact. World J Orthop 2016 Mar;7(3):171-181.
- Footnote 22
-
Warriner AH, Patkar NM, Curtis JR, Delzell E, Gary L, Kilgore M, et al. Which fractures are most attributable to osteoporosis? J Clin Epidemiol 2011 Jan;64(1):46-53.
- Footnote 23
-
Bessette L, Ste-Marie L, Jean S, Davison K, Beaulieu M, Baranci M, et al. The care gap in diagnosis and treatment of women with a fragility fracture. Osteoporos Int 2008 Jan;19(1):79-86.
- Footnote 24
-
Morin SN, Lix LM, Leslie WD. The importance of previous fracture site on osteoporosis diagnosis and incident fractures in women. J Bone Miner Res 2014 Jul;29(7):1675-1680.
- Footnote 25
-
Mackey DC, Lui LY, Cawthon PM, Bauer DC, Nevitt MC, Cauley JA, et al. High-trauma fractures and low bone mineral density in older women and men. JAMA 2007 Nov;298(20):2381-2388.
- Footnote 26
-
Binkley N, Blank RD, Leslie WD, Lewiecki EM, Eisman JA, Bilezikian JP. Osteoporosis in crisis: It's time to focus on fracture. J Bone Miner Res 2017 Jul;32(7):1391-1394.
- Footnote 27
-
Leslie WD, O'Donnell S, Jean S, Lagace C, Walsh P, Bancej C, et al. Trends in hip fracture rates in Canada. JAMA 2009 Aug;302(8):883-889.
- Footnote 28
-
Jaglal SB, Weller I, Mamdani M, Hawker G, Kreder H, Jaakkimainen L, et al. Population trends in BMD testing, treatment, and hip and wrist fracture rates: are the hip fracture projections wrong? J Bone Miner Res 2005 Jun;20(6):898-905.
- Footnote 29
-
Leslie WD, Sadatsafavi M, Lix LM, Azimaee M, Morin S, Metge CJ, et al. Secular decreases in fracture rates 1986-2006 for Manitoba, Canada: a population-based analysis. Osteoporos Int 2011 Jul;22(7):2137-2143.
- Footnote 30
-
Amin S, Achenbach SJ, Atkinson EJ, Khosla S, Melton LJ,3rd. Trends in fracture incidence: a population-based study over 20 years. J Bone Miner Res 2014 Mar;29(3):581-589.
- Footnote 31
-
Papaioannou A, Kennedy CC, Ioannidis G, Cameron C, Croxford R, Adachi JD, et al. Comparative trends in incident fracture rates for all long-term care and community-dwelling seniors in Ontario, Canada, 2002-2012. Osteoporos Int 2016 Mar;27(3):887-897.
- Footnote 32
-
Nanninga GL, de Leur K, Panneman MJ, van der Elst M, Hartholt KA. Increasing rates of pelvic fractures among older adults: The Netherlands, 1986-2011. Age Ageing 2014 Sep;43(5):648-653.
- Footnote 33
-
Lentle BC, Brown JP, Khan A, Leslie WD, Levesque J, Lyons DJ, et al. Recognizing and reporting vertebral fractures: reducing the risk of future osteoporotic fractures. Can Assoc Radiol J 2007 Feb; 58(1):27-36.
- Footnote 34
-
Benzinger P, Becker C, Kerse N, Bleibler F, Buchele G, Icks A, et al. Pelvic fracture rates in community-living people with and without disability and in residents of nursing homes. J Am Med Dir Assoc 2013 Sep;14(9):673-678.
- Footnote 35
-
Melton LJ,3rd. Epidemiology worldwide. Endocrinol Metab Clin North Am 2003 Mar;32(1):1-13.
- Footnote 36
-
Johnell O, Kanis JA. An estimate of the worldwide prevalence and disability associated with osteoporotic fractures. Osteoporos Int 2006 Dec;17(12):1726-1733.
- Footnote 37
-
Wiktorowicz M, Goeree R, Papaioannou A, Adachi JD, Papadimitropoulos E. Economic implications of hip fracture: health service use, institutional care and cost in Canada. Osteoporos Int 2001 Mar; 12(4):271-278.
- Footnote 38
-
Schnell S, Friedman SM, Mendelson DA, Bingham KW, Kates SL. The 1-year mortality of patients treated in a hip fracture program for elders. Geriatr Orthop Surg Rehabil 2010 Sep;1(1):6-14.
- Footnote 39
-
Haentjens P, Magaziner J, Colon-Emeric CS, Vanderschueren D, Milisen K, Velkeniers B, et al. Meta-analysis: excess mortality after hip fracture among older women and men. Ann Intern Med 2010 Mar;152(6):380-390.
- Footnote 40
-
Vestergaard P, Rejnmark L, Mosekilde L. Increased mortality in patients with a hip fracture-effect of pre-morbid conditions and post-fracture complications. Osteoporos Int 2007 Dec;18(12):1583-1593.
- Footnote 41
-
Brauer CA, Coca-Perraillon M, Cutler DM, Rosen AB. Incidence and mortality of hip fractures in the United States. JAMA 2009 Oct;302(14):1573-1579.
- Footnote 42
-
Klotzbuecher CM, Ross PD, Landsman PB, Abbott TA,3rd, Berger M. Patients with prior fractures have an increased risk of future fractures: a summary of the literature and statistical synthesis. J Bone Miner Res 2000 Apr;15(4):721-739.
- Footnote 43
-
Kanis JA, Johnell O, De Laet C, Johansson H, Oden A, Delmas P, et al. A meta-analysis of previous fracture and subsequent fracture risk. Bone 2004 Aug;35(2):375-382.
- Footnote 44
-
Johnell O, Kanis JA, Oden A, Sernbo I, Redlund-Johnell I, Petterson C, et al. Fracture risk following an osteoporotic fracture. Osteoporos Int 2004 Mar;15(3):175-179.
- Footnote 45
-
Mitchell PJ. Fracture Liaison Services: the UK experience. Osteoporos Int 2011 Aug;22(Suppl 3):487-494.
- Footnote 46
-
Austin PC, Tu JV, Ko DT, Alter DA. Factors associated with the use of evidence-based therapies after discharge among elderly patients with myocardial infarction. CMAJ 2008 Oct;179(9):901-908.
- Footnote 47
-
Wintzell V, Ivergard M, Tanko LB, Barghout V, Svedbom A, Alekna V, et al. PMS105 The resource use related to hip fractures based on data from ICUROS. Value Health 2013 Mar;16:A573-A574.
- Footnote 48
-
March L. Osteoporotic fragility fractures: why the care gap? Medicographia 2014;36:150-155.
- Footnote 49
-
World Health Organization. International Classifications of Diseases (ICD) [online]. 2018 [cited 2019 Jan 17]. Available from: www.who.int/classifications/icd/en/.
- Footnote 50
-
Åkesson K, Marsh D, Mitchell PJ, McLellan A, Stenmark J, Pierroz D, et al. Capture the Fracture: a Best Practice Framework and global campaign to break the fragility fracture cycle. Osteoporos Int 2013 Aug;24(8):2135-2152.
- Footnote 51
-
Ganda K, Puech M, Chen JS, Speerin R, Bleasel J, Center JR, et al. Models of care for the secondary prevention of osteoporotic fractures: a systematic review and meta-analysis. Osteoporos Int 2013 Feb; 24(2):393-406.
- Footnote 52
-
Wu CH, Kao IJ, Hung WC, Lin SC, Liu HC, Hsieh MH, et al. Economic impact and cost-effectiveness of fracture liaison services: a systematic review of the literature. Osteoporos Int 2018 Jun;29(6):1227-1242.
- Footnote 53
-
Wu CH, Tu ST, Chang YF, Chan DC, Chien JT, Lin CH, et al. Fracture liaison services improve outcomes of patients with osteoporosis-related fractures: A systematic literature review and meta-analysis. Bone 2018 Jun;111:92-100.
- Footnote 54
-
Osteoporosis Canada. Canadian Fracture Liaison Services (FLS) Registry [online]. 2019 [cited 2019 Feb 07]. Available from: http://fls.osteoporosis.ca/canadian-fls-registry.
- Footnote 55
-
Osteoporosis Canada. Essential elements of Fracture Liaison Services (FLS) [online]. 2015 [cited 2019 Apr 17]. Available from: https://fls.osteoporosis.ca/wp-content/uploads/Osteoporosis-Canada- Essential-Elements-of-an-FLS-graphic.pdf.
- Footnote 56
-
Baxter-Jones A, Faulkner R, Forwood M, Mirwald R, Bailey D. Bone mineral accrual from 8 to 30 years of age: An estimation of peak bone mass. Journal of Bone and Mineral Research 2011 Aug;26(8):1729- 1739.
- Footnote 57
-
Daly M, Duckham R, Gianoudis J. Evidence for an interaction between exercise and nutrition for improving bone and muscle health. Curr Osteoporos Rep 2014 Jun;12(2):219-226.
- Footnote 58
-
Government of Canada. Healthy food choices [online]. 2019 [cited 2019 Feb 01]. Available from: https://food-guide.canada.ca/en/healthy-food-choices.
- Footnote 59
-
Government of Canada. Canada's Food Guide [online]. 2019 [cited 2019 Feb 01]. Available from: https://food-guide.canada.ca/en/.
- Footnote 60
-
Bonjour J. Calcium and phosphate: a duet of ions playing for bone health. J Am Coll Nutr 2011 Oct; 30(5):438.
- Footnote 61
-
Mangano K, Sahni S, Kerstetter J. Dietary protein is beneficial to bone health under conditions of adequate calcium intake: an update on clinical research. Curr Opin Clin Nutr Metab Care 2014 Jan; 17(1):69-74.
- Footnote 62
-
Government of Canada. Eat protein foods [online]. 2019 [cited 2019 Feb 01]. Available from: https://food-guide.canada.ca/en/healthy-eating-recommendations/make-it-a-habit-to-eat- vegetables-fruit-whole-grains-and-protein-foods/eat-protein-foods/.
- Footnote 63
-
Price C, Langford J, Liporace F. Essential nutrients for bone health and a review of their availability in the average North American diet. Open Orthop J [Internet]. 2012 Apr [cited 2019 Feb 18];6:143-9. Available from: https://www.ncbi.nlm.nih.gov/pmc/articles/PMC3330619/ DOI: 10.2174/1874325001206010143.
- Footnote 64
-
Castiglioni S, Cazzaniga A, Albisetti W, Maier J. Magnesium and osteoporosis: current state of knowledge and future research directions. Nutrients 2013 Jul;5(8):3022-3033.
- Footnote 65
-
Kunutsor S, Whitehouse M, Blom A, Laukkanen J. Low serum magnesium levels are associated with increased risk of fractures: a long-term prospective cohort study. Eur J Epidemiol 2017 Jul;32(7):593- 603.
- Footnote 66
-
Dietitians of Canada. Food Sources of Magnesium [online]. 2014 [cited 2019 Feb 18]. Available from: www.dietitians.ca/Downloads/Factsheets/Food-Sources-of-Magnesium.aspx.
- Footnote 67
-
Fusaro M, Mereu M, Aghi A, Iervasi G, Gallieni M. Vitamin K and bone. Clin Cases Miner Bone Metab 2017 May-Aug;14(2):200-206.
- Footnote 68
-
Booth S, Broe K, Gagnon D, Tucker K, Hannan M, McLean R, et al. Vitamin K intake and bone mineral density in women and men. Am J Clin Nutr 2003 Feb;77(2):512-516.
- Footnote 69
-
Dietitians of Canada. Functions and Food Sources of Some Common Vitamins [online]. 2014 [cited 2019 Feb 18]. Available from: https://www.dietitians.ca/Downloads/Factsheets/Functions-Sources- Common-Vitamins.aspx.
- Footnote 70
-
Papaioannou A, Morin S, Cheung A, Atkinson S, Brown J, Feldman S, et al. Clinical Practice Guidelines for the Diagnosis and Management of Osteoporosis in Canada: Background and Technical Report [pdf]. 2010 [cited 2019 Feb 18]. Available from: https://osteoporosis.ca/ multimedia/pdf/Osteoporosis_Guidelines_2010_Background_And_Technical_Report.pdf.
- Footnote 71
-
Laird E, Ward M, McSorley E, Strain JJ, Wallace J. Vitamin D and Bone Health; Potential Mechanisms. Nutrients 2010 Jul;2(7):693-724.
- Footnote 72
-
Hanley DA, Cranney A, Jones G, Whiting SJ, Leslie WD, Cole DE, et al. Vitamin D in adult health and disease: a review and guideline statement from Osteoporosis Canada. CMAJ 2010 Sep; 182(12):E610-8.
- Footnote 73
-
Government of Canada. Vitamin D and Calcium: Updated Dietary Reference Intakes [online]. 2019 [cited 2019 Feb 01]. Available from: https://www.canada.ca/en/health-canada/services/food- nutrition/healthy-eating/vitamins-minerals/vitamin-calcium-updated-dietary-reference-intakes- nutrition.html.
- Footnote 74
-
Katamay S, Esslinger K, Vigneault M, Johnston J, Junkins B, Robbins L, et al. Eating well with Canada's Food Guide. Nutrition Reviews 2007 Apr;65(4).
- Footnote 75
-
Avenell A, Mak J, O'Connell D. Vitamin D and vitamin D analogues for preventing fractures in post- menopausal women and older men. Cochrane Database Syst Rev 2014 Apr;12(4):271-8.
- Footnote 76
-
Tremblay MS, Warburton DE, Janssen I, Paterson DH, Latimer AE, Rhodes RE, et al. New Canadian Physical Activity Guidelines. Appl Physiol Nutr Metab 2011 Feb;36(1):36-46.
- Footnote 77
-
McMillan L, Zengin A, Ebeling P, Scott D. Prescribing physical activity for the prevention and treatment of osteoporosis in older adults. Healthcare (Basel) 2017 Nov;5(4):pii: E85.
- Footnote 78
-
Gale C, Cooper C, Aihie Sayer A. Prevalence and risk factors for falls in older men and women: The English Longitudinal Study of Ageing. Age Ageing 2016 Nov;45(6):789-794.
- Footnote 79
-
Karinkanta S, Piirtola M, Sievänen H, Uusi-Rasi K, Kannus P. Physical therapy approaches to reduce fall and fracture risk among older adults. Nat Rev Endocrinol 2010 Jul;6(7):396-407.
- Footnote 80
-
Ni M, Mooney K, Richards L, Balachandran A, Sun M, Harriell K, et al. Comparative impacts of tai chi, balance training, and a specially-designed yoga program on balance in older fallers. Arch Phys Med Rehabil 2014 Sep;95(9):1620-1628.
- Footnote 81
-
Voukelatos A, Cumming R, Lord S, Rissel C. A randomized, controlled trial of tai chi for the prevention of falls: the Central Sydney tai chi trial. J Am Geriatr Soc 2007 Aug;55(8):1185-91.
- Footnote 82
-
Yoon V, Maalouf N, Sakhaee K. The effects of smoking on bone metabolism. Osteoporos Int 2012 Aug;23(8):2081-2092.
- Footnote 83
-
Maurel D, Boisseau N, Benhamou C, Jaffre C. Alcohol and bone: review of dose effects and mechanisms. Osteoporos Int 2012 Jan;23(1):1-16.
- Footnote 84
-
Mukamal KJ, Mittleman MA, Longstreth WT,Jr, Newman AB, Fried LP, Siscovick DS. Self-reported alcohol consumption and falls in older adults: cross-sectional and longitudinal analyses of the cardiovascular health study. J Am Geriatr Soc 2004 Jul;52(7):1174-1179.
- Footnote 85
-
Hillers VN, Massey LK. Interrelationships of moderate and high alcohol consumption with diet and health status. Am J Clin Nutr 1985 Feb;41(2):356-362.
- Footnote 86
-
Leslie WD, Lix LM, Yogendran MS. Validation of a case definition for osteoporosis disease surveillance. Osteoporos Int 2011 Jan;22(1):37-46.
- Footnote 87
-
Lix LM, Azimaee M, Osman BA, Caetano P, Morin S, Metge C, et al. Osteoporosis-related fracture case definitions for population-based administrative data. BMC Public Health 2012 May;12:301-310.
- Footnote 88
-
O'Donnell S, Canadian Chronic Disease Surveillance System (CCDSS) Osteoporosis Working Group. Use of administrative data for national surveillance of osteoporosis and related fractures in Canada: results from a feasibility study. Arch Osteoporos 2013 Jun;8:143-148.
- Footnote 89
-
Zakaria DA. A guide to understanding and implementing rounding for statistical disclosure control. Ottawa: Statistics Canada; 2013 (Unpublished report).
- Footnote 90
-
Kim HJ, Fay MP, Feuer EJ, Midthune DN. Permutation tests for joinpoint regression with applications to cancer rates. Stat Med 2000 Feb;19(3):335-351.
- Footnote 91
-
World Health Organization. Health Topics: Public Health Surveillance [online]. [cited 2019 Jan 16]. Available from: https://www.who.int/topics/public_health_surveillance/en/.
Page details
- Date modified: