
West Nile Virus and Other Mosquito-Borne Disease National Surveillance Report - August 9 to August 15, 2015 (Report Week 32)
Summary
West Nile Virus in Canada
Humans: During surveillance week 32 (Aug 9 to Aug 15, 2015), no human cases have been reported to the Public Health Agency of Canada.
As of surveillance week 32, a total of four human cases of West Nile virus have been reported: Ontario (2), Quebec ( 2). One of the cases from Quebec was related to travel outside the province.
Mosquitoes: As of surveillance week 32, 64 mosquito pools have tested positive for West Nile virus in Canada: Ontario (32) , Manitoba (19) , Saskatchewan (12) and Quebec (1).
Dead Birds: As of surveillance week 32, the Canadian Wildlife Health Cooperative has reported 21 dead birds that tested positive for West Nile virus. Ontario (14) and Quebec (7).
Domestic Animals: As of surveillance week 32, the Canadian Food Inspection Agency reported two horses, that tested positive for West Nile virus in Canada: one from Saskatchewan and one from Ontario.
Alternative Formats
Related Topics
West Nile Virus in United States
As of Aug 11, 2015, the Centers for Disease Control and Prevention (CDC) reported 141 human cases of West Nile virus:
Alabama ( 1), Arizona ( 25), Arkansas (2 ), California (18), Colorado (5 ), Delaware (1 ), Florida ( 4),Georgia (1), Idaho ( 4), Kansas (4 ), Louisiana ( 5), Maryland (1 ), Mississippi (7 ), Montana (1 ), Nebraska ( 6),New Jersey (2), New Mexico ( 1), North Dakota (2 ), Ohio (3 ), Oklahoma (10), Pennsylvania (1 ), South Dakota( 9), Tennessee (2 ), Texas ( 15), Virginia (1 ), Washington(9) and Wyoming ( 1).
Of these, 82 (58.1%) were diagnosed as neuroinvasive disease cases, 59 (41.8%) as non-neuroinvasive disease cases. 3 fatal cases were reported. 55 presumptive viremic blood donors have been identified.
West Nile Fever in the European Union, European Economic Area and Neighbouring Countries
As of Surveillance week 32, the European Centre for Disease Prevention and Control (ECDC) has reported seven cases of West Nile fever in humans in the EU Member States and eight cases in the neighboring countries. During the past week, Austria reported its first case of West Nile fever, detected in an asymptomatic blood donor from Vienna. Serbia reported also its first case of the season in humans. Israel reported four new cases diagnosed beginning of August. West Nile virus has also been detected in birds in Lodi and Pavia provinces, both in Lombardy region, Italy.
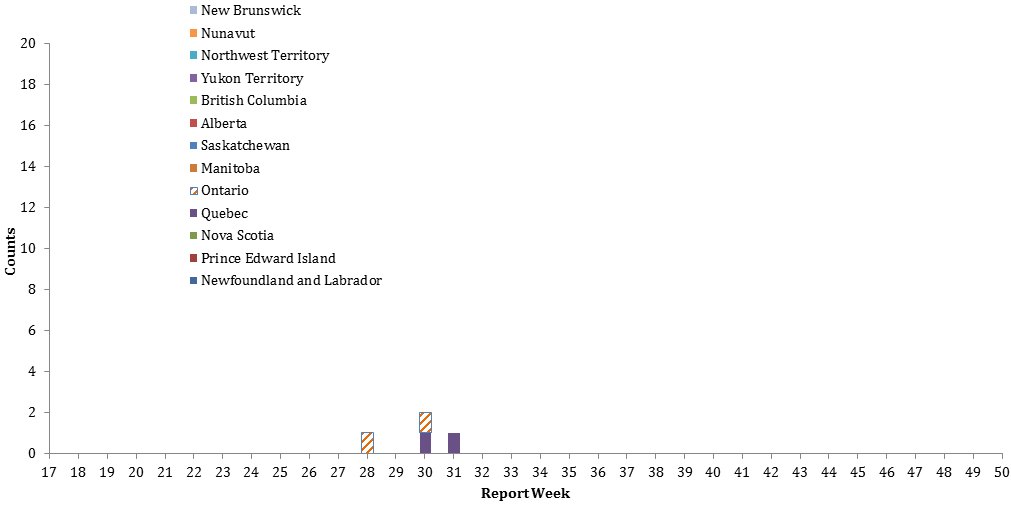
FIGURE 1: West Nile Virus human clinical cases and asymptomatic infections, by Province/Territory and by report week, 2015 season
| Report Weeks of 2015 | ||||||||||||||||||||||||||||||||||
|---|---|---|---|---|---|---|---|---|---|---|---|---|---|---|---|---|---|---|---|---|---|---|---|---|---|---|---|---|---|---|---|---|---|---|
| 17 | 18 | 19 | 20 | 21 | 22 | 23 | 24 | 25 | 26 | 27 | 28 | 29 | 30 | 31 | 32 | 33 | 34 | 35 | 36 | 37 | 38 | 39 | 40 | 41 | 42 | 43 | 44 | 45 | 46 | 47 | 48 | 49 | 50 | |
| Newfoundland and Labrador | 0 | 0 | 0 | 0 | 0 | 0 | 0 | 0 | 0 | 0 | 0 | 0 | 0 | 0 | 0 | 0 | ||||||||||||||||||
| Prince Edward Island | 0 | 0 | 0 | 0 | 0 | 0 | 0 | 0 | 0 | 0 | 0 | 0 | 0 | 0 | 0 | 0 | ||||||||||||||||||
| New Brunswick | 0 | 0 | 0 | 0 | 0 | 0 | 0 | 0 | 0 | 0 | 0 | 0 | 0 | 0 | 0 | 0 | ||||||||||||||||||
| Nova Scotia | 0 | 0 | 0 | 0 | 0 | 0 | 0 | 0 | 0 | 0 | 0 | 0 | 0 | 0 | 0 | 0 | ||||||||||||||||||
| Quebec | 0 | 0 | 0 | 0 | 0 | 0 | 0 | 0 | 0 | 0 | 0 | 0 | 0 | 1 | 1 | 0 | ||||||||||||||||||
| Ontario | 0 | 0 | 0 | 0 | 0 | 0 | 0 | 0 | 0 | 0 | 0 | 1 | 0 | 1 | 0 | 0 | ||||||||||||||||||
| Manitoba | 0 | 0 | 0 | 0 | 0 | 0 | 0 | 0 | 0 | 0 | 0 | 0 | 0 | 0 | 0 | 0 | ||||||||||||||||||
| Saskatchewan | 0 | 0 | 0 | 0 | 0 | 0 | 0 | 0 | 0 | 0 | 0 | 0 | 0 | 0 | 0 | 0 | ||||||||||||||||||
| Alberta | 0 | 0 | 0 | 0 | 0 | 0 | 0 | 0 | 0 | 0 | 0 | 0 | 0 | 0 | 0 | 0 | ||||||||||||||||||
| British Columbia | 0 | 0 | 0 | 0 | 0 | 0 | 0 | 0 | 0 | 0 | 0 | 0 | 0 | 0 | 0 | 0 | ||||||||||||||||||
| Yukon Territory | 0 | 0 | 0 | 0 | 0 | 0 | 0 | 0 | 0 | 0 | 0 | 0 | 0 | 0 | 0 | 0 | ||||||||||||||||||
| Northwest Territory | 0 | 0 | 0 | 0 | 0 | 0 | 0 | 0 | 0 | 0 | 0 | 0 | 0 | 0 | 0 | 0 | ||||||||||||||||||
| Nunavut | 0 | 0 | 0 | 0 | 0 | 0 | 0 | 0 | 0 | 0 | 0 | 0 | 0 | 0 | 0 | 0 | ||||||||||||||||||
| Total | 0 | 0 | 0 | 0 | 0 | 0 | 0 | 0 | 0 | 0 | 0 | 1 | 0 | 2 | 1 | 0 | ||||||||||||||||||
| Week 32: Aug 9 to Aug 15, 2015 | ||||||
|---|---|---|---|---|---|---|
| West Nile virus neurological syndrome | West Nile virus non-neurological syndrome | Unclassified/unspecified | Total clinical casesTable 2 Footnote 1 | Number of travel-related casesTable 2 Footnote 2 | West Nile virus asymptomatic infectionTable 2 Footnote 3 | |
Footnotes
|
||||||
| Newfoundland and Labrador | 0 | 0 | 0 | 0 | 0 | 0 |
| Prince Edward Island | 0 | 0 | 0 | 0 | 0 | 0 |
| Nova Scotia | 0 | 0 | 0 | 0 | 0 | 0 |
| New Brunswick | 0 | 0 | 0 | 0 | 0 | 0 |
| Quebec | 0 | 0 | 0 | 0 | 0 | 0 |
| Ontario | 0 | 0 | 0 | 0 | 0 | 0 |
| Manitoba | 0 | 0 | 0 | 0 | 0 | 0 |
| Saskatchewan | 0 | 0 | 0 | 0 | 0 | 0 |
| Alberta | 0 | 0 | 0 | 0 | 0 | 0 |
| British Columbia | 0 | 0 | 0 | 0 | 0 | 0 |
| Yukon Territory | 0 | 0 | 0 | 0 | 0 | 0 |
| Northwest Territory | 0 | 0 | 0 | 0 | 0 | 0 |
| Nunavut | 0 | 0 | 0 | 0 | 0 | 0 |
| Total | 0 | 0 | 0 | 0 | 0 | 0 |
| Year to date: January 1 to Aug 15, 2015 | ||||||
| Newfoundland and Labrador | 0 | 0 | 0 | 0 | 0 | 0 |
| Prince Edward Island | 0 | 0 | 0 | 0 | 0 | 0 |
| Nova Scotia | 0 | 0 | 0 | 0 | 0 | 0 |
| New Brunswick | 0 | 0 | 0 | 0 | 0 | 0 |
| Quebec | 0 | 2 | 0 | 2 | 1 | 0 |
| Ontario | 0 | 0 | 2 | 2 | 0 | 0 |
| Manitoba | 0 | 0 | 0 | 0 | 0 | 0 |
| Saskatchewan | 0 | 0 | 0 | 0 | 0 | 0 |
| Alberta | 0 | 0 | 0 | 0 | 0 | 0 |
| British Columbia | 0 | 0 | 0 | 0 | 0 | 0 |
| Yukon Territory | 0 | 0 | 0 | 0 | 0 | 0 |
| Northwest Territory | 0 | 0 | 0 | 0 | 0 | 0 |
| Nunavut | 0 | 0 | 0 | 0 | 0 | 0 |
| Total | 0 | 2 | 2 | 4 | 1 | 0 |
FIGURE 2: West Nile Virus clinic al cases and asymptomatic infections by report week for selected years
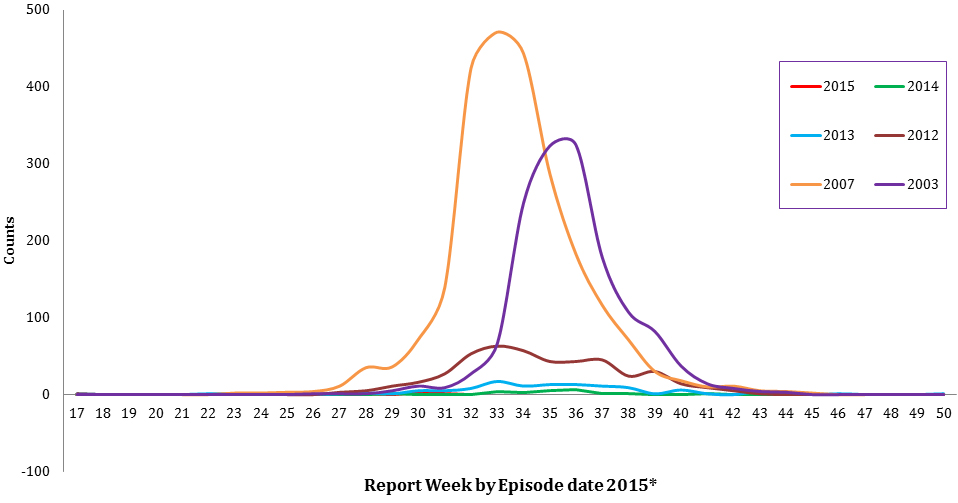
* West Nile virus clinical cases and asymptomatic infections are grouped by report week, based on episode date. Episode date could include one of the following: onset date, diagnosis date, lab sample date or reporting date.
| Report week | |||||||||||||||||||||||||||||||
|---|---|---|---|---|---|---|---|---|---|---|---|---|---|---|---|---|---|---|---|---|---|---|---|---|---|---|---|---|---|---|---|
| 17 | 18 | 19 | 20 | 21 | 22 | 23 | 24 | 25 | 26 | 27 | 28 | 29 | 30 | 31 | 32 | 33 | 34 | 35 | 36 | 37 | 38 | 39 | 40 | 41 | 42 | 43 | 44 | 45 | 46 | 47 | |
Table 3 Footnotes
|
|||||||||||||||||||||||||||||||
| 2015 | 0 | 0 | 0 | 0 | 0 | 0 | 0 | 0 | 0 | 0 | 0 | 1 | 0 | 2 | 1 | 0 | |||||||||||||||
| 2014 | 0 | 0 | 0 | 0 | 0 | 0 | 0 | 0 | 0 | 0 | 0 | 0 | 1 | 0 | 0 | 0 | 4Table 3 Footnote * | 3 | 5 | 6 | 1 | 1 | 0 | 0 | 1 | 0 | 0 | 0 | 0 | 0 | 0 |
| 2013 | 1 | 0 | 0 | 0 | 0 | 1 | 1 | 0 | 0 | 0 | 1 | 2 | 1 | 5 | 5 | 8 | 17 | 11 | 13 | 13 | 11 | 9 | 1 | 6 | 1 | 0 | 4 | 1 | 0 | 1 | 0 |
| 2012 | 1 | 0 | 0 | 0 | 0 | 0 | 0 | 0 | 0 | 0 | 3 | 5 | 11 | 16 | 27 | 53 | 63 | 57 | 43 | 43 | 45 | 24 | 30 | 14 | 9 | 5 | 1 | 0 | 0 | 0 | 0 |
| 2007 | 0 | 0 | 0 | 0 | 0 | 0 | 2 | 2 | 3 | 4 | 11 | 35 | 36 | 72 | 139 | 424 | 471 | 443 | 287 | 182 | 116 | 71 | 30 | 18 | 10 | 11 | 5 | 4 | 2 | 0 | 0 |
| 2005 | 0 | 0 | 0 | 0 | 0 | 0 | 0 | 0 | 0 | 0 | 0 | 0 | 0 | 0 | 4 | 4 | 11 | 28 | 28 | 38 | 45 | 27 | 15 | 7 | 12 | 3 | 3 | 1 | 0 | 0 | 0 |
| 2003 | 0 | 0 | 0 | 0 | 0 | 0 | 0 | 0 | 0 | 1 | 1 | 1 | 5 | 11 | 9 | 27 | 66 | 249 | 323 | 324 | 178 | 107 | 82 | 37 | 14 | 8 | 4 | 3 | 0 | 0 | 0 |
| Report week of 2015 | |||||||||||||||||||||||||||||
|---|---|---|---|---|---|---|---|---|---|---|---|---|---|---|---|---|---|---|---|---|---|---|---|---|---|---|---|---|---|
| 17 | 18 | 19 | 20 | 21 | 22 | 23 | 24 | 25 | 26 | 27 | 28 | 29 | 30 | 31 | 32 | 33 | 34 | 35 | 36 | 37 | 38 | 39 | 40 | 41 | 42 | 43 | 44 | Total | |
Table 4.1 Footnotes
|
|||||||||||||||||||||||||||||
| Newfoundland and Labrador | 0 | 0 | 0 | 0 | 0 | 0 | 0 | 0 | 0 | 0 | 0 | 0 | 0 | 0 | 0 | 0 | 0 | ||||||||||||
| Prince Edward Island | 0 | 0 | 0 | 0 | 0 | 0 | 0 | 0 | 0 | 0 | 0 | 0 | 0 | 0 | 0 | 0 | 0 | ||||||||||||
| New Brunswick | 0 | 0 | 0 | 0 | 0 | 0 | 0 | 0 | 0 | 0 | 0 | 0 | 0 | 0 | 0 | 0 | 0 | ||||||||||||
| Nova Scotia | 0 | 0 | 0 | 0 | 0 | 0 | 0 | 0 | 0 | 0 | 0 | 0 | 0 | 0 | 0 | 0 | 0 | ||||||||||||
| Quebec | 0 | 0 | 0 | 0 | 0 | 0 | 0 | 0 | 0 | 120 | 127 | 132 | 131 | 129 | 126 | 112 | 877 | ||||||||||||
| Ontario | 0 | 0 | 0 | 0 | 0 | 180 | 356 | 852 | 886 | 954 | 1152 | 1216 | 1219 | 1222 | 1176 | 1168 | 10381 | ||||||||||||
| Manitoba | 0 | 0 | 0 | 0 | 12 | 4 | 87 | 82 | 44 | 75 | 73 | 132 | 139 | 204 | 275 | 195 | 1322 | ||||||||||||
| Saskatchewan | 0 | 0 | 0 | 0 | 2 | 0 | 3 | 3 | 10 | 13 | 16 | 40 | 47 | 69 | 67 | 80 | 350 | ||||||||||||
| Alberta | 0 | 0 | 0 | 0 | 0 | 0 | 0 | 0 | 0 | 0 | 0 | 0 | 0 | 0 | 0 | 0 | 0 | ||||||||||||
| British Columbia | 0 | 0 | 0 | 0 | 0 | 0 | 0 | 0 | 0 | 0 | 0 | 0 | 0 | 0 | 0 | 0 | 0 | ||||||||||||
| Yukon Territory | 0 | 0 | 0 | 0 | 0 | 0 | 0 | 0 | 0 | 0 | 0 | 0 | 0 | 0 | 0 | 0 | 0 | ||||||||||||
| Northwest Territory | 0 | 0 | 0 | 0 | 0 | 0 | 0 | 0 | 0 | 0 | 0 | 0 | 0 | 0 | 0 | 0 | 0 | ||||||||||||
| Nunavut | 0 | 0 | 0 | 0 | 0 | 0 | 0 | 0 | 0 | 0 | 0 | 0 | 0 | 0 | 0 | 0 | 0 | ||||||||||||
| Total | 0 | 0 | 0 | 0 | 14 | 184 | 446 | 937 | 940 | 1162 | 1368 | 1520 | 1536 | 1624 | 1644 | 1555 | 12930 | ||||||||||||
| Province | Year to date: January 1 to Aug 15, 2015 | ||
|---|---|---|---|
| Number of positive mosquito pools | Number of mosquito pools tested | Percentage of positive mosquito pools (%) | |
| Quebec | 2 | 877 | 0.23 |
| Ontario | 32 | 10381 | 0.31 |
| Manitoba | 19 | 1322 | 1.44 |
| Saskatchewan | 12 | 350 | 3.43 |
| Total | 65 | 12930 | 0.50 |
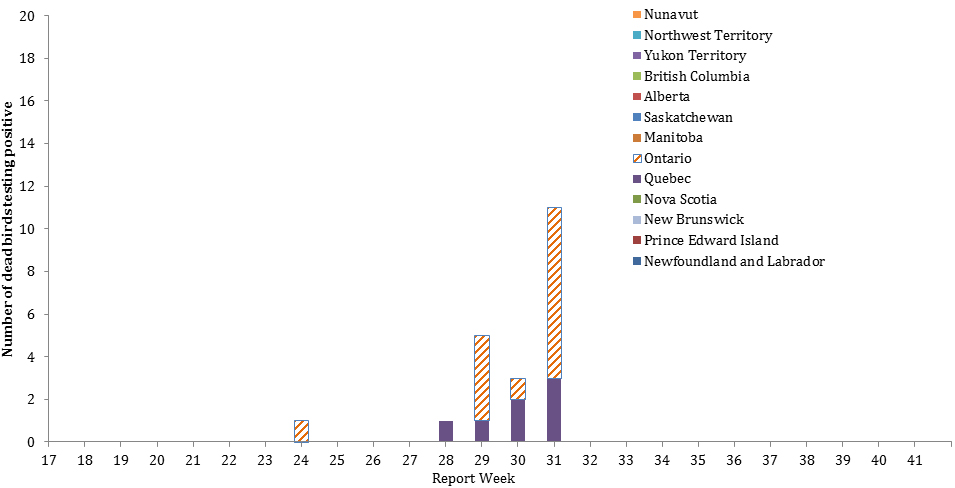
FIGURE 3: Reported number of dead birds testing positive for West Nile Virus by Province/Territory and by report week, 2015 season*
* Data from the Canadian Wildlife Health Cooperative
| Report week of 2015 | ||||||||||||||||||||||||||||||||
|---|---|---|---|---|---|---|---|---|---|---|---|---|---|---|---|---|---|---|---|---|---|---|---|---|---|---|---|---|---|---|---|---|
| 17 | 18 | 19 | 20 | 21 | 22 | 23 | 24 | 25 | 26 | 27 | 28 | 29 | 30 | 31 | 32 | 33 | 34 | 35 | 36 | 37 | 38 | 39 | 40 | 41 | 42 | 43 | 44 | 45 | 46 | 47 | Total | |
Table 5 Footnotes
|
||||||||||||||||||||||||||||||||
| Newfoundland and Labrador | 0 | 0 | 0 | 0 | 0 | 0 | 0 | 0 | 0 | 0 | 0 | 0 | 0 | 0 | 0 | 0 | 0 | |||||||||||||||
| Prince Edward Island | 0 | 0 | 0 | 0 | 0 | 0 | 0 | 0 | 0 | 0 | 0 | 0 | 0 | 0 | 0 | 0 | 0 | |||||||||||||||
| New Brunswick | 0 | 0 | 0 | 0 | 0 | 0 | 0 | 0 | 0 | 0 | 0 | 0 | 0 | 0 | 0 | 0 | 0 | |||||||||||||||
| Nova Scotia | 0 | 0 | 0 | 0 | 0 | 0 | 0 | 0 | 0 | 0 | 0 | 0 | 0 | 0 | 0 | 0 | 0 | |||||||||||||||
| Quebec | 0 | 0 | 0 | 0 | 0 | 0 | 0 | 0 | 0 | 0 | 0 | 1 | 1 | 2 | 3 | 0 | 7 | |||||||||||||||
| Ontario | 0 | 0 | 0 | 0 | 0 | 0 | 0 | 1 | 0 | 0 | 0 | 0 | 4 | 1 | 8 | 0 | 14 | |||||||||||||||
| Manitoba | 0 | 0 | 0 | 0 | 0 | 0 | 0 | 0 | 0 | 0 | 0 | 0 | 0 | 0 | 0 | 0 | 0 | |||||||||||||||
| Saskatchewan | 0 | 0 | 0 | 0 | 0 | 0 | 0 | 0 | 0 | 0 | 0 | 0 | 0 | 0 | 0 | 0 | 0 | |||||||||||||||
| Alberta | 0 | 0 | 0 | 0 | 0 | 0 | 0 | 0 | 0 | 0 | 0 | 0 | 0 | 0 | 0 | 0 | 0 | |||||||||||||||
| British Columbia | 0 | 0 | 0 | 0 | 0 | 0 | 0 | 0 | 0 | 0 | 0 | 0 | 0 | 0 | 0 | 0 | 0 | |||||||||||||||
| Yukon Territory | 0 | 0 | 0 | 0 | 0 | 0 | 0 | 0 | 0 | 0 | 0 | 0 | 0 | 0 | 0 | 0 | 0 | |||||||||||||||
| Northwest Territory | 0 | 0 | 0 | 0 | 0 | 0 | 0 | 0 | 0 | 0 | 0 | 0 | 0 | 0 | 0 | 0 | 0 | |||||||||||||||
| Nunavut | 0 | 0 | 0 | 0 | 0 | 0 | 0 | 0 | 0 | 0 | 0 | 0 | 0 | 0 | 0 | 0 | 0 | |||||||||||||||
| Total | 0 | 0 | 0 | 0 | 0 | 0 | 0 | 1 | 0 | 0 | 0 | 1 | 5 | 3 | 11 | 0 | 21 | |||||||||||||||
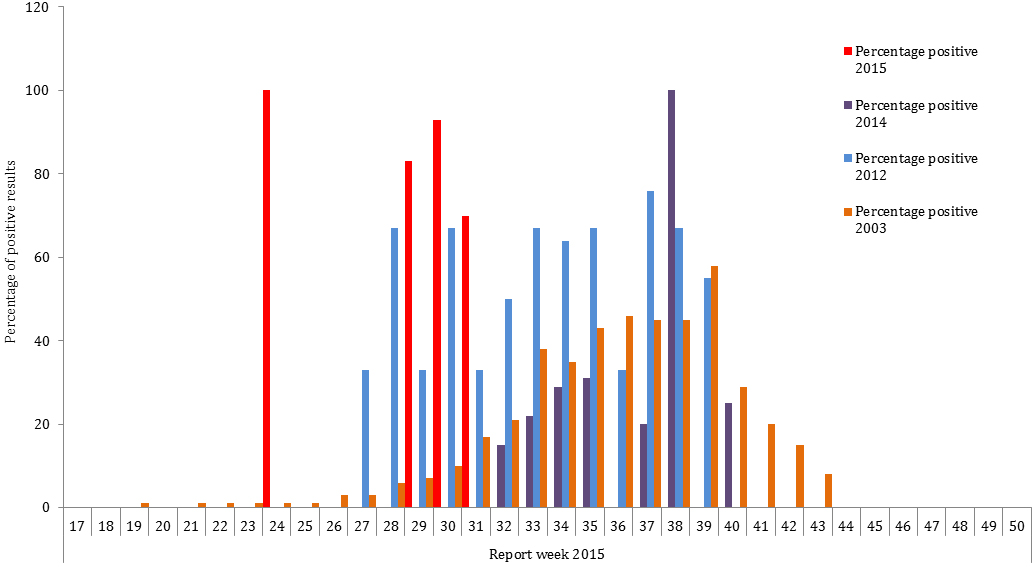
FIGURE 4: Percentage of dead birds testing positive for West Nile Virus in the 2015 season by report week, as compared to the 2003, 2012 and 2014 seasons
| Report week | |||||||||||||||||||||||||||||||
|---|---|---|---|---|---|---|---|---|---|---|---|---|---|---|---|---|---|---|---|---|---|---|---|---|---|---|---|---|---|---|---|
| 17 | 18 | 19 | 20 | 21 | 22 | 23 | 24 | 25 | 26 | 27 | 28 | 29 | 30 | 31 | 32 | 33 | 34 | 35 | 36 | 37 | 38 | 39 | 40 | 41 | 42 | 43 | 44 | 45 | 46 | 47 | |
Table 6 Footnotes
|
|||||||||||||||||||||||||||||||
| Numbers positive 2015 | 0 | 0 | 0 | 0 | 0 | 0 | 0 | 1 | 0 | 0 | 0 | 1 | 5 | 3 | 11 | 0 | |||||||||||||||
| Numbers tested 2015 | 0 | 0 | 0 | 0 | 0 | 0 | 0 | 1 | 0 | 0 | 1 | 1 | 6 | 5 | 15 | 7 | |||||||||||||||
| Percentage positive 2015 | 0 | 0 | 0 | 0 | 0 | 0 | 0 | 100 | 0 | 0 | 0 | 100 | 83 | 60 | 73 | 0 | |||||||||||||||
| Numbers positive 2014 | 0 | 0 | 0 | 0 | 0 | 0 | 0 | 0 | 0 | 0 | 0 | 0 | 0 | 0 | 0 | 2 | 2 | 2 | 4 | 0 | 2 | 3 | 0 | 1 | 0 | 0 | 0 | 0 | 0 | 0 | 0 |
| Numbers tested 2014 | 0 | 0 | 0 | 0 | 0 | 0 | 0 | 0 | 0 | 0 | 0 | 0 | 0 | 41Table 6 Footnote * | 10 | 13 | 9 | 7 | 13 | 6 | 10 | 3 | 1 | 4 | 2 | 1 | 0 | 0 | 0 | 0 | 0 |
| Percentage positive 2014 | 0 | 0 | 0 | 0 | 0 | 0 | 0 | 0 | 0 | 0 | 0 | 0 | 0 | 0 | 0 | 15 | 22 | 29 | 31 | 0 | 20 | 100 | 0 | 25 | 0 | 0 | 0 | 0 | 0 | 0 | 0 |
| Percentage positive 2012 | 0 | 0 | 0 | 0 | 0 | 0 | 0 | 0 | 0 | 0 | 33 | 67 | 33 | 67 | 33 | 50 | 67 | 64 | 67 | 33 | 67 | 67 | 55 | 0 | 0 | 0 | 0 | 0 | 0 | 0 | 0 |
| Percentage positive 2003 | 0 | 0 | 1 | 0 | 1 | 1 | 1 | 1 | 1 | 3 | 3 | 6 | 7 | 10 | 17 | 21 | 38 | 35 | 43 | 46 | 45 | 45 | 58 | 29 | 20 | 15 | 8 | 0 | 0 | 0 | 0 |
Page details
- Date modified: