
Canadian Antimicrobial Resistance Surveillance System (CARSS) Report 2022

Download in PDF format
(15.3 MB, 115 pages)
https://doi.org//10.58333/e241022
Organization: Public Health Agency of Canada
Published: 2022-11-28
Table of contents
- Executive summary
- Antimicrobial resistance (AMR) in humans
- Methicillin-resistant Staphylococcus aureus bloodstream infections
- Vancomycin-resistant Enterococcus bloodstream infections
- Carbapenemase-producing Enterobacterales
- Clostridioides difficile1 infections
- Neisseria gonorrhoeae infections
- Drug-resistant Mycobacterium tuberculosis infections
- Invasive Streptococcus pneumoniae infections
- Invasive Streptococcus pyogenes (group A Streptococcus) infections
- Typhoidal and non-typhoidal Salmonella enterica
- Antimicrobial susceptibility results from urine and blood samples, Canadian Antimicrobial Resistance Network (AMRNet)
- Antimicrobial use (AMU) in humans
- Surveillance of human antimicrobial use in Canada, 2017-2021
- Antimicrobial consumption by humans in the community sector
- Canadian national antimicrobial prescribing survey, 2018-2021
- Surveillance of human antimicrobial use in the community sector before 8 and during 9 the COVID-19 pandemic, Canada
- Overall national trends
- Antimicrobial prescriptions before and during COVID-19 in the community, by the WHO AWaRe categorization, Canada, 2016–2022
- Community antimicrobial prescriptions before and during the COVID-19 pandemic, stratified by sex, Canada, 2016–2022
- Monthly antimicrobial prescriptions before and during COVID-19 in the community, stratified by age, Canada, 2016–2022
- Antimicrobial use (AMU), antimicrobial resistance (AMR) and integrated AMR and AMU in animals/food and people in Canada
- Antimicrobials sold for use in all animals in Canada
- CIPARS farm-level surveillance of antimicrobial use and antimicrobial resistance: Broiler chickens, turkeys and grower-finisher pigs
- Integrated antimicrobial use and antimicrobial resistance along the food chain: Third-generation cephalosporin-resistant Salmonella
- Integrated information on antimicrobials intended for use across sectors (human, animals and crops)
- Antimicrobials sold for use in animals in Canada
- Antimicrobials sold for use in animals: International perspective
- Farm-level surveillance of antimicrobial use and antimicrobial resistance
- Integrated antimicrobial resistance and antimicrobial use from farm-level surveillance: CIPARS
- Integrated AMU and AMR along the food chain
- Integrating information on antimicrobials intended for use across sectors (human, animals and crops)
- Authors
- Appendices
- Footnotes
- References
Executive summary
Introduction
The World Health Organization (WHO) has declared antimicrobial resistance (AMR) to be one of the top global public health threats facing humanity. Globally, an estimated 4.95 million deaths in 2019 were associated with antimicrobial-resistant bacterial infections, of which 1.27 million deaths were directly attributable to AMR (1). Before the onset of the COVID pandemic, it was estimated that, in 2018, over one-quarter of bacterial infections in Canada were resistant to at least one first-line antimicrobial and that 14,000 Canadian deaths were associated with AMR, with AMR directly responsible for 5,400 of these deaths. The estimated cost to the Canadian health care system in 2018 was $1.4B, with a reduction to Canada’s GDP of $2.0B (2).
Many existing antimicrobial drugs are becoming less effective at treating infections, and drug-resistant pathogens continue to emerge. The situation is compounded by the paucity of novel antimicrobials in the research and development pipeline. Left unchecked, the risk of developing a resistant infection will prevent many Canadians from accessing common medical procedures, including routine surgeries like hip replacements, and chemotherapy for cancer. Furthermore, common infections like strep throat could become more difficult to treat, result in more complications, and in some cases, become life threatening. If resistance rates grow to 40% by 2050, predicted costs to the Canadian healthcare system would be $7.6B per year (2).
Addressing AMR in Canada requires a coordinated multi-sectoral One Health response that includes partners in government, human health, animal health, agri-food, industry, academia, and professional associations. Better engagement between these partners and the general public will be required to improve awareness and understanding of AMR and appropriate antimicrobial use (AMU). According to nation-wide public opinion research conducted by the Public Health Agency of Canada (PHAC) between December 2021 and January 2022, a majority (57%) of respondents expressed concern about antibiotic resistance, however, these results are much lower than has been reported in other countries such as the United Kingdom or the United States (3)(4). While 34% of those surveyed reported antibiotic use at least once in the previous 12 months, close to a third of respondents mistakenly believed that antibiotics were effective against colds and flus (5).
Enhancing surveillance to detect, understand and act against AMR and AMU
The 2022 Canadian Antimicrobial Resistance Surveillance System (CARSS) report provides five-year trends up to 2021; and presents an integrated view of available national-level data on AMR and AMU in human and animal populations generated by the PHAC and its partners. The CARSS Report is foundational in increasing efforts to achieve PHAC’s targeted AMR and AMU surveillance outcomes (Detect, Understand, and Act) by providing relevant and accurate information to stakeholders, researchers, healthcare practitioners, producers and policymakers to guide research, policies and actions on new and emerging AMR and AMU trends.
Efforts to achieve these goals have recently been accelerated through new funding announced in 2021, which has enabled PHAC to make progress in a number of key areas:
- Detect – Timely identification and monitoring of AMR threats and AMU trends across the One Health spectrum
- Findings from AMRNet, which uses integrated laboratory diagnostic data that now represents approximately 40% of the Canadian population, are being used to detect changes in AMR disease patterns.
- Information on the rates of AMR in some animals/food in the Canadian food-chain is being used to detect emerging threats to health, an important step in expanding a One Health approach to AMR.
- Understand – Analysis of AMR and AMU data in people and animals including trends, morbidity, mortality and economic impact, leading to informed risk management and decision making
- Results from the National Antimicrobial Prescribing Survey are being used to expand our understanding of the appropriateness of prescriptions dispensed in Canadian healthcare settings.
- Canada is increasing its data contributions to international surveillance systems (e.g., the World Health Organization’s Global Antimicrobial Resistance and Use Surveillance System) to better understand how AMR is spreading between countries.
- Act – Improved effectiveness of stewardship and infection prevention and control interventions empowered by high-quality data
- Many of the findings and analysis of AMR and AMU trends in this report have already been used by surveillance partners, such as hospitals and farms, to assess the effectiveness of existing antimicrobial stewardship and infection prevention and control strategies in combating AMR.
Looking forward
In addition to this progress, PHAC has initiated new surveillance activities designed to empower action against AMR through improved detection and understanding of AMR threats and AMU trends across the One Health spectrum. Data from these activities will be available in the next report:
- In partnership with Health Canada, PHAC has begun to monitor the quantity of some antimicrobials in wastewater samples from select Canadian cities. This work will help to form the basis of environmental surveillance for antimicrobials discharged into freshwater.
- The sentinel surveillance of AMR infections in hospitalized patients is being expanded to improve representation across Canada, and the initiation of surveillance for AMR infections in residents of long-term care facilities is underway.
- Canada’s surveillance of antimicrobial-resistant Neisseria gonorrhoea infections is improving with the development of laboratory methods that can predict antibiotic-resistant infection, supported by an expanding number of data sharing partnerships with provincial governments.
- Using a One Health approach, PHAC is expanding coverage of surveillance of different sectors along the food chain, including the expansion of on-farm activities with beef and dairy cattle. In addition, PHAC is enhancing retail meat and seafood surveillance, as retail meat is an avenue for transmission of resistant bacteria from animals to people.
CARSS 2022: AMR and COVID: An emerging picture
The surveillance findings presented in this report encompass the first full year of the COVID-19 pandemic, the effects of which are only now beginning to emerge. Canada, alongside many international partners, has observed a sustained decrease in antimicrobial consumption, largely driven by reduced community use of antibiotics. However, provincial reports have identified increased antimicrobial use in patients hospitalized for COVID-19 (6). Although hospitalizations for COVID-19 may have led to higher rates of some healthcare-associated bacterial infections, international reports have highlighted that the respiratory complications associated with COVID-19, and the clinical challenges in diagnosing co-infections, have increased the risk for inappropriate prescribing in the hospital setting (7). Additionally, the overall decrease in the number of Canadians admitted to hospitals may have reduced the frequency of some healthcare-acquired infections. Finally, the near-universal healthcare resource constraints (e.g., reallocated or insufficient staffing) may be reducing public health capacity to produce consistent AMR surveillance data. As a result, the overall effect of pandemic-related factors on the burden of AMR in Canada is yet to be determined. PHAC and its surveillance partners will continue to monitor the impact these factors may have on rates of AMR.
2022 CARSS report key findings
From 2016 to 2020, antimicrobial resistance continued to increase for most priority organisms, with some changes in trends following the start of the COVID-19 pandemic
- The overall rate of methicillin-resistant Staphylococcus aureus bloodstream infections increased, driven by increases in community-associated infections since 2017. This trend may be the result of increases in the frequency of at-risk behaviours in Canada, such as injection drug use and the ongoing opioid epidemic; a better understanding this situation will help to inform targets for intervention.
- The overall rate of vancomycin-resistant Enterococcus bloodstream infections increased between 2016 and 2020; however, since 2018, the rate has slightly decreased. These changes may be related to the emergence of a new sequence type, changes to infection control policies, a reduction in outbreak-related cases attributed to hospitals that care for high-risk patients and the COVID-19 pandemic.
- The overall rate of carbapenemase-producing Enterobacterales infections increased, although there was a decrease from 2019 to 2020. This recent decrease may be the result of fewer hospital admissions and the adoption of increased infection prevention and control practices enacted as a result of the COVID-19 pandemic.
- The overall rate of Clostridioides difficile infections decreased, although there was an increase from 2019 and 2020. The reasons for this trend are currently under investigation but may be related to increases in antibiotic prescribing reported in Canadian inpatients during the early stages of the COVID-19 pandemic.
Antimicrobial use in humans continues to decrease, however inappropriate prescribing is common
- Between 2017 and 2021, antimicrobial consumption decreased across all Canadian jurisdictions, most pronounced at the start of the COVID-19 pandemic (2020 to 2021).
- From 2018 to 2019, nearly a quarter of prescriptions were deemed inappropriate or suboptimal in Canadian healthcare facilities.
Antimicrobial resistance in healthy animals for animal species under surveillance decreased
- Between 2016 and 2020, a key metric for antimicrobial resistance indicated a decrease in antimicrobial resistance in bacteria from healthy broiler chickens, turkeys and grower-finisher pigs. Reported antimicrobial use on these farms also decreased.
Antimicrobials sold for use in animals increased
- From 2019 to 2020, the quantity of medically important antimicrobials (MIAs) sold for use in animals increased slightly. Sales of antimicrobials for use in poultry and fish decreased, while sales for use in pigs, cattle, and small ruminants increased.
- In 2020, use in animals represented 82% of all MIAs distributed for use in humans, animals and crops.
- The quantity of MIAs sold for use production in animals in Canada remains 3 times higher than the mean quantity reported by European countries.
Trend summary
This trend summary provides a high-level interpretation drawn from clinical, epidemiological and/or resistance information available at the time of publication.
| Key trends of antimicrobial resistance | Time period | Five year trend summary |
|---|---|---|
| Methicillin-resistant Staphylococcus aureus bloodstream infections (Healthcare-associated) | 2016-2020 | Trending down |
| Methicillin-resistant Staphylococcus aureus bloodstream infections (Community-associated) | 2016-2020 | Trending up |
| Vancomycin-resistant Enterococcus bloodstream infections | 2016-2020 | Trending up |
| Carbapenemase-producing Enterobacterales infections | 2016-2020 | Trending up |
| Clostridioides difficile infections | 2016-2020 | Trending down |
| Drug-resistant Neisseria gonorrhoeae infections | 2016-2020 | Trending up |
| Drug-resistant Mycobacterium tuberculosis infections | 2016-2020 | Stable |
| Multidrug resistant vaccine-preventable invasive Streptococcus pneumoniae diseases | 2016-2020 | Trending up |
| Typhoidal and non-typhoidal Salmonella enterica infections* | 2016-2019 | Trending up |
| * Only four years of data are being reported. | ||
Antimicrobial resistant (AMR) infections in humans
Methicillin-resistant Staphylococcus aureus (MRSA) bloodstream infections (BSI): 2016-2020
- The incidence of MRSA BSI detected in hospitalized patients continues to shift from healthcare-associated infections (down by 2.3%) to community-associated infections (up by 75.0%).
- More than 1 in 6 (17.5%) patients diagnosed with MRSA BSI died within 30 days of diagnosis (all-cause mortality).
- In AMRNet findings from 2020, MRSA accounted for 16.1% of Staphylococcus aureus bloodstream isolates.
Vancomycin-resistant Enterococcus (VRE) bloodstream infections (BSI): 2016-2020
- Following a sustained increase, the overall rate of VRE BSI in hospitalized patients appears to have plateaued for both community-associated and healthcare-associated infections during the COVID-19 pandemic (2019 and 2020).
- Nearly 1 in 3 (32.7%) of patients diagnosed with a VRE BSI died within 30 days of diagnosis (all-cause mortality).
Carbapenemase-producing Enterobacterales (CPE): 2016-2020
- While overall numbers remain low, the rate of healthcare-associated CPE infection in hospitalized patients appears to have decreased during the COVID-19 pandemic (2019 and 2020).
- Over 1 in 5 (21%) of patients diagnosed with a healthcare-associated CPE infection died within 30 days of diagnosis (all-cause mortality).
Clostridioides difficile infections (CDI): 2016-2020
- Following a sustained decrease from 2016 to 2019, healthcare-associated rates of CDI increased in 2020 during the COVID-19 pandemic.
- Attributable mortality at 30 days was 2.2% for patients diagnosed with CDI.
Neisseria gonorrhoeae (GC) infections: 2016-2019
- The incidence GC continues to increase in Canada, with rates higher in males.
- The continued success of azithromycin for the therapy of Neisseria gonorrhoea remains threatened, with the proportion of resistance between 2016 and 2020 consistently above the World Health Organizations recommendation of 5%.
Mycobacterium Tuberculosis (TB) infections: 2016-2020
- No major changes in the incidence rate of resistant-TB infections were reported between 2016 and 2020.
- The most recent case of extensively drug-resistant TB was reported in 2018.
Streptococcus pneumoniae invasive pneumococcal diseases (IPD): 2016-2020
- The rate of IPD, including multidrug-resistant IPD, continues to increase.
- Despite the availability of pneumococcal vaccines, the rate of infection by vaccine preventable serotypes increased by 45%.
Typhoidal and non-Typhoidal Salmonella enterica: 2016-2019
- In 2019, 12.0% of typhoidal Salmonella enterica and 16.6% of non-typhoidal Salmonella enterica were resistant to three or more classes of antimicrobials.
Antimicrobial use in humans: 2017-2021
- Between 2017 and 2021, a decrease in antimicrobial consumption was observed in all Canadian jurisdictions, most pronounced during the COVID-19 pandemic (2019 to 2021). In 2021, overall antimicrobial consumption in the community sector remained below pre-pandemic levels.
- Canada continues to exceed the World Health Organization’s target of 60% of total consumption of drugs being in the AWaRe Access category, with nearly 74% of prescriptions classified as "Access".
- Data from the National Antimicrobial Prescribing Survey show that nearly a quarter of prescriptions were deemed inappropriate or suboptimal in Canadian healthcare facilities.
Antimicrobial resistance in bacteria from healthy broiler chickens, grower-finisher pigs and turkeys: 2016-2020
- Between 2016 and 2020, antimicrobial resistance (reported as the percentage of E.coli isolates resistant to three or more classes of antimicrobials) decreased in samples from healthy broiler chickens, turkeys and grower-finisher pigs. Data on AMR in bacteria from other animal species and at other stages of the food-chain can be found in the Canadian Integrated Program for Antimicrobial Resistance Surveillance (CIPARS) reports.
Antimicrobial use in animals: 2019-2020
- Based on volunteer sentinel farm surveillance, between 2019 and 2020, the quantity of medically important antimicrobials (MIAs) sold for use in animals slightly increased from approximately 0.98 million to 1.05 million kilograms (kg) in Canada, which represents 82% of all MIAs (kg) distributed for use in humans, animals and crops.
- Between 2019 and 2020, as measured in kg, sales of antimicrobials for use in poultry and fish decreased; while sales for use in pigs, cattle, and small ruminants increased. Sales for use in horses and cats and dogs remained stable (less than 1% change).
- The quantity of MIAs sold for use in production animals in Canada remains three times higher than the mean quantity reported by European countries that participate in the European Surveillance of Veterinary Antimicrobial Consumption.
Antimicrobial resistance (AMR) in humans
Methicillin-resistant Staphylococcus aureus bloodstream infections
Staphylococcus aureus (S. aureus) is a bacteria that is commensal and found on the skin and nasal mucosa of humans and the skin of warm-blooded animals. Nearly a third of healthy adults are colonized by S. aureus, and 10-20% may have persistent colonization (9). S. aureus can cause a wide range of invasive infections including skin and soft tissue infections, bloodstream infections and ventilator-associated pneumonia (10). S. aureus spreads through direct skin contact or contact with contaminated equipment and surfaces.
Methicillin-resistant S. aureus (MRSA) is caused by strains of the bacteria which are resistant to beta-lactams, a class of antibiotics that are the most common first-line therapy used for S. aureus infections. In Canada, the first outbreak of MRSA was reported in 1978 (11). While MRSA infections were initially predominantly healthcare-associated (HA); community-associated (CA) MRSA infections have been increasing since the 2000s (12). Invasive MRSA infections are most commonly treated with vancomycin, or with newer agents like daptomycin, or linezolid.
Data presented were restricted to cases reported to the Canadian Nosocomial Infection Surveillance Program (CNISP) across ten provinces and one territory by 62 to 80 hospitals between 2016 and 2020. Results were stratified by source of acquisition (i.e., healthcare-associated and community-associated).
Healthcare-associated MRSA bloodstream infection (HA-MRSA BSI) was defined as symptoms occurring on or beyond the 3rd day of hospitalization or if the patient was hospitalized in the last 7 days or up to 90 days (using best clinical judgement), depending on the source of infection or if the patient has had a healthcare exposure at the reporting facility that would have resulted in this bacteremia.
Community-associated MRSA BSI (CA-MRSA BSI) was defined as symptoms occurring less than 3 days (<72 hours) after admission without history of hospitalization or any other healthcare exposure that would have resulted in this BSI. Once identified with a MRSA BSI, a new MRSA BSI would be identified if >14 days has elapsed since the previously treated MRSA BSI and in the judgement of Infection Control physicians and practitioners represented a new infection. Mortality calculations excluded cases where the source of acquisition was unknown. Further methodology (including the definitions of HA- and CA-MRSA) can be found in the 2022 CNISP report (8).
For additional information on healthcare-associated infections, antimicrobial resistant organisms, molecular characteristics (e.g. spa types) and antimicrobial resistance trends in CNISP participating hospitals, please see the CNISP interactive data page.
Key findings
- Between 2016 and 2020, the overall incidence of MRSA BSI increased by 33.3%, driven by a 75.0% rise in CA-MRSA BSI.
- Resistance to ciprofloxacin has been slowly decreasing in both HA and CA-MRSA BSI.
- For the first time, non-susceptibility to daptomycin was identified in CNISP MRSA BSI surveillance (four isolates in 2020).
- All isolates tested remained susceptible to linezolid, tigecycline & vancomycin from 2016 to 2020.
Results
From 2016 to 2020, the overall incidence of MRSA BSI increased by 33.3%, from 0.84 to 1.12 per 10,000 patient-days, driven by an increase in the rate of CA-MRSA BSI.
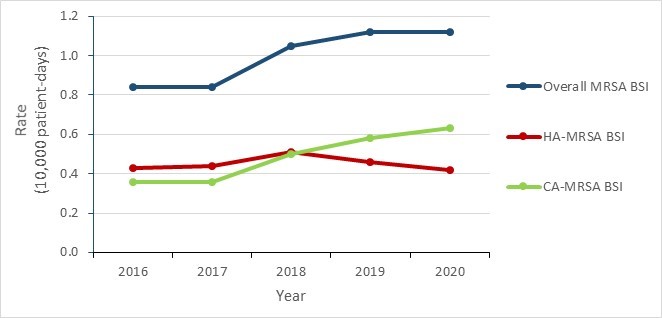
Figure 1 - Text description
| Year | 2016 | 2017 | 2018 | 2019 | 2020 |
|---|---|---|---|---|---|
| Overall MRSA BSI | 0.84 | 0.84 | 1.05 | 1.12 | 1.12 |
| HA-MRSA BSI | 0.43 | 0.44 | 0.51 | 0.46 | 0.42 |
| CA-MRSA BSI | 0.36 | 0.36 | 0.50 | 0.58 | 0.63 |
The incidence rate of HA-MRSA BSI remained stable in adult and mixed hospitals during this five-year period. Rates in pediatric hospitals were relatively stable from 2016 to 2018 (0.42 to 0.30 cases per 10,000 patient-days), increasing 63.3% in 2019 (0.49 cases per 10,000 patient-days), before returning to a pre-peak rate of 0.29 in 2020.
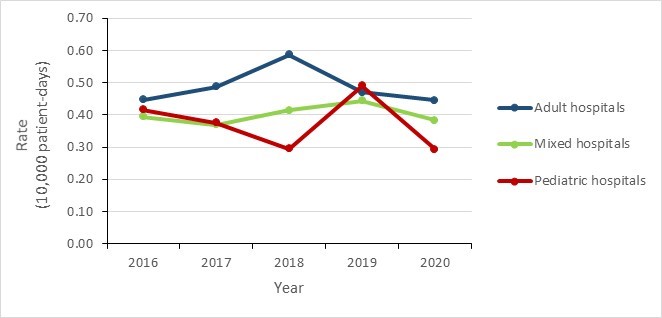
Figure 2 - Text description
| Year | 2016 | 2017 | 2018 | 2019 | 2020 |
|---|---|---|---|---|---|
| Adult hospitals | 0.45 | 0.49 | 0.59 | 0.47 | 0.45 |
| Mixed hospitals | 0.39 | 0.37 | 0.41 | 0.44 | 0.38 |
| Pediatric hospitals | 0.42 | 0.38 | 0.30 | 0.49 | 0.29 |
Mortality rates
From 2016 to 2020:
- MRSA BSI all-cause mortality decreased by 8.9%, from 19.1 to 17.4 per 100 MRSA BSI cases.
- HA-MRSA BSI all-cause mortality decreased by 8.3%, from 21.7 to 19.9 per 100 HA-MRSA BSI cases.
- CA-MRSA BSI all-cause mortality remained stable with values varying between 12.3 and 16.0 per 100 CA-MRSA BSI cases.
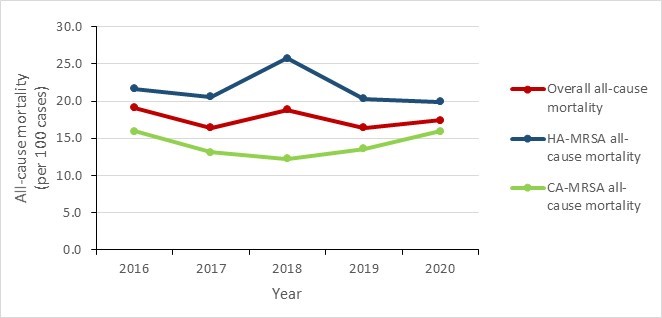
Figure 3 - Text description
| Year | 2016 | 2017 | 2018 | 2019 | 2020 |
|---|---|---|---|---|---|
| Overall all-cause mortality | 19.1 | 16.4 | 18.8 | 16.4 | 17.4 |
| HA-MRSA all-cause mortality | 21.7 | 20.6 | 25.7 | 20.3 | 19.9 |
| CA-MRSA all-cause mortality | 16.0 | 13.1 | 12.3 | 13.6 | 15.9 |
Trends in antimicrobial resistance from 2016 to 2020
Among isolates tested where the bloodstream infection was identified as being healthcare-associated (HA-MRSA BSI):
- The proportion resistant to ciprofloxacin decreased from 78.4% to 65.3% (a 13.1% absolute decrease between 2016 and 2020).
- Resistance to clindamycin and erythromycin remained relatively stable between 34.2% and 50.3% for clindamycin and between 71.2% and 80.7% for erythromycin.
- Resistance to rifampin, tetracycline and trimethoprim-sulfamethoxazole all remained below 7.0% during the five-year period.
- All tested isolates remained sensitive to daptomycin between 2016 and 2019 (daptomycin is one of the first-line treatments of choice along with vancomycin). However, in 2020, two isolates were identified as non-susceptible for the first time in the CNISP surveillance system. From 2016 to 2020, all isolates tested remained sensitive to linezolid, tigecycline and vancomycin.
| Proportion of resistant isolates per year | 2016 | 2017 | 2018 | 2019 | 2020 |
|---|---|---|---|---|---|
| Isolates tested (n) | 273 | 296 | 334 | 261 | 222 |
| Ciprofloxacin | 78.4% | 77.0% | 74.6% | 72.0% | 65.3% |
| Clindamycin | 48.0% | 47.6% | 50.3% | 49.0% | 34.2% |
| Daptomycina | 0.0% | 0.0% | 0.0% | 0.0% | 0.9% |
| Erythromycin | 79.9% | 80.7% | 76.9% | 75.1% | 71.2% |
| Rifampin | 2.6% | 1.0% | 0.9% | 2.3% | 0.9% |
| Tetracycline | 4.8% | 5.4% | 4.5% | 6.9% | 6.3% |
| Trimethoprim-sulfamethoxazole | 1.5% | 1.4% | 0.9% | 1.1% | 1.8% |
a For Daptomycin - only ‘non-susceptible results are reported’. There are no intermediate or resistant interpretations for daptomycin in Clinical and Laboratory Standards Institute (CLSI). The included antimicrobials were part a Gram positive Sensititre panel which may include those not part of treatment guidelines. Therefore, some antimicrobials are presented for epidemiologic purposes only. |
|||||
Among isolates tested where the bloodstream infection was identified as community-associated (CA-MRSA BSI):
- The proportion of isolates resistant to ciprofloxacin decreased from 75.4% to 63.0% (a 12.4% absolute decrease between 2016 and 2020).
- Resistance to clindamycin and erythromycin remained relatively stable with percentages fluctuating between 29.4% and 39.5% for clindamycin, and between 71.7% and 81.0% for erythromycin.
- Antimicrobial resistance remained low (<11%) for rifampin, tetracycline and trimethoprim-sulfamethoxazole.
- All isolates tested remained sensitive to daptomycina from 2016 to 2019 (one of the first-line treatments of choice along with vancomycin). However, in 2020, two isolates were identified as non-susceptible for the first time in the CNISP surveillance system.
- From 2016 to 2020, all isolates tested remained sensitive to linezolid, tigecycline and vancomycin.
| Proportion of resistant isolates per year | 2016 | 2017 | 2018 | 2019 | 2020 |
|---|---|---|---|---|---|
| Isolates tested (n) | 228 | 232 | 334 | 320 | 346 |
| Ciprofloxacin | 75.4% | 76.3% | 69.2% | 68.1% | 63.0% |
| Clindamycin | 39.5% | 36.6% | 33.2% | 29.4% | 31.8% |
| Daptomycina | 0.0% | 0.0% | 0.0% | 0.0% | 0.6% |
| Erythromycin | 75.9% | 81.0% | 73.4% | 76.3% | 71.7% |
| Rifampin | 1.3% | 2.6% | 0.9% | 0.0% | 0.6% |
| Tetracycline | 7.5% | 7.8% | 9.9% | 6.6% | 5.8% |
| Trimethoprim-sulfamethoxazole | 2.6% | 1.3% | 3.3% | 1.6% | 2.9% |
a For Daptomycin - only ‘non-susceptible results are reported’. There are no intermediate or resistant interpretations for daptomycin in Clinical and Laboratory Standards Institute (CLSI). The included antimicrobials were part of a Gram positive Sensititre panel which may include those not part of treatment guidelines. Therefore, some antimicrobials are presented for epidemiologic purposes only. |
|||||
The strain types and resistance data for HA-MRSA & CA-MRSA BSI are based on the epidemiologic case definition for 'where acquired'.
While both HA-MRSA and CA-MRSA bloodstream infections (BSI) have existed for a long time, current trends show steady increases of CA-MRSA BSI since about 2015.
Data on the strain type and proportion of resistance for HA-MRSA BSI isolates has been restricted to infections attributed to the reporting hospital.
- Since 2018, CNISP has collected epidemiologic data on both MRSA and methicillin susceptible Staphylococcus aureus (MSSA) BSI attributed to the reporting hospital. The proportion of MRSA remained stable, ranging from 23% in 2018 to 21% in 2020.
- In addition, from 2018 to 2020 CNISP collected aggregate hospital-level antibiogram data on S. aureus isolates recovered from both inpatients and outpatients. The proportion of S. aureus isolates identified as MRSA fluctuated between 23.0% and 26.0% during this period.
- Among the MRSA BSI identified as healthcare-associated, the following endemic strain types were reported between 2016 and 2020:
- CMRSA 2, an epidemic strain type historically associated with HA-MRSA decreased from 45.1% in 2016 to 30.5% in 2020. CMRSA 7 and CMRSA 10 are epidemic strain types traditionally associated with CA-MRSA and between 2016 and 2020, the percentage of CMRSA 7 nearly doubled from 7.0% to 13.0% and CMRSA 10 increased from 34.5% to 39.9%.
| Epidemic strain type | 2016 N (%) |
2017 N (%) |
2018 N (%) |
2019 N (%) |
2020 N (%) |
|---|---|---|---|---|---|
| All epidemic strain typesa (n) | 562 | 564 | 702 | 664 | 618 |
| CMRSA 2 | 189 (33.6%) | 173 (30.7%) | 196 (27.9 %) | 163 (24.5%) | 131 (21.2%) |
| CMRSA 7 | 39 (6.9%) | 48 (8.5%) | 57 (8.1%) | 66 (9.9%) | 84 (13.6%) |
| CMRSA 10 | 258 (45.9%) | 253 (44.9%) | 327 (46.6%) | 330 (49.7%) | 310 (50.2%) |
| Otherb | 76 (13.5%) | 90 (16.0%) | 122 (17.4%) | 105 (15.8%) | 93 (15.0%) |
| HA epidemic strain types (n) | 284 | 298 | 334 | 280 | 223 |
| CMRSA 2 | 128 (45.1%) | 119 (39.9%) | 127 (38.0%) | 101 (36.1%) | 68 (30.5%) |
| CMRSA 7 | 20 (7.0%) | 19 (6.4%) | 25 (7.5%) | 17 (6.1%) | 29 (13.0%) |
| CMRSA 10 | 98 (34.5%) | 105 (35.2%) | 119 (35.6%) | 105 (37.5%) | 89 (39.9%) |
| Otherb | 38 (13.4%) | 55 (18.5%) | 63 (18.9%) | 57 (20.4%) | 37 (16.6%) |
| CA epidemic strain types (n) | 248 | 232 | 334 | 341 | 346 |
| CMRSA 2 | 53 (21.4%) | 40 (17.2%) | 59 (17.7%) | 52 (15.2%) | 50 (14.5%) |
| CMRSA 7 | 18 (7.3%) | 28 (12.1%) | 31 (9.3%) | 49 (14.4%) | 55 (15.9%) |
| CMRSA 10 | 141 (56.9%) | 132 (56.9%) | 190 (56.9%) | 202 (59.2%) | 196 (56.6%) |
| Otherb | 36 (14.5%) | 32 (13.8%) | 54 (16.2%) | 38 (11.1%) | 45 (13.0%) |
a The strain types and resistance for HA & CA are based on the epidemiological case definition. Isolates with unknown or missing source of acquisition have been excluded. b Other epidemic strain types = CMRSA 1, CMRSA 3/6, CMRSA 4, CMRSA 5, CMRSA 8, European, ST398, ST772, ST88, ST97, USA 1000 China/Taiwan, USA1100 SWP/Oceania, USA 700 as well as unassigned epidemic strain types. |
|||||
Vancomycin-resistant Enterococcus bloodstream infections
Enterococci are facultative bacteria that are commensal to the gut microflora and are shed in human feces (13). About 30% of all healthcare-associated Enterococci infections are resistant to vancomycin (14). Enterococci are associated with serious and life-threatening infections to humans such as urinary tract infections, sepsis, and endocarditis (15).
Vancomycin-resistant Enterococcus (VRE) is usually spread from person to person by direct contact or by contact with contaminated surfaces. VRE infections occur most commonly among people in hospital with weakened immune systems, those who have been previously treated with vancomycin (or other antibiotics for long periods of time), those who have undergone surgical procedures, and those with medical devices such as urinary catheters (16).
The treatment of enterococcal infections traditionally included a semisynthetic penicillin-based regimen or aminoglycopeptides (i.e., vancomycin); however, due to increasing resistance patterns, other therapeutic options such as linezolid, and daptomycin have been introduced for the treatment of VRE BSI (13).
Data presented were restricted to cases reported to the Canadian Nosocomial Infection Surveillance Program (CNISP) by 59 to 68 reporting hospitals between 2016 and 2020. Results were stratified by facility type (i.e., adult, pediatric or mixed facility). A healthcare-associated VRE bloodstream infection (HA-VRE BSI) case was defined as a patient with 3 days or more of hospitalization (day 1 is the day of hospital admission) or with a history of hospitalization or any other healthcare exposure in the last 7 days (or up to 90 days depending on the source of infection) that would have resulted in this BSI upon assessment by an infection prevention and control professional. Mortality calculations excluded cases where the source of acquisition was unknown. Further methodological details can be found in the 2022 CNISP publication (8).
For additional information on healthcare-associated infections, antimicrobial resistant organisms, molecular characteristics (e.g. spa types) and antimicrobial resistance trends in CNISP participating hospitals, please see the CNISP interactive data page.
Key findings
- The overall incidence rate of VRE BSI increased by 72.2%, from 0.18 per 10,000 patient-days in 2016 to 0.31 per 10,000 patient-days in 2020.
- Among VRE BSI identified between 2016 and 2020, 30-day all-cause mortality was 32.7%.
- High-level gentamicin resistance increased between 2016 (13.2%) and 2018 (42.5%); however, a decrease was observed between 2019 (33.1%) and 2020 (26.1%).
- Between 2016 and 2020, in VRE BSI isolates, low levels of resistance were detected to tigecycline (<1%), linezolid (<2%) and daptomycin (<9%).
Results
The national incidence rate of VRE BSI per 10,000 patient-days increased from 0.18 in 2016 to a peak of 0.35 in 2018, slightly decreasing to 0.31 in 2020. VRE BSIs are predominantly healthcare-associated; 93.2% of VRE BSI reported between 2016 and 2020 were acquired in a healthcare facility. The overall all-cause mortality for VRE BSI was 32.7%.
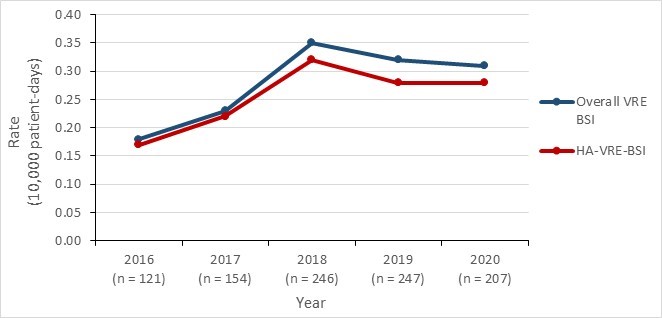
Figure 4 - Text description
| Year | 2016 | 2017 | 2018 | 2019 | 2020 |
|---|---|---|---|---|---|
| Overall incidence rate | 0.18 | 0.23 | 0.35 | 0.32 | 0.31 |
| HA-VRE-BSI incidence rate | 0.17 | 0.22 | 0.32 | 0.28 | 0.28 |
VRE BSI incidence per facility type
Between 2016 and 2020, the incidence rate of VRE BSI in adult facilities increased 72.7%; however, since peaking in 2018, a decline has been observed (from 0.48 per 10,000 patient-days in 2018 to 0.38 per 10,000 patient-days in 2020).
The incidence rate of VRE BSI in mixed facilities was relatively stable between 2016 and 2020, with incidence rates fluctuating between 0.12 and 0.20 per 10,000 patient-days. VRE BSI were seldom identified at pediatric facilities, 2.2% (n=21/975) of infections reported between 2016 and 2020 were acquired in a pediatric healthcare facility.
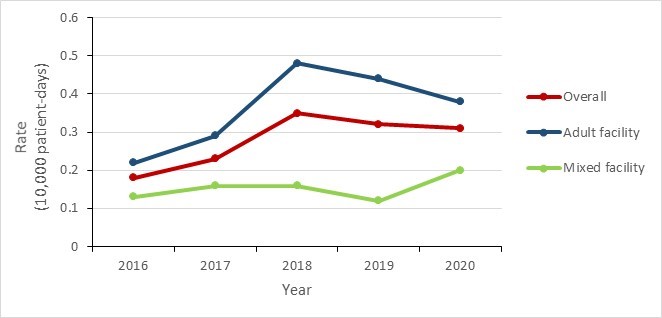
Figure 5 - Text description
| Year | 2016 | 2017 | 2018 | 2019 | 2020 |
|---|---|---|---|---|---|
| Overall | 0.18 | 0.23 | 0.35 | 0.32 | 0.31 |
| Adult facility | 0.22 | 0.29 | 0.48 | 0.44 | 0.38 |
| Mixed facility | 0.13 | 0.16 | 0.16 | 0.12 | 0.20 |
- Enterococcus faecium - 679/683 (99.4%)
- Enterococcus faecalis - 4/683 (0.6%)
Multi-locus sequence typing and antimicrobial resistance profiles
In 2020, the three most common sequence types were ST17 (36.1%), ST1478 (17.6%) and ST80 (17.6%). However, the distribution of the most common VRE BSI ( E. faecium ) sequence types has changed over time. The largest increase was observed among ST17 (3.3% in 2016 to 36.1% in 2020). ST1478 increased from 11.0% in 2016 to 38.7% in 2018, followed by a decline to 17.6% in 2020.
| Proportion of sequence type per year | 2016 | 2017 | 2018 | 2019 | 2020 |
|---|---|---|---|---|---|
| Isolates tested (n) | 91 | 116 | 181 | 165 | 119 |
| ST17 | 3.3% | 5.2% | 5.0% | 21.2% | 36.1% |
| ST18 | 15.4% | 5.2% | 1.7% | 1.8% | 1.7% |
| ST80 | 12.1% | 9.5% | 11.6% | 12.7% | 17.6% |
| ST117 | 23.1% | 14.7% | 13.3% | 9.7% | 11.8% |
| ST412 | 14.3% | 6.9% | 4.2% | 0.6% | 0.8% |
| ST734 | 4.4% | 13.0% | 11.6% | 11.5% | 8.4% |
| ST1478 | 11.0% | 27.6% | 38.7% | 32.7% | 17.6% |
| Othera | 16.5% | 18.1% | 13.8% | 8.5% | 5.9% |
| a Other" include ST16, ST56, ST78, ST132, ST154, ST192, ST203, ST233, ST252, ST262, ST280, ST282, ST323, ST375, ST414, ST494, ST584, ST612,ST662, ST663, ST664, ST665, ST721, ST736, ST750, ST761, ST772, ST786, ST787, ST802, ST835, ST836, ST912, ST982, ST983, ST984, ST992, ST1032, ST1112, ST1113, ST1201, ST1265, ST1421, ST1424, ST1497, ST1587, ST1612, ST1692, ST1821, ST1824. | |||||
Between 2016 and 2020, almost all VRE BSI isolates were resistant to ciprofloxacin. High-level gentamicin resistance increased from 2016 (13.2%) to 2018 (42.5%); however, a 7.0% decrease was observed more recently between 2019 (33.1%) and 2020 (26.1%). VRE BSI isolates remained largely susceptible to tigecycline (resistance <1%), linezolid (resistance <2%) and daptomycin (resistance <9%) across all surveillance years. Daptomycin resistance peaked at 8.6% (n=10) in 2017 and declined to 3.5% (n=4) in 2020; however, this should be interpreted with caution due to the small number of resistant isolates identified each year. Resistance to quinupristin-dalfopristin remained relatively stable in Canada, fluctuating between 6.9% and 10.7% in the five-year period.
| Proportion of resistant isolates per year | 2016 | 2017 | 2018 | 2019 | 2020 |
|---|---|---|---|---|---|
| Isolates tested (n)a | 91 | 116 | 181 | 169 | 115 |
| Ampicillin | 100.0% | 100.0% | 100.0% | 100.0% | 97.4% |
| Chloramphenicol | 2.2% | 9.5% | 2.2% | 16.6% | 19.1% |
| Ciprofloxacin | 100.0% | 100.0% | 100.0% | 100.0% | 98.3% |
| Daptomycinb | 7.7% | 8.6% | 6.6% | 4.1% | 3.5% |
| Erythromycin | 91.2% | 93.1% | 95.6% | 95.9% | 93.9% |
| Gentamycin (high-level) | 13.2% | 38.8% | 42.5% | 33.1% | 26.1% |
| Levofloxacin | 100.0% | 100.0% | 98.9% | 100.0% | 97.4% |
| Linezolid | 1.1% | 0.0% | 1.1% | 1.8% | 0.0% |
| Nitrofurantoin | 38.5% | 44.8% | 30.4% | 40.2% | 34.8% |
| Penicillin | 100.0% | 100.0% | 100.0% | 100.0% | 98.3% |
| Quinupristin-dalfopristin | 9.9% | 6.9% | 9.9% | 10.7% | 7.0% |
| Rifampin | 93.4% | 94.8% | 90.1% | 91.7% | 85.2% |
| Streptomycin (high-level) | 35.2% | 33.6% | 33.1% | 25.4% | 20.0% |
| Tetracycline | 50.5% | 56.9% | 59.7% | 70.4% | 62.6% |
| Tigecyclinec | 0.0% | 0.0% | 0.6% | 0.0% | 0.0% |
| Vancomycin | 96.7% | 95.7% | 97.2% | 98.2% | 95.7% |
a Total number reflects the number of isolates tested for each of the antibiotics listed above. b Since 2020, Clinical and Laboratory Standards Institute (CLSI) has resistant breakpoints for daptomycin. All data from 2016 to present has been analyzed with these breakpoints. c Tigecycline resistance results were interpreted Follows EUCAST breakpoints, as there are no breakpoints under CLSI. The included antimicrobials were part of the Gram positive Sensititre panel which may include those not part of treatment guidelines. Therefore, some antimicrobials are presented for epidemiologic purposes only. |
|||||
Carbapenemase-producing Enterobacterales
Enterobacterales are a large group of rod-shaped and facultatively anaerobic bacteria that is commensal to human gut microbiota and different animal species (17). The pathogen can cause different types of infections such as urinary tract infections, pyelonephritis, sepsis, pneumonia and meningitis (18).
Carbapenemase-producing Enterobacterales (CPE) are a Gram-negative bacteria that have the ability to hydrolyze carbapenem drugs by the production of carbapenemase enzymes. Most carbapenemases hydrolyze penicillins, cephalosporins, and carbapenems. Additionally, carbapenemases are often associated with multidrug resistance, as they are commonly found on plasmids containing multiple determinants of resistance to other classes of antimicrobials, making treatment options limited (19). Well described carbapenemases such as Klebsiella pneumoniae carbapenemase (KPC), New Delhi metallo-β-lactamase (NDM) and Oxacillinase 48 (OXA-48) are reported globally and are increasingly reported in Canada (20) (21) (22)
CPE can spread in the healthcare and community sectors. Globally, CPE incidence has been increasing for almost two decades, prompting the World Health Organization (WHO) to name CPE as a priority AMR pathogen in 2017 (23). In Canada, the first CPE cases were detected in 2008 (24); from 2010 to 2014, the five-year incidence was estimated at 0.09 per 10,000 patient-days and the all-cause mortality at 17.1 per 100 CPE cases for the same time-period (20).
Treatment of infections caused by CPE include aminoglycosides, fluoroquinolones and trimethoprim-sulfamethoxazole. Treatments with tigecycline and polymyxins (colistin) may be considered, but only for cases of resistance to all other classes of antimicrobials. However, the emergence of resistance against many of these drugs has become a growing clinical challenge (25).
Data presented were restricted to cases reported to the Canadian Nosocomial Infection Surveillance Program (CNISP) by 55 to 72 reporting hospitals between 2016 and 2020. Isolate data presented include both infection and colonization. Healthcare-associated rates are presented for infections only, colonization rates were not included in this report due to important differences in screening practices across Canadian jurisdictions and the limited value from the data interpretation. Due to the small number of annual infections, regional data include both healthcare-associated (HA) and community-associated CPE (CA-CPE) infections, data combined. The slight decrease in 2020 has been hypothesized to be the result of the COVID-19 pandemic, possibly because of changes in screening and testing practices and reduced international travel. Mortality calculations excluded cases where the source of acquisition was unknown. Further methodology (including the definitions of HA- and CA-MRSA) can be found in the 2022 CNISP report (8).
For additional information on healthcare-associated infections, antimicrobial resistant organisms, molecular characteristics (e.g. spa types) and antimicrobial resistance trends in CNISP participating hospitals, please see the CNISP interactive data page.
Key findings
Between 2016 and 2020:
- The incidence of HA-CPE infections increased from 0.02 per 10,000 patient-days in 2016 to 0.05 per 10,000 days in 2019, followed by a decrease in 2020 (0.03 per 10,000 patient days).
- Between 2016 and 2020, KPC, NDM and OXA-48 were the most prevalent carbapenemases.
Results
- While the incidence of HA-CPE infections remains low in Canadian acute care hospitals, an increase was observed from 2016 (0.02 per 10,000 patient-days) to 2019 (0.05 per 10,000 patient-days), followed by a decrease in 2020 (0.03 per 10,000 patient-days).
- From 2016 to 2020 the all-cause mortality per 100 HA-CPE infected patients was 18.02% (n=20).
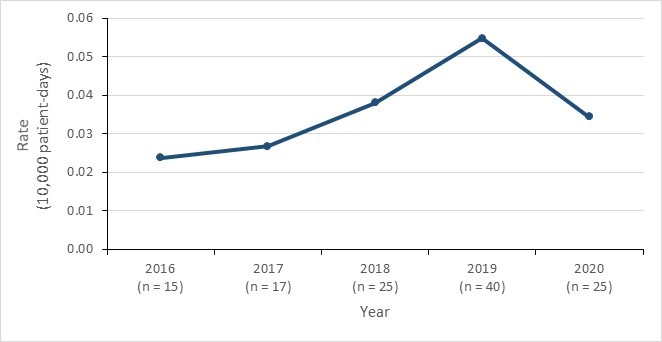
Figure 6 - Text description
| Year | 2016 | 2017 | 2018 | 2019 | 2020 |
|---|---|---|---|---|---|
| HA-CPE infection rate | 0.02 | 0.03 | 0.04 | 0.05 | 0.03 |
Regional trends
Regional CPE data include infections from all sources of acquisition. Between 2016 and 2020, CPE infection rates were highest in Central and Western Canada and remained low in Eastern Canada. Variability in regional incidence rates is due to small number of reported infections.
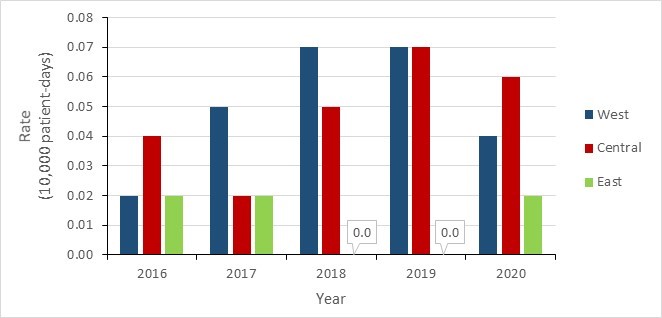
Figure 7 - Text description
| Year | 2016 | 2017 | 2018 | 2019 | 2020 |
|---|---|---|---|---|---|
| Western | 0.02 | 0.05 | 0.07 | 0.07 | 0.04 |
| Central | 0.04 | 0.02 | 0.05 | 0.07 | 0.06 |
| Eastern | 0.02 | 0.02 | 0.00 | 0.00 | 0.02 |
*Western: British Columbia, Alberta, Saskatchewan and Manitoba; Central: Ontario and Quebec; Eastern: New Brunswick, Nova Scotia, Prince Edward Island, Newfoundland and Labrador.
Carbapenemases identified
The following results reflect all CPE isolates (infections and colonization) submitted. Some isolates contain multiple carbapenemases therefore the total number of isolates tested and the number of carbapenemases indicated may differ.
Klebsiella pneumoniae (KPC), New Delhi metallo-β-lactamase (NDM) and oxacillinase-48 (OXA-48) were the most common carbapenemases identified between 2016 and 2020. Overall, the proportions of these carbapenemase types remained relatively stable with minimal variations during this period. KPC types were consistently more prevalent than the others, followed by NDM enzyme type.
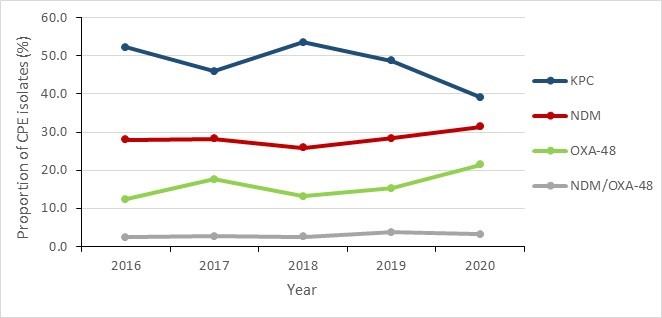
Figure 8 - Text description
| Year | 2016 | 2017 | 2018 | 2019 | 2020 |
|---|---|---|---|---|---|
| KPC | 52.2% | 46.0% | 53.5% | 48.7% | 39.1% |
| NDM | 28.0% | 28.3% | 25.9% | 28.4% | 31.4% |
| OXA-48 | 12.4% | 17.6% | 13.2% | 15.3% | 21.4% |
| NDM/OXA-48 | 2.5% | 2.7% | 2.6% | 3.8% | 3.3% |
CPE resistance results
- Over 60% of CPE isolates were resistant to ceftazidime, ciprofloxacin, meropenem, piperacillin-tazobactam and trimethoprim-sulfamethoxazole.
- Between 2016 and 2020, tigecycline and amikacin showed the lowest levels of resistance of the antimicrobials tested, with the corresponding levels varying between 0.0% and 20.0%, and 7.0% and 27.0%, respectively.
| Proportion of resistant isolates per year | 2016 | 2017 | 2018 | 2019 | 2020 |
|---|---|---|---|---|---|
| Isolates tested (n) | 161 | 187 | 228 | 261 | 210 |
| Amikacin | 26.1% | 17.1% | 19.3% | 8.8% | 7.6% |
| Ceftazidime | 86.3% | 85.6% | 84.2% | 89.3% | 82.4% |
| Ciprofloxacin | 82.6% | 73.8% | 69.3% | 70.1% | 71.4% |
| Gentamicin | 38.5% | 34.2% | 35.1% | 33.0% | 29.0% |
| Meropenem | 87.0% | 85.0% | 86.8% | 72.8% | 61.9% |
| Piperacillin-tazobactam | 72.0% | 85.0% | 92.1% | 90.8% | 87.6% |
| Tigecycline | 19.9% | 9.6% | 13.2% | 13.8% | 0.0% |
| Tobramycin | 46.6% | 38.0% | 44.3% | 46.4% | 37.1% |
| Trimethoprim-sulfamethoxazole | 63.4% | 60.4% | 62.7% | 73.9% | 76.2% |
| The included antimicrobials were part of the laboratory antibiogram panel which may include those not part of treatment guidelines. Therefore, some antimicrobials are presented for epidemiologic purposes only. | |||||
Clostridioides difficile1 infections
Clostridioides difficile (C. difficile) bacteria cause infectious diarrhea and pseudomembranous colitis. C. difficile infection (CDI) can result from the use of broad-spectrum antibiotics, which disrupt the gut microbiota, allowing for its overgrowth (26) and is the most common cause of healthcare-associated infectious diarrhea (27). C. difficile produces two major toxins thought to be primarily responsible for its virulence and the major contributors to its pathogenesis (28). It disseminates through direct contact between people and contaminated high-touch surfaces in both healthcare and community settings (29) (30) (31).
CDI is commonly treated with vancomycin, metronidazole or fidaxomicin as second line treatment (32). C. difficile is resistant to multiple antibiotics such as tetracyclines, erythromycin, clindamycin, penicillins, cephalosporins, and fluoroquinolones which are commonly used in the treatment of bacterial infections in clinical settings (33) (34). The C. difficile genome contains a plethora of mobile genetic elements, which are transferable among C. difficile strains or between C. difficile and other bacterial species, further facilitating wider spread of antimicrobial resistance (35).
Data presented were restricted to cases reported to the Canadian Nosocomial Infection Surveillance Program (CNISP) by 55 to 82 reporting hospitals between 2016 and 2020. Results were stratified by source of acquisition (i.e., healthcare-associated (HA) and community-associated (CA)). CA-CDI is defined as symptoms occurring less than 3 days (<72 hours) after admission without history of hospitalization or any other healthcare exposure within the previous 12 weeks. Mortality calculations excluded cases where the source of acquisition was unknown. Further methodology and case definitions have been previously described by CNISP.
For additional information on healthcare-associated infections, antimicrobial resistant organisms, molecular characteristics (e.g. spa types) and antimicrobial resistance trends in CNISP participating hospitals, please see the CNISP interactive data page.
Key findings
- Between 2016 and 2019, HA-CDI incidence rates decreased, with a slight increase reported in 2020. The incidence of CA-CDI remained relatively stable.
- Among all CDI cases (HA-CDI and CA-CDI combined), the 30-day attributable mortality was 2.2%.
- During this period, one HA-CDI isolate was found to be resistant to metronidazole, and no isolates with resistance to vancomycin were identified.
Results
CDI infection incidence rate and mortality trends
The incidence rate of HA-CDI declined by 18.2% between 2016 and 2019 (from 4.4 to 3.6 cases per 10,000 patient-days), followed by a slight increase in 2020 to 3.8 cases per 10,000 patient-days. HA-CDI attributable mortality within 30 days of diagnosis decreased from 2.5% in 2016 to 2.0% in 2020.
Between 2016 and 2020, the incidence of CA-CDI remained stable overall, with rates fluctuating between 1.2 and 1.4 cases per 1,000 patient-admissions. CA-CDI mortality rate ranged between 2.1% and 4.5% from 2016 and 2020. Overall, 30-day attributable mortality for all CDI cases fluctuated from 2016 to 2020 (1.3% to 2.7%) but remained low at 2.2%.
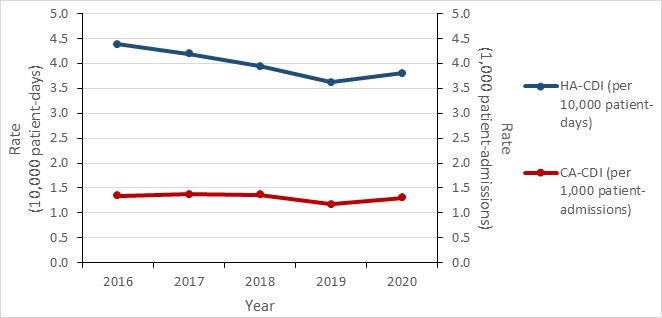
Figure 9 - Text description
| Year | 2016 | 2017 | 2018 | 2019 | 2020 |
|---|---|---|---|---|---|
| HA-CDI (per 10,000 patient-days) | 4.39 | 4.19 | 3.94 | 3.62 | 3.80 |
| CA-CDI (per 1,000 patient-admissions) | 1.34 | 1.37 | 1.36 | 1.17 | 1.30 |
Prevalence of CDI ribotypes
The following ribotypes (RT) were selected and reported due to their high incidence, their potential for epidemics and their risk of being associated with antimicrobial resistance.
- RT106 is becoming the most prevalent ribotype in Canada. It has been reported to be highly resistant to many antimicrobials (i.e., clindamycin, erythromycin, fluoroquinolones and third-generation cephalosporins) (36).
- RT106, RT020 and RT014 are becoming more common in both healthcare and community sectors in Canada and elsewhere (36) (37).
- RT027 prevalence in Canada has decreased since 2016. This decrease in prevalence also coincided with a decrease in fluoroquinolone resistance.
Of the 339 isolates tested in 2020, RT106 was the most common (14.7%, n=50), followed by RT014 (8.0%, n=27) and RT020 (7.7%, n=26). The predominant HA-CDI ribotypes were RT106 (15.0%, n=41), RT020 (8.4%, n=23) and RT014 (8.1%, n=22), respectively. The predominant CA-CDI ribotypes were RT106 (13.6%, n=9), RT015 (9.1%, n=6) and RT014 (7.6%, n=5), respectively.
Livestock-associated RT078/126, which has demonstrated epidemic potential in other countries, appears to be uncommon among hospitalized patients with CDI in Canada (3.9% in 2020).
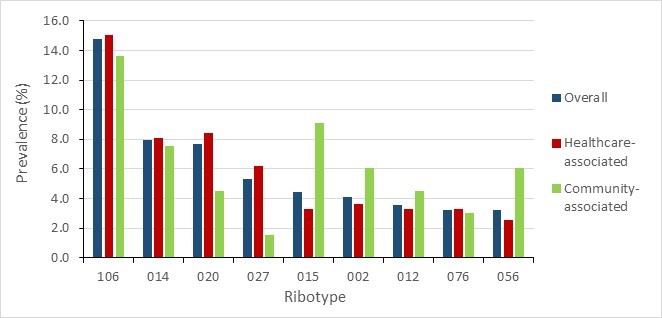
Figure 10 - Text description
| Ribotype | Overall | Healthcare-associated | Community-associated |
|---|---|---|---|
| 106 | 14.7% | 15.0% | 13.6% |
| 014 | 8.0% | 8.1% | 7.6% |
| 020 | 7.7% | 8.4% | 4.5% |
| 027 | 5.3% | 6.2% | 1.5% |
| 015 | 4.4% | 3.3% | 9.1% |
| 002 | 4.1% | 3.7% | 6.1% |
| 012 | 3.5% | 3.3% | 4.5% |
| 076 | 3.2% | 3.3% | 3.0% |
| 056 | 3.2% | 2.6% | 6.1% |
a Due to COVID-19, sample submissions are incomplete. Data presented are preliminary and caution should be exercised when making trend interpretations.
CDI antimicrobial susceptibility testing
Antimicrobial susceptibility testing was conducted for C. difficile isolates collected between 2016 and 2020.
HA-CDI resistance to clindamycin peaked at 47.5% in 2018 and decreased by 67.6% between 2019 and 2020. Except for a single resistant isolate reported in 2018, HA-CDI remained susceptible to metronidazole in the five-year period. No resistance to vancomycin was found for any HA-CDI isolates. Resistance to rifampin fluctuated between 0.9% and 2.5%, averaging 1.6% from 2016 to 1.1% in 2020. HA-CDI resistance to moxifloxacin decreased from 17.2% in 2016 to 6.2% in 2020.
The proportion of CA-CDI isolates resistant to clindamycin more than doubled between 2017 and 2018 (22.7% to 52.6%), followed by a 34.4% decrease between 2018 and 2020. Resistance to rifampin remained low and fluctuated between 0% and 1.6%. No resistance to vancomycin or metronidazole was found in CA-CDI isolates.
| Proportion of resistant isolates per year | 2016 | 2017 | 2018 | 2019 | 2020 |
|---|---|---|---|---|---|
| Isolates tested (n) | 494 | 526 | 474 | 440 | 273 |
| Clindamycin | 22.1% | 21.9% | 47.5% | 39.3% | 15.4% |
| Metronidazole | 0.0% | 0.0% | 0.2% | 0.0% | 0.0% |
| Moxifloxacin | 17.2% | 18.6% | 12.5% | 11.6% | 6.2% |
| Rifampin | 1.6% | 2.5% | 1.7% | 0.9% | 1.1% |
| Tigecycline | 0.0% | 0.0% | 0.0% | 0.0% | 0.0% |
| Vancomycin | 0.0% | 0.0% | 0.0% | 0.0% | 0.0% |
a Due to COVID-19, sample submissions for 2020 are incomplete. Data presented are preliminary and caution should be exercised when making trend interpretations. The included antimicrobials were part of the laboratory antibiogram panel which may include those not part of treatment guidelines. Therefore, some antimicrobials are presented for epidemiologic purposes only. |
|||||
| Proportion of resistant isolates per year | 2016 | 2017 | 2018 | 2019 | 2020 |
|---|---|---|---|---|---|
| Isolates tested (n) | 163 | 150 | 156 | 128 | 66 |
| Clindamycin | 22.1% | 22.7% | 52.6% | 37.5% | 18.2% |
| Metronidazole | 0.0% | 0.0% | 0.0% | 0.0% | 0.0% |
| Moxifloxacin | 11.0% | 10.7% | 7.1% | 11.7% | 7.6% |
| Rifampin | 0.6% | 0.7% | 1.3% | 1.6% | 0.0% |
| Tigecycline | 0.0% | 0.0% | 0.0% | 0.0% | 0.0% |
| Vancomycin | 0.0% | 0.0% | 0.0% | 0.0% | 0.0% |
a Due to COVID-19, sample submissions for 2020 are incomplete. Data presented are preliminary and caution should be exercised when making trend interpretations. The included antimicrobials were part of the laboratory antibiogram panel which may include those not part of treatment guidelines. Therefore, some antimicrobials are presented for epidemiologic purposes only. |
|||||
Neisseria gonorrhoeae infections
Neisseria gonorrhoeae (N. gonorrhoeae) is a strictly human pathogen that causes a sexually transmitted infection (STI) known as gonorrhea (GC) (38). GC commonly manifests with urethritis and cervicitis but can also present with rectal and pharyngeal infections. If left untreated, GC can lead to severe complications including pelvic inflammatory disease, ectopic pregnancy, infertility, epididymitis, and in rare cases, can enter sterile sites to become a disseminated gonococcal infection (39). The presence of GC can also increase the risk of HIV acquisition and transmission (40).
In Canada, GC has been nationally notifiable since 1924 and is the second most commonly reported bacterial STI with rates climbing for almost two decades (41) (42). Increasing resistance to antimicrobials has been documented in N. gonorrhoeae isolates, including the development of multi-drug resistance (MDR) and extensive drug resistance (XDR) (43) (44). Globally, and in Canada, N. gonorrhoeae isolates with decreased susceptibility to the extended-spectrum cephalosporins and increased resistance to azithromycin have been reported. The identification of XDR isolates has led the WHO to warn that GC could become untreatable due to resistance to all available classes of antimicrobials (39) (40).
Data presented were restricted to Neisseria gonorrhoeae isolates reported to the Gonococcal Antimicrobial Surveillance Program-Canada (GASP-Canada) from 2016 to 2020 for the antimicrobial resistance results and to the Canadian Notifiable Diseases Surveillance System (CNDSS) in 2016 to 2019 for the incidence data. Duplicate isolates were removed when calculating proportions of resistance.
Multidrug-resistant (MDR) Neisseria gonorrhoeae is defined as decreased susceptibility/resistance to one currently recommended therapy (cephalosporin or azithromycin) plus resistance to at least two other antimicrobials.
Extensively drug-resistant (XDR) gonococci is defined as decreased susceptibility/resistance to two currently recommended therapies (cephalosporin and azithromycin) plus resistance to at least two other antimicrobials.
Further methodological details can be found in the 2020 Canadian Antimicrobial Resistance Surveillance System (CARSS) Report (45).
Key findings
- The rate of reported GC infection increased by 43.9%, from 65.7 to 94.3 cases per 100,000 inhabitants between 2016 and 2019.
- Between 2016 and 2020, the proportion of cultured MDR N. gonorrhoeae isolates fluctuated between 6.3 and 12.4%, with the lowest value of 6.3% reported in 2020.
- Between 2016 and 2020, the proportion of cultured N. gonorrhoeae isolates resistant to azithromycin ranged from 6.1% to 11.7%, with a median of 7.6%.
- Eleven cases of XDR N. gonorrhoeae were identified in Canada between 2016 and 2020. Although these numbers remain low, further surveillance is warranted as these organisms have the potential to threaten the success of current GC treatment recommendations.
Results
Between 2016 and 2019, the rate of GC cases diagnosed in Canada increased by 43.5%, from 65.7 to 94.3 cases per 100,000 inhabitants. Rates of N. gonorrhoeae infection continue to be higher among males.
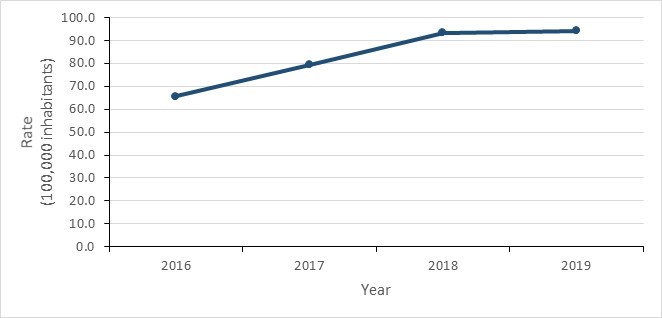
Figure 11 - Text description
| Year | 2016 | 2017 | 2018 | 2019 |
|---|---|---|---|---|
| Incidence rate | 65.65 | 79.42 | 93.47 | 94.28 |
The proportion of N. gonorrhoeae isolates with resistance to at least one antibiotic increased by 14.2% between 2016 and 2020; the most important increase was observed between 2019 and 2020 with a 16.0% rise, from 63.7% to 73.9%. However, the proportion of MDR isolates demonstrated marked variability (between 6.3% and 12.4%) in the five-year period with an overall decrease of 29.2%. Eleven cases of XDR N. gonorrhoeae were identified from 2016 to 2020, with the majority (63.6%, n=7) reported in 2018.
| Proportion of resistant isolates per year | 2016 N (%) |
2017 N (%) |
2018 N (%) |
2019 N (%) |
2020 N (%) |
|---|---|---|---|---|---|
| Isolates tested (n) | 4,538 | 5,290 | 5,607 | 4,859 | 3,130 |
| Multidrug resistant (MDR) | 406 (8.9%) | 645 (12.2%) | 446 (8.0%) | 601 (12.4%) | 198 (6.3%) |
| Extensively drug resistant (XDR) | 1 (0.02%) | 0 (0.00%) | 7 (0.12%) | 1 (0.02%) | 2 (0.06%) |
| Resistance to at least one antimicrobial | 2,936 (64.7%) | 3,316 (62.7%) | 3,369 (60.1%) | 3,097 (63.7%) | 2,312 (73.9%) |
| a Due to the Covid-19 pandemic, fewer isolates were tested in 2020. As such, caution should be used when making trend interpretations or year-to-year comparisons. | |||||
In 2020, for the third consecutive year, the highest proportion of resistance was to ciprofloxacin (56.5% in 2019). As a result, increases to the proportion of isolates resistant to azithromycin are associated with increasing proportions of MDR GC. A rapid decrease in MDR GC between 2019 and 2020 should be interpreted with caution as a result of COVID-19. While the absolute numbers are small, the proportion of isolates demonstrating decreased susceptibility to cefixime has increased from 0.3% (n=14) in 2016 to 2.8% (n=87) in 2020. In parallel, the proportion of isolates with decreased susceptibility to ceftriaxone also declined from 1.8% (n=80) in 2016 to 0.9% (n=29) in 2020.
| Proportion of (R) and (DS) isolates per year | 2016 | 2017 | 2018 | 2019 | 2020 |
|---|---|---|---|---|---|
| Isolates tested (n) | 4,538 | 5,290 | 5,607 | 4,859 | 3,130 |
| Azithromycin (R) | 7.2% | 11.6% | 7.6% | 11.7% | 6.1% |
| Cefixime (DS) | 0.3% | 0.6% | 0.5% | 1.5% | 2.8% |
| Ceftriaxone (DS) | 1.8% | 0.6% | 0.6% | 0.8% | 0.9% |
| Ciprofloxacin (R) | 47.1% | 50.1% | 57.3% | 57.0% | 56.5% |
| Erythromycin (R) | 31.7% | 57.0% | 56.0% | 37.7% | 32.6% |
| Penicillin (R) | 17.4% | 18.9% | 9.2% | 7.1% | 7.0% |
| Tetracycline (R) | 53.3% | 45.9% | 47.1% | 44.2% | 43.1% |
| The included antimicrobials were part of the laboratory antibiogram panel which may include those not part of treatment guidelines. Therefore, some antimicrobials are presented for epidemiologic purposes only. | |||||
Ceftriaxone-resistant Neisseria gonorrhoeae
To date, three cases of ceftriaxone-resistant Neisseria gonorrhoeae have been reported in Canada. The first case (a female) and the second case (a male) were reported in 2017 (46) and 2018 (47), and were both associated with international travel. The third case (a female) was reported in December 2021 and was not international travel-related (unpublished, National Microbiology Laboratory).
Prescriber adherence to PHAC’s recommended gonorrhea treatment regimens2 among ESAG3 cases: 2015 to 2020
Established in 2013, the Enhanced Surveillance of Antimicrobial-resistant Gonorrhea system (ESAG) links epidemiological, clinical, and laboratory data on N. gonorrhoeae cases in Canada. ESAG’s goal is to better understand the current trends of AMR N. gonorrhoeae and support the development of gonorrhea treatment guidelines and public health interventions to minimize the spread of AMR-GC. Currently, there are four provinces and territories providing data to ESAG (Alberta, Manitoba, Northwest Territories, and Nova Scotia) with recruitment of additional provinces and territories underway.
When comparing gonorrhea treatments and doses prescribed for ESAG cases to PHAC’s recommended gonorrhea treatment regimens for the years 2015 to 2020, the mean annual proportion of ESAG cases prescribed "preferred" or "alternative" gonorrhea treatment for anogenital and pharyngeal infections among gay, bisexual and other men who have sex with men (gbMSM), was 94.2% (range: 89.1% to 97.7%) and 92.9% (range: 88.9% to 95.8%), respectively. Among "other adults" (non-gbMSM males, females, transgender) with anogenital and pharyngeal infections, the mean annual proportion who were prescribed the "preferred" or "alternative" treatment regimens was 93.6% (range: 91.1% to 96.1%) and 88.4% (range: 76.8% to 96.8%), respectively.
Drug-resistant Mycobacterium tuberculosis infections
Tuberculosis (TB) is an infection caused by the intracellular bacteria Mycobacterium tuberculosis (MTB) (49). MTB is spread person-to-person by aerosolized droplets and not by surface contact. MTB most commonly infects the lung, but can also cause extrapulmonary infections such as lymphadenitis, meningitis and osteomyelitis (50) (51).
Globally, despite progress made to address the main drivers of TB (such as undernutrition, smoking, indoor air pollution, diabetes and poverty), infections with this organism remain prevalent and are the top cause of death from a single pathogen across the globe, except the year 2020 in which it was COVID-19 (52). In the year 2019 alone, approximately 10 million active TB cases were reported by the WHO, with 1.4 million people dying in the same year (52). In Canada, the incidence of active TB remains low and relatively stable, with rates fluctuating between 4.6 and 5.1 per 100,000 inhabitants between 2010 and 2020 (53).
First-line treatment for TB consists of combination therapies that include antibiotics such as isoniazid, rifampin, pyrazinamide and ethambutol (54). However, MTB strains have developed antimicrobial resistance including multidrug resistance and even extensive drug resistance. In Canada, the proportion of mono-resistance in MTB isolates recovered from active TB cases fluctuated between 6.6% and 9.1% between 2010 and 2020 (53).
Data presented on MTB resistance for first-line and second line anti-TB drugs by all Canadian jurisdictions were provided by the Canadian Tuberculosis Laboratory Surveillance System (CTBLSS). Isolates from reported culture-positive TB cases were tested for susceptibility. Results from positive cultures of M. tuberculosis complex (M. tuberculosis, M. africanum, M. canetti, M. caprae, M. microti, M. pinnipedii or M. bovis) were included in the analyses. M. bovis Bacillus Calmette-Guérin (BCG) isolates were excluded since they represent a non-infectious complication of TB vaccination often found in immune-compromised patients. Types of drug resistance were tabulated and a five-year trend assessed.
- Mono-resistance (i.e., resistance to only one first-line anti-TB drug);
- Poly-resistance (i.e., resistance to more than one anti-TB drug, other than both isoniazid and rifampin);
- Multi-drug resistance (MDR) (i.e., resistance to at least both isoniazid and rifampin);
- Extensive drug resistance (XDR) (i.e., resistance to any fluoroquinolone, such as ciprofloxacin and moxifloxacin), and at least one of three second-line injectable drugs (capreomycin, kanamycin and amikacin), in addition to multi-drug resistance.
Key findings
- Between 2016 and 2020, the incidence rate of TB infection remained relatively stable between 4.7 and 5.1 cases per 100,000 population.
- TB resistance also remained relatively stable, with MDR fluctuating between 0.9% and 1.5% and only 1 XDR TB isolate reported in the five-year period.
- In 2020, of the 1,538 MTB isolates tested, resistance proportions were: mono-resistant 8.3% (n=128), poly-resistant 0.5% (n=7); and multi-drug resistant 0.9% (n=14).
- Between 2016 and 2020, a single case of XDR TB was reported (in 2018).
Results
In 2020, 1,563 incident cases of TB were reported in Canada. Of these, 98.4% (n=1,538) of isolates were from the MTB complex, with Mycobacterium bovis (BCG) accounting for the remaining 1.6% (n=25). Resistance to at least one anti-TB drug was detected in 9.7% (n=149) of culture-positive MTB complex isolates, which was almost entirely related to mono-resistance (85.9%, n=128). Of these isolates, 79.7% (n=102) were resistant to isoniazid, 16.4% (n=21) were resistant to pyrazinamide, and 3.9% (n=5) were resistant to rifampin. In 2020, 9.4% (n=14) and 4.7% (n=7) of resistant MTB complex isolates were multi-drug resistant and poly-resistant respectively, and no MTB complex isolates were XDR-TB.
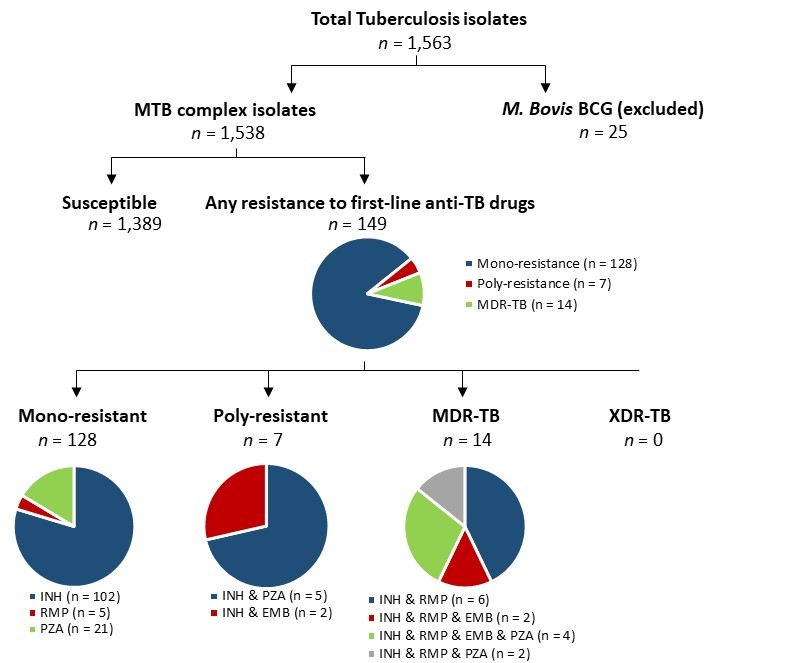
Figure 12 - Text description
Pie charts for tuberculosis isolates tested for anti-tuberculosis drug resistance in Canada, in 2020. A total of 1,563 isolates were tested. 25 of those were M.Bovis Bacillus Calmette-Guérin (BCG) isolates; the remaining 1,538 were Mycobacterium tuberculosis (MTB) complex isolates. Of the 1,538 Mycobacterium tuberculosis complex isolates, 1,389 of them were susceptible, while the remaining 149 were resistant to first-line anti-tuberculosis drugs. Of the 143 resistant isolates, 128 were mono-resistant, 7 were poly-resistant, and 14 were multidrug-resistant. Of the 128 mono-resistant isolates, 102 were resistant to isoniazid (INH), 5 were resistant to rifampin (RMP), and 21 were resistant to pyrazinamide (PZA). Of the 14 multidrug-resistant isolates, 6 were resistant to isoniazid and rifampin; 2 were resistant to isoniazid, rifampin and ethambutol (EMB); 4 were resistant to isoniazid, rifampin, ethambutol, and pyrazinamide; and 2 were resistant to isoniazid, rifampin, and pyrazinamide. Of the 7 poly-resistant isolates, 2 were resistant to isoniazid and pyrazinamide and 2 were resistant to isoniazid and ethambutol. No isolates were extensively drug-resistant.
Abbreviations: MTB (Mycobacterium Tuberculosis); BCG (Mycobacterium bovis); MDR (Multi-drug resistant); XDR (Extensively drug-resistant); INH (Isoniazid); RMP (Rifampin); PZA (Pyrazinamide); EMB (Ethambutol).
Between 2016 and 2020, there was minimal difference in the prevalence of drug resistant TB isolates for each type of resistance. Resistance to isoniazid was the most common form of mono-resistance, detected in 6.4% (n=485) of confirmed TB cases. This was followed by resistance to pyrazinamide in 1.3% of cases (n=102). There was little change in this distribution of resistance patterns over the five year-period of 2016 to 2020.
| Proportion of resistant isolates per year | 2016 | 2017 | 2018 | 2019 | 2020 |
|---|---|---|---|---|---|
| Number of isolates (n) | 1,451 | 1,522 | 1,465 | 1,630 | 1,538 |
| Mono-resistant | 7.4% | 6.6% | 8.3% | 9.0% | 8.3% |
| Poly-resistant | 0.3% | 0.4% | 0.3% | 0.3% | 0.5% |
| Multidrug-resistant | 1.2% | 0.9% | 1.5% | 1.2% | 0.9% |
| Extensively drug-resistant | 0.0% | 0.0% | 0.1% | 0.0% | 0.0% |
| Resistance to at least one antimicrobial | 9.0% | 8.0% | 10.2% | 10.5% | 9.7% |
Only one isolate exhibited extensive drug-resistance during this period (in 2018). The annual prevalence of MDR varied between 0.9% and 1.5% between 2016 and 2020.
While there was minimal difference in rates of resistance between age groups in 2020, MTB complex strains isolated in older individuals (>65 years) were relatively less resistant to anti-TB drugs than those isolated from younger age groups. Age-specific rates of resistance were similar among strains recovered from younger age groups (0.6 cases/100,000 in those ages 25-34, compared to 0.3 cases/100,000 in those aged 65-74).
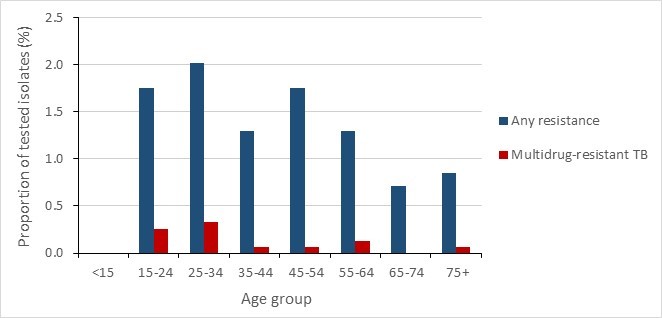
Figure 13 - Text description
| Age Group | Any resistance | Multidrug-resistant TB |
|---|---|---|
| <15 | 0.0% | 0.0% |
| 15-24 | 1.8% | 0.3% |
| 25-34 | 2.0% | 0.3% |
| 35-44 | 1.3% | 0.1% |
| 45-54 | 1.8% | 0.1% |
| 55-64 | 1.3% | 0.1% |
| 65-74 | 0.7% | 0.0% |
| 75+ | 0.8% | 0.1% |
Stratification by sex showed similar resistance proportions among isolates recovered from females (9.5%-10.5%) and males (6.8%-10.5%).
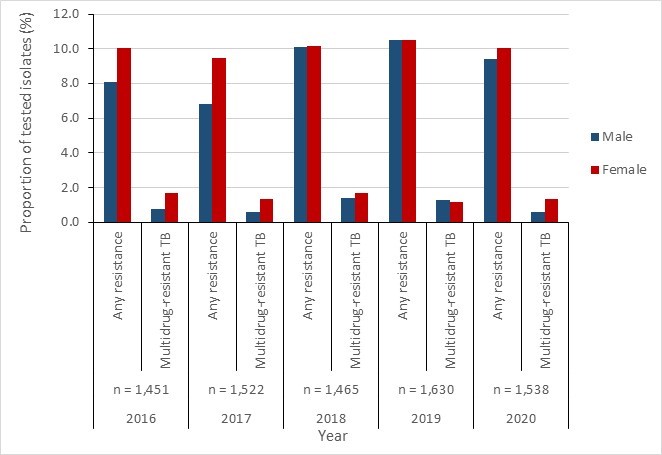
Figure 14 - Text description
| Any resistance | 2016 | 2017 | 2018 | 2019 | 2020 |
|---|---|---|---|---|---|
| Male | 8.1% | 6.8% | 10.1% | 10.5% | 9.4% |
| Female | 10.0% | 9.5% | 10.1% | 10.5% | 10.0% |
| Multidrug-resistant | 2016 | 2017 | 2018 | 2019 | 2020 |
| Male | 0.8% | 0.6% | 1.4% | 1.3% | 0.6% |
| Female | 1.7% | 1.4% | 1.7% | 1.1% | 1.3% |
Invasive Streptococcus pneumoniae infections
Streptococcus pneumoniae (pneumococci) are Gram-positive bacteria that can cause a range of invasive diseases. Invasive pneumococcal disease (IPD) can include pneumonia, sepsis and even meningitis. IPD can be acquired in the community or healthcare sector and is associated with significant mortality (approximately 2 million annual deaths globally) and/or serious long-term health sequelae (55). S. pneumoniae is found in the nasopharynx and is transmitted through respiratory droplets. The prevalence of asymptomatic colonization is estimated at 5-10% in adults (56), with a peak reported in children (55). The organism spreads through direct or indirect contact between individuals and can cause outbreaks in crowded environments. While IPD can be prevented through immunization with the PCV13 vaccine in target age groups, 26% of IPD cases in Canada were caused by vaccine preventable PCV13 serotypes in 2014 (57). IPD treatment options include penicillins (e.g., amoxicillin-clavulanate), second-generation cephalosporins, fluoroquinolones and macrolides (58). Resistance to each of these agents has been reported, including the emergence of multi-drug resistant strains with the potential to increase the risk of treatment failure in select populations (59) (60).
Data presented were restricted to invasive S. pneumoniae isolates reported by the National Microbiology Laboratory’s (NML) Surveillance of Invasive Streptococcal Disease (eSTREP) and the Canadian Notifiable Disease Surveillance Systems (CNDSS). These data are based on testing results of invasive S. pneumoniae isolates provided by all Canadian provincial and territorial jurisdictions to the NML.
The Clinical and Laboratory Standards Institute (CLSI) breakpoints were used for all isolates (CLSI M100). Ceftriaxone and penicillin were interpreted using the CLSI parenteral meningitis breakpoints. Susceptibilities to penicillin and ceftriaxone were determined using CLSI meningitis breakpoints and the susceptibility to cefuroxime was based on parental breakpoint. Standardized interpretive breakpoints were applied to all the other antimicrobial susceptibility analyses. Analysis includes stratifications by vaccine preventable (PCV13) and non-vaccine preventable (non-PCV13) serotypes, but not source of acquisition (i.e., healthcare-associated or community-associated). Some of the data may be incomplete as some jurisdictions submit subsets of isolates. In addition, data for the year 2020 may have been impacted by the emergence of the COVID-19 pandemic. Detailed methodology has been recently published (45) (61).
Key findings
- Between 2015 and 2019, the rate of IPD increased by 11.0%, from 9.0 to 10.1 cases per 100,000 population.
- Between 2016 and 2020, the proportion of multidrug resistance increased from 8.4% to 12.3% and from 2.8% to 8.0% in PCV134 and non-PCV13 serotypes, respectively.
- While overall numbers remain low (n=11), the proportion of resistance in IPD isolates from those aged one year or less increased by 24.6% between 2016 and 2020 (from 3.2% to 27.8%).
Results
Incidence results
Between 2015 and 2019, the rate of IPD increased by 11.0%, from 9.0 to 10.1 cases per 100,000 population between 2015 and 2019, underlying the need for improved vaccine uptake as part of the solutions to mitigate the epidemiologic burden of IPD on vulnerable groups, such as children.
The annual number of invasive S. pneumoniae isolates received by the National Microbiology Laboratory (NML) between 2016 and 2020 varied between 2,108 and 3,673, of which one-third (30.2% to 34.9% of isolates each year) were PCV13 isolates and two-thirds were non-PCV13 isolates.
In 2020, antimicrobial susceptibilities were available from 48.5% (n=1,022/2,108) of collected isolates.
Resistance results
Between 2016 and 2020, proportion of resistance of S. pneumoniae isolates increased for several antimicrobials, including doxycycline (2.9% increase) and trimethoprim/sulfamethoxazole (2.3% increase). Clarithromycin demonstrated the highest resistance levels between 21.5% and 25.9%, followed by penicillin with proportions fluctuating between 9.9% and 15.0%. Clindamycin resistance initially increased from 4.2% to 7.9% between 2016 and 2017 but decreased slightly thereafter to 7.0% in 2020.
Resistance to ceftriaxone remained low and stable (0.2% to 0.7%) from 2016 to 2020. Resistance to carbapenem antimicrobials remained low, though slight increases in resistance to imipenem (0.3% to 1.2%) and meropenem (0.7% to 2.0%) were noted from 2016 to 2020. All S. pneumoniae isolates were susceptible to linezolid and vancomycin.
Multidrug resistance increased for all age groups between 2016 and 2020. Resistance proportions increased the most in those aged less than one year (from 3.2% to 27.8%). In other age groups resistance proportions increased from 3.2% to 5.6% in those aged one to four, from 4.7% to 7.6% for those between five to 39 years of age, from 3.8% to 11.5% for those aged 40 to 59 years old and from 4.3% to 7.8% in those aged 60 years or more. These increases underline the importance of high and sustained vaccine coverage among eligible groups.
In 2020, the highest proportions of multidrug resistance were identified in serotypes 15A (non-PCV13), 19A (PCV13), 19F (PCV13) and 12F (non-PCV13), at 66.7% (n=18), 34.3% (n=12), 27.3% (n =6) and 25.9% (n=14), respectively.
| Proportion of resistant isolates per year | 2016 | 2017 | 2018 | 2019 | 2020 |
|---|---|---|---|---|---|
| Isolates tested (n) | 1,114 | 1,130 | 1,784 | 1,815 | 1,022 |
| Amoxicillin/Clavulanic Acid | 0.1% | 0.4% | 1.2% | 0.4% | 1.4% |
| Ceftriaxone | 0.4% | 0.7% | 0.7% | 0.2% | 0.4% |
| Chloramphenicol | 1.2% | 2.0% | 5.6% | 3.1% | 4.1% |
| Clarithromycin | 21.5% | 25.8% | 25.9% | 25.0% | 23.0% |
| Clindamycin | 4.2% | 7.9% | 6.8% | 7.3% | 7.0% |
| Doxycycline | 8.5% | 10.7% | 8.5% | 10.5% | 11.4% |
| Imipenem | 0.3% | 1.4% | 1.4% | 0.2% | 1.2% |
| Levofloxacin | 0.3% | 0.4% | 0.3% | 0.6% | 0.1% |
| Meropenem | 0.7% | 1.6% | 2.0% | 0.9% | 2.0% |
| Penicillin | 12.2% | 15.0% | 11.2% | 10.7% | 9.9% |
| Trimethoprim/Sulfamethoxazole | 8.8% | 10.6% | 7.7% | 9.5% | 11.1% |
| The included antimicrobials were part of the laboratory antibiogram panel which may include those not part of treatment guidelines. Therefore, some antimicrobials are presented for epidemiologic purposes only. | |||||
Antimicrobial resistance in PCV13 S. pneumoniae serotypes
- Among PCV13 serotypes, resistance proportions to clarithromycin and doxycycline were highest, ranging from 16.5% to 24.1% and 13.9% to 17.6%, respectively.
- Penicillin resistance proportions in PCV13 serotypes rose 23.4% between 2016 and 2017 before decreasing nearly 58% from 2017 to 2020. Amoxicillin/clavulanic acid resistance proportions fluctuated between 0.4% and 3.7% between 2016 and 2020. Ceftriaxone resistance remained low, increasing six-fold between 2016 and 2017 (from 0.4% to 2.4%) before continuing to decrease.
- Overall, PCV13 serotypes remained relatively susceptible to imipenem and meropenem, with low resistance proportions between 2016 and 2020 (0.7% and 4.4%).
- By resistance category, between 2016 and 2020:
- the proportion of PCV13 serotypes with resistance to one class of antimicrobials showed a marked downward trend (57.1% decrease), from 14.7% to 6.3%;
- resistance to two antimicrobial classes, after initially increasing from 5.3% to 8.5% from 2016 and 2017, decreased 58.7% between 2017 and 2020; and
- conversely, multidrug resistance (resistance to three or more antimicrobial classes) was relatively stable from 2016 to 2019, rising slightly in 2020.
| Proportion of resistant isolates per year | 2016 | 2017 | 2018 | 2019 | 2020 |
|---|---|---|---|---|---|
| Isolates tested (n) | 285 | 295 | 519 | 503 | 350 |
| Amoxicillin/Clavulanic Acid | 0.4% | 1.4% | 3.7% | 1.4% | 3.4% |
| Ceftriaxone | 0.4% | 2.4% | 1.7% | 0.8% | 1.0% |
| Chloramphenicol | 2.8% | 5.4% | 7.9% | 6.6% | 7.1% |
| Clarithromycin | 21.1% | 24.1% | 22.5% | 16.5% | 18.6% |
| Clindamycin | 7.0% | 12.9% | 11.0% | 8.5% | 10.9% |
| Doxycycline | 14.7% | 17.6% | 13.9% | 14.3% | 14.6% |
| Imipenem | 0.7% | 4.4% | 4.0% | 0.8% | 3.1% |
| Levofloxacin | 0.4% | 1.0% | 0.8% | 0.0% | 0.0% |
| Meropenem | 1.4% | 2.7% | 4.4% | 1.8% | 3.7% |
| Penicillin | 13.7% | 16.9% | 10.6% | 7.8% | 7.1% |
| Trimethoprim/Sulfamethoxazole | 8.4% | 12.5% | 7.9% | 5.6% | 7.4% |
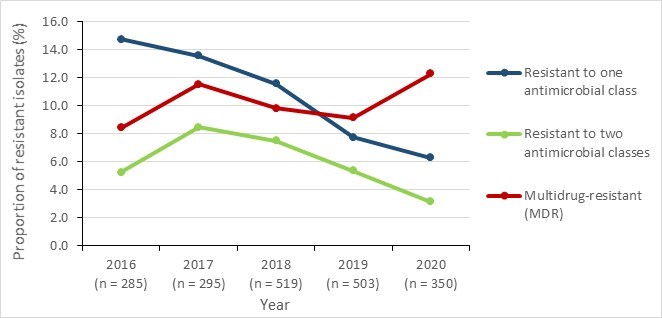
Figure 15 - Text description
| Year | 2016 | 2017 | 2018 | 2019 | 2020 |
|---|---|---|---|---|---|
| Resistant to one antimicrobial class | 14.7% | 13.6% | 11.6% | 7.8% | 6.3% |
| Resistant to two antimicrobial classes | 5.3% | 8.5% | 7.5% | 5.4% | 3.1% |
| Multidrug-resistant (MDR) | 8.4% | 11.5% | 9.8% | 9.1% | 12.3% |
Antimicrobial resistance in non-PCV13 S. pneumoniae serotypes
- Among non-PCV13 serotypes, resistance proportions to clarithromycin and penicillin were highest, ranging from 21.7% to 28.2% and 11.3% to 14.3%, respectively.
- Proportions of resistance to amoxicillin/clavulanic acid remained low (from undetected in 2016 to 0.3% in 2020).
- Resistance to ceftriaxone, imipenem and meropenem remained stable.
- By resistance category, between 2016 and 2020:
- the proportion of multidrug resistance in non-PCV13 serotypes increased 185.7%, from 2.8 to 8.0%;
- resistance to two antimicrobial classes remained stable in the five-year period; and
- after peaking in 2018 at 24.6%, resistance to one antimicrobial class decreased afterwards, reaching 16.5% in 2020 (32.9% decrease).
| Proportion of resistant isolates per year | 2016 | 2017 | 2018 | 2019 | 2020 |
|---|---|---|---|---|---|
| Isolates tested (n) | 829 | 835 | 1,265 | 1,312 | 672 |
| Amoxicillin/Clavulanic Acid | 0.0% | 0.1% | 0.2% | 0.0% | 0.3% |
| Ceftriaxone | 0.4% | 0.1% | 0.3% | 0.0% | 0.1% |
| Chloramphenicol | 0.6% | 0.8% | 4.7% | 1.8% | 2.5% |
| Clarithromycin | 21.7% | 26.3% | 27.3% | 28.2% | 25.3% |
| Clindamycin | 3.3% | 6.1% | 5.1% | 6.9% | 5.1% |
| Doxycycline | 6.4% | 8.3% | 6.2% | 9.1% | 9.8% |
| Imipenem | 0.2% | 0.2% | 0.3% | 0.0% | 0.1% |
| Levofloxacin | 0.2% | 0.2% | 0.1% | 0.8% | 0.1% |
| Meropenem | 0.5% | 1.2% | 1.0% | 0.6% | 1.0% |
| Penicillin | 11.7% | 14.3% | 11.4% | 11.8% | 11.3% |
| Trimethoprim/Sulfamethoxazole | 8.9% | 9.9% | 7.6% | 11.0% | 12.9% |

Figure 16 - Text description
| Year | 2016 | 2017 | 2018 | 2019 | 2020 |
|---|---|---|---|---|---|
| Resistant to one antimicrobial class | 18.1% | 19.6% | 24.6% | 20.1% | 16.5% |
| Resistant to two antimicrobial classes | 7.6% | 7.3% | 5.7% | 7.8% | 7.3% |
| Multidrug-resistant (MDR) | 2.8% | 6.1% | 5.0% | 7.0% | 8.0% |
Invasive Streptococcus pyogenes (group A Streptococcus) infections
Streptococcus pyogenes, also known as Group A Streptococcus (GAS) are Gram-positive bacteria that are specific to humans and able to colonize the skin and throat (62). GAS spreads through respiratory droplets, direct contact with skin lesions as well as via contaminated surfaces and equipment. Globally, this pathogen is estimated to infect 18.1 million people annually, resulting in a half a million deaths each year (63). In Canada, the incidence rate of invasive GAS (iGAS) disease increased from 4.1 to 6.7 cases per 100,000 population between 2010 and 2017 (a 63% rise), prompting the Public Health Agency of Canada to enhance its existing surveillance of iGAS in 2017 (64). Common presentations of GAS infections include pharyngitis, impetigo, and scarlet fever as well as more serious, potentially life-threatening invasive infections including streptococcal septic shock syndrome, necrotizing fasciitis, and meningitis. GAS infections can also be associated with immune-mediated post-infectious complications such as glomerulonephritis and rheumatic fever (65) (66).
Infections with iGAS are typically treated with penicillin-based antibiotics and cephalosporins or macrolides for patients with an allergy to penicillins (67). Although GAS remains largely susceptible to penicillins and cephalosporins, increasing resistance to macrolides has been reported (68).
Key findings
- Between 2015 and 2019, the incidence rate of invasive Streptococcus pyogenes increased by 52.8%, from 5.3 to 8.1 cases per 100,000 population, driven by a 62.3% rise between 2015 and 2018.
- Of all the antimicrobials tested between 2016 and 2020, erythromycin resistance was the highest with levels between 8.5% and 11.5% in the five-year period.
- From 2016 to 2020 Streptococcus pyogenes remained susceptible to penicillin and vancomycin.
Results
Between 2015 and 2019, aggregate data from all thirteen Canadian provinces/territories showed a 52.8% increase in the incidence rate of invasive Streptococcus pyogenes (group A Streptococcus –iGAS), shifting from 5.3 to 8.1 cases per 100,000 inhabitants. This was driven by a 62.3% increase between 2015 and 2018 (from 5.3 to 8.6 cases per 100,000 inhabitants), followed by a slight decrease of 5.8% in 2019 (8.6 to 8.1 cases per 100,000 inhabitants).

Figure 17 - Text description
| Year | 2015 | 2016 | 2017 | 2018 | 2019 |
|---|---|---|---|---|---|
| Incidence rates | 5.3 | 6.0 | 6.8 | 8.6 | 8.1 |
| iGAS isolates (n) | 1,894 | 2,168 | 2,492 | 3,187 | 3,054 |
Between 2016 and 2020, among the isolates tested for resistance, the highest proportions of antimicrobial resistance were observed for erythromycin. Although constitutive resistance to clindamycin increased initially from 4.0% to 6.8% between 2016 and 2017, a sharp decrease followed in 2018 (to 3.4%) and has remained stable.
Invasive Streptococcus pyogenes isolates remained susceptible to penicillin and vancomycin, with no resistant isolates identified during the five-year period.
Proportion of resistant isolates per year |
2016 |
2017 |
2018 |
2019 |
2020 |
|---|---|---|---|---|---|
Isolates tested (n) |
1,771 |
2,055 |
2,764 |
2,773 |
2,375 |
Clindamycina |
4.0% |
6.8% |
3.4% |
3.0% |
3.2% |
Erythromycin |
8.8% |
10.0% |
9.6% |
8.5% |
11.5% |
Penicillin |
0.0% |
0.0% |
0.0% |
0.0% |
0.0% |
Vancomycin |
0.0% |
0.0% |
0.0% |
0.0% |
0.0% |
a Constitutive resistance The included antimicrobials were part of the laboratory antibiogram panel which may include those not part of treatment guidelines. Therefore, some antimicrobials are presented for epidemiologic purposes only. |
|||||
Typhoidal and non-typhoidal Salmonella enterica
Salmonella enterica is a bacteria that causes gastroenteritis and enteric (typhoid) fever. Gastroenteritis or "food poisoning" may cause sudden nausea, vomiting, diarrhea and fever. Enteric or typhoid fever causes high fever, abdominal pain and headache. Infection generally occurs from the consumption of contaminated food, contact with infected feces or contaminated animals, animal feed or humans. This bacteria has developed resistance to multiple antibiotics including ampicillin, chloramphenicol, streptomycin, sulfonamide, tetracycline, fluoroquinolone and extended-spectrum cephalosporins (69) (70).
Key findings
- Since 2016, the frequency of resistance to several important antimicrobials has risen in Salmonella isolates recovered from human infection.
- Between 2016 and 2019, the frequency of typhoidal Salmonella resistant to ceftriaxone increased from less than 0.5% to 4.5%.
- Between 2016 and 2019, the frequency of non-typhoidal Salmonella resistant to azithromycin increased from less than 0.5% to 2.3%.
- The frequency of non-typhoidal Salmonella resistant to ciprofloxacin remained stable at 2.2% in 2018 and 2019.
- In 2019, 12.0% of typhoidal Salmonella and 16.6% of non-typhoidal Salmonella were resistant to three or more classes of antimicrobials.
Antibiogram results: Salmonella enterica serovars Typhi & Paratyphi (Typhoidal)
The number of typhoidal Salmonella enterica isolates submitted for laboratory testing increased from 162 to 308 between 2016 and 2019. In 2019, 77.6% (n=239) of submitted typhoidal Salmonella enterica serovars were Typhi, 21.1%, (n=65) were Paratyphi A, and 1.3% were Paratyphi B (n= 4). The majority were cultured from blood (80.5%, n=248). Of the isolates submitted, the majority were from Ontario (50.7%, n=156), British Columbia (19.8%, n=61) and Alberta (14.0%, n=43).
The relative frequencies of resistance among submitted typhoidal Salmonella enterica isolates generally remained stable in 2019, with the exception of increasing resistance to ceftriaxone. Since 2017, resistance to ceftriaxone has increased from 0.4% (n=1) to 2.9% (n=8) in 2018 and then to 4.5% (n=14) in 2019. In 2019, 88.0% (n=271) of isolates were resistant to nalidixic acid and 20.1% (n=62) were resistant to ciprofloxacin. No resistance to azithromycin or meropenem was identified. In 2019, 10.7% (n=33) of typhoidal Salmonella enterica isolates were susceptible to all antimicrobials tested; 12.0% (n=37) were resistant to three or more classes of antimicrobials. Of the seven tested classes of antimicrobials, no typhoidal Salmonella enterica isolates were resistant to six or seven classes.
| Proportion of resistant isolates | 2016 | 2017 | 2018 | 2019 |
|---|---|---|---|---|
| Isolates tested (n) | 162 | 235 | 278 | 308 |
| Ampicillin | 16.7% | 9.8% | 11.2% | 11.7% |
| Azithromycin | 0.0% | 0.4% | 0.0% | 0.0% |
| Ceftriaxone | 0.0% | 0.4% | 2.9% | 4.5% |
| Chloramphenicol | 17.9% | 8.1% | 10.8% | 9.7% |
| Ciprofloxacin | 14.2% | 22.1% | 18.3% | 20.1% |
| Gentamicin | 0.0% | 0.0% | 0.4% | 0.0% |
| Meropenem | 0.0% | 0.0% | 0.0% | 0.0% |
| Nalidixic Acid | 84.0% | 87.2% | 87.8% | 88.0% |
| Streptomycin | 22.8% | 16.2% | 18.7% | 14.3% |
| Tetracycline | 2.5% | 3.4% | 1.4% | 1.9% |
| Trimethoprim-sulfamethoxazole | 18.5% | 8.9% | 10.4% | 10.4% |
Non-typhoidal Salmonella enterica
The number of non-typhoidal Salmonella enterica isolates submitted for laboratory testing decreased from 2,371 to 1,800 between 2016 and 2019. In 2019, 47.8% (n=860) of submitted non-typhoidal Salmonella enterica serovars were Enteritidis, 16.6% (n=298) were Typhimurium, and 10.2% (n=184) were Newport. The majority were recovered from stool samples (81.4%, n=1,465), followed by blood (7.6%, n=136), and urine (6.0%, n=108).
The relative frequencies of resistance among submitted non-typhoidal Salmonella enterica isolates generally remained stable in 2019 but with some exceptions. In 2019, resistance to nalidixic acid increased to 21.8% (n=392/1800) however, resistance to ciprofloxacin, has only slightly increased from 1.7% (n=40) in 2016 to 2.2% (n=48) in 2018 and in 2019 (2.2%; n=40). Since 2016, resistance to azithromycin has increased from 0.4% (n=10) to 2.3% (n=42) in 2019. No resistance to meropenem was observed during the four-year period. In 2019, 60.3% (n=1,086) of non-typhoidal Salmonella enterica isolates were susceptible to all antimicrobials tested and 16.6% (n=298) were resistant to three or more classes of antimicrobials.
| Proportion of resistant isolates | 2016 | 2017 | 2018 | 2019 |
|---|---|---|---|---|
| Isolates tested (n) | 2,371 | 2,057 | 2,190 | 1,800 |
| Ampicillin | 13.1% | 13.4% | 13.4% | 15.8% |
| Azithromycin | 0.4% | 0.8% | 1.5% | 2.3% |
| Ceftriaxone | 4.0% | 3.5% | 2.8% | 3.5% |
| Chloramphenicol | 4.7% | 7.4% | 7.8% | 9.8% |
| Ciprofloxacin | 1.7% | 1.8% | 2.2% | 2.2% |
| Gentamicin | 2.5% | 1.8% | 2.4% | 2.9% |
| Meropenem | 0.0% | 0.0% | 0.0% | 0.0% |
| Nalidixic Acid | 16.2% | 19.1% | 15.2% | 21.8% |
| Streptomycin | 13.4% | 18.3% | 14.7% | 17.2% |
| Tetracycline | 12.6% | 13.8% | 16.2% | 18.2% |
| Trimethoprim-sulfamethoxazole | 3.0% | 3.3% | 4.6% | 5.5% |
Antimicrobial susceptibility results from urine and blood samples, Canadian Antimicrobial Resistance Network (AMRNet)
The Antimicrobial Resistance Network (AMRNet) is a laboratory-based antimicrobial resistance (AMR) surveillance system under development at the Public Health Agency of Canada’s National Microbiology Laboratory. AMRNet captures information on antimicrobial susceptibility testing from public and private clinical and veterinary laboratories, as well as existing PHAC AMR surveillance systems. AMRNet employs an integrated "One Health" approach that allows for a multi-dimensional assessment of AMR in both human and animal health. The organisms featured are some of the most common pathogens causing infections with high incidence.
Escherichia coli (E. coli)
E. coli are Gram-negative bacteria and a member of the Enterobacterales order. It is commensal within the gastrointestinal tract of humans and animals. Environmentally-associated strains can be found in wastewater and sediments (72).
Pathogenic strains of E. coli can cause diarrheal diseases, urinary tract infections and intra-abdominal sepsis. Toxin-producing strains can lead to severe conditions in humans including hemorrhagic colitis and hemolytic-uremic syndrome (73). Highly pathogenic strains can cause severe bloodstream infections and meningitis in neonates (74).
Treatment options for E. coli, guided by antimicrobial susceptibility testing results, include quinolones, trimethoprim-salfamethoxazole, aminoglycosides, cephalosporins, and carbapenems (75). Rising rates of resistance to many of these agents can complicate treatment for E. coli infections (76) (77).
Klebsiella pneumoniae (K. pneumoniae)
K. pneumoniae are Gram-negative facultative anaerobic bacteria from the Enterobacterales order. In humans, K. pneumoniae can colonize the gastrointestinal tract and mucosal surfaces, and it can also be found on medical devices and surface waters (78).
K. pneumoniae can cause pneumonia, urinary tract infections, liver abscesses, meningitis and necrotizing fasciitis (79). Carbapenemase-producing K. pneumoniae can hydrolyze cephalosporins, monobactams, penicillins and carbapenems, thus making the microorganism resistant to multiple antimicrobial classes.
Treatment of K. pneumoniae infections include aminoglycosides, cephalosporins, fluoroquinolones and carbapenems, and has recently included polymyxins (colistin) and tigecycline as last line treatments for resistant infections (80).
Staphylococcus aureus (S. aureus)
S. aureus are Gram-positive bacteria that are frequently found within the skin, nasal and throat microbiota (81). This pathogen can cause infections in any organ system and is one of the most frequent causes of nosocomial infections (82); causing skin and soft tissue infections, ventilator-associated pneumonia, bloodstream infections and toxic shock syndrome (83) (84).
Beta-lactam antibiotics such as cloxacillin or first generation cephalosporins are the most common first line therapies for S. aureus infections. Methicillin-resistant S. aureus (MRSA) are strains that are highly resistant to beta-lactams and require treatment with other agents such as vancomycin, daptomycin, linezolid or tigecycline (85).
Streptococcus pneumoniae (S. pneumoniae)
S. pneumoniae are Gram-positive bacteria that are commensal to the nasopharynx but can also cause invasive infections such as pneumonia, sepsis and meningitis (55).
The treatment of invasive S. pneumoniae infection include penicillins, cephalosporins, fluoroquinolones and macrolides (86). Resistance to penicillin, and to a lesser extent, other antimicrobial agents, has emerged in S. pneumonia isolates, potentially limiting their utility as therapeutics for infections cause by this organism.
Key findings
- E. coli showed very low non-susceptibility to ertapenem (0.5%) in urine samples.
- Overall, K. pneumoniae isolated from blood samples had low non-susceptibility to the selected antimicrobials.
- 16.1% of S. aureus isolated from blood were MRSA.
- Non-susceptibility to clindamycin was 34.6%. All S. aureus blood isolates were susceptible to vancomycin.
- S. pneumoniae remained susceptible to moxifloxacin and vancomycin and showed very low non-susceptibility to the other antimicrobials (<2%), except for penicillin (6.6%).
Results
Antimicrobial susceptibility results from urine: E. coli and K. pneumoniae
- In 2020, the highest proportions of non-susceptibility in E. coli isolates were: ampicillin (40.4%), amoxicillin-clavulanate (31.6%), ciprofloxacin (23.5%) and trimethoprim-sulfamethoxazole (19.9%). Non-susceptibility proportions were lower for ertapenem (0.5%), gentamicin (6.8%), and tobramycin (13.7%).
- Among K. pneumoniae isolates tested in 2020, the proportions of resistance were lower than those seen in E. coli isolates: ciprofloxacin (9.5%), trimethoprim-sulfamethoxazole (7.2%), gentamicin (1.8%) and ertapenem (2.7%). As expected, given the intrinsic resistance of K. pneumoniae to ampicillin, non-susceptibility was very high (99.9%).

Figure 18 - Text description
| Antibiotic | E. coli | K. pneumoniae |
|---|---|---|
| Ampicillin | 40.4% | 99.9% |
| Amoxicillin/Clavulanic acid | 31.6% | 3.0% |
| Ceftriaxone | 18.5% | 5.1% |
| Ciprofloxacin | 23.5% | 9.5% |
| Gentamicin | 6.8% | 1.8% |
| Ertapenem | 0.5% | 2.7% |
| Trimethoprim/sulfamethoxazole | 19.9% | 7.2% |
| Tobramycin | 13.7% | 4.6% |
a Of the carbapenems, only ertapenem is presented for 2020 due to limitations around estimation for other carbapenems in initial data extracts.
Antimicrobial susceptibility from blood: E. coli, K. pneumoniae, S. aureus , and S. pneumoniae
- Among blood samples collected in 2020, non-susceptibility proportions for E. coli were: ciprofloxacin (30.2%), piperacillin-tazobactam (25.1%), and trimethoprim/sulfamethoxazole (TMP-SMX) (25.1%). Non-susceptibility proportions were lower for ceftriaxone (21.3%), tobramycin (10.0%), and gentamicin (8.8%).
- K. pneumoniae isolates collected from blood samples showed relatively low non-susceptibility proportions (all <15%): piperacillin-tazobactam (14.5%), ciprofloxacin (13.4%), TMP-SMX (12.1%) and ceftriaxone (11.8%). Proportions of non-susceptible isolates were much lower (<10%) for tobramycin (5.3%) and gentamycin (3.6%)
- Among S. aureus blood isolates, 16.1% were MRSA (non-susceptible to cloxacillin/oxacillin). The non-susceptibility proportion for clindamycin was 34.6% among S. aureus isolates. Non-susceptibility proportions for erythromycin and TMP-SMX were 28.7%. All S. aureus isolates were susceptible to vancomycin. These results seem comparable with the resistance results found in the literature; S. aureus resistance was found at 13.4% for oxacillin and higher for TMP-SMX and erythromycin at 15.5% and 65.9%, respectively (87).
- For S. pneumoniae blood isolates, non-susceptibility proportions were low overall. The rate of penicillin non-susceptibility was 6.6%, followed by ceftriaxone (1.8%) and levofloxacin (0.8%). All S. pneumoniae isolates were susceptible to moxifloxacin and vancomycin.

Figure 19 - Text description
| Antibiotic | E. coli | K. pneumoniae | S. aureus | S. pneumoniae |
|---|---|---|---|---|
| Ceftriaxone | 21.2% | 11.8% | n/a | 1.8% |
| Ciprofloxacin | 30.2% | 13.4% | n/a | n/a |
| Clindamycin | n/a | n/a | 34.6% | n/a |
| Cloxacillin/Oxacillin | n/a | n/a | 16.0% | n/a |
| Erythromycin | n/a | n/a | 28.7% | n/a |
| Gentamicin | 8.8% | 3.6% | n/a | n/a |
| Levofloxacin | n/a | n/a | n/a | 0.8% |
| Penicillin | n/a | n/a | n/a | 6.6% |
| Moxifloxacin | n/a | n/a | n/a | 0.0% |
| Piperacillin/tazobactam | 25.1% | 14.5% | n/a | n/a |
| Trimethoprim/sulfamethoxazole | 25.1% | 12.1% | 2.8% | n/a |
| Tobramycin | 10.0% | 5.3% | n/a | n/a |
| Vancomycin | n/a | n/a | 0.0% | 0.0% |
Antimicrobial use (AMU) in humans
Surveillance of human antimicrobial use in Canada, 2017-2021
Misuse and overuse of antibiotics is a well-known factor for accelerating the rate of AMR. The Public Health Agency of Canada uses human antibiotic purchases from healthcare sectors and antibiotics dispensed from retail pharmacies as a proxy of human antimicrobial consumption in order to monitor antimicrobial usage trends at a national and regional level.
Human antimicrobial consumption in Canada is estimated based on two IQVIA Products: the Canadian Drugstore & Hospital Purchases (CDH) and the Canadian Compuscript (CS). The CDH provides projected dollar and unit volume of pharmaceutical and diagnostic products purchased by Canadian retail pharmacies and healthcare settings at the provincial level. CDH data are estimates and not census data and that antibiotics returned are reflected in the data. CS provides projected dispensed prescriptions of pharmaceutical products in retail pharmacies in Canada at the provincial level.
In the following section, though not all antibiotics sold are consumed, purchases from healthcare sectors and antibiotic prescriptions dispensed in the community will be used as a proxy for the national human antimicrobial consumption. Hospital purchase of antibiotics will reflect antimicrobial consumption in the healthcare sector; whereas antibiotics dispensed in retail pharmacies will reflect antimicrobial consumption in the community sector.
Data Disclaimer: The statements, findings, conclusions, views, and opinions expressed in this report are based in part on data obtained under license from IQVIA Solutions Canada Inc. concerning the following information service(s): Compuscript, [from: January 2017 to: April 2022]. All Rights Reserved. The statements, findings, conclusions, views, and opinions expressed herein are not necessarily those of IQVIA Inc. or any of its affiliated or subsidiary entities.
Key findings
Between 2017 and 2021:
- Overall Canadian antimicrobial consumption decreased by 26.9% when measured by defined daily doses (DDDs), with decreasing trends across all jurisdictions.
- Antimicrobial consumption in the community and healthcare sectors decreased by 25.3% and 27.0%, respectively.
- Antimicrobial consumption of drugs in the AWaRe "Access" category in Canada continues to exceed the WHO benchmark which sets a country-specific target of 60% of total consumption of drugs being from the "Access" group. In 2021, nearly 73.6% of the total antimicrobial consumption in Canada were from the "Access" group.
- Access drugs represented 75.8% of community sector use, but only 49.3% of use in the healthcare sector.
- Antimicrobial consumption of drugs in the AWaRe "Watch" decreased by 45.1% between 2017 and 2021. Both the community and healthcare sectors saw a decrease in "Watch" use by 47.8% and 23.8% respectively.
- The consumption of drugs in the AWaRe "Reserve" category increased by 24.5%, driven by an increase of 43.1% in the healthcare sector. The community sector saw a 4.1% decrease in consumption. Despite the increase, the total proportion of antimicrobials consumed in the "Reserve" category remains at 0.2%.
- Daptomycin consumption drove the increase in "Reserve" drugs, increasing by 68.3% in healthcare sector and by 38.0% in the community.
- The overall carbapenem-class consumption decreased by 32.8% driven by a 50.6% decline in the healthcare sector. On the other hand, the community sector saw an increase of 21.4%.
National perspective
National human consumption of antimicrobials, purchased by the healthcare sector and dispensed by retail pharmacies (DDDs per 1,000 inhabitants per day)
Between 2017 and 2021, national antimicrobial consumption decreased by 26.9%, from 17.0 to 12.5 DDDs per 1,000 inhabitants per day. Between 2017 and 2021, both the healthcare sector and the community sector experienced declines at 25.3% (1.4 to 1.0 DDDs per 1,000 inhabitants per day) and 27.0% (15.7 to 11.4 DDDs per 1,000 inhabitants per day) respectively. During this five-year period, at least 90.0% of antimicrobials (DDDs per 1,000 inhabitants per day) were dispensed in the community.
Between 2017 and 2021, the total national annual amount spent on antibiotics, healthcare and community sectors combined, (dollars adjusted for inflation) decreased by 32.0%, from $883.2M in 2017 to $600.3M in 2021.
- The spending on antimicrobials in the community decreased by 34.4% and with a gradual continuous decline between 2017 and 2021.
- The annual amount spent on antibiotics in the healthcare sector decreased by 14.4% between 2017 and 2021, mostly driven by a 19.2% decline between 2019 and 2021.
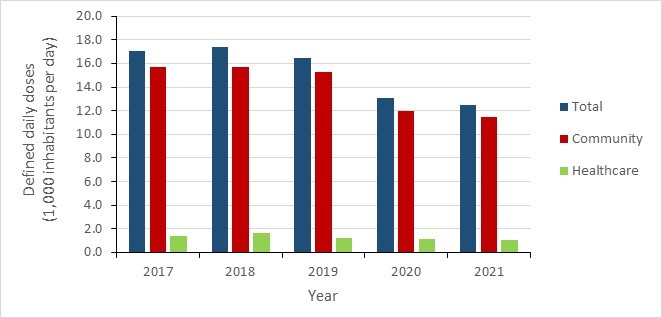
Figure 20 - Text description
| Sector | 2017 | 2018 | 2019 | 2020 | 2021 |
|---|---|---|---|---|---|
| Community | 15.7 | 15.7 | 15.2 | 12.0 | 11.4 |
| Healthcare | 1.4 | 1.7 | 1.2 | 1.1 | 1.0 |
| Total | 17.0 | 17.4 | 16.4 | 13.1 | 12.5 |
Canadian jurisdictions: provinces
Between 2017 and 2021, all Canadian provincial jurisdictions experienced a decrease in their antimicrobial consumption. While Atlantic Canada had the highest antimicrobial consumption in 2021 (5,794.1 DDDs per 1,000 inhabitants), this region demonstrated the second largest decrease across the five-year period (by 28.7%) following the Prairies who saw a decrease of 28.9%. Conversely, Ontario showed the smallest decrease in antimicrobial consumption, at 24.8% between 2017 and 2021. Among all Canadian jurisdictions, Quebec had the lowest antimicrobial consumption in the five-year period, with an average of 5,048.5 DDDs per 1,000 inhabitants.
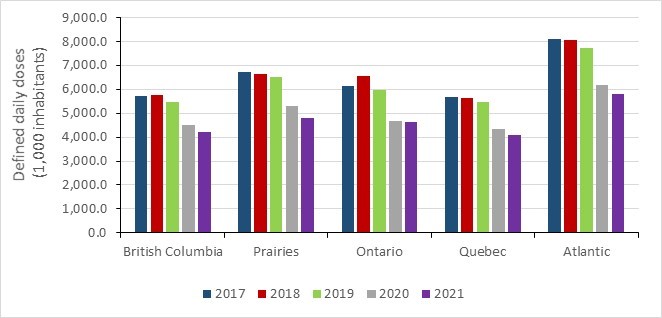
Figure 21 - Text description
| Jurisdiction | 2017 | 2018 | 2019 | 2020 | 2021 |
|---|---|---|---|---|---|
| British Columbia | 5,722.8 | 5,745.9 | 5,454.3 | 4,505.3 | 4,208.0 |
| Prairies | 6,727.5 | 6,661.5 | 6,534.9 | 5,292.0 | 4,783.6 |
| Ontario | 6,144.2 | 6,557.8 | 5,963.8 | 4,692.1 | 4,620.9 |
| Quebec | 5,676.1 | 5,653.8 | 5,483.3 | 4,357.5 | 4,072.0 |
| Atlantic | 8,122.5 | 8,057.6 | 7,722.1 | 6,183.5 | 5,794.1 |
Prairies: Alberta, Saskatchewan and Manitoba
Atlantic Canada: New Brunswick, Nova Scotia, Prince-Edward Island, and Newfoundland and Labrador
Improving antimicrobial use in Canada – using data to inform action
The Public Health Agency of Canada estimates the quantity of antimicrobials used by humans in Canada through date provided by IQVIA – a provider of pharmaceutical sales and dispensing information in over 100 countries. These findings, most recently published by the Canadian Antimicrobial Resistance Surveillance System (CARSS), have consistently identified some Atlantic Provinces as the highest per-capita antimicrobial consumers in Canada. These trends, complemented by a growing body of evidence, led representatives in Newfoundland and Labrador (NL) to take action.
Through the Newfoundland and Labrador Centre for Health Information (NLCHI), a province-wide system that collates data on every outpatient prescription dispensed by community pharmacies, an investigation helped to identify specific prescribing practices that were contributing to antimicrobial overuse, notably prescriptions with prolonged duration, high-rate prescribers, and high-rate inhabitants. While work continues to develop the methods necessary to identify additional inappropriate antimicrobial prescribing practices, recent results from the NLCHI show that antimicrobial use in NL has decreased by 34% between 2017 and 2021*. This complements recent results from CARSS, which shows that overall antimicrobial use in the Atlantic Provinces decreased by 29% over the same time period. These results demonstrate how the use of prescribing data can serve as a model to reduce overall antimicrobial use in other Canadian jurisdictions.
National estimates continue to identify the Atlantic region as being the highest per-capita consumers of antimicrobials in Canada; however, these provinces are being credited with one of the largest decreases in antibiotic use across the 5-year period.
*Results shared with PHAC by personal communication and remained unpublished at the time the CARSS 2022 report was released.
Top five antimicrobial classes
National consumption of the top five classes of antimicrobials, purchased by healthcare and dispensed by retail pharmacies, 2017-2021
- Over the course of the five-year period from 2017 to 2021, the top five antimicrobials consumed at the national level remained the same and were similar to those consumed in the community sector; they were (from high to low consumption in DDDs per 1,000 inhabitants) tetracyclines, penicillins, first-generation cephalosporins, macrolides and beta-lactamase inhibitors.
- However, the top five most consumed antimicrobials between 2017 and 2021 were different in the healthcare sector; these were (from high to low consumption in DDDs per 1,000 inhabitants): second- and third-generation cephalosporins (data combined), first-generation cephalosporins, macrolides and beta-lactamase inhibitors.
- At all three levels (national, community and healthcare), with the exception of the tetracyclines which showed increasing consumption, all the remaining antimicrobials in the top five displayed decreasing consumption between 2017 and 2021.
- In 2021, the top five national antimicrobial classes consumed in Canada were tetracyclines (1,149.5 DDDs per 1,000 inhabitants), penicillins (839.3 DDDs per 1,000 inhabitants), first-generation cephalosporins (425.1 DDDs per 1,000 inhabitants), macrolides (372.5 DDDs per 1,000 inhabitants) and beta-lactamase inhibitors (356.6 DDDs per 1,000 inhabitants). While the consumption of four of these antimicrobial classes decreased between 2017 and 2021, the consumption of tetracyclines increased 8.3%, from 1,061.8 in 2017 to 1,149.5 DDDs per 1,000 inhabitants in 2021.
- The top five antimicrobial classes dispensed in the community sector in Canada in 2021 were tetracyclines (1,094.5 DDDs per 1,000 inhabitants), penicillins (812.9 DDDs per 1,000 inhabitants), first-generation cephalosporins (388.1 DDDs per 1,000 inhabitants), macrolides (334.4 DDDs per 1,000 inhabitants) and fluoroquinolones (318.0 DDDs per 1,000 inhabitants).
- Due to the nature of returns in the healthcare sector data, rankings are determined based on 2019 data, however purchased presented are from 2021. The top five antimicrobial classes purchased in the healthcare sector in were first-generation cephalosporins (36.9 DDDs per 1,000 inhabitants), second- and third-generation cephalosporins (53.4 DDDs per 1,000 inhabitants), macrolides (38.1 DDDs per 1,000 inhabitants), beta lactamase inhibitors (44.9 DDDs per 1,000 inhabitants) and tetracyclines (54.9 DDDs per 1,000 inhabitants).
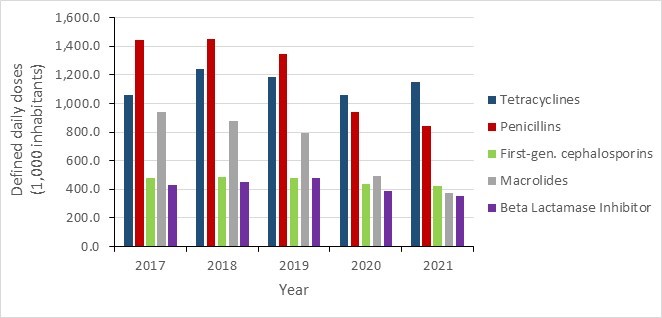
Figure 22 - Text description
| Antimicrobial Class | 2017 | 2018 | 2019 | 2020 | 2021 |
|---|---|---|---|---|---|
| Tetracyclines | 1,061.6 | 1,238.2 | 1,186.7 | 1,058.4 | 1,149.3 |
| Penicillins | 1,444.1 | 1,451.9 | 1,349.1 | 937.6 | 839.3 |
| First-generation cephalosporins | 482.8 | 483.3 | 482.8 | 437.7 | 425.1 |
| Macrolides | 941.2 | 875.8 | 795.4 | 493.9 | 372.5 |
| Beta lactamase inhibitor | 428.6 | 454.8 | 479.2 | 385.4 | 356.6 |
AWaRe antimicrobial categorization
In 2017, the WHO introduced a tiered classification system for antibiotics. The system classifies antibiotics into three stewardship groups: Access, Watch and Reserve, to emphasize the importance of their optimal uses in human medicine and potential for antimicrobial resistance.
Access
- Antibiotics in the "Access" group are usually used to treat infections caused by commonly susceptible organisms with lower risk for resistance compared to those in the "Watch" and "Reserve" categories.
- In the five-year period of 2017 to 2021, of all the antimicrobial drugs consumed by humans, the "Access’’ group represented 68.7%. As overall consumption of antimicrobials decreased between 2017 and 2021, the consumption of antimicrobials in the "Access" group noted a 17.2% decrease (4,041.4 to 3,346.1 DDDs per 1,000 inhabitants) in this period. However, Canada continues to see an increase in the proportion of drugs consumed from the "Access" group. In 2017, 65% of total antimicrobials consumed were from the "Access" group; this increased to 74% in 2021.
- These trends are reflected in the community sector; with a 16.5% decrease (3,787.8 to 3,163.6 DDDs per 1,000 inhabitants) in "Access" consumption, and a change in proportion of consumption from 66.2% in 2017 to 75.8% in 2021.
- The healthcare sector saw a decrease of 28.0% (253.6 to 182.5 DDDs per 1,000 inhabitants); however, the proportion of drugs consumed in the Access group remained stable around 50% (51.2% in 2017 and 49.3% in 2021).
Watch
- Antibiotics in the "Watch" group are drugs with high potential for resistance; they are usually used as part of first- or second-line treatments.
- The "Watch" group represented 26.2% of total consumption of antibiotics in 2021 overall. Between 2017 and 2021, the consumption of "Watch" antibiotics decreased by 45.1%, from 2,167.4 to 1,188.9 DDDs per 1,000 inhabitants.
- In the community sector, "Watch" group represented 24.1% of total consumption of antibiotics in 2021. Between 2017 and 2021, the consumption of "Watch" antibiotics in the community sector decreased by 47.8%, from 1,930.4 to 1,008.2 DDDs per 1,000 inhabitants.
- The healthcare sectors "Watch" proportion in 2021 was 48.8%. "Watch" consumption decreased by 23.8% (237.0 to 180.7 DDDs per 1,000 inhabitants) between 2017 and 2021.
Reserve
- Antibiotics in the "Reserve" group are considered drugs of last resort, used to treat infections caused by multidrug-resistant organisms.
- Between 2017 and 2021, human consumption of "Reserve" antibiotics increased by 24.5%, from 8.1 to 10.1 DDDs per 1,000 inhabitants; however, it is important to note that "Reserve" drugs consumed in 2021 represented only 0.2% of total antimicrobial consumption.
- A 43.1% increase (4.9 to 7.1 DDDs per 1,000 inhabitants) in healthcare purchasing drove the national increase in consumption.
- Conversely, community dispensing decreased by 4.1% (3.2 to 3.1 DDDs per 1,000 inhabitants) in the same five-year period.
- "Reserve" drugs made up 0.1% and 1.9% of consumption in community and healthcare sectors, respectively.
- Between 2017 and 2021, daptomycin was the most consumed antimicrobial in the "Reserve" group (6.4 DDDs per 1,000 inhabitants in 2021 nationally). Its consumption increased 65.8%, the greatest increase compared to other drugs in the "Reserve" group.
- Daptomycin consumption increased by 68.3% in the healthcare sector (from 3.5 in 2017 to 5.9 DDDs per 1,000 inhabitants in 2021).
- In addition, its consumption increased 38.0% in the community (from 0.3 in 2017 to 0.4 DDDs per 1,000 inhabitants in 2021).
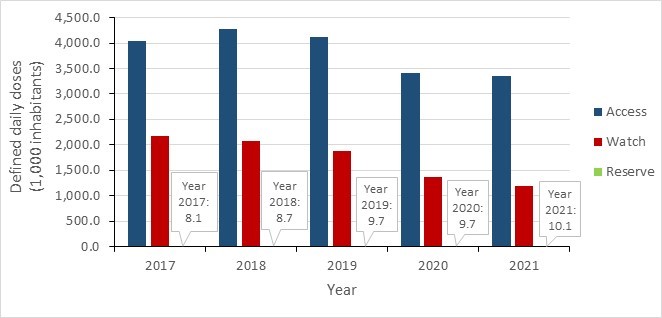
Figure 23 - Text description
| AWaRe Classification | 2017 | 2018 | 2019 | 2020 | 2021 |
|---|---|---|---|---|---|
| Access | 4.041.4 | 4,277.5 | 4,118.5 | 3,410.1 | 3,346.1 |
| Watch | 2,167.4 | 2,071.0 | 1,874.9 | 1,377.0 | 1,188.9 |
| Reserve | 8.1 | 8.7 | 9.7 | 9.7 | 10.1 |
Carbapenem-class antimicrobial consumption
- The antimicrobial class of carbapenems are used to treat infections from multidrug-resistant organisms. Overall national consumption of these drugs decreased by 32.8% (22.5 to 15.2 DDDs per 1,000 inhabitants) between 2017 and 2021.
- Healthcare sector consumption of carbapenems decreased by 50.6% (17.0 to 8.4 DDDs per 1,000 inhabitants) between 2017 and 2021.
- Community sector saw a 21.4% increase (5.6 to 6.8 DDDs per 1,000 inhabitants) in the same period.
- In 2021, ertapenem and meropenem made up most of the carbapenem-class antimicrobial use (52.0% and 42.6%, respectively). National annual ertapenem consumption decreased by 21.0% (10.0 to 7.9 DDDs per 1,000 inhabitants) from 2017 to 2021.
- Healthcare sector decreased by 43.8% (5.8 to 3.2 DDDs per 1,000 inhabitants) and community sector increased by 10.0% (4.2 to 4.6 DDDs per 1,000 inhabitants).
- Meropenem national consumption decreased by 27.7% (8.9 to 6.5 DDDs per 1,000 inhabitants).
- Healthcare sector decreased by 41.3% (7.6 to 4.5 DDDs per 1,000 inhabitants) and community sector increased by 51.7% (1.3 to 2.0 DDDs per 1,000 inhabitants).
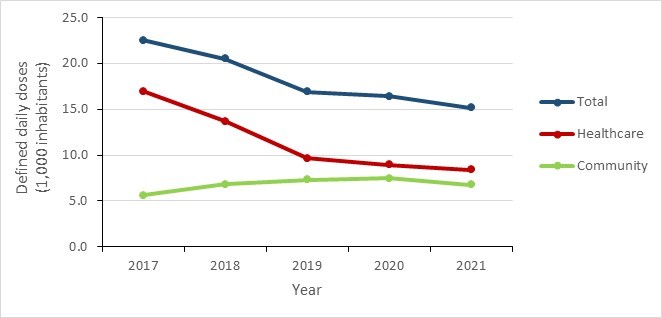
Figure 24 - Text description
| Sector | 2017 | 2018 | 2019 | 2020 | 2021 |
|---|---|---|---|---|---|
| Community | 5.6 | 6.8 | 7.3 | 7.4 | 6.8 |
| Healthcare | 17.0 | 13.7 | 9.6 | 8.9 | 8.4 |
| Total | 22.5 | 20.5 | 16.9 | 16.4 | 15.2 |
Overall antimicrobial consumption by humans in 2020: International perspective
The European Surveillance of Antimicrobial Consumption Network (ESAC-Net), one of the largest internationally standardized surveillance systems measuring antimicrobial consumption, collects and reports data on the quantity of J01 antimicrobials consumed in the community and healthcare sectors in European countries. These data, reported in DDDs per 1,000 inhabitant-days, were comparable to Canadian human antimicrobial consumption data.
In 2020, twenty-nine countries (27 European Union Member States and two European Economic Area countries – Iceland and Norway) reported data on antimicrobial consumption. Twenty-five countries reported data for both community and healthcare consumption; two countries (Germany and Iceland) reported only community consumption, and two countries (Cyprus and Czechia) reported total consumption for both sectors combined.
Overall, Canada was the tenth lowest consumer of antimicrobials per capita in 2020 compared to the 30 European countries reporting to ESAC-Net for total combined consumption. Canada consumed over 50.0% more antimicrobials consumed by the Netherlands (the country with the lowest consumption) and about half the amount consumed by Cyprus (the country with the highest consumption).
- Compared to the 29 other countries that reported community sector data, Canada was the eleventh lowest consumer, consuming about 69% more than Austria (lowest community reported) and just under half as much as Greece (the highest reported community use).
- In the healthcare sector, Canada ranked second smallest consumer compared to the 26 other countries that reported healthcare sector data, with about 45% more use than the Netherlands and half as much as Lithuania.

Figure 25 - Text description
| Country | Community Sector | Hospital Sector | Total (as reported by EU) |
|---|---|---|---|
| Netherlands | 7.8 | 0.8 | 8.5 |
| Austria | 7.1 | 1.7 | 8.8 |
| Germany* | 8.9 | n/a | n/a |
| Slovenia | 8.8 | 1.3 | 10.2 |
| Sweden | 8.9 | 1.4 | 10.4 |
| Estonia | 8.8 | 1.7 | 10.5 |
| Hungary | 10.0 | 1.2 | 11.2 |
| Finland | 10.0 | 1.9 | 11.9 |
| Latvia | 10.2 | 2.1 | 12.3 |
| Canada | 12.0 | 1.1 | 13.1 |
| Czechia | n/a | n/a | 13.4 |
| Norway | 12.8 | 1.2 | 13.9 |
| Lithuania | 11.9 | 2.2 | 14.1 |
| Denmark | 12.5 | 1.8 | 14.3 |
| Slovakia | 13.2 | 1.3 | 14.4 |
| Portugal | 13.7 | 1.5 | 15.2 |
| Iceland* | 15.3 | n/a | n/a |
| Croatia | 14.0 | 1.6 | 15.7 |
| Luxembourg | 14.8 | 1.3 | 16.1 |
| EU/EEA* | 15.0 | 1.6 | 16.4 |
| Malta | 14.4 | 2.2 | 16.6 |
| Belgium | 15.3 | 1.4 | 16.6 |
| Italy | 16.5 | 1.9 | 18.4 |
| Poland | 17.1 | 1.4 | 18.5 |
| Ireland | 17.1 | 1.5 | 18.6 |
| Spain | 18.2 | 1.6 | 19.8 |
| France | 18.7 | 1.6 | 20.3 |
| Bulgaria | 20.7 | 2.0 | 22.7 |
| Romania | 23.7 | 1.4 | 25.2 |
| Greece | 26.4 | 1.7 | 28.1 |
| Cyprus | n/a | n/a | 28.9 |
Antimicrobial consumption by humans in the community sector
Antimicrobial prescriptions in the community sector
Between 2017 and 2021, the annual number of prescriptions (per capita per day) filled by retail pharmacies in the community sector decreased by 30.6%, from 1.8 to 1.2 prescriptions per 1,000 inhabitants per day. The largest decrease was 23.3%, between 2019 and 2020.
- In 2021, retail pharmacies filled 451.6 prescriptions for every 1,000 inhabitants in the community.
- Between 2017 and 2021, the total number of prescriptions decreased by 27.3%.
Antimicrobial prescriptions dispensed by retail pharmacies per 1,000 inhabitants, stratified by age and sex
Between 2017 and 2021, annual antimicrobial prescriptions remained lower in males than in females, across all age groups. Overall, male dispensing dropped by 32.5% (533.3 to 360.2 prescriptions per 1,000 inhabitants) and female dispensing dropped by 29.4% (766.9 to 541.7 prescriptions per 1,000 inhabitants) during this period.
In 2021, the highest dispensing was to females aged 65 years and above and males aged 65 years and above (826.0 and 670.2 prescriptions per 1,000 inhabitants, respectively). The lowest dispensing was to males aged 0 to 18 and females in the same age category (239.2 and 276.5 prescriptions per 1,000 inhabitants, respectively).
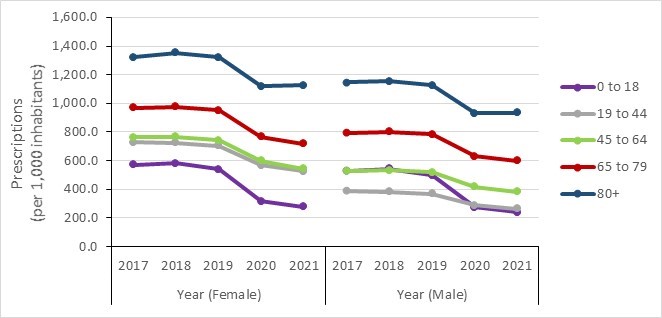
Figure 26 - Text description
| Female | 2017 | 2018 | 2019 | 2020 | 2021 |
|---|---|---|---|---|---|
| 0 to 18 years | 571.8 | 582.5 | 538.6 | 314.9 | 276.5 |
| 19 to 44 years | 727.5 | 723.7 | 702.3 | 568.4 | 526.8 |
| 45 to 64 years | 761.2 | 765.3 | 741.2 | 599.4 | 544.5 |
| 65 to 79 years | 968.4 | 975.0 | 950.9 | 765.6 | 716.5 |
| 80+ years | 1,322.1 | 1,354.0 | 1,321.6 | 1,120.3 | 1,126.3 |
| Male | 2017 | 2018 | 2019 | 2020 | 2021 |
| 0 to 18 years | 530.1 | 543.9 | 498.7 | 274.4 | 239.2 |
| 19 to 44 years | 390.6 | 383.7 | 369.0 | 287.7 | 264.8 |
| 45 to 64 years | 530.0 | 533.7 | 518.1 | 416.9 | 383.6 |
| 65 to 79 years | 793.8 | 802.0 | 784.0 | 630.5 | 598.7 |
| 80+ years | 1,146.9 | 1,152.4 | 1,125.7 | 931.7 | 933.4 |
Antimicrobial consumption by humans in the community sector: prescription origin
Between 2017 and 2021, a 42.8% decrease (387.9 to 222.0 prescriptions per 1,000 inhabitants) was observed in rates of prescriptions originating from general practitioners (GP) and family medicine physicians (FP). In 2021, specialists, or physicians outside of family medicine or general practice, prescribed 18% fewer antimicrobials than in 2017. The rate of prescriptions originating from non-physician specialties decreased by 5.6% (137.8 to 130.1 prescriptions per 1,000 inhabitants) between 2017 and 2021.
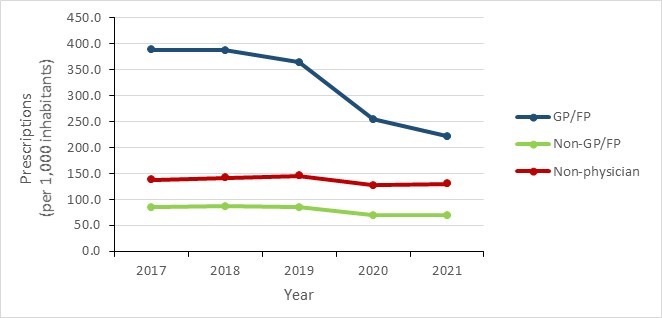
Figure 27 - Text description
| Physician Specialty | 2017 | 2018 | 2019 | 2020 | 2021 |
|---|---|---|---|---|---|
| General Practitioner/Family Physician | 387.9 | 387.4 | 364.3 | 254.4 | 222.0 |
| Non-General Practitioner/Family Physician | 84.8 | 87.2 | 84.9 | 69.2 | 69.5 |
| Non-Physician | 137.8 | 142.2 | 145.7 | 127.1 | 130.1 |
Of non-physician sources, overall prescribing by dentists fluctuated over the five-year period, there was an overall increase of 5.7% (50.0 in 2017 to 52.8 in 2021 prescriptions per 1,000 inhabitants). Prescribing by nurse practitioners increased by 16.0% overall (13.1 in 2017 to 15.2 in 2021 prescriptions per 1,000 inhabitants) and prescribing by pharmacists increased by 37.9% (6.8 in 2017 to 9.4 in 2021 prescriptions per 1,000 inhabitants). Between 2017 and 2021, the annual rate of antimicrobials dispensed by pharmacists and veterinarians remained low, at less than 1.1 per 1,000 inhabitants.
In 2021, 49.2% of antimicrobial prescriptions originated from general practitioners and family physicians, 11.7% originated from dentists, 3.4% originated from nurse practitioners and 2.1% originated from pharmacists.
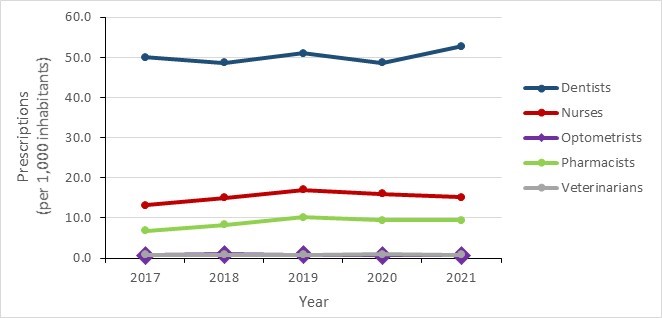
Figure 28 - Text description
| Non-Physician Specialty | 2017 | 2018 | 2019 | 2020 | 2021 |
|---|---|---|---|---|---|
| Dentists | 50.0 | 48.7 | 51.1 | 48.7 | 52.8 |
| Nurses | 13.1 | 15.0 | 17.1 | 16.1 | 15.2 |
| Optometrists | 0.8 | 0.9 | 0.9 | 0.7 | 0.7 |
| Pharmacists | 6.8 | 8.4 | 10.2 | 9.4 | 9.4 |
| Veterinarians | 0.9 | 0.8 | 0.9 | 0.9 | 0.9 |
Canadian National Antimicrobial Prescribing Survey, 2018-2021
The Canadian National Antimicrobial Prescribing Survey (NAPS) provides insights into prescribing practices for antimicrobials in the healthcare sector. The information obtained by this survey further complements the antimicrobial use data captured by the Canadian Nosocomial Infection Surveillance Program (CNISP) and IQVIA hospital purchases data to support the development of evidence-based strategies to improve appropriate prescribing practices at the hospital level.
The NAPS was piloted in 2018-2019 by Sinai Health System-University Health Network5 to assess the feasibility of implementing a Canadian version of the web-based Australian NAPS6 for the collection of data on antimicrobial prescribing practices across Canadian hospitals. The success of the pilot project in 38 hospitals laid the foundation for broader national adoption and implementation in more hospitals. As of 2022, the NAPS includes 119 healthcare facilities across all ten provinces (including all 12 paediatric academic hospitals in Canada). The NAPS provides a tool that allows for timely quantitative and qualitative assessments of antimicrobial prescribing; provides insight on antibiotic prescribing behaviours and trends in Canadian hospitals; supports benchmarking; identifies areas where prescribing practices greatly varies from other hospitals; and helps identify clinical indications and antimicrobial use patterns for which efficient and timely intervention can be implemented.
Hospital participation in the Canadian NAPS tool is voluntary. Current participating hospitals vary in size and facility type.
Data collection for the NAPS was designed to be as flexible and practical as possible. Hospitals collect data using one of four different survey methods: hospital-wide point prevalence (preferred method); random sampling (100+ bed hospitals); hospital-wide repeat point prevalence survey (small hospitals); and directed point prevalence survey (short surveys focusing on a specific ward, specialty, indication or a particular antimicrobial and still leverage all the reporting tools of the hospital-wide point prevalence surveys). Participating hospitals complete at least one point prevalence survey per benchmark year but are free to choose when to survey during this time. Benchmark years are defined as the 12-month span starting in September and ending in August of the subsequent year.
Appropriateness and inappropriateness7 were assessed according to whether endorsed guidelines were followed, antimicrobial choice, dosage, route and duration.
Key findings
From 2018 to 2019, based on 90 NAPS audits from 64 hospitals:
- 77.5% of hospital antibiotic prescriptions were deemed appropriate across Canada, with a degree of regional variability.
- Overall antibiotic prescriptions based on the AWaRe category demonstrate that 37.3% of prescriptions are from the "Access" group, 60.8% are from the "Watch" group and 1.8% are from the "Reserve" group.
- Among the top 20 antibiotics prescribed, only four antibiotics had levels of appropriate prescribing lower than 70% appropriateness: nitrofurantoin (55.3%), cefuroxime (64.7%), levofloxacin (66.5%), and moxifloxacin (67.9%).
- Specialties with the highest level of antibiotic prescription appropriateness were pediatrics, hematology, gynecology, infectious diseases and HIV, and emergency medicine.
Results
From 2018 to 2021, there were 90 NAPS audits from 64 hospitals, consisting of 23,274 patients. The majority of the analysis were based on data received from the hospital-wide point prevalence surveys (57%), followed by directed point prevalence surveys (41%).
Overall antibiotic prescriptions (2018 to 2021) from all NAPS participating hospitals and stratified by region
Results for the combined three years pilot survey show that 77.5% of hospital antibiotic prescriptions were deemed appropriate across Canada, with a degree of regional variability. Appropriateness was highest in the Western Region at 81.3%, followed by the Central region (79.5%) and the Eastern region (66.8%).
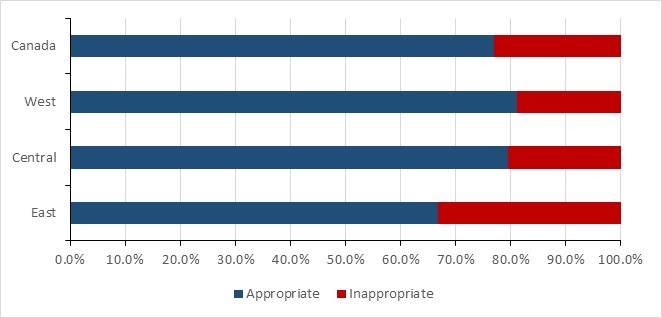
Figure 29 - Text description
| Region | Appropriate | Inappropriate |
|---|---|---|
| Canada | 77.0% | 23.0% |
| West | 81.3% | 18.8% |
| Central | 79.5% | 20.5% |
| East | 66.8% | 33.2% |
*Western: British Columbia, Alberta, Saskatchewan and Manitoba; Central: Ontario and Quebec; Eastern: New Brunswick, Nova Scotia, Prince Edward Island, Newfoundland.
Appropriateness of antibiotic prescriptions stratified by the WHO AWaRe classification
Antibiotic prescriptions at the hospital level captured by NAPS were classified into the three AWaRe categories. Antibiotics not included in the AWaRe classification were excluded from these analyses.
Between 2018 and 2021, of the antibiotic prescriptions captured by the NAPS, 60.8% of all antibiotics prescribed were from the "Watch" category, 74.5% of which were appropriately prescribed. Across Canada, 37.3% of all antibiotics prescribed were from the "Access" category, 75.5% of which were deemed to be appropriately prescribed, and 1.8% were from the "Reserve" category, 78.0% of which were deemed to be appropriately prescribed.
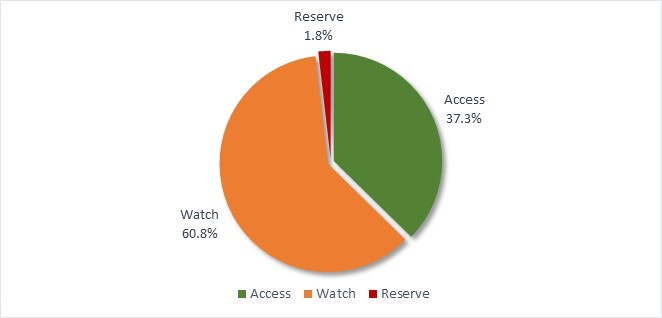
Figure 30 - Text description
| AWaRe Classification | % |
|---|---|
| Access | 37.3% |
| Watch | 60.8% |
| Reserve | 1.8% |
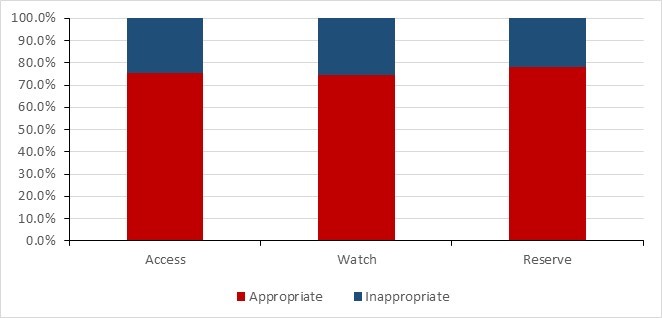
Figure 31 - Text description
| AWaRe Classification | Appropriate | Inappropriate |
|---|---|---|
| Access | 75.5% | 24.5% |
| Watch | 74.5% | 25.5% |
| Reserve | 78.0% | 22.0% |
Stratification of antibiotic prescription by hospital region revealed important regional differences in the use of antibiotics by AWaRE classification. Antibiotics from the "Access" category were prescribed more frequently in hospitals from the West (n= 16) and the East (n= 22) regions, 47.8% and 44.7% of prescriptions, respectively. In contrast, in the Central (n= 26) region only 32.3% of prescriptions were for antibiotics from the "Access" category with 65.5% of all antibiotics prescribed coming from the "Watch" category.
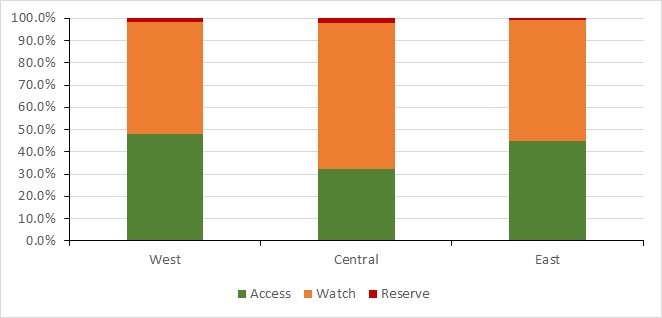
Figure 32 - Text description
| AWaRe Classification | West | Central | East |
|---|---|---|---|
| Access | 47.8% | 32.3% | 44.7% |
| Watch | 50.5% | 65.5% | 54.4% |
| Reserve | 1.6% | 2.1% | 0.9% |
*Western: British Columbia, Alberta, Saskatchewan and Manitoba; Central: Ontario and Quebec; Eastern: New Brunswick, Nova Scotia, Prince Edward Island, Newfoundland.
Appropriateness by specific antibiotic
The rate of appropriateness for the top five most commonly prescribed antibiotics (piperacillin-tazobactam, ceftriaxone, vancomycin, cefazolin, and meropenem, in descending order) ranged between 91.1% and 74.6%. Among the top 20 antibiotics prescribed, four antibiotics had levels of appropriate prescribing lower than 70% appropriateness: nitrofurantoin (55.3%), cefuroxime (64.7%), levoflaxacin (66.5%), and moxifloxacin (67.9%).
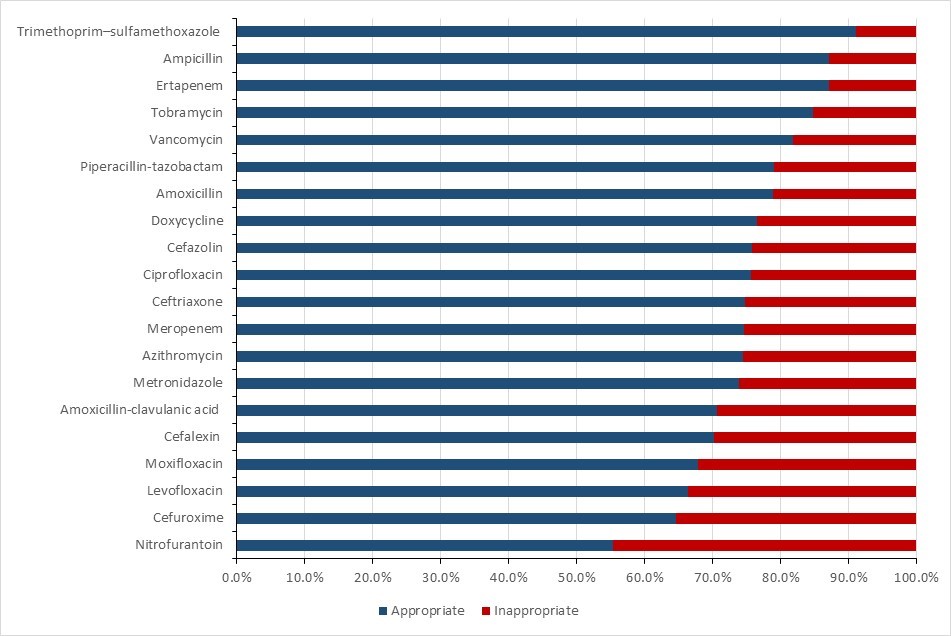
Figure 33 - Text description
| Antibiotic | Appropriate | Inappropriate |
|---|---|---|
| Trimethoprim-sulfamethoxazole | 91.1% | 8.9% |
| Ampicillin | 87.2% | 12.8% |
| Ertapenem | 87.2% | 12.8% |
| Tobramycin | 84.8% | 15.2% |
| Vancomycin | 81.9% | 18.1% |
| Piperacillin-tazobactam | 79.0% | 21.0% |
| Amoxicillin | 78.8% | 21.2% |
| Doxycycline | 76.5% | 23.5% |
| Cefazolin | 75.8% | 24.2% |
| Ciprofloxacin | 75.6% | 24.4% |
| Ceftriaxone | 74.7% | 25.3% |
| Meropenem | 74.6% | 25.4% |
| Azithromycin | 74.5% | 25.5% |
| Metronidazole | 73.9% | 26.1% |
| Amoxicillin-clavulanic acid | 70.7% | 29.3% |
| Cefalexin | 70.2% | 29.8% |
| Moxifloxacin | 67.9% | 32.1% |
| Levofloxacin | 66.5% | 33.5% |
| Cefuroxime | 64.7% | 35.3% |
| Nitrofurantoin | 55.3% | 44.7% |
Appropriateness of antibiotic prescriptions by specialties
The levels of appropriateness also varied by prescriber specialty. Specialties with the highest level of antibiotic prescription appropriateness were pediatrics (93.7%, n=79), hematology (88.4%, n=1,513), gynecology (86.2%, n=65), infectious diseases and HIV (83.8%, n=1,739), and emergency medicine (80.8%, n=120). Urology (n=152) had the lowest appropriateness of any specialty at 56.0%. Note that some specialties had insufficient numbers to be accurately assessed and were grouped together as "Other".

Figure 34 - Text description
| Specialty | Appropriate | Inappropriate |
|---|---|---|
| Pediatrics (n=79) | 93.7% | 6.3% |
| Hematology (n=1,513) | 88.4% | 11.6% |
| Gynecology (n=65) | 86.2% | 13.8% |
| Infectious Diseases and HIV (n=1,739) | 83.8% | 16.2% |
| Emergency Medicine (n=120) | 80.8% | 19.2% |
| Neurosurgery (n=56) | 78.6% | 21.4% |
| Intensive/Critical Care (n=698) | 78.5% | 21.5% |
| Obstetrics (n=127) | 78.0% | 22.0% |
| Orthopaedic surgery (n=399) | 77.9% | 22.1% |
| Acute Medical Unit (n=872) | 77.6% | 22.4% |
| Respiratory (n=83) | 75.9% | 24.1% |
| *Other (n=336) | 73.9% | 26.1% |
| General medicine (n=2,211) | 72.8% | 27.2% |
| Cardiology (n=84) | 72.6% | 27.4% |
| Plastic surgery (n=58) | 72.4% | 27.6% |
| General surgery (n=1,042) | 71.8% | 28.2% |
| Family medicine (n=890) | 69.0% | 31.0% |
| Psychiatry (n=48) | 68.8% | 31.3% |
| Cardiothoracic surgery (n=96) | 68.8% | 31.3% |
| Transplant-Organ (n=521) | 68.8% | 31.3% |
| Rehabilitation medicine (n=200) | 64.0% | 36.0% |
| Urology (n=152) | 56.0% | 44.0% |
*Other includes: aged care, dentistry, ear, nose and throat surgery, gastroenterological surgery, head and neck surgery, maxillofacial surgery, neonatology, nephrology, neurology, ophthalmology, orthopaedic surgery, palliative care, radiology and stroke.
Surveillance of human antimicrobial use in the community sector before8 and during9 the COVID-19 pandemic, Canada
Key findings
- While the average of prescribing was 53.5% prescriptions per 1,000 inhabitants during the pre-pandemic period, the rate precipitously dropped by 31.3% between March 2020 (start of pandemic) and April 2020. Rates remained low afterwards during the pandemic with a mean of 37.6 prescriptions per 1,000 inhabitants.
- Between the pre-pandemic and the pandemic periods, the average rates of prescribing decreased in the "Access" and "Watch" categories by 23.3% and 43.5%, respectively. In the "Reserve" category, rates remained nearly at same level and low (at 0.02 prescriptions per 1,000 inhabitants) during the two periods.
- Compared to males, females received nearly 40% more antimicrobial prescriptions before and during the pandemic.
- In all age groups, there was a marked decline in the rate of prescribing from the pre-pandemic to the pandemic period. The magnitude of decline during the pandemic was inversely proportional to age with the greatest decrease (54.7%) being observed in the youngest age group (0-18 years).
- Since mid-2021, overall rates of antimicrobial prescriptions have increased without returning to the pre-pandemic levels.
Results
During the two years following the start of the pandemic (March 2020 to April 2022) antimicrobial prescriptions dispensed per 1,000 census inhabitants in the community showed a marked and sustained decrease from the pre-pandemic period (May 2016 to February 2020), whereas the outpatient use of antimicrobials rebounded and surpassed the level in pre-pandemic period in other settings (88).
Overall national trends
- Prior to the start of the pandemic, the average monthly prescription rate in Canada was 53.5, with rates fluctuating between 45.4 (in July 2016) and 66.1 (peak reached in January 2018) prescriptions per 1,000 census inhabitants.
- Between March and April of 2020, community antimicrobial prescriptions declined precipitously by 31.3%. During the COVID-19 pandemic, average monthly prescription rates remained low (average rate of 37.6 prescriptions per 1,000 inhabitants, range 31.7-49.3 antimicrobial prescriptions per 1,000 inhabitants).
- In the pre-pandemic period, rates of antibiotic prescribing were highest between May and October each year (with peaks occurring in January). The lowest rate of prescribing was observed in June or July during these years.
- In the healthcare sector, antimicrobial use decreased from the pre-pandemic to the pandemic periods; the quantity of antimicrobials purchased by healthcare settings decreased by 25.3% between 2017 and 2021, with 8.3% decline between 2019 and 2020.
- New and modified means of accessing healthcare, resulting from public health measures to mitigate the spread of the coronavirus, may be one of the possible causes of these shifts in antimicrobial prescribing.
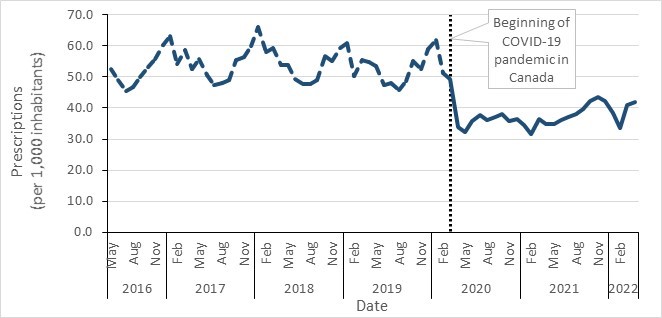
Figure 35 - Text description
| Month | 2016 | 2017 | 2018 | 2019 | 2020 | 2021 | 2022 |
|---|---|---|---|---|---|---|---|
| January | n/a | 63.2 | 66.1 | 60.8 | 62.0 | 34.6 | 38.4 |
| February | n/a | 54.1 | 57.9 | 50.3 | 51.4 | 31.7 | 33.6 |
| March | n/a | 58.8 | 59.1 | 55.4 | 49.3* | 36.4 | 40.9 |
| April | n/a | 52.6 | 53.7 | 54.7 | 33.9 | 34.9 | 41.9 |
| May | 52.5 | 55.7 | 53.8 | 53.5 | 32.3 | 35.0 | n/a |
| June | 49.1 | 50.7 | 49.2 | 47.4 | 35.7 | 36.1 | n/a |
| July | 45.4 | 47.3 | 47.7 | 48.2 | 37.7 | 37.2 | n/a |
| August | 46.9 | 48.0 | 47.7 | 45.8 | 36.0 | 38.1 | n/a |
| September | 49.8 | 49.0 | 49.1 | 48.8 | 37.1 | 39.6 | n/a |
| October | 53.3 | 55.4 | 56.8 | 55.2 | 38.2 | 42.2 | n/a |
| November | 55.7 | 56.5 | 55.1 | 52.7 | 35.8 | 43.5 | n/a |
| December | 60.4 | 59.8 | 59.3 | 58.9 | 36.3 | 42.3 | n/a |
| * Beginning of the COVID-19 pandemic in Canada | |||||||
Note: March 2020 marks the official declaration of the COVID-19 pandemic, which resulted in the closure of the Canada-United Sates land border.
Antimicrobial prescriptions before and during COVID-19 in the community, by the WHO AWaRe categorization, Canada, 2016–2022
Prescribing of both WHO’s "Access" and "Watch" category antimicrobials remained stable during the pre-pandemic period, as compared to the period since the beginning of the COVID-19 pandemic.
Access
- There was a 23.3% decrease in the average prescribing of "Access" category antimicrobials during the pandemic period. Rates of prescribing of WHO "Access" category antimicrobials pre-pandemic were, on average, 36.4 prescriptions per 1,000 inhabitants (ranging from 31.3 in July 2016 to 42.0 in January 2018).
- During the pandemic, the prescribing of "Access" antimicrobials was on average, 27.9 prescriptions per 1,000 inhabitants and remained at low levels and nearly stable (fluctuating between 23.8 prescriptions per 1,000 inhabitants in February 2021 and 33.9 prescriptions per 1,000 inhabitants in March 2020). However, rates have begun to slightly increase since September 2021 without returning to pre-pandemic levels.
Watch
- During the pre-pandemic period, prescribing of "Watch" category antimicrobials was, on average, 17.2 prescriptions per 1,000 inhabitants (ranging from 12.8 in August 2019 to 24.1 in January 2018). There was an overall 43.5% decrease in the average prescribing of "Watch" category antimicrobials between the pre-pandemic and the pandemic periods, rates were relatively low and stable during the pandemic, fluctuating between 7.8 in February 2021 and 15.4 in March 2020. However, since September 2021, rates have started to increase without returning to pre-pandemic levels.
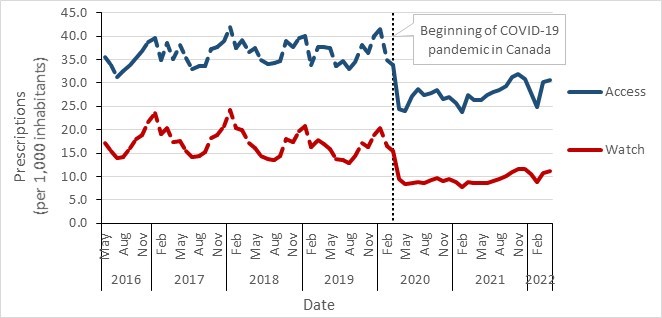
Figure 36 - Text description
| Access | 2016 | 2017 | 2018 | 2019 | 2020 | 2021 | 2022 |
|---|---|---|---|---|---|---|---|
| January | n/a | 39.7 | 42.0 | 40.0 | 41.5 | 25.8 | 27.8 |
| February | n/a | 34.9 | 37.5 | 33.9 | 34.8 | 23.8 | 24.8 |
| March | n/a | 38.5 | 39.2 | 37.7 | 33.9* | 27.5 | 30.2 |
| April | n/a | 35.2 | 36.5 | 37.8 | 24.4 | 26.3 | 30.7 |
| May | 35.5 | 38.1 | 37.5 | 37.5 | 24.0 | 26.4 | n/a |
| June | 33.7 | 35.2 | 34.8 | 33.7 | 27.2 | 27.4 | n/a |
| July | 31.3 | 33.1 | 34.0 | 34.6 | 28.7 | 28.0 | n/a |
| August | 32.6 | 33.7 | 34.2 | 33.0 | 27.4 | 28.5 | n/a |
| September | 33.7 | 33.7 | 34.6 | 34.4 | 27.9 | 29.4 | n/a |
| October | 35.3 | 37.3 | 38.9 | 38.1 | 28.5 | 31.2 | n/a |
| November | 36.8 | 37.6 | 37.7 | 36.4 | 26.7 | 31.9 | n/a |
| December | 38.8 | 38.9 | 39.6 | 40.0 | 26.9 | 30.8 | n/a |
| Watch | 2016 | 2017 | 2018 | 2019 | 2020 | 2021 | 2022 |
| January | n/a | 23.5 | 24.1 | 20.7 | 20.4 | 8.8 | 10.6 |
| February | n/a | 19.2 | 20.3 | 16.4 | 16.5 | 7.8 | 8.8 |
| March | n/a | 20.3 | 19.9 | 17.7 | 15.4* | 8.9 | 10.7 |
| April | n/a | 17.4 | 17.2 | 16.9 | 9.5 | 8.6 | 11.2 |
| May | 17.1 | 17.6 | 16.2 | 15.9 | 8.3 | 8.5 | n/a |
| June | 15.4 | 15.5 | 14.4 | 13.8 | 8.6 | 8.7 | n/a |
| July | 14.0 | 14.2 | 13.7 | 13.6 | 8.9 | 9.1 | n/a |
| August | 14.2 | 14.3 | 13.5 | 12.8 | 8.6 | 9.5 | n/a |
| September | 16.1 | 15.3 | 14.5 | 14.3 | 9.2 | 10.2 | n/a |
| October | 18.1 | 18.1 | 17.9 | 17.1 | 9.7 | 11.1 | n/a |
| November | 18.9 | 18.8 | 17.3 | 16.3 | 9.1 | 11.6 | n/a |
| December | 21.6 | 20.2 | 19.6 | 18.9 | 9.4 | 11.5 | n/a |
| * Beginning of the COVID-19 pandemic in Canada | |||||||
Reserve
- Compared to prescribing rates for the other "AWaRe" categories, rates in the "Reserve" category were lower, with minimal change observed between the pre-pandemic and pandemic periods. Between May 2016 and February 2020, antimicrobial prescriptions remained very low with a monthly average of 0.02 prescriptions per 1,000 inhabitants. Similarly, rates during the pandemic period remained also low with an average of 0.02 prescriptions per 1,000 inhabitants.
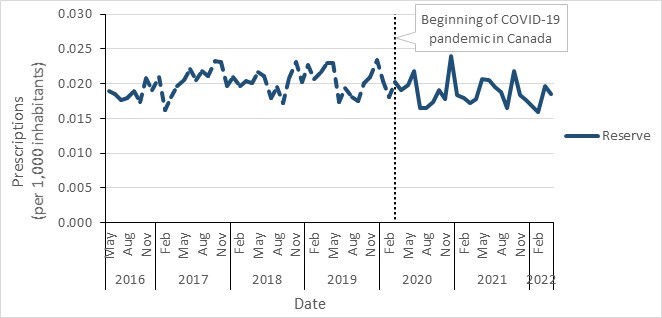
Figure 37 - Text description
| Reserve | 2016 | 2017 | 2018 | 2019 | 2020 | 2021 | 2022 |
|---|---|---|---|---|---|---|---|
| January | n/a | 0.021 | 0.021 | 0.023 | 0.020 | 0.018 | 0.017 |
| February | n/a | 0.016 | 0.020 | 0.021 | 0.018 | 0.018 | 0.016 |
| March | n/a | 0.018 | 0.020 | 0.022 | 0.020* | 0.017 | 0.020 |
| April | n/a | 0.020 | 0.020 | 0.023 | 0.019 | 0.018 | 0.019 |
| May | 0.019 | 0.020 | 0.022 | 0.023 | 0.020 | 0.021 | n/a |
| June | 0.018 | 0.020 | 0.021 | 0.017 | 0.022 | 0.021 | n/a |
| July | 0.018 | 0.022 | 0.018 | 0.019 | 0.016 | 0.020 | n/a |
| August | 0.018 | 0.020 | 0.020 | 0.018 | 0.016 | 0.019 | n/a |
| September | 0.019 | 0.022 | 0.017 | 0.018 | 0.017 | 0.017 | n/a |
| October | 0.017 | 0.021 | 0.021 | 0.020 | 0.019 | 0.022 | n/a |
| November | 0.021 | 0.023 | 0.023 | 0.021 | 0.018 | 0.018 | n/a |
| December | 0.019 | 0.020 | 0.020 | 0.023 | 0.024 | 0.018 | n/a |
| * Beginning of the COVID-19 pandemic in Canada | |||||||
Community antimicrobial prescriptions before and during the COVID-19 pandemic, stratified by sex, Canada, 2016–2022
- Compared to males, females received nearly 40% more antimicrobial prescriptions before and during the pandemic. In females, there was a 28.3% decrease in the average rate of monthly prescribing in the community between the pre-pandemic and the pandemic periods, from 63.2 to 45.3 prescriptions per 1,000 inhabitants.
- In males, similar trends were observed, there was a 31.8% decrease in the average rate of monthly prescribing in the community between the pre-pandemic and the pandemic periods, from 43.8 to 29.9 prescriptions per 1,000 inhabitants.
- In both sex groups, the rates of antimicrobial prescription remained low overall during the course of the pandemic. However, rates have slightly increased since June 2021, reaching a peak in November 2021 (20.5% and 20.0% increases in females and males, respectively) without returning to pre-pandemic levels.
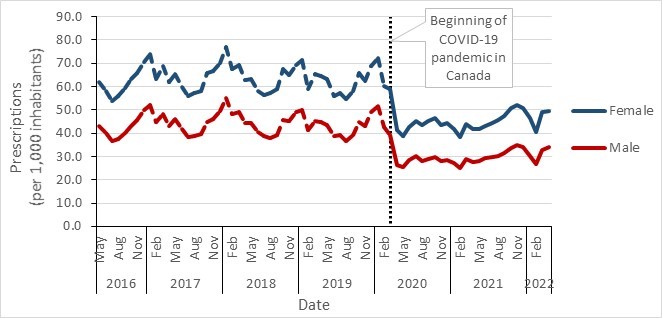
Figure 38 - Text description
| Male | 2016 | 2017 | 2018 | 2019 | 2020 | 2021 | 2022 |
|---|---|---|---|---|---|---|---|
| Jan | n/a | 52.2 | 54.9 | 50.0 | 51.5 | 27.2 | 30.3 |
| Feb | n/a | 44.7 | 48.3 | 41.4 | 42.4 | 25.0 | 26.8 |
| Mar | n/a | 48.4 | 48.9 | 45.4 | 39.3* | 29.0 | 32.9 |
| Apr | n/a | 43.3 | 44.3 | 44.8 | 26.1 | 27.8 | 34.1 |
| May | 43.2 | 45.9 | 44.2 | 43.7 | 25.6 | 28.0 | n/a |
| Jun | 40.0 | 41.7 | 40.3 | 38.9 | 28.7 | 29.1 | n/a |
| Jul | 36.7 | 38.5 | 38.7 | 39.0 | 30.0 | 29.7 | n/a |
| Aug | 37.6 | 38.6 | 38.0 | 36.8 | 28.2 | 30.2 | n/a |
| Sep | 39.9 | 39.5 | 39.3 | 39.2 | 28.9 | 31.5 | n/a |
| Oct | 43.1 | 44.9 | 45.8 | 44.6 | 29.7 | 33.7 | n/a |
| Nov | 45.5 | 46.1 | 45.0 | 43.0 | 28.0 | 35.0 | n/a |
| Dec | 50.0 | 49.4 | 49.1 | 48.9 | 28.4 | 34.0 | n/a |
| Female | 2016 | 2017 | 2018 | 2019 | 2020 | 2021 | 2022 |
| Jan | n/a | 74.0 | 77.2 | 71.4 | 72.3 | 42.0 | 46.4 |
| Feb | n/a | 63.2 | 67.3 | 59.1 | 60.2 | 38.3 | 40.4 |
| Mar | n/a | 69.0 | 69.2 | 65.3 | 59.1* | 43.8 | 48.9 |
| Apr | n/a | 61.7 | 62.9 | 64.4 | 41.5 | 41.8 | 49.6 |
| May | 61.8 | 65.4 | 63.2 | 63.1 | 39.0 | 41.9 | n/a |
| Jun | 58.0 | 59.7 | 58.0 | 55.9 | 42.7 | 43.0 | n/a |
| Jul | 53.9 | 55.9 | 56.6 | 57.2 | 45.2 | 44.6 | n/a |
| Aug | 56.0 | 57.3 | 57.2 | 54.8 | 43.7 | 45.8 | n/a |
| Sep | 59.5 | 58.3 | 58.8 | 58.2 | 45.3 | 47.5 | n/a |
| Oct | 63.4 | 65.7 | 67.7 | 65.7 | 46.5 | 50.7 | n/a |
| Nov | 65.8 | 66.6 | 65.0 | 62.2 | 43.5 | 51.9 | n/a |
| Dec | 70.6 | 70.0 | 69.3 | 68.9 | 44.2 | 50.6 | n/a |
| * Beginning of the COVID-19 pandemic in Canada | |||||||
Monthly antimicrobial prescriptions before and during COVID-19 in the community, stratified by age, Canada, 2016–2022
- Overall, higher rates of antibiotic prescriptions were reported in older age groups in both the pre-pandemic and pandemic periods.
- In all age groups, a sustained decline in the rate of community antibiotic prescribing was observed during the beginning of the pandemic.
- The magnitude of the decrease in antibiotic prescribing from pre-pandemic to during the pandemic was inversely proportional to age.
- The greatest decrease in the rate of antibiotic prescribing (54.7%) was observed in the youngest age group (0-18 years of age), from 45.4 to 20.5 prescriptions per 1,000 inhabitants.
- In contrast, only a 17.0% decrease in antibiotic prescriptions was reported in the age group of 80 years or more, from an average of 103.5 to 86.0 prescriptions per 1,000 inhabitants.
- Despite the rate of prescriptions remaining low overall during the course of the pandemic, a slight increase has been observed since June 2021, reaching a peak in November 2021, in all age groups. However, rates remain lower than pre-pandemic levels. The youngest age group of 0-18 years showed the most significant rise with an 83.5% increase between June and November 2021 (18.0 to 33.1 prescriptions per 1,000 inhabitants).
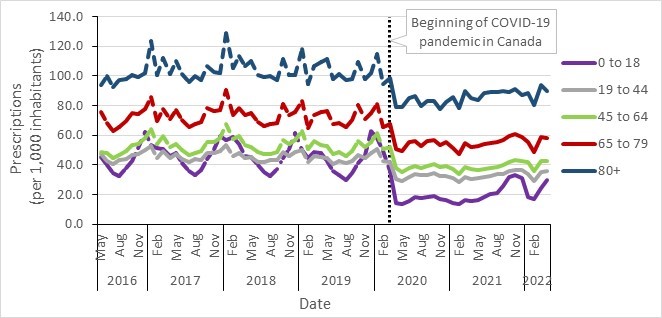
Figure 39 - Text description
| 0 to 18 years | 2016 | 2017 | 2018 | 2019 | 2020 | 2021 | 2022 |
|---|---|---|---|---|---|---|---|
| January | n/a | 53.7 | 56.8 | 50.0 | 58.1 | 14.0 | 18.6 |
| February | n/a | 51.2 | 58.9 | 44.8 | 49.5 | 13.5 | 17.0 |
| March | n/a | 51.0 | 54.4 | 48.7 | 35.7* | 16.2 | 24.7 |
| April | n/a | 46.1 | 46.1 | 47.7 | 14.2 | 15.9 | 29.5 |
| May | 45.5 | 47.7 | 45.5 | 42.4 | 13.5 | 16.3 | n/a |
| June | 40.1 | 41.5 | 39.9 | 36.0 | 15.9 | 18.0 | n/a |
| July | 34.3 | 35.8 | 34.9 | 33.4 | 18.5 | 20.5 | n/a |
| August | 32.8 | 32.9 | 32.2 | 29.7 | 17.8 | 21.3 | n/a |
| September | 38.2 | 36.5 | 37.5 | 34.6 | 18.3 | 26.1 | n/a |
| October | 42.6 | 44.0 | 44.4 | 41.3 | 19.1 | 31.5 | n/a |
| November | 51.5 | 50.5 | 50.6 | 46.6 | 17.2 | 33.1 | n/a |
| December | 62.5 | 59.6 | 61.7 | 63.1 | 16.3 | 31.1 | n/a |
| 19 to 44 years | 2016 | 2017 | 2018 | 2019 | 2020 | 2021 | 2022 |
| January | n/a | 52.5 | 53.7 | 50.2 | 50.7 | 31.4 | 33.8 |
| February | n/a | 44.7 | 46.1 | 42.1 | 42.4 | 28.3 | 29.2 |
| March | n/a | 49.5 | 48.1 | 45.9 | 41.6* | 32.0 | 34.9 |
| April | n/a | 44.6 | 44.8 | 45.0 | 30.2 | 30.7 | 35.8 |
| May | 47.0 | 47.6 | 45.1 | 44.7 | 28.8 | 30.9 | n/a |
| June | 42.6 | 44.0 | 42.1 | 40.6 | 31.8 | 31.6 | n/a |
| July | 40.7 | 42.3 | 42.3 | 42.4 | 34.1 | 32.6 | n/a |
| August | 43.0 | 43.7 | 43.2 | 41.0 | 33.2 | 33.7 | n/a |
| September | 44.2 | 43.1 | 43.2 | 42.4 | 33.5 | 33.7 | n/a |
| October | 46.4 | 47.7 | 48.4 | 46.7 | 34.6 | 35.6 | n/a |
| November | 47.6 | 48.1 | 46.2 | 44.3 | 32.4 | 36.7 | n/a |
| December | 49.8 | 49.6 | 48.5 | 47.7 | 32.6 | 36.2 | n/a |
| 45 to 64 years | 2016 | 2017 | 2018 | 2019 | 2020 | 2021 | 2022 |
| January | n/a | 64.3 | 67.8 | 62.7 | 61.4 | 37.0 | 41.8 |
| February | n/a | 53.7 | 57.4 | 50.8 | 50.5 | 33.7 | 35.8 |
| March | n/a | 59.5 | 59.4 | 55.8 | 52.1* | 38.8 | 42.5 |
| April | n/a | 51.7 | 53.2 | 53.6 | 37.7 | 37.0 | 42.3 |
| May | 48.5 | 54.2 | 52.1 | 52.8 | 35.0 | 36.8 | n/a |
| June | 47.9 | 49.7 | 48.4 | 47.2 | 37.9 | 37.4 | n/a |
| July | 44.9 | 46.7 | 47.5 | 48.4 | 39.5 | 37.7 | n/a |
| August | 46.6 | 48.0 | 47.7 | 46.3 | 37.7 | 38.6 | n/a |
| September | 49.5 | 49.2 | 49.0 | 49.4 | 39.1 | 39.8 | n/a |
| October | 53.5 | 55.4 | 57.1 | 56.0 | 40.4 | 42.0 | n/a |
| November | 54.2 | 55.6 | 53.9 | 51.9 | 38.4 | 43.3 | n/a |
| December | 58.3 | 58.4 | 57.1 | 55.7 | 39.3 | 42.7 | n/a |
| 65 to 79 years | 2016 | 2017 | 2018 | 2019 | 2020 | 2021 | 2022 |
| January | n/a | 85.7 | 90.4 | 82.9 | 81.3 | 51.6 | 55.3 |
| February | n/a | 69.6 | 73.7 | 65.0 | 65.3 | 47.5 | 48.9 |
| March | n/a | 77.9 | 78.2 | 73.7 | 67.9* | 54.9 | 58.7 |
| April | n/a | 71.1 | 73.4 | 75.5 | 50.5 | 52.2 | 58.2 |
| May | 75.6 | 76.8 | 75.1 | 76.3 | 49.3 | 52.9 | n/a |
| June | 68.6 | 70.0 | 68.6 | 67.3 | 55.4 | 54.4 | n/a |
| July | 62.8 | 65.2 | 66.4 | 68.4 | 56.3 | 54.9 | n/a |
| August | 65.6 | 67.7 | 67.5 | 65.8 | 52.9 | 55.5 | n/a |
| September | 69.9 | 69.1 | 68.4 | 70.1 | 55.9 | 57.0 | n/a |
| October | 74.8 | 78.3 | 81.2 | 80.1 | 57.1 | 59.7 | n/a |
| November | 74.5 | 76.0 | 73.9 | 71.2 | 53.6 | 60.7 | n/a |
| December | 77.8 | 77.3 | 75.5 | 74.8 | 55.6 | 58.7 | n/a |
| 80+ years | 2016 | 2017 | 2018 | 2019 | 2020 | 2021 | 2022 |
| January | n/a | 123.7 | 128.8 | 118.1 | 114.9 | 85.8 | 88.8 |
| February | n/a | 100.8 | 105.4 | 94.3 | 94.7 | 78.6 | 80.2 |
| March | n/a | 111.9 | 113.5 | 106.4 | 98.8* | 90.1 | 94.0 |
| April | n/a | 101.1 | 106.8 | 109.3 | 79.2 | 85.4 | 89.8 |
| May | 93.5 | 109.9 | 110.3 | 111.4 | 78.8 | 84.1 | n/a |
| June | 99.7 | 101.4 | 100.6 | 97.8 | 85.4 | 88.3 | n/a |
| July | 92.6 | 95.6 | 99.0 | 101.3 | 86.5 | 89.1 | n/a |
| August | 97.0 | 99.9 | 100.2 | 97.3 | 79.8 | 89.3 | n/a |
| September | 97.6 | 97.5 | 97.0 | 98.1 | 83.2 | 89.9 | n/a |
| October | 100.8 | 106.8 | 111.5 | 109.6 | 83.0 | 89.5 | n/a |
| November | 99.5 | 102.3 | 100.3 | 97.6 | 77.8 | 90.9 | n/a |
| December | 102.1 | 102.2 | 100.4 | 101.8 | 82.2 | 87.0 | n/a |
| * Beginning of the COVID-19 pandemic in Canada | |||||||
Antimicrobial use (AMU), antimicrobial resistance (AMR) and integrated AMR and AMU in animals/food and people in Canada
This section provides information on antimicrobials sold for use in animals, reported antimicrobial use (AMU) from sentinel terrestrial animal farms, and AMU from all aquaculture operations in Canada. The CIPARS farm component provides a unique opportunity to explore AMU and antimicrobial resistance (AMR) in the same populations; hence, we have also included integrated AMU and AMR findings using select indicators proposed for assessing progress in addressing AMR (European Centre for Disease Prevention and Control (89).
mg/PCUCA is an antimicrobial use metric that adjusts the quantity (milligram/mg) of antimicrobial used, consumed or distributed by the size of the population (Population Correction Unit-Canadian Standard).
Key findings
Antimicrobials sold for use in all animals in Canada
- Between 2019 and 2020, the quantity of antimicrobials sold for use in all animals increased by 6.5%, from 0.98 million to 1.05 million kg.
- Between 2019 and 2020, as measured in kg, sales of antimicrobials for use in poultry and aquaculture decreased; while sales for use in pigs, cattle, and small ruminants increased. Sales for use in horses and cats and dogs remained stable (less than 1% change).
- In comparison to 2020 data from 31 European countries, Canada distributed the sixth highest quantity of antimicrobials intended for use in animals. In 2020, the quantity of antimicrobials sold in Canada (mg/PCU) for production animals was three times higher than the median of the 31 European countries.
CIPARS farm-level surveillance of antimicrobial use and antimicrobial resistance: Broiler chickens, turkeys and grower-finisher pigs
- Between 2019 and 2020, reported AMU on sentinel farms decreased for broiler chickens, turkeys, and grower-finisher pigs. For poultry, when measured by kg antimicrobials reported, the trends for farm-level AMU and sales data were in the same direction. However, when measured by mg/PCUCA , sales for poultry increased from 2019 to 2020, and farm reported AMU decreased. For pigs, when measured by kg antimicrobials reported, farm AMU increased in 2019 and sales decreased; for 2020, there was a decrease in farm AMU with an increase in sales. However when using mg/PCUCA , the trends for farm-level AMU in grower-finisher pigs and sales move in the same direction.
- While doses and durations were in line with labelled claims for disease treatment and/or prevention, in 2020, there was reported growth promotion use of medically important antimicrobials in four sentinel herds.
- There was no reported use of medically important antimicrobials for growth promotion in sentinel broiler chicken or turkey flocks.
- Antimicrobial resistance (reported as the percentage of E. coli isolates resistant to three or more classes of antimicrobials) showed a decreasing trend between 2016 and 2020 across all three of these animal species.
Integrated antimicrobial use and antimicrobial resistance along the food chain: Third-generation cephalosporin-resistant Salmonella
- CIPARS surveillance data historically identified a concerning trend in third-generation cephalosporin-resistant Salmonella , which led to Canadian federal government action (label warnings), voluntary Canadian poultry industry interventions, and was historically included in the US Food and Drug Administrations federal order (90) to prohibit certain extra-label uses of this antimicrobial class in food animals.
- The interventions reduced the risk to human health from this antimicrobial-resistant bacterial pathogen.
Integrated information on antimicrobials intended for use across sectors (human, animals and crops)
- In 2020, approximately 82% of antimicrobials were sold for use in production animals, 17% for people, < 1% for cats and dogs and < 1% for plants/crops. Noting that there are many more animals than people in Canada; after adjusting for the underlying biomass, there were approximately 1.8 times more antimicrobials sold for use in production animals (food animals and horses) than for people.
Antimicrobials sold for use in animals in Canada
Changes to the Food and Drug Regulations (published in May 2017) aim to increase the oversight and promote the responsible use of antimicrobials available for use in animals. Since 2018, manufacturers, importers, and compounders must provide annual sales reports of medically important antimicrobials intended for use in animals (91). These reports replaced the data historically provided on a voluntary basis by the Canadian Animal Health Institute (CAHI).
To help with these reporting requirements, Health Canada and the Public Health Agency of Canada developed an online sales data collection system, called the Veterinary Antimicrobial Sales Reporting (VASR) system.
For the VASR data included in this report, unless specifically indicated, only information from manufacturers and importers are included, as compounders could purchase their products from manufacturers and importers; hence there is a risk of double counting.
This report categorizes antimicrobials according to their importance to human medicine as per a system developed by Health Canada’s Veterinary Drugs Directorate (92). In this system, Category I antimicrobials are considered of very high importance to human medicine (e.g., fluoroquinolones). Category II are of high importance to human medicine (e.g., macrolides), and Category III antimicrobials are of medium importance to human medicine (e.g., tetracyclines). Category IV antimicrobials (i.e., low importance to human medicine, such as ionophores) are not included in this document. In Canada, antimicrobials that are considered medically important can be found in Health Canada’s List A: List of certain antimicrobial active pharmaceutical ingredients.
The sales data are reported as kg, mg/PCU, and mg/kgbiomassSL.
PCU = population correction unit calculated by multiplying the number of animals by their average weight at treatment; mg/PCUEU = milligrams sold adjusted by the population correction unit using European standard weights at treatment; mg/PCUCA = milligrams sold adjusted by the population correction unit using Canadian standard weights at treatment; mg/kgbiomassSL = milligrams sold adjusted by the biomass of animals using a Canadian average live weight at time of slaughter.
Between 2019 and 2020, the quantity of medically important antimicrobials sold for use in all animals in Canada increased by 6.5% (0.98 million to 1.05 million kg). This was largely driven by sales of antimicrobials for production animals (farmed livestock, aquaculture and horses). The quantity of antimicrobials measured in milligrams (mg) per population correction unit (PCU) increased by 7.6% using both the Canadian (132 to 142 mg/PCU) standard weights of animals, and by 7.6% (144 to 155 mg/PCU) or the European standard weights of animals (144 to 155 mg/PCU). Regardless of the metric used, the quantity of antimicrobials sold for use in production animals decreased in 2019 in comparison to 2018, and increased again in 2020.
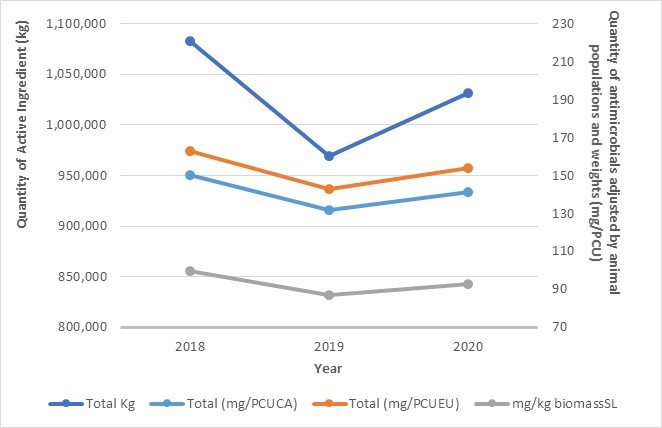
Figure 40 - Text description
| Annual quantity | 2018 | 2019 | 2020 |
|---|---|---|---|
| Total Kg | 1,082,768 | 968,984 | 1,031,775 |
| Total (mg/PCUEU) – European weights | 163 | 143 | 154 |
| Total (mg/PCUCA) – Canadian weights | 150 | 132 | 141 |
| Mg/kg biomassSL – Live weight at slaughter | 100 | 87 | 93 |
Notes: Population data used for live horses was from 2010. Production animals includes cattle (dairy, beef, veal), poultry, pigs, aquaculture, small ruminants, horses, and other/unknown species, and excludes cats and dogs. Data excludes antifungals, antiparasitics, antivirals, Category IV antimicrobials, and uncategorized not medically important antimicrobials.
In 2020, the top five classes of antimicrobials sold for use in all animals by weight were tetracyclines (546,427 kg), macrolides. (113,552 kg), penicillins (105,053 kg), sulfonamides (47,667 kg) and lincosamides (45,508 kg). Overall, less than one percent of antimicrobials sold for use in animals were Category I (very high importance to human medicine); furthermore, sales of Category I antimicrobials decreased by 5.2% between 2019 and 2020 (from 5,927 kg to 5,618 kg).
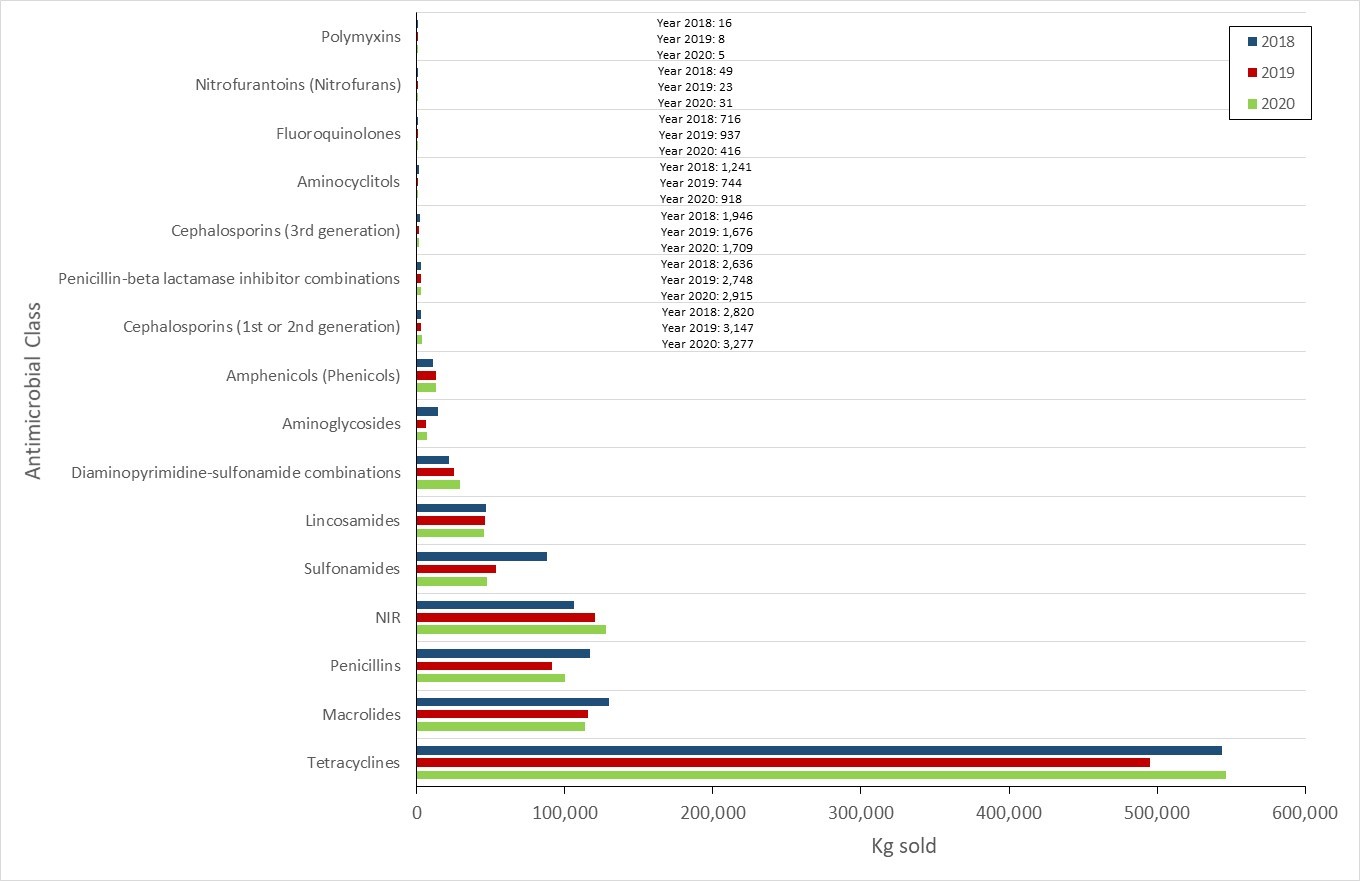
Figure 41 - Text description
| Antimicrobial Class | 2018 | 2019 | 2020 |
| Polymyxins | 16 | 8 | 5 |
| Nitrofurantoins (Nitrofurans) | 49 | 23 | 31 |
| Fluoroquinolones | 716 | 937 | 416 |
| Aminocyclitols | 1,241 | 744 | 918 |
| Cephalosporins (3rd generation) | 1,946 | 1,676 | 1,709 |
| Penicillin-beta lactamase inhibitor combinations | 2,636 | 2,748 | 2,915 |
| Cephalosporins (1st or 2nd generation) | 2,820 | 3,147 | 3,277 |
| Amphenicols (Phenicols) | 11,318 | 13,030 | 12,981 |
| Aminoglycosides | 14,467 | 6,487 | 6,937 |
| Diaminopyrimidine-sulfonamide combinations | 22,051 | 25,519 | 29,145 |
| Lincosamides | 46,583 | 46,390 | 45,508 |
| Sulfonamides | 88,274 | 53,226 | 47,667 |
| NIR | 106,121 | 120,455 | 127,738 |
| Penicillins | 117,222 | 91,095 | 100,117 |
| Macrolides | 129,579 | 115,822 | 113,504 |
| Tetracyclines | 544,102 | 495,116 | 546,427 |
Notes: Not independently reported (NIR) antimicrobials include aminocoumarins, bacitracins, diaminopyrimidines, fusidic acid, glycopeptides, nitroimidazoles, orthosomycins, phosphonic acid derivatives, pleuromutilins, pseudomonic acids, streptogramins, and therapeutic agents for tuberculosis. Data exclude antifungals, antiparasitics, antivirals, Category IV antimicrobials, and uncategorized not medically important antimicrobials.
Between 2019 and 2020, as measured in kg, sales of antimicrobials for use in poultry and aquaculture decreased; sales for use in pigs, cattle, and small ruminants increased; and sales for use in horses and cats and dogs remained stable. Similar trends were observed when sales were measured in milligrams adjusted for animal numbers and weights (PCU), with the exception of poultry which had a small increase in sales; however, the relative ranking of animal species by quantity of antimicrobial sales changed.
Aquaculture
- Between 2019 and 2020, kilograms of antimicrobials sold to aquaculture decreased by approximately 18%
- In 2020, the only antimicrobial classes sold for use in aquaculture were tetracyclines, amphenicols, and macrolides, which is consistent with farm-level data reported by the Department of Fisheries and Oceans Canada.
Beef cattle
- Kilograms of antimicrobials sold for use in beef cattle increased by approximately 10% between 2019 and 2020; notwithstanding a decrease of approximately 31% in the sales of Category I antimicrobials.
- In 2020, the top three antimicrobial classes sold for use in beef cattle were tetracyclines, macrolides, and streptogramins.
Dairy cattle
- Kilograms of antimicrobials sold for use in dairy cattle decreased by less than 1% between 2019 and 2020, with a notable ~52% increase in the sales of Category I antimicrobials.
- In 2020, the top three antimicrobial classes sold for use in dairy cattle were tetracyclines, diaminopyrimidine-sulfonamide combinations, and penicillins.
Poultry (chickens and turkeys)
- Between 2019 and 2020, the quantities (in kg) of antimicrobials sold for use in poultry decreased by approximately 2% and increased by 1% after adjusting for animal numbers and weights (biomass).
- In 2020, bacitracins, penicillins, and tetracyclines made up the highest quantity of antimicrobials sold for use in poultry.
- Small quantities (less than one kg each year) of fluoroquinolones (Category I, antimicrobials of very high importance to human medicine) were compounded for use in poultry between 2019 and 2020.
Pigs
- Kilograms of antimicrobials sold for use in pigs increased by approximately 9% between 2019 and 2020, despite a decrease of approximately 29% in the sales of Category I antimicrobials.
- In 2020, the top three antimicrobial classes sold for use in pigs were tetracyclines, penicillins, and macrolides.
Cats and dogs
- Kilograms of antimicrobials sold for use in cats and dogs was stable between 2019 and 2020 (< 1% change) with a decrease of ~2% in the sales of Category I antimicrobials.
- In 2020, the top three antimicrobial classes sold for use in cats and dogs were first- or second-generation cephalosporins, penicillin β-lactamase inhibitor combinations, and nitroimidazoles.
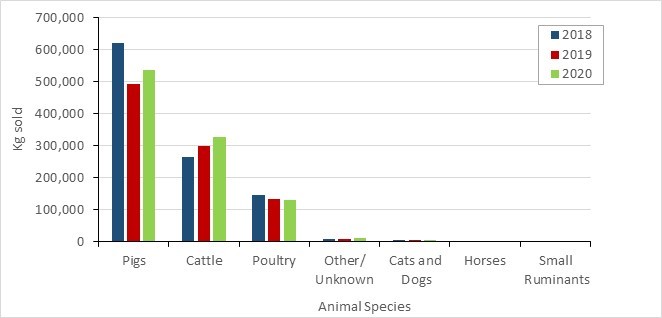
Figure 42 - Text description
| Animal species | 2018 | 2019 | 2020 |
|---|---|---|---|
| Pigs | 620,355 | 491,640 | 535,450 |
| Cattle | 266,343 | 297,810 | 328,221 |
| Poultry | 147,853 | 134,351 | 131,857 |
| Other/Unknown | 10,274 | 10,093 | 10,830 |
| Cats and Dogs | 6,373 | 7,439 | 7,519 |
| Horses | 1,236 | 1,504 | 1,511 |
| Small Ruminants | 43 | 68 | 93 |
Notes: Data excludes antifungals, antiparasitics, antivirals, Category IV antimicrobials, and uncategorized not medically important antimicrobials.

Figure 43 - Text description
| Animal Species | 2018 | 2019 | 2020 |
|---|---|---|---|
| Swine | 353.84 | 277.48 | 292.55 |
| Cattle | 67.07 | 72.72 | 81.49 |
| Poultry | 196.71 | 175.19 | 176.98 |
| Cats and dogs | 40.80 | 47.62 | 50.84 |
| Horses | 2.57 | 3.12 | 3.14 |
| Small ruminants | 0.79 | 1.25 | 1.74 |
PCUCA = population correction unit using Canadian average weights at treatment.
Notes: Data excludes antifungals, antiparasitics, antivirals, Category IV antimicrobials, and uncategorized not medically important antimicrobials.
Antimicrobials sold for use in animals: International perspective
The European Surveillance of Veterinary Antimicrobial Consumption (ESVAC) Network collects and reports data on the quantity of antimicrobials intended for use in animals in 31 European countries. This information is reported in mg/PCU and was the best publicly available source for country-specific international comparisons.
When compared to the latest data provided by ESVAC and making the assumption that the data are comparable, Canada ranked the sixth highest in terms of quantities (mg/PCU) of antimicrobials sold for use in production animals compared to European countries. In 2020, the quantity of antimicrobials sold in Canada (mg/PCU) for production animals was three times higher than the median of the 31 European countries.

Figure 44 - Text description
| European countries (2020) | European network countries (2020) - mg/PCU | Canada - mg/PCUCA | Canada - mg/PCUEU | Median of European network countries |
|---|---|---|---|---|
| Austria | 46.3 | 142 | 155 | 51.9 |
| Belgium | 103.4 | 142 | 155 | 51.9 |
| Bulgaria | 120.9 | 142 | 155 | 51.9 |
| Croatia | 68.6 | 142 | 155 | 51.9 |
| Cyprus | 344.2 | 142 | 155 | 51.9 |
| Czech Republic | 56.2 | 142 | 155 | 51.9 |
| Denmark | 37.2 | 142 | 155 | 51.9 |
| Estonia | 49.2 | 142 | 155 | 51.9 |
| Finland | 16.2 | 142 | 155 | 51.9 |
| France | 56.6 | 142 | 155 | 51.9 |
| Germany | 83.8 | 142 | 155 | 51.9 |
| Greece | 96.4 | 142 | 155 | 51.9 |
| Hungary | 169.9 | 142 | 155 | 51.9 |
| Iceland | 3.8 | 142 | 155 | 51.9 |
| Ireland | 47 | 142 | 155 | 51.9 |
| Italy | 181.8 | 142 | 155 | 51.9 |
| Latvia | 29.6 | 142 | 155 | 51.9 |
| Lithuania | 20.5 | 142 | 155 | 51.9 |
| Luxembourg | 29 | 142 | 155 | 51.9 |
| Malta | 115.8 | 142 | 155 | 51.9 |
| Netherlands | 50.2 | 142 | 155 | 51.9 |
| Norway | 2.3 | 142 | 155 | 51.9 |
| Poland | 187.9 | 142 | 155 | 51.9 |
| Portugal | 172.5 | 142 | 155 | 51.9 |
| Romania | 57.8 | 142 | 155 | 51.9 |
| Slovakia | 51.9 | 142 | 155 | 51.9 |
| Slovenia | 33.3 | 142 | 155 | 51.9 |
| Spain | 154.3 | 142 | 155 | 51.9 |
| Sweden | 11.1 | 142 | 155 | 51.9 |
| Switzerland | 34.3 | 142 | 155 | 51.9 |
| United Kingdom | 30.2 | 142 | 155 | 51.9 |
Notes: Data (manufacturer and importer data) excludes antifungals, antiparasitics, antivirals, Category IV antimicrobials, and uncategorized not medically important antimicrobials. The PCU denominator was harmonized to the greatest extent possible with the ESVAC network (the ESVAC denominator does not include beef cows, whereas in Canada beef cows are a significant population and are included). The Canadian data used for live horses was from 2010. Source: European Medicines Agency. European database of sales of veterinary antimicrobial agents. Available at: https://esvacbi.ema.europa.eu/analytics/saw.dll?PortalPages&PortalPath=/shared/ESVAC%20Public/_portal/Annual%20Report.
Accessed: September 7, 2022.
Farm-level surveillance of antimicrobial use and antimicrobial resistance
In 2020, AMU information and samples for AMR determination were voluntarily provided by 272 sentinel farms participating in CIPARS farm-level surveillance program (115 broiler chicken flocks, 61 turkey flocks, and 96 grower-finisher pig herds).
AMU data for aquaculture, accessed via Open Data on the Fisheries and Oceans Canada website (93), is reported in kilograms. For all other species under surveillance, AMU is reported using the following metric and indicators:
DDDvetCA - the "Canadian Defined Daily Dose for animals". The amount of antimicrobials given during a treatment (dose) will vary depending on the antimicrobial, how the antimicrobial is given (e.g., by injection, through water or feed) and the population treated (cattle, chickens, pigs).
nDDDvet/1000 animal-days - An antimicrobial use indicator that adjusts for both variation in the amount (dose) of antimicrobial given during a treatment (DDDvet; n=number), and the length of time that an animal or group of animals are under surveillance.
mg/PCUCA - An antimicrobial use indicator that adjusts the quantity (milligram/mg) of antimicrobial used by the size of the population.
Measurement of trends over time - Changes between years for AMU are measured as the percentage change.
Changes between years for AMR (using E. coli, resistant to 3 or more classes of antimicrobials as an indicator organism) are measured as the difference in percentages. More details can be found in the CIPARS 2018 Design and Methods (71).
Farm-level surveillance of antimicrobial use: CIPARS
The overall temporal trends for the farm-level AMU data for aquaculture are consistent with the reported sales data for aquaculture (using total kg). For grower-finisher pigs, when evaluating the data based on kg antimicrobial reported, farm AMU increased in 2019 and sales decreased, while in 2020, farm AMU decreased and sales increased. When using mg/PCUCA , the trends in farm AMU and sales move in the same direction. The relative predominance of antimicrobial classes reported for use in pigs differs between the farm data and the sales data, possibly because the farm data focuses on the grower-finisher production stage, whereas the sales data include all production stages.
For poultry, when evaluating the data based on kg antimicrobials reported, the trends over time are consistent between the farm AMU data and the poultry sales data. However, when using mg/PCUCA , the trend in farm level AMU (decreasing trend) is opposite to the poultry sales data (increasing trend). The relative predominance of antimicrobial classes reported for use in poultry also differs between the farm data and the sales data. These differences may be due to the farm AMU data being specific to each of the poultry sectors, whereas the sales data are collated across poultry species.
For the animal species where there is sentinel farm AMU surveillance data in 2020 (broiler chickens, grower-finisher pigs, and turkeys), more antimicrobials were used for disease prevention (primarily for the prevention of enteric diseases) than for disease treatment (respiratory, enteric, septicemia or lameness).
Grower-finisher pig herds
- Measured in Canadian defined daily doses per 1,000 grower-finisher pig-days at risk (nDDDvetCA/1,000 grower-finisher pig-days at risk), the majority of medically important antimicrobials reported for use in sentinel grower-finisher pig herds from 2017 to 2020 were Category II and III antimicrobials. The top three antimicrobial classes used in 2020 were macrolides, tetracyclines and penicillins (measured in nDDDvetCA/1,000 grower-finisher pig-days at risk).
- The total quantity of medically important antimicrobials used on sentinel grower-finisher pig herds decreased by 13.0% from 2019 to 2020 (measured in nDDDvetCA/1,000 grower-finisher pig-days at risk).
- The only reported Category I antimicrobial used in grower-finisher pigs at the farm-level was ceftiofur, administered by injection to individual animals. The quantity of ceftiofur used was very small compared to the quantity of Category II and III antimicrobials used.
- While doses and durations were in line with labelled claims for disease treatment and/or prevention, in 2020, there was reported use of medically important antimicrobials for growth promotion in four sentinel herds.
Broiler chicken flocks
- Measured in nDDDvetCA/1,000 broiler chicken-days at risk, the reported AMU has decreased over time (2016 to 2020). Within this decrease there has also been a decline in the relative use of Category II antimicrobials (particularly noted in the comparison of 2019 and 2020 to previous years). This change reflects the broiler chicken industry’s policy to shift away from preventive use of Category II antimicrobials.
- The top three antimicrobial classes used in 2020 were bacitracins, orthosomycins and trimethoprim-sulfonamides (measured in nDDDvetCA/1,000 broiler chicken-days at risk).
- The total quantity of medically important antimicrobials used on sentinel broiler chicken farms decreased by 19.0% from 2019 to 2020 (measured in nDDDvetCA/1,000 broiler chicken-days at risk) and decreased by 38.9% when compared with 2016.
- There was no reported use of Category I antimicrobials except in 2018 where there was very limited use of Category I antimicrobials (one flock at less than 0.1 fluoroquinolone-specific nDDDvetCA/1,000 broiler chicken-days at risk). There was no use of medically-important antimicrobials for growth promotion.
Turkey flocks
- Similar to the broiler chicken sector, the turkey sector has been eliminating the preventive use of certain antimicrobials, which has resulted in a shift from higher use of Category II antimicrobials in 2016 to 2018 to higher use of Category III in 2019 and 2020. The top three antimicrobial classes used in 2020 were similar to those in broiler chickens (bacitracins, orthosomycins and trimethoprim-sulfonamides, measured in nDDDvetCA/1,000 turkey-days at risk).
- The total quantity of medically important antimicrobials reported to be used on sentinel turkey farms decreased by 33.5% from 2019 to 2020 (measured in nDDDvetCA/1,000 turkey-days at risk) and decreased by 34.5% when compared with 2016.
- There was very limited reported use of Category I antimicrobials between 2017 and 2019 (one flock each year at less than 0.1 fluoroquinolone specific nDDDvetCA/1,000 turkey days at risk) and none were reported to be used in 2020. There was no use of medically-important antimicrobials for growth promotion.
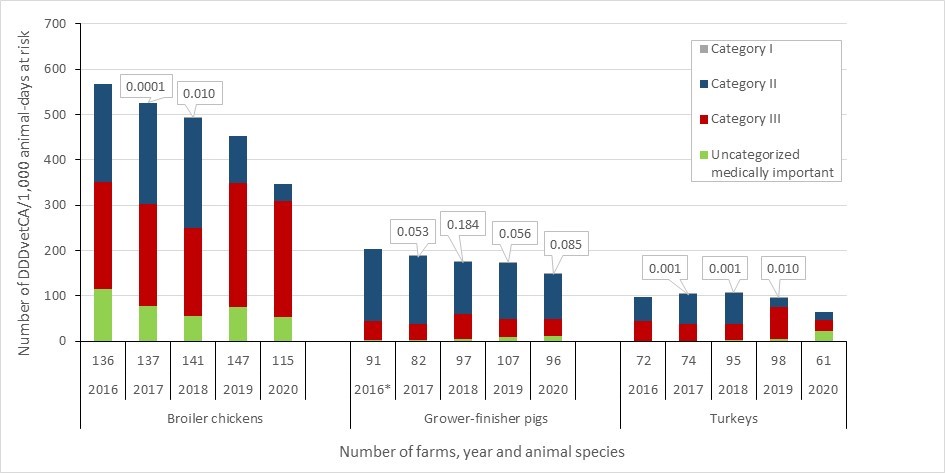
Figure 45 - Text description
| Broiler chickens | 2016 | 2017 | 2018 | 2019 | 2020 |
|---|---|---|---|---|---|
| Number of herds | 136.0 | 137.0 | 141.0 | 147.0 | 115.0 |
| Uncategorized medically important | 114.4 | 77.4 | 55.8 | 74.4 | 54.1 |
| Category III | 236.6 | 225.8 | 193.0 | 275.0 | 255.0 |
| Category II | 216.2 | 223.5 | 243.5 | 104.4 | 37.4 |
| Category I | 0.0 | 0.0 | 0.0 | 0.0 | 0.0 |
| Grower-finisher pigs | 2016 | 2017 | 2018 | 2019 | 2020 |
| Number of herds | 91.0 | 82.0 | 97.0 | 107.0 | 96.0 |
| Uncategorized medically important | 2.9 | 2.4 | 4.6 | 8.6 | 11.9 |
| Category III | 42.1 | 36.6 | 54.4 | 40.5 | 37.7 |
| Category II | 157.3 | 148.0 | 115.6 | 123.5 | 99.3 |
| Category I | 0.0 | 0.1 | 0.2 | 0.1 | 0.1 |
| Turkeys | 2016 | 2017 | 2018 | 2019 | 2020 |
| Number of herds | 72.0 | 74.0 | 95.0 | 98.0 | 61.0 |
| Uncategorized medically important | 0.0 | 0.0 | 2.5 | 3.8 | 21.9 |
| Category III | 44.1 | 37.3 | 35.5 | 72.1 | 24.6 |
| Category II | 52.6 | 66.0 | 68.6 | 19.5 | 16.9 |
| Category I | 0.0 | 0.0 | 0.0 | 0.0 | 0.0 |
Notes: Antimicrobial use is measured in number of defined daily doses per 1,000 animal-days at risk, which pertains to the number of animals per 1,000 that were treated daily with an average dose. Uncategorized medically important antimicrobials include tiamulin and avilamycin.
*Grower-finisher data in 2016 reflects in-feed AMU only as quantitative data for use in water and by injection was not available until 2017.
Antimicrobial use from aquaculture operations: Fisheries and Oceans Canada
- According to the "National Aquaculture Public Reporting Data" (93), total reported AMU for marine finfish and land-based freshwater aquaculture in 2020 was 7,850 kg. Of this total, three antimicrobial classes were used: erythromycin (<1% of total kg), florfenicol (55.5% of total kg), and oxytetracycline (44.4% of total kg). Erythromycin (a macrolide) falls under Category II of importance to human medicine, whereas florfenicol (a phenicol) and oxytetracycline (a tetracycline) are Category III antimicrobials.
Integrated antimicrobial resistance and antimicrobial use from farm-level surveillance: CIPARS
- Figure 46 shows the trends in AMR, expressed as resistance to three or more of the eight antimicrobial classes tested using the indicator organism, Escherichia coli and trends in AMU as measured in nDDDvetCA/1,000 animal-days . This figure is in line with international surveillance best practices to provide a general indication of changes in resistance in bacterial populations compared to changes in the total use of medically important antimicrobials. It is important to note that differences in antimicrobial classes used over time and across species may impact the relationship between AMR and AMU. The availability of farm-level data on the classes and active ingredients used allows for further investigation and analysis of these trends
- The data indicate that AMR trends decreased from 2016 to 2020 across all the terrestrial species under surveillance (broiler chickens: -16.0%; grower-finisher pigs: -21.0%, and; turkeys: -17.0%). A pronounced annual decrease was observed between 2019 and 2020 (broiler chickens: -13.0%, grower-finisher pigs: -13.0% and turkeys: -15.0%) that coincided with changes in veterinary drug legislation on antimicrobial use stewardship. These changes, implemented in December 2018, required medically important antimicrobials to be available by prescription only and growth promotion claims were removed from the labels of medically important antimicrobials. The decrease in AMR also coincided with decreasing trends in AMU (total nDDDvetCA/1,000 animal-days at risk) in broiler chickens, turkeys and grower-finisher pigs, The decrease in 2020 in grower-finisher pigs was primarily due to decreased use of Category II (macrolide) antimicrobials in feed.
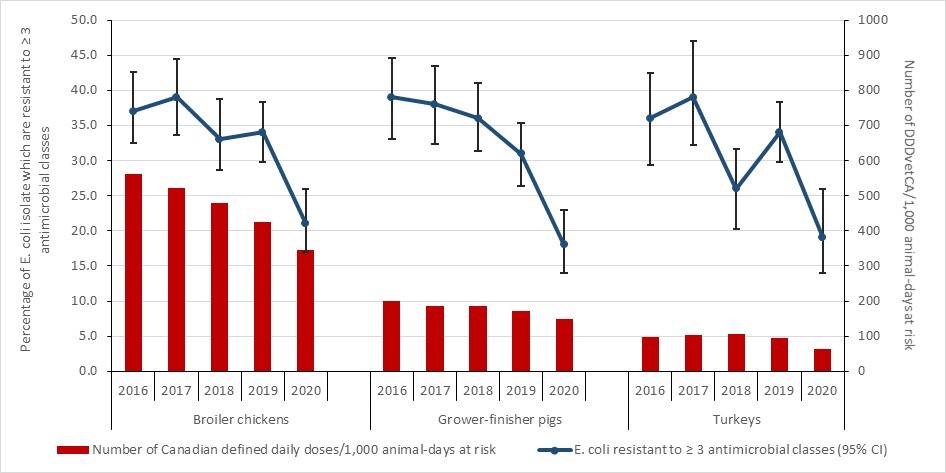
Figure 46 - Text description
| Broiler chickens | 2016 | 2017 | 2018 | 2019 | 2020 |
|---|---|---|---|---|---|
| Number of Canadian defined daily doses/1,000 animal-days at risk | 562.5 | 520.6 | 479.2 | 424.7 | 343.9 |
| E. coli resistant to ≥ 3 antimicrobial classes (95% CI) | 37 | 39 | 33 | 34 | 21 |
| Grower-finisher pigs | 2016 | 2017 | 2018 | 2019 | 2020 |
| Number of Canadian defined daily doses/1,000 animal-days at risk | 200.9 | 186.9 | 185.9 | 171.1 | 149.6 |
| E. coli resistant to ≥ 3 antimicrobial classes (95% CI) | 39 | 38 | 36 | 31 | 18 |
| Turkeys | 2016 | 2017 | 2018 | 2019 | 2020 |
| Number of Canadian defined daily doses/1,000 animal-days at risk | 96.7 | 103.3 | 106.6 | 95.2 | 63.3 |
| E. coli resistant to ≥ 3 antimicrobial classes (95% CI) | 36 | 39 | 26 | 34 | 19 |
Notes: Antimicrobial resistance is reported as the percentage of E. coli isolates resistant to three or more classes of antimicrobials tested (high and low error bars indicating the 95% confidence intervals). AMU data for grower-finisher pigs in 2016 only reflects use in-feed.
Research designed to inform surveillance expansion
CIPARS collaborated with the egg layer sector (2020 to 2021) to pilot a farm-level surveillance of AMU and AMR in 72-layer flocks from four major egg-producing provinces. Compared to the percentages of multiclass-resistant E. coli shown in Figure 46, in 2020, the percentage of E. coli isolates from egg layers that were resistant to three or more classes was 2.5% (i.e., lower than the frequency for the animal species in Figure 46). Among the antimicrobials tested, a moderate frequency of resistance to tetracycline (24.1%) was detected, which is lower than the findings from other animal species sampled by CIPARS at the farm level (e.g., broiler chickens: 35.0%, turkeys: 53.8%). Antimicrobial use records were available for nine flocks, and bacitracin and tetracycline were the only medically-important antimicrobials reported to be used.
Integrated AMU and AMR along the food chain
Third-generation Cephalosporin-resistant Salmonella Story
The health risk issue
- Between 2002 and 2004, CIPARS observed a concerning trend of third-generation cephalosporin resistance among Salmonella Heidelberg recovered from poultry and sick people. The third-generation cephalosporin resistance was notably higher in Quebec retail chicken and sick human isolates compared to those in Ontario.
How does this impact human health?
- Salmonella Heidelberg is among the top three Salmonella serovars in Canada and can cause invasive infections resulting in more severe illness in humans.
- Resistance to ceftiofur, a third-generation cephalosporin used in animals, confers resistance to ceftriaxone, a third-generation cephalosporin used in people. Third-generation cephalosporins are Category I antimicrobials (very high importance to human medicine) and ceftriaxone is used to treat salmonellosis in children and pregnant women.
Why was this happening?
- Extra-label drug use (ELDU) (94) of ceftiofur in broiler chicken hatcheries was possibly driving the frequency of third-generation cephalosporin resistance in Salmonella along the food-chain for poultry and in people.
Initial voluntary industry policy action
- Quebec chicken industry voluntarily banned ceftiofur use in hatching and day-old chicks beginning in early 2005 to 2007.
- CIPARS observed decreased third-generation cephalosporin resistance in Salmonella isolated from retail chicken and sick people as well as decreased third-generation cephalosporin resistance in E. coli along the food-chain for poultry (multiple bacterial species affected, suggestive of a common selective pressure rather than a circulating strain of resistant bacteria).
- The Quebec chicken industry resumed use of ceftiofur (rotational basis) in 2007 resulting in the re-emergence of third-generation cephalosporin resistance in retail chicken and human isolates.
Further policy action
- Health Canada’s Veterinary Drugs Directorate modified the ceftiofur drug label to advise against ELDU.
- The industry discontinued the use of Category I antimicrobials (which includes third-generation cephalosporins) for disease prevention purposes in broiler chickens and turkeys in May 2014 and the broiler breeder sector in May 2015.
International policy impact
- CIPARS data were cited at the American Congressional Hearings (2010) supporting a link between antimicrobial use in food-animals and negative impact on human health (95).
- Along with other information, CIPARS data was used by the United States Food and Drug Administration (US-FDA) to prohibit certain ELDU of cephalosporins (unless indicated) in the US (96).
Domestic policy impact
- The poultry industry AMU strategy resulted in a significant decrease in reported ceftiofur use at the hatcheries (to zero as reported by CIPARS sentinel farm surveillance since 2015) and a reduction in Salmonella resistant to third-generation cephalosporins from retail chicken and sick people.

Figure 47 - Text description
| Human | Retail | Slaughter | Farm chicken - unadjusted | Diagnostic / clinical cases | Farm Chicken (CEF AMU) | |
|---|---|---|---|---|---|---|
| 2003 | 6.5 | 31.5 | 6.6 | -2.0 | 8.1 | 0.0 |
| 2004 | 7.5 | 40.5 | 20.0 | -2.0 | 19.1 | 0.0 |
| 2005 | 5.3 | 13.8 | 14.0 | -2.0 | 10.5 | 0.0 |
| 2006 | 3.5 | 8.0 | 9.4 | -2.0 | 1.4 | 0.0 |
| 2007 | 2.1 | 9.9 | 11.9 | -2.0 | 12.6 | 0.0 |
| 2008 | 2.2 | 12.4 | 12.1 | -2.0 | 16.5 | 0.0 |
| 2009 | 2.8 | 22.7 | 25.4 | -2.0 | 8.2 | 0.0 |
| 2010 | 4.7 | 22.5 | 34.6 | -2.0 | 13.9 | 0.0 |
| 2011 | 6.9 | 31.0 | 31.7 | -2.0 | 9.3 | 0.0 |
| 2012 | 5.3 | 26.0 | 21.2 | -2.0 | 14.4 | 0.0 |
| 2013 | 5.6 | 25.9 | 19.4 | 23.9 | 20.8 | -1.0 |
| 2014 | 5.5 | 21.0 | 11.6 | 11.6 | 12.3 | -1.0 |
| 2015 | 5.5 | 12.5 | 5.8 | 12.5 | 7.9 | -1.0 |
| 2016 | 4.0 | 6.6 | 9.2 | 6.7 | 5.3 | -1.0 |
| 2017 | 3.4 | 6.0 | 3.6 | 4.1 | 6.2 | -1.0 |
| 2018 | 2.6 | 9.4 | 10.6 | 12.8 | 4.1 | -1.0 |
| 2019 | 3.7 | 6.2 | 9.4 | 7.6 | 4.5 | -1.0 |
Conclusions
- Surveillance is data for action.
- Historically, CIPARS surveillance data identified a concerning trend, which led to government action (label warnings), voluntary poultry industry interventions and was included in the US Food and Drug Administration’s federal order to prohibit certain extra-label uses of this antimicrobial class in food animals.
- The interventions reduced the risk to human health from this antimicrobial-resistant bacterial pathogen.
- This story has been used as an example of combined analysis and reporting (a best practice) by the World Health Organization's Advisory Group on Integrated Surveillance of Antimicrobial Resistance (AGISAR) in their Guidance Document of "Integrated Surveillance of Antimicrobial Resistance in Foodborne Bacteria: Application of a One Health Approach (97)."
Integrating information on antimicrobials intended for use across sectors (human, animals and crops)
The total kilograms of antimicrobials sold10 for use among the human, animal and plant/crop sectors was calculated through the integration of data sourced from IQVIA, CIPARS-VASR and the Health Canada’s Pest Management Regulatory Agency, respectively.
In 2020, a total of 1.3 million kg of medically important antimicrobials were sold in Canada. Sales for use in production animals represented approximately 82% of the total, humans represented approximately 17%, companion animals represented <1% and antimicrobials for use as pesticides on food crops represented <1%.
In 2020, there were approximately 22 animals for every human in Canada (an underestimate, as the numbers of fish are not included in the numbers of animals) (98) (99). When the biomass of people and animals were taken into account, this revealed that approximately 1.9 times more antimicrobials were intended for use in production animals than in people using European standard weights of animals and 1.8 times using Canadian standard weights of animals.
While similar antimicrobial groups were distributed or purchased for use in both sectors, the types of antimicrobials sold varied. Sales for antimicrobials in the animal sector reflected relatively more tetracyclines and macrolides than in the human sector. While there are other antimicrobial classes with relative differences in quantities between animals and humans, of note there were relatively more sales of the Category I antimicrobials, third generation (and higher generation) cephalosporins and fluoroquinolones in the human sector than the animal sector. In Canada, the carbapenem class antimicrobials and 4th generation cephalosporins have never been licensed for use in animals.
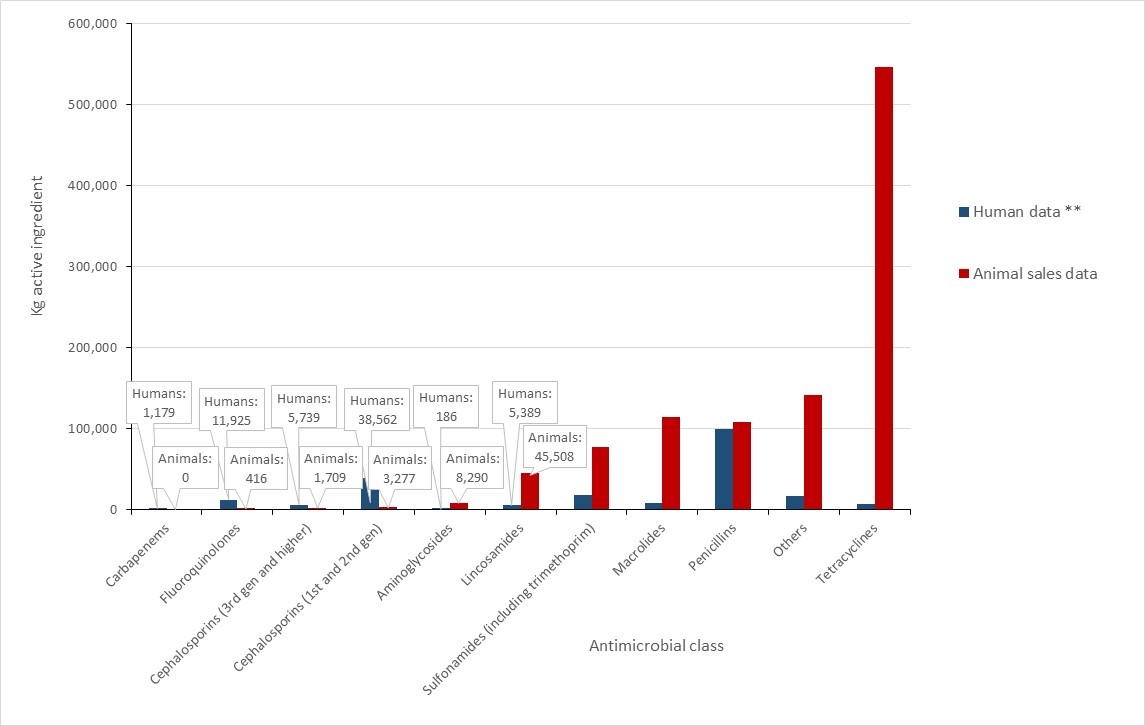
Figure 48 - Text description
| Antimicrobial class | Human data ** | Animal sales data |
| Carbapenems | 1,179.3 | 0.0 |
| Fluoroquinolones | 11,925.1 | 415.5 |
| Cephalosporins (3rd gen and higher) | 5,739.4 | 1,709.0 |
| Cephalosporins (1st and 2nd gen) | 38,561.6 | 3,277.4 |
| Aminoglycosides | 186.1 | 8,290.3 |
| Lincosamides | 5,389.2 | 45,507.7 |
| Sulfonamides (including trimethoprim) | 18,021.5 | 76,878.1 |
| Macrolides | 7,454.4 | 113,551.8 |
| Penicillins | 99,967.0 | 107,968.1 |
| Others | 17,112.1 | 141,606.9 |
| Tetracyclines | 7,333.1 | 546,426.9 |
| **includes human hospital and retail pharmacy | ||
Notes: Data sources: IQVIA (analyzed by CARSS) and CIPARS-VASR. Others for humans includes: bacitracins, 5th generation cephalosporins, fosfomycins, fusidic acid, glycopeptides, lipopeptides, macrocycles, monobactams, nitrofurans, nitroimidazoles, oxazolidinones, phenicols, and polymyxins. Others for animals includes: aminocoumarins, aminocyclitols, amphenicols, β-lactamase inhibitors, cyclic polypeptides (bacitracins), fusidic acid, glycopeptides, nitrofurantoins, nitroimidazoles, orthosomycins, phosphonic acid derivatives, pleuromutilins, polymyxins, pseudomonic acids, streptogramins, and therapeutic agents for tuberculosis.
Authors
| Primary author | Program | Contributing author | Program |
|---|---|---|---|
Stephanie Alexandre |
AMRTF |
Dr. Agnes Agunos |
CIPARS |
| Acknowledgements | |||
Agriculture and Agri-Food Canada |
|||
Appendices
Appendix A: Antibiotics ingredients within each WHO class and AWaRe categorization
| CLASS | AWaRe | ATC | MOLECULE |
|---|---|---|---|
| n/a | n/a | J01xx10 | Bacitracin |
| Aminocyclitols | Access | A07aa06 | Paromomycin |
| Aminoglycosides | Access | J01gb06 | Amikacin |
| Access | J01gb03 | Gentamicin | |
| Watch | J01ga01 | Streptomycin | |
| Watch | J01gb01 | Tobramycin | |
| Amphenicols | Access | J01ba01 | Chloramphenicol |
| Beta Lactamase Inhibitor | Access | J01cr02 | Amoxicillin:Clavulanic Acid |
| Watch | J01cr05 | Piperacillin:Tazobactam | |
| Carbapenems | Watch | J01dh03 | Ertapenem |
| Watch | J01dh41 | Imipenem:Cilastatin | |
| Watch | J01dh02 | Meropenem | |
| Second-generation Cephalosporins | Watch | J01dc04 | Cefaclor |
| Watch | J01dc01 | Cefoxitin | |
| Watch | J01dc10 | Cefprozil | |
| Watch | J01dc02 | Cefuroxime | |
| Third-generation Cephalosporins | Watch | J01dd08 | Cefixime |
| Watch | J01dd01 | Cefotaxime | |
| Watch | J01dd02 | Ceftazidime | |
| Watch | J01dd04 | Ceftriaxone | |
| Fourth-generation Cephalosporins | Watch | J01de01 | Cefepime |
| Fifth-generation Cephalosporins | Access | J01db05 | Cefadroxil |
| Access | J01db04 | Cefazolin | |
| Reserve | J01di01 | Ceftobiprole Medocaril | |
| Reserve | J01di54 | Ceftolozane:Tazobactam | |
| Access | J01db01 | Cephalexin | |
| Fluoroquinolones | Watch | J01ma02 | Ciprofloxacin |
| Watch | J01ma16 | Gatifloxacin | |
| Watch | J01ma12 | Levofloxacin | |
| Watch | J01ma14 | Moxifloxacin | |
| Watch | J01ma06 | Norfloxacin | |
| Watch | J01ma01 | Ofloxacin | |
| Glycopeptides | Reserve | J01xa04 | Dalbavancin |
| Reserve | J01xa03 | Telavancin | |
| Reserve | J01aa12 | Tigecycline | |
| Watch | A07aa09 | Vancomycin | |
| Watch | J01xa01 | Vancomycin | |
| Imidazoles | Access | J01xd01 | Metronidazole |
| Access | P01ab01 | Metronidazole | |
| Lincosamides | Access | J01ff01 | Clindamycin |
| Lipopeptides | Reserve | J01xx09 | Daptomycin |
| Macrolides | Watch | J01fa10 | Azithromycin |
| Watch | J01fa09 | Clarithromycin | |
| Watch | J01fa01 | Erythromycin | |
| Watch | A07aa12 | Fidaxomicin | |
| Watch | J01fa02 | Spiramycin | |
| Monobactams | Reserve | J01df01 | Aztreonam |
| Nitrofuran Derivatives | Access | J01xe01 | Nitrofurantoin |
| Oxazolidinones | Reserve | J01xx08 | Linezolid |
| Penicillins | Access | J01ca04 | Amoxicillin |
| Access | J01ca01 | Ampicillin | |
| Access | J01cf02 | Cloxacillin | |
| Access | J01ce01 | Penicillin G | |
| Access | J01ce08 | Penicillin G | |
| Access | J01ce09 | Penicillin G | |
| Access | J01ce02 | Penicillin V | |
| Access | J01ce10 | Penicillin V | |
| Watch | J01ca12 | Piperacillin | |
| Access | J01ca08 | Pivmecillinam | |
| Phosphonics | Watch | J01xx01 | Fosfomycin |
| Polymyxins | Reserve | J01xb01 | Colistin |
| Steroid Antibacterials | Watch | J01xc01 | Fusidic Acid |
| Sulfonamide Trimethoprim Combinations | Access | J01ee01 | Sulfamethoxazole:Trimethoprim |
| Sulfonamides | Access | J01ec02 | Sulfadiazine |
| Access | J01ec01 | Sulfamethoxazole | |
| Tetracyclines | Access | J01aa02 | Doxycycline |
| Watch | J01aa08 | Minocycline | |
| Access | J01aa07 | Tetracycline | |
| Trimethoprim Derivatives | Access | J01ea01 | Trimethoprim |
Appendix B: Participating CNISP hospitals
| Hospital Name | City | Province |
|---|---|---|
| Alberta Children’s Hospital | Calgary | AB |
| BC Children’s Hospital | Vancouver | BC |
| BC Women’s Hospital | Vancouver | BC |
| Bridgepoint Active Healthcare | Toronto | ON |
| Burin Peninsula Health Care Centre | Burin | NL |
| Carbonear General Hospital | Carbonear | NL |
| Centre hospitalier du l’Université de Montréal (CHUM) | Montréal | QC |
| Centre hospitalier Universitaire Sainte-Justine | Montréal | QC |
| Children’s Hospital of Eastern Ontario (CHEO) | Ottawa | ON |
| Children’s Hospital of Western Ontario | London | ON |
| Dartmouth General Hospital | Halifax | NS |
| Dr. GB Cross Memorial Hospital | Clarenville | NL |
| Foothills Medical Centre | Calgary | AB |
| General Hospital and Miller Centre | St. John’s | NL |
| Halifax Infirmary | Halifax | NS |
| Hamilton Health Sciences Centre - General Site | Hamilton | ON |
| Hamilton Health Sciences Centre - Jurvinski Hospital and Cancer Centre | Hamilton | ON |
| Health Sciences Centre – Winnipeg | Winnipeg | MB |
| Hôpital Maisonneuve-Rosemont | Montréal | QC |
| Hospital for Sick Children | Toronto | ON |
| Hôtel-Dieu de Québec | Québec | QC |
| IWK Health Centre | Halifax | NS |
| Janeway Children’s Hospital and Rehabilitation Centre | St. John’s | NL |
| Kelowna General Hospital | Kelowna | BC |
| Kingston General Hospital | Kingston | ON |
| Lachine General Hospital | Lachine | QC |
| Lion’s Gate, North Vancouver | Vancouver | BC |
| McGill University Health Centre - Montreal Children’s Hospital | Montréal | QC |
| McGill University Health Centre – Montreal General Hospital | Montréal | QC |
| McGill University Health Centre – Montreal Neurological Institute | Montréal | QC |
| McMaster Children’s Hospital | Hamilton | ON |
| Moose Jaw Hospital (Dr. FH Wigmore Regional Hospital) | Moose Jaw | SK |
| Mount Sinai Hospital | Toronto | ON |
| Nanaimo Regional General Hospital | Nanaimo | BC |
| North York General Hospital | Toronto | ON |
| Ottawa Hospital – Civic Campus | Ottawa | ON |
| Ottawa Hospital – General Campus | Ottawa | ON |
| Pasqua Hospital | Regina | SK |
| Peter Lougheed Centre | Calgary | AB |
| Powell River General Hospital | Powell River | BC |
| Prince County Hospital | Summerside | PE |
| Princess Margaret | Toronto | ON |
| Qikigtani General Hospital | Iqualuit | NU |
| Queen Elizabeth Hospital | Charlottetown | PE |
| Regina General Hospital | Regina | SK |
| Rehabilitation Centre | Halifax | NS |
| Richmond General Hospital | Richmond | BC |
| Rockyview General Hospital | Calgary | AB |
| Royal Jubilee | Victoria | BC |
| Royal University Hospital | Saskatoon | SK |
| Royal Victoria Hospital | Montréal | QC |
| Sechelt Hospital (formerly St. Mary’s) | Sechelt | BC |
| Sir Thomas Roddick Hospital | Stephenville | NL |
| SMBD – Jewish General Hospital | Montréal | QC |
| South Health Campus | Calgary | AB |
| Squamish General Hospital | Squamish | BC |
| St. Clare’s Mercy Hospital | St. John’s | NL |
| St. Joseph’s Healthcare | Hamilton | ON |
| St. Michael’s Hospital | Toronto | ON |
| St. Paul’s Hospital | Saskatoon | SK |
| Stollery Children’s Hospital | Edmonton | AB |
| Sudbury Regional Hospital | Sudbury | ON |
| Sunnybrook Hospital | Toronto | ON |
| The Moncton Hospital | Moncton | NB |
| Toronto General Hospital | Toronto | ON |
| Toronto Western Hospital | Toronto | ON |
| UBC Hospital | Vancouver | BC |
| University Hospital | London | ON |
| University Hospital of Northern BC | Prince George | BC |
| University of Alberta Hospital | Edmonton | AB |
| University of Manitoba Children’s Hospital | Winnipeg | MB |
| University of Ottawa Heart Institute | Ottawa | ON |
| Vancouver General Hospital | Vancouver | BC |
| Veterans Memorial Building | Halifax | NS |
| Victoria General | Halifax | NS |
| Victoria General Hospital | Victoria | BC |
| Victoria Hospital | London | ON |
| Western Memorial Regional Hospital | Corner Brook | NL |
Footnotes
- Formerly Clostridium difficile.
- Since 2013, the Public Health Agency of Canada (PHAC) has recommended treating gonorrhea using dual therapy consisting of a third-generation cephalosporin (Cefixime 800mg or Ceftriaxone 250mg) and Azithromycin (1g). However, specific treatment combinations for gonorrhea are specified for gay, bisexual and other men who have sex with men (gbMSM), and non-gbMSM youth and adults. The dual combination therapy of ceftriaxone and azithromycin is the preferred treatment for uncomplicated anogenital infections among gbMSM and pharyngeal infections in all youth and other adults. Cefixime and azithromycin is an additional preferred treatment for uncomplicated anogenital infections among non-gbMSM youth and adults. Alternative treatments are specified when there are contraindications to cephalosporins, or if there are indications of emerging resistance. While it is reasonable to provide either the preferred or alternative gonorrhea treatment, use of alternative treatments is reserved for when indicated. Of note, PHAC’s recommended alternative treatments have changed over time (from 2013 to 2020) (44) (48)
- Methodology details can be found in the ESAG methods: https://www.canada.ca/en/public-health/services/publications/diseases-conditions/2015-2017-report-enhanced-surveillance-antimicrobial-resistant-gonorrhea.html#a4
- PCV13 serotypes are vaccine preventable while vaccination has no efficacy on non-PCV13 serotypes.
- antimicrobialstewardship.com
- ncas-australia.org/naps
- Hospital NAPS™ appropriateness definitions, Melbourne Health. Adapted with permission for use in the Canadian National Antimicrobial Prescribing Survey. NAPS™ is a trade mark of Melbourne Health.
- Defined as May 2016 to February 2020.
- Defined as March 2020 to April 2022.
- There are differences in the data collection frameworks, data providers involved, types of data, and analysis of the data across these sectors. For this report, the different sources of data (i.e., sales data, human pharmacy dispensations, and hospital purchase data) are combined under one heading of "antimicrobial sales".
References
- Murray CJ, Ikuta KS, Sharara F, Swetschinski L, Aguilar GR, Gray A, et al. Global burden of bacterial antimicrobial resistance in 2019: a systematic analysis. Lancet. 2022;399:629-655. doi: https://doi.org/10.1016/S0140-6736(21)02724-0
- Council of Canadian Academies (CCA). Forecasting the future of antimicrobial resistance (AMR) in Canada. 2019; Available at: https://cca-reports.ca/forecasting-the-future-of-amr/.
- Hawkins O, Scott AM, Montgomery A, Nicholas B, Mullan J, van Oijen A, et al. Comparing public attitudes, knowledge, beliefs and behaviours towards antibiotics and antimicrobial resistance in Australia, United Kingdom, and Sweden (2010-2021): a systematic review, meta-analysis, and comparative policy analysis. PLoS One 2022;17(1):e0261917.
- Infectious Diseases Society of America and Research!America. AMR Survey. 2018; Available at: https://www.researchamerica.org/blog/new-survey-more-80-americans-are-concerned-antibiotic-resistance-health-threat. Accessed July/04, 2022.
- Crago AL, Alexandre S., Abdesselam K., GravelTropper D., Hartmann M., Smith G., et al. Understanding Canadians' Knowledge, Attitudes, and Practices Related to Antimicrobial Resistance and Antibiotic Use: Results from Public Opinion research 2019-2022. Can Commun Dis Rep. IN PRESS
- Martin AJ, Shulder S, Dobrzynski D, Quartuccio K, Pillinger KE. Antibiotic Use and Associated Risk Factors for Antibiotic Prescribing in COVID-19 Hospitalized Patients. J Pharm Pract. 2021 Jul 22:8971900211030248. doi: 10.1177/08971900211030248. Epub ahead of print. PMID: 34291681.
- Langford BJ, So M, Raybardhan S, Leung V, Soucy JR, Westwood D, et al. Antibiotic prescribing in patients with COVID-19: rapid review and meta-analysis. Clinical microbiology and infection 2021;27(4):520-531.
- Canadian Nosocomial Infection Surveillance Program (CNISP). Healthcare-associated infections and antimicrobial resistance in Canadian acute care hospitals, 2016-2020. Can Commun Dis Rep 2022;48(7/8):308-24
- Noble W, Valkenburg H, Wolters CH. Carriage of Staphylococcus aureus in random samples of a normal population. Epidemiology & Infection 1967;65(4):567-573.
- Diederen B, Kluytmans J. The emergence of infections with community-associated methicillin resistant Staphylococcus aureus. J Infect 2006;52(3):157-168.
- Cimolai N. Methicillin-resistant Staphylococcus aureus in Canada: a historical perspective and lessons learned. Can J Microbiol 2010;56(2):89-120.
- Loewen K, Schreiber Y, Kirlew M, Bocking N, Kelly L. Community-associated methicillin-resistant Staphylococcus aureus infection: Literature review and clinical update. Can Fam Physician 2017 Jul;63(7):512-520.
- Linden, P.K. 2007a, "Optimizing therapy for vancomycin-resistant enterococci (VRE)", Seminars in respiratory and critical care medicine© Thieme Medical Publishers, pp. 632.
- Centers for Disease Control and Prevention (CDC). Antibiotic resistance in the United States. 2019:2022.
- Ahmed MO, Baptiste KE. Vancomycin-Resistant Enterococci : A Review of Antimicrobial Resistance Mechanisms and Perspectives of Human and Animal Health. Microbial Drug Resistance 2018 06/01; 2022/08;24(5):590-606.
- Public Health Agency of Canada (PHAC). Surveillance of Vancomycin Resistant Enterococci Bloodstream Infections in CNISP Hospitals. 2018;2022.
- Adeolu M, Alnajar S, Naushad S, Gupta RS. Genome-based phylogeny and taxonomy of the ‘Enterobacterales’: proposal for Enterobacterales ord. nov. divided into the families Enterobacteriaceae, Erwiniaceae fam. nov., Pectobacteriaceae fam. nov., Yersiniaceae fam. nov., Hafniaceae fam. nov., Morganellaceae fam. nov., and Budviciaceae fam. nov. Int J Syst Evol Microbiol 2016;66(12):5575-5599.
- Budhram DR, Mac S, Bielecki JM, Patel SN, Sander B. Health outcomes attributable to carbapenemase-producing Enterobacteriaceae infections: A systematic review and meta-analysis. Infection Control & Hospital Epidemiology 2020;41(1):37-43.
- Falagas ME, Karageorgopoulos DE, Nordmann P. Therapeutic options for infections with Enterobacteriaceae producing carbapenem-hydrolyzing enzymes. Future microbiology 2011;6(6):653-666.
- Mataseje LF, Abdesselam K, Vachon J, Mitchel R, Bryce E, Roscoe D, et al. Results from the Canadian nosocomial infection surveillance program on carbapenemase-producing Enterobacteriaceae , 2010 to 2014. Antimicrob Agents Chemother 2016;60(11):6787-6794.
- Nordmann P, Naas T, Poirel L. Global spread of Carbapenemase-producing Enterobacteriaceae . Emerg Infect Dis 2011 Oct;17(10):1791-1798.
- Mataseje L, Bryce E, Roscoe D, Boyd D, Embree J, Gravel D, et al. Carbapenem-resistant gram-negative bacilli in Canada 2009–10: results from the Canadian Nosocomial Infection Surveillance Program (CNISP). J Antimicrob Chemother 2012;67(6):1359-1367.
- Asokan GV, Ramadhan T, Ahmed E, Sanad H. WHO Global Priority Pathogens List: A Bibliometric Analysis of Medline-PubMed for Knowledge Mobilization to Infection Prevention and Control Practices in Bahrain. Oman Med J 2019 May;34(3):184-193.
- Goldfarb D, Harvey S, Jessamine K, Jessamine P, Toye B, Desjardins M. Detection of plasmid-mediated KPC-producing Klebsiella pneumoniae in Ottawa, Canada: evidence of intrahospital transmission. J Clin Microbiol 2009;47(6):1920-1922.
- Van Duin D, Kaye KS, Neuner EA, Bonomo RA. Carbapenem-resistant Enterobacteriaceae : a review of treatment and outcomes. Diagn Microbiol Infect Dis 2013;75(2):115-120.
- Schaeffler H, Breitrueck A. Clostridium difficile –from colonization to infection. Frontiers in microbiology 2018;9:646.
- Smits WK, Lyras D, Lacy DB, Wilcox MH, Kuijper EJ. Clostridium difficile Nature reviews Disease primers 2016;2(1):1-20.
- Rineh A, Kelso MJ, Vatansever F, Tegos GP, Hamblin MR. Clostridium difficile infection: molecular pathogenesis and novel therapeutics. Expert review of anti-infective therapy 2014;12(1):131-150.
- Zhu D, Sorg JA, Sun X. Clostridioides difficile biology: sporulation, germination, and corresponding therapies for C. difficile infection. Frontiers in cellular and infection microbiology 2018;8:29.
- Reigadas E, Vazquez-Cuesta S, Onori R, Villar-Gomara L, Alcala L, Marin M, et al. Clostridioides difficile contamination in a clinical microbiology laboratory? Clinical Microbiology and Infection 2020;26(3):340-344.
- Kato H, Hagihara M, Asai N, Shibata Y, Yamagishi Y, Iwamoto T, et al. A systematic review and meta-analysis of decontamination methods to prevent hospital environmental contamination and transmission of Clostridioides difficile . Anaerobe 2022;73:102478.
- McDonald LC, Gerding DN, Johnson S, Bakken JS, Carroll KC, Coffin SE, et al. Clinical practice guidelines for Clostridium difficile infection in adults and children: 2017 update by the Infectious Diseases Society of America (IDSA) and Society for Healthcare Epidemiology of America (SHEA). Clinical infectious diseases 2018;66(7):e1-e48.
- Zhong P, Dazhi J, Kim HB, Stratton Charles W., Bin W, Tang Yi-Wei, et al. Update on Antimicrobial Resistance in Clostridium difficile: Resistance Mechanisms and Antimicrobial Susceptibility Testing. J Clin Microbiol 2017 07/01; 2022/07;55(7):1998-2008.
- Eubank TA, Gonzales-Luna AJ, Hurdle JG, Garey KW. Genetic mechanisms of vancomycin resistance in Clostridioides difficile: a systematic review. Antibiotics 2022;11(2):258.
- Spigaglia P. Recent advances in the understanding of antibiotic resistance in Clostridium difficile Ther Adv Infect Dis 2016 Feb;3(1):23-42.
- Carlson, T., Blasingame, D., Gonzales-Luna, A., Alnezary, F. & Garey, K. 2020, Clostridioides difficile ribotype 106: A systematic review of the antimicrobial susceptibility, genetics, and clinical outcomes of this common worldwide strain, Anaerobe, vol. 62, pp. 102142
- Knight, D.R., Squire, M.M., Collins, D.A. & Riley, T.V. 2017, Genome analysis of Clostridium difficile PCR ribotype 014 lineage in Australian pigs and humans reveals a diverse genetic repertoire and signatures of long-range interspecies transmission", Frontiers in microbiology, vol. 7, pp. 2138.
- Chan YA, Hackett KT, Dillard JP. The lytic transglycosylases of Neisseria gonorrhoeae . Microbial drug resistance (Larchmont, NY) 2012;18(3):271-279.
- Unemo M, Shafer WM. Antimicrobial resistance in Neisseria gonorrhoeae in the 21st century: past, evolution, and future. Clin Microbiol Rev 2014;27(3):587-613.
- Bodie M, Gale-Rowe M, Alexandre S, Auguste U, Tomas K, Martin I. Addressing the rising rates of gonorrhea and drug-resistant gonorrhea: There is no time like the present. Can Commun Dis Rep 2019 Feb 7;45(2-3):54-62.
- Public Health Agency of Canada (PHAC). Report on sexually transmitted infection surveillance in Canada, 2019. 2022; Available at: https://www.canada.ca/en/public-health/services/publications/diseases-conditions/report-sexually-transmitted-infection-surveillance-canada-2019.html#s5-3]%202022. Accessed October/05, 2022.
- Public Health Agency of Canada (PHAC). Notifiable Diseases Online. 2022; Available at: https://diseases.canada.ca/notifiable/. Accessed October/05, 2022.
- Sánchez-Busó L, Yeats CA, Taylor B, Goater RJ, Underwood A, Abudahab K, et al. A community-driven resource for genomic epidemiology and antimicrobial resistance prediction of Neisseria gonorrhoeae at Pathogenwatch. Genome medicine 2021;13(1):1-22.
- Public Health Agency of Canada (PHAC). Gonorrhea guide: Treatment and follow up. 2022; Available at: https://www.canada.ca/en/public-health/services/infectious-diseases/sexual-health-sexually-transmitted-infections/canadian-guidelines/gonorrhea/treatment-follow-up.html#a2_1. Accessed August/10, 2022.
- Public Health Agency of Canada (PHAC). Canadian Antimicrobial Resistance Surveillance Report - Update 2020. 2020; Available at: https://www.canada.ca/en/public-health/services/publications/drugs-health-products/canadian-antimicrobial-resistance-surveillance-system-2020-report.html.
- Lefebvre B, Martin I, Demczuk W, Deshaies L, Michaud S, Labbe AC, et al. Ceftriaxone-Resistant Neisseria gonorrhoeae , Canada, 2017. Emerg Infect Dis 2018 Feb;24(2):10.3201/eid2402.171756. Epub 2018 Feb 17.
- Smyczek P, Chu A, Berenger B. Emerging international strain of multidrug-resistant Neisseria gonorrhoeae: Infection in a man with urethral discharge. Canadian Family Physician 2019;65(8):552-554.
- Public Health Agency of Canada (PHAC). Sexually transmitted and blood-borne infections: Guides for health professionals – Gonorrhea guide. 2022; Available at: https://www.canada.ca/en/public-health/services/infectious-diseases/sexual-health-sexually-transmitted-infections/canadian-guidelines.html. Accessed August/10, 2022.
- Maitra A, Munshi T, Healy J, Martin LT, Vollmer W, Keep NH, et al. Cell wall peptidoglycan in Mycobacterium tuberculosis: An Achilles’ heel for the TB-causing pathogen. FEMS Microbiol Rev 2019;43(5):548-575.
- Tornheim JA, Dooley KE. Tuberculosis associated with HIV infection. Microbiology spectrum 2017;5(1):5.1. 30.
- Lyon SM, Rossman MD. Pulmonary tuberculosis. Microbiology spectrum 2017;5(1):5.1. 24.
- Chakaya J, Khan M, Ntoumi F, Aklillu E, Fatima R, Mwaba P, et al. Global Tuberculosis Report 2020–Reflections on the Global TB burden, treatment and prevention efforts. International Journal of Infectious Diseases 2021;113:S7-S12.
- Mounchili A, Perera R, Lee RS, Njoo H, Brooks J. Chapter 1: Epidemiology of tuberculosis in Canada. Canadian Journal of Respiratory, Critical Care, and Sleep Medicine 2022;6(sup1):8-21.
- Cooper R, Houston S, Hughes C, Johnston JC. Chapter 10: Treatment of active tuberculosis in special populations. Canadian Journal of Respiratory, Critical Care, and Sleep Medicine 2022;6(sup1):149-166.
- Bogaert D, de Groot R, Hermans P. Streptococcus pneumoniae colonisation: the key to pneumococcal disease. The Lancet infectious diseases 2004;4(3):144-154.
- European Centre for Disease Control and Prevention (ECDC). Factsheet about pneumococcal disease. 2022; Available at: https://www.ecdc.europa.eu/en/pneumococcal-disease/facts. Accessed July/2022, 2022.
- Demczuk W, Griffith A, Singh R, Montes K, Sawatzky P, Martin I. National laboratory surveillance of invasive streptococcal disease in Canada-annual summary 2013. 2013; Available at: https://www.canada.ca/en/public-health/services/publications/drugs-health-products/laboratory-surveillance-invasive-streptococcal-disease-annual-summary-2013.html. Accessed october 11, 2022.
- Mandell LA, Marrie TJ, Grossman RF, Chow AW, Hyland RH, Canadian CAP Working Group. Summary of Canadian guidelines for the initial management of community-acquired pneumonia: an evidence-based update by the Canadian Infectious Disease Society and the Canadian Thoracic Society. Canadian Journal of Infectious Diseases 2000;11(5):237-248.
- Tleyjeh IM, Tlaygeh HM, Hejal R, Montori VM, Baddour LM. The impact of penicillin resistance on short-term mortality in hospitalized adults with pneumococcal pneumonia: a systematic review and meta-analysis. Clinical infectious diseases 2006;42(6):788-797.
- Hausdorff WP, Feikin DR, Klugman KP. Epidemiological differences among pneumococcal serotypes. The Lancet infectious diseases 2005;5(2):83-93.
- Golden A, Griffith A, Demczuk W, Lefebvre B, McGeer A, Tyrrell G, et al. Invasive pneumococcal disease surveillance in Canada, 2020. CCDRCANADA 2022;48(9):396.
- Kanwal S, Vaitla P. Streptococcus Pyogenes. StatPearls Treasure Island (FL): StatPearls Publishing LLC; 2020.
- Avire NJ, Whiley H, Ross K. A Review of Streptococcus pyogenes: Public health risk factors, prevention and control. Pathogens 2021;10(2):248.
- Demczuk W, Martin I, Domingo FR, MacDonald D, Mulvey MR. Identification of Streptococcus pyogenes M1UK clone in Canada. Lancet Infect Dis 2019 Dec;19(12):1284-1285.
- Cunningham MW. Pathogenesis of group A streptococcal infections. Clin Microbiol Rev 2000;13(3):470-511.
- Lynskey NN, Lawrenson RA, Sriskandan S. New understandings in Streptococcus pyogenes. Curr Opin Infect Dis 2011;24(3):196-202.
- Mandell, L.A., Marrie, T.J., Grossman, R.F., Chow, A.W., Hyland, R.H. & Canadian CAP Working Group 2000, "Summary of Canadian guidelines for the initial management of community-acquired pneumonia: an evidence-based update by the Canadian Infectious Disease Society and the Canadian Thoracic Society", Canadian Journal of Infectious Diseases, vol. 11, no. 5, pp. 237-248.
- Rafei R, Iaali RA, Osman M, Dabboussi F, Hamze M. A global snapshot on the prevalent macrolide-resistant emm types of Group A Streptococcus worldwide, their phenotypes and their resistance marker genotypes during the last two decades: A systematic review. Infection, Genetics and Evolution 2022:105258.
- Mao Y, Zeineldin M, Usmani M, Uprety S, Shisler JL, Jutla A, et al. Distribution and antibiotic resistance profiles of Salmonella enterica in rural areas of North Carolina after Hurricane Florence in 2018. GeoHealth 2021;5(2):e2020GH000294.
- Public Health Agency of Canada (PHAC). Pethogen Safety Data Sheets: Infectious Substances - Salmonella enterica 2010; Available at: https://www.canada.ca/en/public-health/services/laboratory-biosafety-biosecurity/pathogen-safety-data-sheets-risk-assessment/salmonella-enterica.html. Accessed October/18, 2022.
- Public Health Agency of Canada (PHAC). Canadian Integrated Program for Antimicrobial Resistance Surveillance (CIPARS) 2018: Design and Methods. 2020; Available at: https://www.canada.ca/en/public-health/services/surveillance/canadian-integrated-program-antimicrobial-resistance-surveillance-cipars/cipars-reports/2018-annual-report-design-methods.html. Accessed 12/01, 2020.
- Yu D, Banting G, Neumann NF. A review of the taxonomy, genetics, and biology of the genus Escherichia and the type species Escherichia coli. Can J Microbiol 2021;67(8):553-571.
- Kai A, Konishi N, Obata H. Diarrheagenic Escherichia coli. Nihon Rinsho 2010 Jun;68 Suppl 6:203-207.
- Wijetunge D, Gongati S, DebRoy C, Kim K, Couraud P, Romero I, et al. Characterizing the pathotype of neonatal meningitis causing Escherichia coli (NMEC). BMC microbiology 2015;15(1):1-15.
- Allocati N, Masulli M, Alexeyev MF, Di Ilio C. Escherichia coli in Europe: an overview. International journal of environmental research and public health 2013;10(12):6235-6254.
- Karlowsky JA, Lagacé-Wiens PR, Simner PJ, DeCorby MR, Adam HJ, Walkty A, et al. Antimicrobial resistance in urinary tract pathogens in Canada from 2007 to 2009: CANWARD surveillance study. Antimicrob Agents Chemother 2011;55(7):3169-3175.
- Saatchi A, Yoo JW, Marra F. Outpatient prescribing and prophylactic antibiotic use for recurrent urinary tract infections in British Columbia, Canada. Can Urol Assoc J 2021 Dec;15(12):397-404.
- Paczosa MK, Mecsas J. Klebsiella pneumoniae: going on the offense with a strong defense. Microbiology and Molecular Biology Reviews 2016;80(3):629-661.
- Li B, Zhao Y, Liu C, Chen Z, Zhou D. Molecular pathogenesis of Klebsiella pneumoniae. Future microbiology 2014;9(9):1071-1081.
- Bassetti M, Righi E, Carnelutti A, Graziano E, Russo A. Multidrug-resistant Klebsiella pneumoniae: challenges for treatment, prevention and infection control. Expert review of anti-infective therapy 2018;16(10):749-761.
- Noble W, Valkenburg H, Wolters CH. Carriage of Staphylococcus aureus in random samples of a normal population. Epidemiology & Infection 1967;65(4):567-573.
- Archer GL. Staphylococcus aureus: a well-armed pathogen. Rev Infect Dis 1998;26(5):1179-1181.
- Salgado-Pabón W, Breshears L, Spaulding AR, Merriman JA, Stach CS, Horswill AR, et al. Superantigens are critical for Staphylococcus aureus Infective endocarditis, sepsis, and acute kidney injury. MBio 2013;4(4):e00494-13.
- Musser JM, Schlievert PM, Chow AW, Ewan P, Kreiswirth BN, Rosdahl VT, et al. A single clone of Staphylococcus aureus causes the majority of cases of toxic shock syndrome. Proc Natl Acad Sci U S A 1990 Jan;87(1):225-229.
- Vestergaard M, Frees D, Ingmer H. Antibiotic resistance and the MRSA problem. Microbiology spectrum 2019;7(2):7.2. 18.
- Bartlett JG, Dowell SF, Mandell LA, File Jr TM, Musher DM, Fine MJ. Practice guidelines for the management of community-acquired pneumonia in adults. Clinical infectious diseases 2000;31(2):347-382.
- Yılmaz EŞ, Aslantaş Ö. Antimicrobial resistance and underlying mechanisms in Staphylococcus aureus Asian Pacific journal of tropical medicine 2017;10(11):1059-1064.
- Centers for Disease Control and Prevention (CDC) 2022, 2022 Special report: COVID-19 U.S. impact on antimicrobial resistance. Available: https://www.cdc.gov/drugresistance/pdf/covid19-impact-report-508.pdf [2022, Sept/23].
- European Centre for Disease Prevention and Control (ECDC), European Food Safety Authority (EFSA), European Medicines Agency (EMA) 2017, "ECDC, EFSA and EMA Joint Scientific Opinion on a list of outcome indicators as regards surveillance of antimicrobial resistance and antimicrobial consumption in humans and food-producing animals", vol. 15, no. 10.
- United States Department of Health and Human Services, Food and Drug Administration. New Animal Drugs; Cephalosporin Drugs; Extralabel Animal Drug Use; Order of Prohibition. 2012;77(4).
- Health Canada, Veterinary Drugs Directorate. List A: List of certain antiList A: List of certain antimicrobial active pharmaceutical ingredientsmicrobial active pharmaceutical ingredients. 2018; Available at: https://www.canada.ca/en/public-health/services/antibiotic-antimicrobial-resistance/animals/veterinary-antimicrobial-sales-reporting/list-a.html. Accessed 05/12, 2020.
- Health Canada. Categorization of Antimicrobial Drugs Based on Importance in Human Medicine. 2009; Available at: https://www.canada.ca/en/health-canada/services/drugs-health-products/veterinary-drugs/antimicrobial-resistance/categorization-antimicrobial-drugs-based-importance-human-medicine.html.
- Fisheries and Oceans Canada. Aquaculture public reporting. Open data. National Aquaculture Public Reporting Data. Available at: https://open.canada.ca/data/en/dataset/288b6dc4-16dc-43cc-80a4-2a45b1f93383. Accessed September/08, 2022.
- Health Canada. Extra-Label Drug Use (ELDU) in Animals. 2014; Available at: https://www.canada.ca/en/health-canada/services/drugs-health-products/veterinary-drugs/extra-label-drug-use.html.
- Hearings Before the Subcommittee on Health of the House Committee on Energy and Commerce 2010, "ANTIBIOTIC RESISTANCE AND THE USE OF ANTIBIOTICS IN ANIMAL AGRICULTURE", .
- US FDA. New Animal Drugs; Cephalosporin Drugs; Extralabel Animal Drug Use; Order of Prohibition. 2012;77(4):735.
- WHO AGISAR. Integrated Surveillance of Antimicrobial Resistance in Foodborne Bacteria: Application of a One Health Approach. 2017.
- Statistics Canada. Table 17-10-0005-01 Population estimates on July 1st, by age and sex. 2022; Available at: https://www150.statcan.gc.ca/t1/tbl1/en/tv.action?pid=1710000501.
- Public Health Agency of Canada (PHAC). Canadian Integrated Program for Antimicrobial Resistance Surveillance (CIPARS) 2018: Figures and tables. 2020.
Page details
- Date modified: