
Page 6: Human Antimicrobial Use Report – 2014 - Hospital Purchasing Data
Hospital Purchasing Data
The Canadian Drugstore and Hospital Purchases Audit (CDH) dataset includes the dollar value and unit volume of antimicrobial products purchased by Canadian hospitals located in the provinces. Information was collected from a representative sample of over 675 hospitals. A method of geographical projection was used to create projection factors for a "universe" of approximately 750 hospitals to reflect all Canadian Hospital purchases. This dataset is the base data purchased from IMS Health Canada Inc. for analyses performed by the Government of Canada and presented here.
National purchasing
In 2014, 38,340 kilograms of antimicrobials were purchased by hospitals in Canada, at a cost of just greater than $104 millionFootnote 1. When adjusted for the number of hospital discharges that occurred, this amounts to approximately 6.4 defined daily doses of antimicrobial per discharge. This rate has remained fairly stable over the 2002 – 2014 period of surveillance, as seen in Figure 3.1. Similarly, the proportion of oral and parenteral products has remained stable over time, with 50 to 57% of DDDs of antimicrobials purchased for oral administration.
Figure 3.1: DDDs per discharge, kilograms of active ingredient per 1,000 discharges, and cost per discharge for antimicrobials purchased by Canadian hospitals, 2002 – 2014

Figure 3.1 - Text Description
| Route of administration | 2002 | 2003 | 2004 | 2005 | 2006 | 2007 | 2008 | 2009 | 2010 | 2011 | 2012 | 2013 | 2014 |
|---|---|---|---|---|---|---|---|---|---|---|---|---|---|
| Oral | 3.4 | 3.6 | 3.5 | 3.5 | 3.5 | 3.6 | 3.7 | 3.7 | 3.3 | 3.5 | 3.4 | 3.5 | 3.4 |
| Parenteral | 3.4 | 3.1 | 2.8 | 2.9 | 3.0 | 2.9 | 2.8 | 3.1 | 3.0 | 3.1 | 3.2 | 3.0 | 2.9 |
| TOTAL | 6.8 | 6.6 | 6.4 | 6.4 | 6.6 | 6.5 | 6.5 | 6.8 | 6.3 | 6.7 | 6.6 | 6.4 | 6.4 |
The antimicrobials with the most DDDs purchased in 2014 were ciprofloxacin, amoxicillin, azithromycin, and ceftriaxone, with 0.65, 0.45, 0.45, and 0.44 DDDs purchased per hospital discharge, respectively (Table 3.1). Interestingly, the purchasing of ciprofloxacin and amoxicillin have remained relatively stable over the 2002 – 2014 period of surveillance, while azithromycin and ceftriaxone purchasing has increased (Figure 3.2).
| Antimicrobial | Rank | DIRI | 2004 | 2005 | 2006 | 2007 | 2008 | 2009 | 2010 | 2011 | 2012 | 2013 | 2014 |
|---|---|---|---|---|---|---|---|---|---|---|---|---|---|
| Amoxicillin | 2 | - | 382.8 | 418.9 | 363.3 | 350.3 | 351.2 | 376.5 | 392.9 | 407.4 | 415.2 | 433.6 | 455.6 |
| Amoxicillin and enzyme inhibitor | 7 | - | 131.9 | 157.6 | 182.0 | 142.6 | 149.9 | 173.5 | 174.1 | 210.1 | 236.5 | 238.6 | 314.2 |
| Ampicillin | 16 | - | 236.6 | 366.0 | 396.3 | 244.9 | 201.8 | 190.3 | 176.5 | 172.6 | 165.3 | 162.6 | 160.1 |
| Azithromycin | 3 | - | 249.8 | 264.4 | 225.7 | 281.9 | 308.0 | 348.0 | 356.4 | 404.7 | 456.1 | 481.1 | 446.5 |
| Cefazolin | 6 | - | 493.9 | 493.9 | 465.6 | 532.4 | 549.8 | 584.4 | 546.3 | 535.7 | 541.7 | 448.2 | 399.1 |
| Cefoxitin | 8 | - | 753.4 | 601.6 | 583.0 | 583.4 | 514.9 | 621.7 | 468.4 | 456.5 | 361.6 | 264.0 | 312.4 |
| Ceftriaxone | 4 | - | 129.7 | 140.9 | 151.2 | 180.2 | 219.3 | 270.3 | 272.9 | 335.0 | 366.0 | 413.0 | 440.0 |
| Cefuroxime | 18 | - | 206.6 | 199.0 | 167.3 | 178.8 | 157.9 | 159.9 | 140.9 | 160.7 | 142.8 | 133.9 | 144.2 |
| Cephalexin | 13 | - | 222.4 | 243.1 | 298.3 | 197.4 | 195.7 | 197.7 | 179.2 | 193.5 | 201.1 | 208.1 | 207.1 |
| Ciprofloxacin | 1 | - | 703.4 | 648.0 | 692.3 | 676.5 | 664.8 | 649.0 | 569.4 | 557.4 | 599.9 | 690.6 | 643.5 |
| Clarithromycin | 20 | - | 216.0 | 217.2 | 210.9 | 215.4 | 217.9 | 228.7 | 189.6 | 193.7 | 172.6 | 131.9 | 125.1 |
| Clindamycin | 15 | - | 121.7 | 126.6 | 191.9 | 207.0 | 204.4 | 207.8 | 191.5 | 193.8 | 189.1 | 293.5 | 187.4 |
| Cloxacillin | 11 | - | 261.1 | 252.2 | 239.6 | 236.6 | 226.8 | 251.7 | 222.0 | 233.4 | 230.4 | 221.7 | 235.0 |
| Doxycycline | 5 | - | 178.0 | 159.5 | 173.9 | 290.5 | 474.5 | 313.3 | 332.7 | 410.1 | 337.4 | 366.4 | 417.5 |
| Ertapenem | 23 | Table 3.1 - Footnote * | 3.0 | 7.3 | 12.2 | 15.5 | 23.2 | 31.2 | 36.5 | 50.5 | 57.9 | 62.8 | 67.1 |
| Erythromycin | 25 | - | 70.5 | 72.3 | 64.4 | 63.6 | 56.6 | 52.0 | 39.0 | 46.7 | 34.1 | 28.4 | 34.4 |
| Levofloxacin | 14 | - | 293.4 | 260.6 | 226.5 | 225.6 | 229.5 | 251.6 | 216.2 | 236.8 | 221.9 | 210.9 | 201.0 |
| Meropenem | 21 | Table 3.1 - Footnote * | 46.9 | 40.6 | 63.7 | 72.2 | 82.6 | 98.8 | 96.2 | 98.0 | 94.7 | 101.5 | 103.6 |
| Moxifloxacin | 12 | Table 3.1 - Footnote * | 156.6 | 232.5 | 315.1 | 337.2 | 338.5 | 340.9 | 295.7 | 289.4 | 266.1 | 221.8 | 210.1 |
| Nitrofurantoin | 17 | - | 121.6 | 126.3 | 128.6 | 126.1 | 120.9 | 122.2 | 137.7 | 149.4 | 148.8 | 139.9 | 148.0 |
| Penicillin G | 19 | - | 66.0 | 64.8 | 59.8 | 64.9 | 58.8 | 61.2 | 190.5 | 219.4 | 219.1 | 116.7 | 135.3 |
| Piperacillin and enzyme inhibitor | 9 | Table 3.1 - Footnote * | 69.4 | 91.7 | 105.5 | 131.5 | 144.9 | 202.8 | 209.4 | 259.9 | 270.9 | 276.7 | 295.5 |
| Sulfamethoxazole and trimethoprim | 10 | - | 304.2 | 310.5 | 321.1 | 301.0 | 293.1 | 302.6 | 278.2 | 279.1 | 274.9 | 269.8 | 260.3 |
| Tobramycin | 22 | Table 3.1 - Footnote * | 16.1 | 29.1 | 77.2 | 84.3 | 76.2 | 72.0 | 69.4 | 62.5 | 62.3 | 57.5 | 96.0 |
| Vancomycin | 24 | - | 47.6 | 51.6 | 37.6 | 34.2 | 36.7 | 45.3 | 68.2 | 81.1 | 81.6 | 59.5 | 62.1 |
| TOTAL | - | - | 6377.4 | 6408.0 | 6568.4 | 6508.5 | 6535.4 | 6782.3 | 6255.1 | 6672.9 | 6573.8 | 6418.8 | 6363.5 |
Of the 12 DIRI, moxifloxacin and piperacillin with enzyme inhibitor were used at the highest rates (Figure 3.2). Moxifloxacin purchasing increased dramatically between 2004 and 2007, remained at a high, stable rate from 2007 to 2009, and then declined year over year from 2009 to 2014. Purchasing of piperacillin with enzyme inhibitor has increased year over year from 2004 to 2014. Use of meropenem and ertapenem has gradually increased over the period of surveillance, and daptomycin use has been increasing gradually since the first purchases in 2008. Gentamicin use has been declining since 2006, following a sharp increase in use from 2004 to 2006. However, since 2014 there have been problems with gentamicin supplies, with hospitals purchasing tobramycin instead (personal communication, Dr. Daniel Thirion).
Figure 3.2: Patterns in DDDs per 1,000 discharges from 2002 to 2014 for antimicrobials of last recourse
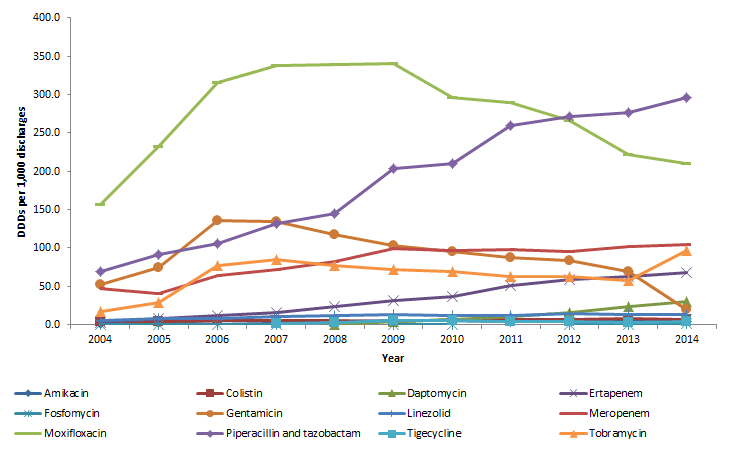
Figure 3.2 - Text Description
| Antimicrobial | Year | ||||||||||||
|---|---|---|---|---|---|---|---|---|---|---|---|---|---|
| 2002 | 2003 | 2004 | 2005 | 2006 | 2007 | 2008 | 2009 | 2010 | 2011 | 2012 | 2013 | 2014 | |
| Amikacin | 2.1 | 2.0 | 1.0 | 2.9 | 4.5 | 4.2 | 4.1 | 4.9 | 4.6 | 3.7 | 5.0 | 3.5 | 3.6 |
| Colistin | 4.3 | 4.0 | 3.5 | 3.1 | 4.7 | 5.1 | 5.2 | 4.0 | 6.1 | 5.9 | 6.0 | 7.8 | 6.8 |
| Daptomycin | - | - | - | - | - | - | 0.3 | 3.3 | 5.9 | 10.1 | 16.0 | 23.9 | 30.3 |
| Ertapenem | - | 0.3 | 3.0 | 7.3 | 12.2 | 15.5 | 23.2 | 31.2 | 36.5 | 50.5 | 57.9 | 62.8 | 67.1 |
| Fosfomycin | 0.0 | 0.0 | 0.0 | 0.0 | 0.0 | 0.0 | - | 0.0 | 0.0 | - | 0.1 | 0.2 | 0.6 |
| Gentamicin | 108.3 | 80.4 | 51.9 | 74.1 | 136.1 | 133.7 | 117.6 | 102.3 | 95.2 | 87.1 | 82.9 | 68.4 | 19.7 |
| Linezolid | 3.2 | 4.0 | 4.6 | 7.3 | 8.1 | 10.1 | 12.0 | 13.2 | 11.7 | 12.0 | 13.9 | 12.7 | 12.2 |
| Meropenem | 44.4 | 43.8 | 46.9 | 40.6 | 63.7 | 72.2 | 82.6 | 98.8 | 96.2 | 98.0 | 94.7 | 101.5 | 103.6 |
| Moxifloxacin | 44.5 | 75.6 | 156.6 | 232.5 | 315.1 | 337.2 | 338.5 | 340.9 | 295.7 | 289.4 | 266.1 | 221.8 | 210.1 |
| Piperacillin and tazobactam | 28.2 | 52.9 | 69.4 | 91.7 | 105.5 | 131.5 | 144.9 | 202.8 | 209.4 | 259.9 | 270.9 | 276.7 | 295.5 |
| Tigecycline | - | - | - | - | - | 0.9 | 2.2 | 4.4 | 4.4 | 3.5 | 3.5 | 3.0 | 3.2 |
| Tobramycin | 79.9 | 31.0 | 16.1 | 29.1 | 77.2 | 84.3 | 76.2 | 72.0 | 69.4 | 62.5 | 62.3 | 57.5 | 96.0 |
Provincial purchasing
Similar to the variation seen in the community pharmacy dispensing data, there was a large amount of variation in hospital purchasing of antimicrobials in 2014 among the provinces (Figure 3.3). Manitoba has had more DDDs of antimicrobial purchased per discharge than any other province since 2003. In contrast, Ontario has purchased the fewest DDDs of antimicrobial per discharge since 2012. Differences in provincial purchasing also occur at the individual drug level (Table 3.2).
Figure 3.3: DDDs per discharge in 2014 for oral and parenteral products purchased by hospitals in Canada, by province
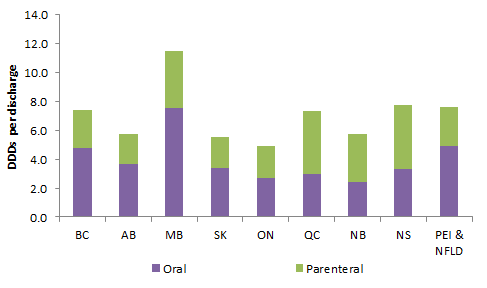
Figure 3.3 - Text Description
| BC | AB | MB | SK | ON | QC | NB | NS | PEI & NFLD | |
|---|---|---|---|---|---|---|---|---|---|
| Oral | 4.8 | 3.7 | 7.5 | 3.4 | 2.7 | 3.0 | 2.4 | 3.3 | 4.9 |
| Parenteral | 2.7 | 2.1 | 4.0 | 2.2 | 2.2 | 4.4 | 3.3 | 4.4 | 2.7 |
Figure 3.4: Patterns in DDDs per discharge 2002 to 2014 for antimicrobials purchased by hospitals in Canada, by province
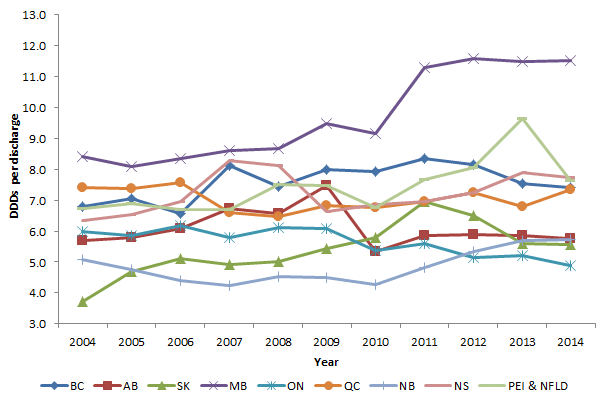
Figure 3.4 - Text Description
| 2004 | 2005 | 2006 | 2007 | 2008 | 2009 | 2010 | 2011 | 2012 | 2013 | 2014 | |
|---|---|---|---|---|---|---|---|---|---|---|---|
| BC | 6.8 | 7.0 | 6.6 | 8.1 | 7.5 | 8.0 | 7.9 | 8.4 | 8.2 | 7.5 | 7.4 |
| AB | 5.7 | 5.8 | 6.1 | 6.7 | 6.6 | 7.5 | 5.3 | 5.9 | 5.9 | 5.9 | 5.8 |
| SK | 3.7 | 4.7 | 5.1 | 4.9 | 5.0 | 5.4 | 5.8 | 6.9 | 6.5 | 5.6 | 5.6 |
| MB | 8.4 | 8.1 | 8.3 | 8.6 | 8.7 | 9.5 | 9.2 | 11.3 | 11.6 | 11.5 | 11.5 |
| ON | 6.0 | 5.9 | 6.2 | 5.8 | 6.1 | 6.1 | 5.4 | 5.6 | 5.1 | 5.2 | 4.9 |
| QC | 7.4 | 7.4 | 7.6 | 6.6 | 6.5 | 6.8 | 6.8 | 7.0 | 7.3 | 6.8 | 7.3 |
| NB | 5.1 | 4.8 | 4.4 | 4.2 | 4.5 | 4.5 | 4.3 | 4.8 | 5.3 | 5.7 | 5.7 |
| NS | 6.3 | 6.5 | 7.0 | 8.3 | 8.1 | 6.6 | 6.9 | 7.0 | 7.2 | 7.9 | 7.7 |
| PEI & NFLD | 6.7 | 6.9 | 6.7 | 6.7 | 7.5 | 7.5 | 6.8 | 7.7 | 8.1 | 9.6 | 7.6 |
| Antimicrobial | RankTable 3.2 - Footnote * | DIRI | BC | AB | SK | MB | ON | QC | NB | NS | PEI & NFLD |
|---|---|---|---|---|---|---|---|---|---|---|---|
| Amoxicillin | 2 | - | 609.5 | 405.1 | 518.1 | 2302.3 | 290.8 | 300.6 | 225.6 | 360.9 | 930.0 |
| Amoxicillin and enzyme inhibitor | 7 | - | 299.6 | 341.6 | 160.7 | 566.4 | 189.7 | 489.1 | 246.3 | 269.2 | 422.9 |
| Ampicillin | 16 | - | 151.3 | 143.0 | 93.9 | 128.1 | 171.3 | 193.4 | 122.0 | 137.7 | 43.3 |
| Azithromycin | 3 | - | 583.2 | 387.1 | 721.7 | 706.0 | 328.3 | 522.8 | 313.2 | 277.8 | 420.5 |
| Cefazolin | 6 | - | 33.5 | 408.8 | 272.8 | 328.6 | 374.3 | 575.3 | 969.1 | 525.2 | 574.4 |
| Cefoxitin | 8 | - | 261.1 | 137.7 | 369.4 | 1497.1 | 183.0 | 449.4 | 162.8 | 312.7 | 60.2 |
| Ceftriaxone | 4 | - | 589.7 | 539.3 | 508.6 | 955.5 | 403.5 | 252.1 | 336.3 | 400.3 | 669.7 |
| Cefuroxime | 18 | - | 196.2 | 142.9 | 110.8 | 151.3 | 116.1 | 111.2 | 272.1 | 292.7 | 316.8 |
| Cephalexin | 13 | - | 250.1 | 224.2 | 163.0 | 876.8 | 186.8 | 93.1 | 128.3 | 220.8 | 300.7 |
| Ciprofloxacin | 1 | - | 386.3 | 478.3 | 284.8 | 514.9 | 504.7 | 1077.6 | 556.6 | 1482.9 | 680.7 |
| Clarithromycin | 20 | - | 172.1 | 146.4 | 130.6 | 113.5 | 76.5 | 152.4 | 79.6 | 190.7 | 215.0 |
| Clindamycin | 15 | - | 197.3 | 198.9 | 174.3 | 302.4 | 125.3 | 212.9 | 268.3 | 363.4 | 274.6 |
| Cloxacillin | 11 | - | 436.5 | 200.6 | 186.2 | 357.5 | 195.3 | 176.3 | 258.9 | 220.6 | 305.8 |
| Doxycycline | 5 | - | 1110.5 | 446.3 | 311.5 | 287.2 | 366.3 | 177.9 | 211.1 | 341.0 | 242.7 |
| Ertapenem | 23 | Table 3.2 - Footnote * | 145.6 | 74.0 | 46.1 | 60.7 | 28.5 | 92.4 | 12.3 | 31.4 | 91.1 |
| Erythromycin | 25 | - | 83.1 | 30.3 | 78.3 | 115.8 | 16.0 | 13.1 | 15.1 | 44.3 | 54.4 |
| Levofloxacin | 14 | - | 61.2 | 345.8 | 93.4 | 364.9 | 219.3 | 161.8 | 262.2 | 291.2 | 115.5 |
| Meropenem | 21 | Table 3.2 - Footnote * | 128.0 | 69.7 | 97.0 | 103.8 | 87.8 | 148.1 | 31.4 | 56.2 | 92.7 |
| Moxifloxacin | 12 | Table 3.2 - Footnote * | 286.5 | 55.3 | 283.6 | 96.3 | 152.4 | 323.8 | 103.4 | 246.6 | 448.1 |
| Nitrofurantoin | 17 | - | 312.9 | 156.5 | 162.7 | 290.2 | 115.6 | 70.0 | 87.3 | 124.0 | 262.1 |
| Penicillin G | 19 | - | 48.2 | 13.4 | 23.3 | 5.2 | 71.7 | 340.7 | 389.5 | 276.5 | 108.3 |
| Piperacillin and enzyme inhibitor | 9 | Table 3.2 - Footnote * | 314.5 | 213.5 | 228.0 | 235.6 | 227.7 | 476.3 | 262.1 | 217.8 | 200.7 |
| Sulfamethoxazole and trimethoprim | 10 | - | 296.1 | 279.7 | 257.5 | 716.8 | 215.1 | 211.5 | 157.2 | 284.1 | 440.3 |
| Tobramycin | 22 | Table 3.2 - Footnote * | 28.8 | 33.7 | 32.7 | 102.9 | 106.2 | 167.7 | 56.9 | 93.8 | 73.9 |
| Vancomycin | 24 | - | 72.4 | 4.9 | 0.3 | 15.2 | 1.9 | 190.0 | 42.1 | 183.6 | 3.9 |
| TOTAL | - | - | 7423.6 | 5757.7 | 5552.2 | 11504.9 | 4891.9 | 7341.6 | 5714.5 | 7731.6 | 7638.7 |
In Figure 3.4, a dramatic increase is seen in the DDDs per discharge for Manitoba from 2009 to 2010. This increase and the subsequent sustained use reflect an increase in the purchasing of amoxicillin products (Figure 3.5). At the national level, amoxicillin is the product with the second highest number of doses purchased in 2014 (Table 3.1), but purchasing of amoxicillin in Manitoba in 2014 was more than twice that of any other province (Table 3.2).
Figure 3.5: Patterns in DDDs per discharge 2002 to 2014 for amoxicillin products purchased by hospitals in Canada, by province
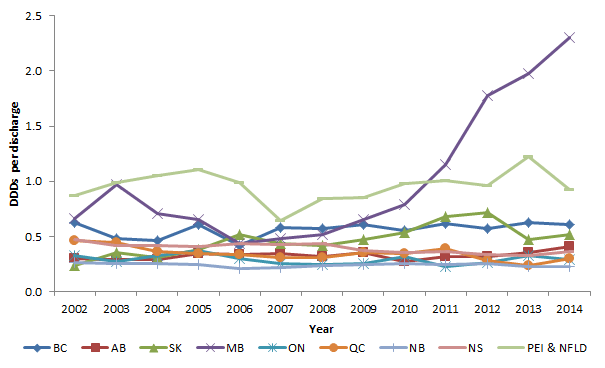
Figure 3.5 - Text Description
| 2002 | 2003 | 2004 | 2005 | 2006 | 2007 | 2008 | 2009 | 2010 | 2011 | 2012 | 2013 | 2014 | |
|---|---|---|---|---|---|---|---|---|---|---|---|---|---|
| BC | 0.6 | 0.5 | 0.5 | 0.6 | 0.4 | 0.6 | 0.6 | 0.6 | 0.6 | 0.6 | 0.6 | 0.6 | 0.6 |
| AB | 0.3 | 0.3 | 0.3 | 0.3 | 0.3 | 0.3 | 0.3 | 0.4 | 0.3 | 0.3 | 0.3 | 0.4 | 0.4 |
| SK | 0.2 | 0.4 | 0.3 | 0.4 | 0.5 | 0.4 | 0.4 | 0.5 | 0.5 | 0.7 | 0.7 | 0.5 | 0.5 |
| MB | 0.7 | 1.0 | 0.7 | 0.6 | 0.4 | 0.5 | 0.5 | 0.6 | 0.8 | 1.2 | 1.8 | 2.0 | 2.3 |
| ON | 0.3 | 0.3 | 0.3 | 0.4 | 0.3 | 0.3 | 0.2 | 0.3 | 0.3 | 0.2 | 0.3 | 0.3 | 0.3 |
| QC | 0.5 | 0.4 | 0.4 | 0.3 | 0.3 | 0.3 | 0.3 | 0.4 | 0.3 | 0.4 | 0.3 | 0.2 | 0.3 |
| NB | 0.3 | 0.3 | 0.3 | 0.2 | 0.2 | 0.2 | 0.2 | 0.2 | 0.3 | 0.2 | 0.3 | 0.2 | 0.2 |
| NS | 0.5 | 0.4 | 0.4 | 0.4 | 0.4 | 0.4 | 0.4 | 0.4 | 0.4 | 0.4 | 0.3 | 0.3 | 0.4 |
| PEI & NFLD | 0.9 | 1.0 | 1.1 | 1.1 | 1.0 | 0.6 | 0.8 | 0.9 | 1.0 | 1.0 | 1.0 | 1.2 | 0.9 |
Of the antimicrobials of last recourse, the drug with the most DDDs purchased in 2014 was piperacillin-tazobactam. In all provinces, the purchasing of piperacillin-tazobactam has increased over the period of surveillance, by 0.14 to 0.45 DDDs per discharge. Québec was the province with the most DDDs purchased, similar to previous years (2005 – 2014). However, the gap between purchasing in Québec and the next highest purchasing province has been widening in recent years; in 2014, Québec purchased approximately 55% more DDDs than the next highest-purchasing province (British Columbia) (Figure 3.6).
Figure 3.6: Patterns in DDDs per discharge 2002 to 2014 for piperacillin and tazobactam purchased by hospitals in Canada, by province
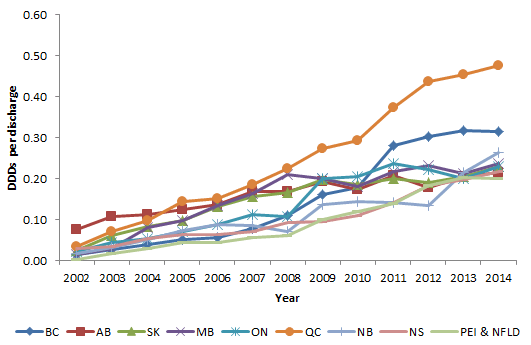
Figure 3.6 - Text Description
| 2002 | 2003 | 2004 | 2005 | 2006 | 2007 | 2008 | 2009 | 2010 | 2011 | 2012 | 2013 | 2014 | |
|---|---|---|---|---|---|---|---|---|---|---|---|---|---|
| BC | 0.01 | 0.03 | 0.04 | 0.05 | 0.06 | 0.08 | 0.11 | 0.16 | 0.18 | 0.28 | 0.30 | 0.32 | 0.31 |
| AB | 0.07 | 0.11 | 0.11 | 0.12 | 0.14 | 0.17 | 0.17 | 0.19 | 0.17 | 0.21 | 0.18 | 0.21 | 0.21 |
| SK | 0.02 | 0.06 | 0.08 | 0.10 | 0.13 | 0.16 | 0.17 | 0.20 | 0.18 | 0.20 | 0.19 | 0.20 | 0.23 |
| MB | 0.01 | 0.03 | 0.08 | 0.10 | 0.13 | 0.16 | 0.21 | 0.20 | 0.18 | 0.22 | 0.23 | 0.21 | 0.24 |
| ON | 0.02 | 0.04 | 0.05 | 0.07 | 0.09 | 0.11 | 0.11 | 0.20 | 0.20 | 0.24 | 0.22 | 0.20 | 0.23 |
| QC | 0.03 | 0.07 | 0.10 | 0.14 | 0.15 | 0.19 | 0.22 | 0.27 | 0.29 | 0.37 | 0.44 | 0.45 | 0.48 |
| NB | 0.02 | 0.03 | 0.05 | 0.07 | 0.09 | 0.08 | 0.07 | 0.14 | 0.14 | 0.14 | 0.13 | 0.21 | 0.26 |
| NS | 0.03 | 0.03 | 0.05 | 0.06 | 0.06 | 0.07 | 0.09 | 0.10 | 0.11 | 0.14 | 0.18 | 0.20 | 0.22 |
| PEI & NFLD | 0.00 | 0.02 | 0.03 | 0.04 | 0.04 | 0.06 | 0.06 | 0.10 | 0.12 | 0.14 | 0.18 | 0.20 | 0.20 |
References
Page details
- Date modified: