ARCHIVED - Enhanced surveillance of invasive meningococcal disease in Canada: 1 January, 2002 - 31 December, 2003
15 April 2006 Volume 32 Number 08
Invasive meningococcal disease (IMD) has been a nationally notifiable disease in Canada since 19241. The Immunization and Respiratory Infections Division, Centre for Infectious Disease Prevention and Control, has published enhanced IMD surveillance reports since 19952-5. This surveillance report provides information on IMD from 1 January, 2002, through 31 December, 2003.
Methods
As of 1 January, 2000, clinical cases of IMD were excluded from national reporting. The case definition for the period covered by this publication is as follows5:
Confirmed case: invasive* disease with laboratory confirmation of infection
- isolation of Neisseria meningitidis from a normally sterile site (blood, cerebrospinal fluid [CSF], joint, pleural or pericardial fluid)
- demonstration of N. meningitidis antigen in CSF.
Provincial and territorial departments of health report non-nominal epidemiologic data to the Public Health Agency of Canada (PHAC) on all cases of IMD meeting the national case definition. Provincial and territorial public health and/or hospital laboratories send N. meningitidis isolates to the National Microbiology Laboratory (NML) in Winnipeg for confirmation of serogroup and further bacteriologic studies. These consist of serotyping and subtyping for all isolates and multilocus enzyme electrophoresis for all serogroup C isolates. Probabilistic matching is conducted to link epidemiologic and laboratory data. Matching is done using the following variables: province/ territory, date of birth (or age), sex, onset date, and serogroup (when available). In 2002 and 2003, British Columbia, Alberta, and Quebec provided case-by-case data that had already been linked to laboratory data. Data are entered into an Access database (v2000) and analyzed using SPSS (v12.0).
Population estimates for the provinces and territories (PT), based on the 2001 Census6, were obtained from Statistics Canada. These estimates were used to calculate incidence rates. All incidence rates are per 100,000 population per year. Chi-square tests, t tests, or the non-parametric Kruskal-Wallis H test were used to investigate associations between variables.
At the time of publication, the PHAC does not have a systematic method of collecting information on IMD outbreaks at the national level. In order to describe the number of IMD outbreaks during this surveillance period, an e-mail survey was sent to IMD representatives in all PT in May 2005.
Results
Number of cases
In 2002 and 2003, the provinces and territories reported a total of 214 and 171 IMD cases respectively, 85% and 92% of which were successfully matched to laboratory data (33 and 13 cases were not matched to laboratory data).
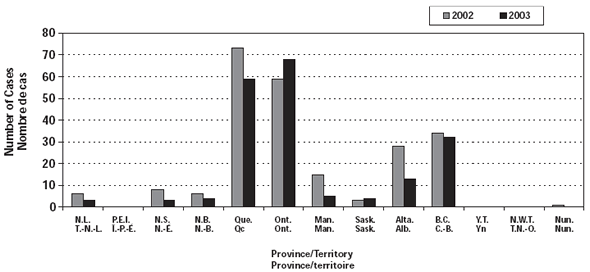
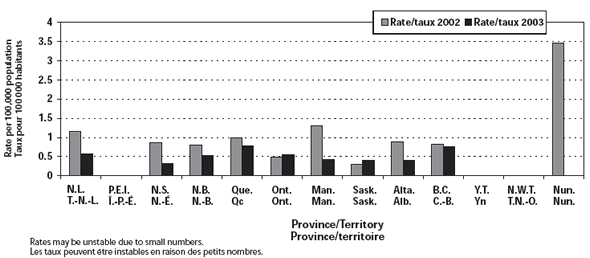
The NML reported an additional 19 and 20 cases in 2002 and 2003 respectively that could not be matched to those reported by the PT (14 from Ontario, eight from Alberta, six from Quebec, five from British Columbia, three from Manitoba, and one from each of New Brunswick, Nova Scotia, and Newfoundland). Therefore, the total number of cases for 2002 and 2003 was 233 and 191 respectively. Tables 1 and 2 provide detailed incidence, case fatality rates (CFR), and serogroup data by age group and year. Figures 1 and 2 show the annual number of cases and incidence rates by PT for 2002 and 2003. These rates may be unstable because of small numbers.
Incidence
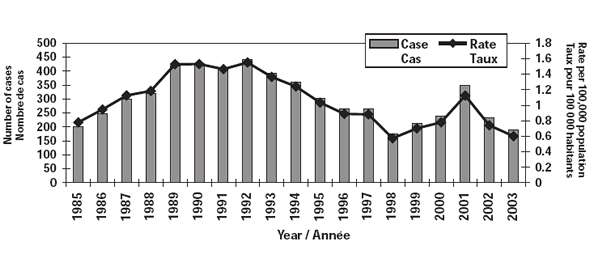
The incidence rates of IMD in 2002 and 2003 were 0.74 and 0.6 per 100,000 population respectively. Figure 3 shows the annual number of cases and incidence rates since 1985.
Sex
Females accounted for 51% and 49% of IMD cases in 2002 and 2003 respectively.
Table 1. Incidence, case fatality, and serogroup data for IMD by age group, Canada, 2002
Age group, years |
< 1 |
1-4 |
5-9 |
10-14 |
15-19 |
20-24 |
25-64 |
65+ |
Age unknown |
Total |
#cases |
21 |
31 |
6 |
12 |
39 |
27 |
62 |
33 |
2 |
233 |
Incidence rate per 100,000 population |
6.40 |
2.22 |
0.30 |
0.57 |
1.83 |
1.25 |
0.36 |
0.82 |
N/A |
0.74 |
#deaths |
2 |
3 |
2 |
0 |
2 |
2 |
7 |
3 |
0 |
21 |
Case fatality ratio (%) |
9.52 |
9.68 |
33.33 |
0.00 |
5.13 |
7.41 |
11.29 |
9.09 |
N/A |
9.01 |
Mortality rate per 100,000 population |
0.61 |
0.21 |
0.10 |
0.00 |
0.09 |
0.09 |
0.04 |
0.07 |
N/A |
0.07 |
# serogroup B cases |
16 |
19 |
1 |
5 |
15 |
10 |
16 |
9 |
1 |
92 |
# serogroup C cases |
1 |
7 |
1 |
1 |
12 |
15 |
37 |
6 |
0 |
80 |
# serogroup Y cases |
3 |
0 |
1 |
5 |
7 |
0 |
7 |
15 |
1 |
39 |
# cases with other serogroups |
0 |
2 |
1 |
0 |
2 |
1 |
1 |
2 |
0 |
9 |
# cases with serogroup missing |
1 |
3 |
2 |
1 |
3 |
1 |
1 |
1 |
0 |
13 |
Age group, years |
< 1 |
1-4 |
5-9 |
10-14 |
15-19 |
20-24 |
25-64 |
65+ |
Total |
#cases |
20 |
23 |
8 |
7 |
41 |
20 |
42 |
30 |
191 |
Incidence rate per 100,000 population |
6.07 |
1.67 |
0.41 |
0.33 |
1.93 |
0.91 |
0.24 |
0.74 |
0.60 |
#deaths |
2 |
2 |
0 |
1 |
3 |
4 |
6 |
5 |
23 |
Case fatality ratio (%) |
10.00 |
8.70 |
0.00 |
14.29 |
7.32 |
20.00 |
14.29 |
16.67 |
12.04 |
Mortality rate per 100,000 population |
0.61 |
0.14 |
0.00 |
0.05 |
0.14 |
0.18 |
0.03 |
0.12 |
0.07 |
# serogroup B cases |
16 |
13 |
4 |
3 |
14 |
11 |
14 |
6 |
81 |
# serogroup C cases |
1 |
4 |
3 |
1 |
16 |
5 |
15 |
2 |
47 |
# serogroup Y cases |
0 |
1 |
1 |
3 |
7 |
3 |
10 |
16 |
41 |
# cases with other serogroups |
3
|
5
|
0
|
0
|
2
|
1
|
1
|
6
|
18
|
# cases with serogroup missing |
0 |
0 |
0 |
0 |
2 |
0 |
2 |
0 |
4 |
Age distribution
In 2002, the median age of IMD cases was 21 years (range 0 to 97 years), and 25% of cases were < 9 years of age. The highest incidence rates occurred among children: infants < 1 year of age and children aged 1 to 4 had rates of 6.40 and 2.22 cases per 100,000 population respectively. Adolescents 15 to 19 years old had the third highest rate, of 1.83 per 100,000 population. The age distribution varied between sex (median age of females was 26 years and of males was 18 years, p < 0.01).
In 2003, the median age of IMD cases was 19 years (range 0 to 95 years), and 25% of cases were < 9 years old. The highest incidence rates were seen among infants < 1 year of age at 6.07 per 100,000 population. Adolescents 15 to 19 years of age had the second highest rate, of 1.93 per 100,000 population, and children between 1 and 4 years had the third highest rate, of 1.67 per 100,000 population. There was no significant variation in age distribution between males and females.
Figure 1. Number of cases of IMDby province/territory by year
Seasonal distribution
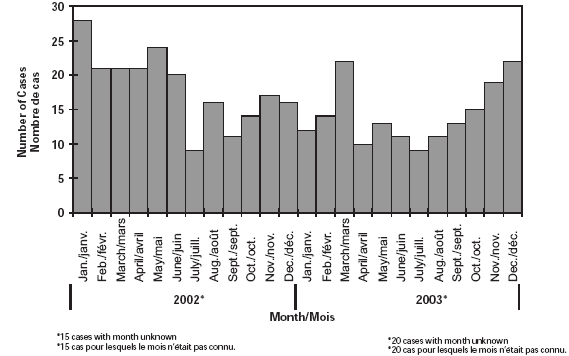
Interestingly, in 2002, IMD cases extended beyond the typical peak seen in the winter months, a large number of cases occurring in May and June. The occurrence of IMD cases in 2003 showed typical seasonal variation, with peaks occurring in the winter months, November to March. Figure 4 shows the seasonal distribution of IMD cases.
Case fatality and mortality
IMD is associated with a relatively high case fatality. CFR were 9% and 12% in 2002 and 2003 respectively. The median age of fatal cases was 21 years in 2002 and 22 years in 2003. In 2002, children aged 5 to 9 years had the highest CFR, at 33.3% (n = 6 cases), followed by those aged 25 to 64 years, at 11.3% (n = 62 cases). In 2003, people aged 20 to 24 years had the highest CFR, at 20.0% (n = 20 cases), followed by those ≥ 65 years, at 16.7% (n = 30 cases).
Mortality rates for IMD were 0.07 per 100,000 population in both 2002 and 2003. In both years, infants < 1 year had the highest mortality rate, of 0.61 per 100,000 population. Case fatality and mortality rates could be unstable because of small numbers.
Serogroups
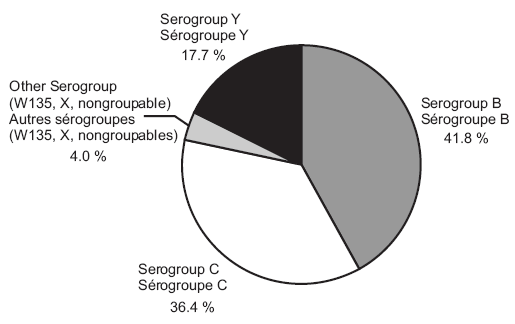
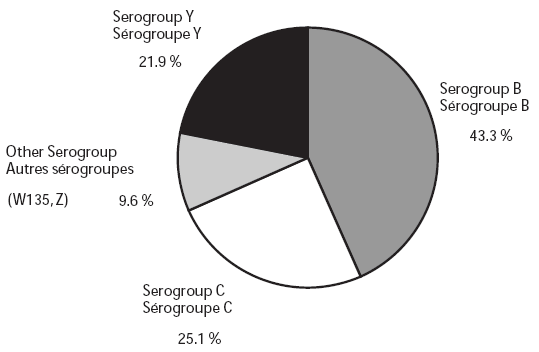
In 2002, serogroup information was available for 94.4% of confirmed cases (220/233). The serogroup distribution was as follows: 92 (41.8%) were serogroup B, 80 (36.4%) were serogroup C, 39 (17.7%) were serogroup Y, 7 (3.2%) were serogroup W135, 1 (0.4%) was serogroup X, and 1 (0.4%) was nongroupable. In 2003, serogroup information was available for 97.9% of confirmed cases (187/191). The serogroup distribution was as follows: 81 (43.3%) were serogroup B, 47 (25.1%) were serogroup C, 41 (21.9%) were serogroup Y, 17 (9.1%) were serogroup W135, and one (0.5%) was serogroup Z. Figures 5 and 6 compare the serogroup distribution by year.
Figure 5. Serogroup distribution of IMDcases, 2002 (n = 220*)
* Excludes cases with missing serogroups.
Figure 6. Serogroup distribution of IMD cases, 2003 (n = 187*)
* Excludes cases with missing serogroups.
Figure 7. IMD Incidence, Serogroup B, C and Y, 1993-2003, Canada

Serogroup distribution by age
In 2002, the median ages of IMD cases caused by serogroups B, C, and Y were 17, 26, and 52 years respectively. The median ages were statistically different for cases caused by serogroups B and C (p < 0.001) and B and Y (p = 0.001) but not for C and Y. In 2003, the median ages of cases caused by serogroups B, C, and Y were 16, 20, and 47 years respectively. The median ages were statistically different for serogroups B and Y (p < 0.001) and C and Y (p < 0.001) but not for B and C.
Serogroups and CFR
Serogroup C had the highest CFR in both years, followed by serogroups B and Y. In 2002, the CFR for serogroup C, B, and Y were 13.8 %, 5.4 %, and 2.6% respectively. In 2003, the CFR were 19.1%, 11.1%, and 7.3% for serogroup C, B, and Y respectively.
Serotypes and serosubtypes
In 2002, 35.9% of the 92 serogroup B cases were non-serotypeable; 25.0% were serotype 4, 7.6% were serotype 14, and 6.2% were serotype 15. The most common serotype and subtype combinations for serogroup B cases were B:NT:P1. (11/92) and B:4:P1. (7/92). Of the 80 serogroup C cases, 73.8% were serotype 2a, and 6.3% were non-serotypeable. The most common combinations for serogroup C cases were C:2a:P1.1,7 (21/80) and C:2a:P1.2,5 (14/80). Of the 39 serogroup Y cases, 41.0% were non-serotypeable, and 35.9% were serotype 14. The most common serogroup Y combinations were Y:NT:P1.5 (9/39) and Y:NT:P1.2,5 (6/39).
In 2003, 35.8% of the 81 serogroup B cases were non-serotypeable; 23.5% were serotype 4, 11.1% were serotype 14, and 9.9% were serotype 1. The most common serotype and subtype combinations for serogroup B cases were B:NT:P1. (18/81) and B:4:P1. (8/81). Of the 47 serogroup C cases, 66.0% were serotype 2a, and 10.6% were non-serotypeable. The most common combinations for serogroup C cases were C:2a:P1.1,7 (12/47), C:2a:P1.2,5 (9/47), and C:2a:P1.5 (8/47). Of the 41 serogroup Y cases, 63.4% were non-serotypeable, and 31.7% were serotype 14. The most common serogroup Y combinations were Y:NT:P1.2,5 (14/41), Y:NT:P1.5 (9/41), and Y:14:P1. (7/41).
Multilocus enzyme electorphoretic typing
The NML conducts multilocus enzyme electrophoretic (MLEE) typing on serogroup C isolates received from the PT. In 2002, 73.8% (59/80) of serogroup C strains from IMD cases available for MLEE typing were found to belong to the hypervirulent clone of ET-37, 97% (57/59) of these being the ET-15 variant. Twentyfive percent (20/80) of C strains did not have ET profile data. In 2003, 68% (32/47) of serogroup C strains from IMD cases available for MLEE typing were found to belong to the hypervirulent clone of ET-37, 94% (30/32) of these being the ET-15 variant. Twenty-one percent (10/47) did not have ET profile data, and 2.1% (1/47) belonged to neither the ET-15 nor other member of the ET-37 clonal complex.
Outbreaks
Twelve of the 13 PT responded to the e-mail survey regarding IMD outbreaks; these 12 represented 99.6% of the Canadian population. Survey results indicated that there was one IMD outbreak in Canada between 1 January, 2002, and 31 December, 2003. This serogroup C community-based outbreak occurred in Sudbury District, Ontario, between September and October 2003. The outbreak affected adolescents between 15 and 18 years of age and consisted of three confirmed cases (one death). As part of the prevention and control strategy, a meningococcal vaccination program, using both polysaccharide quadrivalent vaccine (12,310 doses) and meningococcal C conjugate vaccine (40 doses) was targeted for persons 14 to 20 years of age. A total of 11,000 persons were vaccinated (target population and close contacts of the teens and the target group) (S. Dolman, Ontario Ministry of Health and Long-Term Care, Toronto: personal communication, June 2005).
Discussion
Polymerase chain reaction
Increasingly, polymerase chain reaction (PCR) technology is being used as an alternative laboratory method of detecting N. meningitidis. Although some PT have been using PCR techniques for diagnosing IMD, these cases did not meet the case definition in 2002 and 2003 and were therefore not included in the national numbers. The national case definition underwent revision in 2005 and now includes PCR testing. The case definition, effective 1 January 20067, is as follows:
Confirmed case: invasive disease* with laboratory confirmation of infection
- isolation of N. meningitidis from a normally sterile site (blood, CSF, joint, pleural, or pericardial fluid); OR
- demonstration of N. meningitidis DNA by appropriately validated nucleic acid test (NAT)** from a normally sterile site.
Probable case: invasive disease* with purpura fulminans or petechiae and no other apparent cause
- With demonstration of N. meningitidis antigen in the CSF; OR
- In the absence of isolation of N. meningitidis or demonstration of DNA by appropriately validated NAT** from a normally sterile site.
Serogroups
The number of serogroup B cases seen in 2002 and 2003 were higher than those seen in previous years5; the proportions of serogroup B cases were 28% and 24% in 2000 and 2001 respectively, whereas in 2002 and 2003 serogroup B cases accounted for 40% and 42% of total IMD cases. This is expected in the non-outbreak years.
For the years 2001, 2002, and 2003, the median ages of cases with serogroup B disease were higher than those seen in 1999 and 2000 (4 years, 5 years, 17 years, 17 years, and 16 years in 1999-2003 respectively)5. Although not statistically significant, this epidemiologic trend is important to consider. While in 2001 the median age of cases with serogroup Y disease was statistically and epidemiologically different from that in 1999 and 2000 (median ages were 56 years, 52 years, and 17 years in 1999, 2000, and 2001 respectively), this was not observed for the years 2002 and 2003 (median age of 52 and 47 years respectively).
Immunization
Unfortunately, information on vaccination status is not routinely captured through enhanced surveillance. In 2002, two provinces implemented routine meningococcal C vaccination programs (Alberta at 2, 4, 6 months and Quebec at 12 months). In addition, Quebec implemented a mass campaign during an outbreak for persons 2 months to 20 years of age from September 2001 to January 2002 (M. Landry, Ministère de la Santé et des Services Sociaux, Quebec: personal communication, March 2006). In the first year after program implementation, provinces that had implemented early conjugate C vaccination, which together represented 34% of the Canadian population, showed a 60% decline in serogroup C disease between 2002 and 2003, while the rest of the country had a 15% decline. However, it is not known whether this was due to the universal programs, mass campaigns implemented during an outbreak, or the cyclical nature of IMD; further data are needed.
By the end of 2003, three more PT had implemented universal programs: PEI at 12 months of age, British Columbia at 2 and 12 months, and Yukon at 2 and 6 months. In the same year, British Columbia also implemented a catch-up campaign for children in grade 68. As serogroup C immunization rates increase, we should expect the serogroup distribution in Canada to change.
Underreporting
The scope of underreporting is unknown. However, 8% in 2002 and 10% in 2003 of IMD cases were reported by the NML and could not be matched to epidemiologic reports for the PT, presenting a minimum estimate of the magnitude of underreporting. The epidemiologic information on these cases was either taken from the laboratory requisition or is missing.
Limitations
Because of the instability of results based on small numbers, caution should be used when interpreting these results.
Acknowledgements
We would like to thank our colleagues from the provincial and territorial ministries of health for providing epidemiologic data, and the public health and hospital laboratories from across Canada for submitting isolates to the NML for further studies. We would also like to thank Dennis Law, Jan Stoltz, and Averil Henderson for their technical expertise in conducting laboratory testing of isolates submitted to the NML.
References
-
Public Health Agency of Canada. Notifiable diseases on-line. URL: <http://dsol-smed.hc-sc.gc.ca/dsol-smed/ndis/index_e.html>.
-
Whalen CM, Hockin JC, Ryan A et al. The changing epidemiology of invasive meningococcal disease in Canada, 1985 through 1992. Emergence of a virulent clone of Neisseria meningitidis. JAMA 1995;273(5):390-4.
-
Deeks S, Kertesz D, Ryan A et al. Surveillance of invasive meningococcal disease in Canada, 1995-1996. CCDR 1997;23(16):121-5.
-
Squires SG, Pelletier L, Mungai M et al. Invasive meningococcal disease in Canada, 1 January, 1997, to 31 December, 1998. CCDR 2000;26(21):177-82.
-
Squires SG, Deeks SL, Tsang RSW. Enhanced surveillance of invasive meningococcal disease in Canada: 1 January, 1999, through 31 December, 2001. CCDR 2004;30(3):17-28.
-
Statistics Canada. Population estimates, 2002 final post-censal, 2003 revised post-censal. Ottawa: Demography Division, Statistics Canada.
-
Health Canada. Case definitions for diseases under national surveillance. CCDR 2000;26(S3):49.
-
Public Health Agency of Canada. Provincial and territorial immunization programs. URL: <http://www.phac-aspc.gc.ca/im/ptimprog-progimpt/index.html>.
* Invasive meningococcal disease usually manifests itself as meningitis and/or septicemia, although other manifestations may be observed. Invasive disease may progress rapidly to purpura fulminans, shock and death.
** Each jurisdiction will have a validation process for the NAT that they have in place.
Source: KM Watkins, MHSc, SL Deeks, MD, MHSc, A Medaglia, Immunization and Respiratory Infections Division, Centre for Infectious Disease Prevention and Control, Public Health Agency of Canada, Ottawa, Ontario; RSW Tsang, MMedSc, PhD, CNS Infection Division, National Microbiology Laboratory, Winnipeg, Manitoba.
Page details
- Date modified:
