
ARCHIVED - Canadian Integrated Surveillance Report: Salmonella, Campylobacter, verotoxigenic E. coli and Shigella, from 2000 to 2004
Non-typhoid Salmonella Cases
Serovars Increasing in Frequency
The Salmonella serovars that showed an annual increase in reports in at least four consecutive years from 2000 to 2004 are shown in Table 3. These increases may reflect cyclical trends that are often observed among Salmonella serovars rather than representing a true emergence.
1 In 2002, 11 S. ssp I 4,[5],12:b:- infections were related to outbreaks; in 2003, 27 cases were linked to an outbreak 2 In 2002, 20 S. Anatum infections were related to an outbreak 3 In 2004, 9 S. Muenchen infections were related to an outbreak
Long-term Trends
From 1995 to 2004, there was an overall decline in the national rate of non-typhoid Salmonella infections (Figure 2). Long-term trends of the most common non-typhoid serovars over the 10-year period are shown in Figures 3 and 4 (note the different scales used). The rates for all of the top five serovars declined over the 10-year period, with the exception of S. Heidelberg which increased since 2000 (Figure 3). The fluctuation in S. Enteritidis numbers over this period was mainly due to several large outbreaks, including one related to a pre-packaged lunch product in 1998 and another to raw almonds in 2000 and 2001(2-6). In Figure 4, the prominent peak noted for S. Newport in 1996 was due to a large outbreak associated with alfalfa sprouts(7).
Figure 2: Reported rates of non-typhoid Salmonella cases (per 100,000 population), 1995 to 2004*
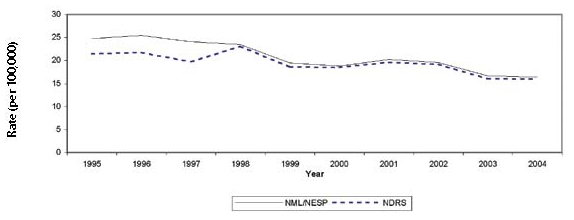
* NML/NESP data includes totals from the NML (1995-1997) and NESP (1998-2004).
Figure 3: Reported rates of S. Typhimurium, S. Heidelberg, S. Thompson, S. Enteritidis and S. Hadar infections(per 100,000 population), 1995 to 2004*
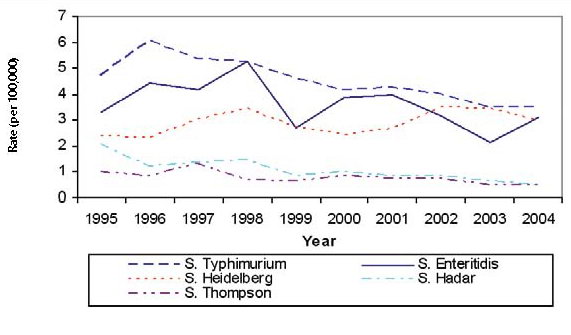
* Data includes totals from the NML (1995-1997) and the NESP (1998-2004) databases.
Figure 4: Reported rates of S. Agona, S. Saintpaul, S. ssp I 4,[5],12:i:-, S. Newport and S. Infantis infections(per 100,000 population), 1995 to 2004*
![Figure 4: Reported rates of S. Agona, S. Saintpaul, S. ssp I 4,[5],12:i:-, S. Newport and S. Infantis infections(per 100,000 population), 1995 to 2004*](/content/dam/phac-aspc/migration/phac-aspc/publicat/ccdr-rmtc/09vol35/35s3/gfx/35s3-eng_figure4.jpg)
* NML/NESP data includes totals from the NML (1995-1997) and NESP (1998-2004).

Monthly and Provincial/Territorial Trends
Distinct seasonal trends can be seen when the overall number of non-typhoid Salmonella cases are plotted by month, with similar patterns being observed in both NDRS and NESP (Figure 5). Consistent peaks were noted from July through October with smaller peaks in March and April.
Several other distinct peaks throughout the winter and spring months, in particular in 2001 and 2002, reflect some of the larger outbreaks that occurred during this time frame. In the winter of 2001, several outbreaks of S. Enteritidis occurred, including a multi-provincial outbreak associated with raw almonds, and a smaller outbreak associated with mung bean sprouts(5,6,8). The winter peak in 2002 was likely influenced by a multi-provincial outbreak of S. Oranienburg.
S. Typhimurium and S. Enteritidis both showed strong seasonal trends, with S. Typhimurium peaking in the summer months and S. Enteritidis peaking in the winter (except for 2003). The winter and early spring peaks in S. Enteritidis infections are likely due to travel-acquired infections(9,10,11).
The seasonal trends associated with non-typhoid Salmonella infections are similar for most of the provinces and territories (Figure 6). Exceptions to the general trend of a winter low and summer peak can be noted for Nova Scotia, Prince Edward Island, and the Territories. In Nova Scotia, trends were affected by three prominent outbreaks that occurred in the fall of 2000, 2001 and 2003.
The distinct peaks in Figure 6 and 7 in the territories are, at least partially, an artefact of the small population base. The spring, summer and fall peak in Nunavut can also be explained by community clusters of S. Typhimurium in 2002 and 2003 and a national outbreak of S. Oranienburg in 2002.
The fall peak in the Northwest Territories was influenced by several cases of S. Lomalinda and S. Heidelberg connected to two separate events in 2000 and 2001.
Figures 7 to 10 show the annual rate in each province/territory from 2000 to 2004 for the four most common human non-typhoid Salmonella serovars (note the different scales used). Considerable variations within and among provinces/territories can be noted for all serovars, in particular S. Enteritidis and S. Hadar. The higher rates noted for territories, likely reflect the small population base.
Figure 6: Average reported rate of non-typhoid Salmonella cases (per 100,000 population per season*), by province/territory, 2000 to 2004, NDRS

* Winter includes December, January and February; Spring includes March, April and May; Summer includes June, July and August; Fall includes September, October and November.
Figure 7: Reported rate of S. Typhimurium infections (per 100,000 population) by province/territory, 2000 to 2004, NESP

Figure 8: Reported rate of S. Enteritidis infections (per 100,000 population) by province/territory, 2000 to 2004, NESP

Figure 9: Reported rate of S. Heidelberg infections (per 100,000 population) by province/territory, 2000 to 2004, NESP

Figure 10: Reported rate of S. Hadar infections (per 100,000 population) by province/territory, 2000 to 2004, NESP

Age and Gender Distribution
Infants and young children have the highest reported rate of Salmonella infection (NDRS) (Figure 11). A second peak can be seen in ages 20-29. Higher reported rates in this age group may reflect their increased likelihood of engaging in risky eating behaviours than other age groups(12). The age distribution of hospitalized cases (Figure 11) shows rates which are highest in young children and the elderly, suggesting greater susceptibility to more severe infection in these groups. The rate of Salmonella infection was similar for males and females over the five-year period.
Figure 11: Reported rate of Salmonella cases and hospitalizations (per 100,000 population) by age group, 2000 to 2004 combined, NDRS and CIHI

Outbreaks, Case Clusters and Exposure Settings
There were 226 outbreaks and case clusters related to Salmonella and 2240 outbreak-related laboratoryconfirmed cases reported to the NML and NESP between 2000 and 2004. According to the NML/ NESP, Salmonella outbreaks and case clusters accounted for the largest proportion of reported outbreaks and case clusters and the largest number of outbreak-related cases over the five-year period compared to E. coli, Campylobacter, and Shigella.
The Salmonella serovars responsible for outbreaks and case clusters with 10 or more cases, as reported to the NML, NESP and PulseNet Canada, from 2000 to 2004, are listed in Table 4 (for description of outbreak and case cluster data, please refer to Appendix A – Section 3).
Three serovars, S. Typhimirum (55), S. Enteritidis (41) and S. Heidleberg (34) were reported in over half of the 226 outbreaks and case clusters reported during the five year period. This reflects their predominance as the most frequently reported serovars in each year from 2000 to 2004. Although S. Typhimurium accounted for the largest number of reported Salmonella outbreaks and case clusters over the five-year period, those associated with S. Enteritidis resulted in higher outbreak-related case counts.
Salmonella-related outbreaks and case clusters listed by exposure setting are shown in Table 5. This information was collected through various sources and precise details regarding the settings of these events may be incomplete. A description of the setting categories can be found in Appendix A – Section 3. Household settings represented the largest number of reported Salmonella outbreaks and case clusters, while community settings resulted in higher related case counts. In 2002, a travel-related outbreak of S. Typhimurium PT 2 occurred among passengers and crew of a cruise ship travelling from Vancouver to Alaska.
* Includes 32 cases of S. Typhimurium acquired on a cruise ship sailing out of Vancouver in 2002. Clusters of infections acquired during foreign travel are otherwise not included.
* R -residential and NR -non-residential.
Travel-acquired Infections
Between 2000 and 2004, 286 travel-acquired cases of non-typhoid Salmonella were reported to the NESP. Although foreign travel is one of the main risk factors for gastrointestinal illness, case definitions for travel-associated enteric disease are not standardized across Canada and information is rarely captured or reported.
Therefore, travel-acquired infections are greatly under-represented in the NESP. A history of travel was provided for approximately 1% of all non-typhoid Salmonella infections. Travel to Mexico and the Caribbean accounted for a little more than half of these infections (Table 6).
Page details
- Date modified: