ARCHIVED - Canadian Integrated Surveillance Report: Salmonella, Campylobacter, verotoxigenic E. coli and Shigella, from 2000 to 2004
Human Shigella Cases
Shigella infections reported to the NDRS declined overall between 2000 and 2004, with the exception of a spike noted in 2002 (Table 23). The elevated case numbers in 2002 was due to an outbreak of Shigella sonnei in Ontario related to the consumption of a Greek-style pasta salad(24).
Rates of human Shigella captured in the NDRS and NESP by province/territory are shown in Figure 34 and were similar for all provinces. Most of the provinces reported an overall decrease in the number of cases, with Québec showing the steepest decline. The higher reported rates in Québec in 2000 were related to two community outbreaks, one in the northern region of the province and the other in a distinct ethnic community.
| 2000 | 2001 | 2002 | 2003 | 2004 | |
|---|---|---|---|---|---|
| NDRS |
1156
|
945
|
1355
|
906
|
720
|
| NESP |
855
|
692
|
1159
|
819
|
649
|
Figure 34: Rates of shigellosis (per 100,000 population) as reported to the National Notifiable Disease Summary program (NDRS) and the National Enteric Surveillance Program (NESP) by province/territory, 2000 to 2004
Shigella Species/Serotypes
The distribution of Shigella cases by species, as reported to the NESP between 2000 and 2004, is shown in Table 24. The most frequently reported species were S. sonnei and S. flexneri. The total Long-term Trends Although annual rates fluctuated between 1995 and 2004, overall trends for human Shigella infections declined over this time period (Figure counts and ranking of the top five serotypes among Shigella flexneri cases are shown in Table 25. Serotype 2 was the most commonly reported type in each year.
Long-term Trends
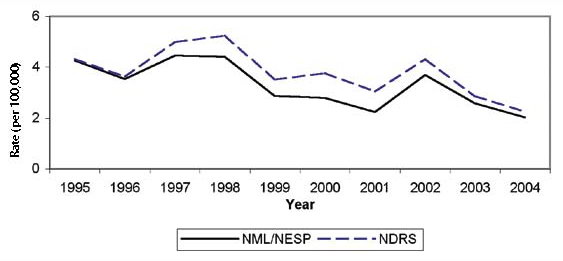
Although annual rates fluctuated between 1995 and 2004, overall trends for human Shigella infections declined over this time period (Figure 35). The long-term reporting trends of Shigella cases from the NDRS and NML/NESP databases showed strong similarities.
Figure 35: Reported rate of Shigella cases (per 100,000 population), 1995 to 2004, NDRS and NML/NESP

* NML/NESP data includes totals from NML (1995-1997) and NESP (1998-2004).
Monthly and Provincial/Territorial Trends
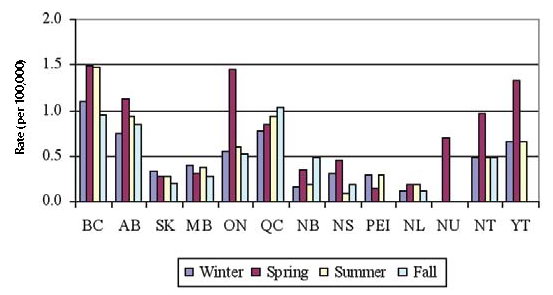
The seasonal distribution of Shigella cases is less discernable than for Salmonella, Campylobacter, or verotoxigenic E. coli (Figure 36). In May 2002, a large outbreak of Shigella sonnei related to a Greek-style pasta salad occurred in Ontario (24). Seasonal trends are more apparent when data is analyzed by province/territory, as shown in Figure 37. In several provinces and all territories, the rate of shigellosis was highest in the spring months. Overall, the rate of shigellosis was highest in British Columbia, Alberta and Québec.
Figure 36: Reported cases of Shigella by month, 2000 to 2004, NDRS and NESP
Figure 37: Average reported rate of Shigella infections (per 100,000 population per season*) by province/territory, 2000 to 2004, NDRS

*Winter includes December, January and February; Spring includes March, April and May; Summer includes June, July and August; Fall includes September, October and November.
Age and Gender Distribution
The age distribution of Shigella cases is shown in Figure 38. As was the case with Salmonella, Campylobacter and verotoxigenic E. coli, infants and young children experienced the highest rates of infection and hospitalizations. Higher rates of shigellosis were also seen in 20 to 59 year olds, although hospitalization rates (CIHI) for this group were comparatively low. The higher rates in this adult age group may represent parents with young children having a greater exposure to this pathogen (25) or the potential for sexual transmission among men who have sex with men (26).
No apparent trend was observed in the gender distribution for Shigella cases between 2000 and 2004.
Figure 38: Reported rate of Shigella cases and hospitalizations (per 100,000 population) by age group, 2000 to 2004 combined, NDRS and CIHI
Exposure Settings for Outbreaks and Case Clusters
There were 35 outbreaks and case clusters related to Shigella and 698 outbreak-related laboratoryconfirmed cases reported to the NML and NESP between 2000 and 2004. Eighty percent of these were associated with S. sonnei. Only seven household clusters and 15 related cases were linked to either S. boydii, S. dysenteriae or S. flexneri during this period.
Outbreaks and case clusters by exposure setting are shown in Table 26. Household settings represented the largest number of reported Shigella outbreak and case clusters, while community settings resulted in higher outbreak related case counts, marked by the more than 420 cases associated with the greekstyle pasta salad outbreak in 2002 in Ontario.
* R - residential and NR - non-residential
Travel-acquired Infections
Between 2000 and 2004, 162 travel-acquired Shigella infections were reported to the NESP. A history of travel was reported for approximately 4% of Shigella infections reported to the NESP. Travel-related Shigella infections were mainly due to travel to Asia, Mexico and the Caribbean (Table 27).
Page details
- Date modified:


