AMR in Canadian hospitals: 2007−2012

 Download this article as a PDF (1.12 MB - 8 pages)
 Published by: The Public Health Agency of Canada
Issue: Volume 40 S-2: Antimicrobial resistance
Date published: November 7, 2014
ISSN: 1481-8531
Submit a manuscript
About CCDR
Browse
Volume 40 S-2, November 7, 2014: Antimicrobial resistance
Surveillance
Antimicrobial resistance surveillance in Canadian hospitals, 2007−2012
Gravel D1*, Archibald CP1, Pelude L1, Mulvey M2, Golding G2 on behalf of the Canadian Nosocomial Infection Surveillance Program
Affiliations
1 Centre for Communicable Diseases and Infection Control, Public Health Agency of Canada, Ottawa, ON
2 National Microbiology Laboratory, Public Health Agency of Canada, Winnipeg, MB
Correspondence
DOI
https://doi.org/10.14745/ccdr.v40is2a02
Abstract
Background: The Canadian Nosocomial Infection Surveillance Program (CNISP) is a collaborative effort of the Public Health Agency of Canada's Centre for Communicable Diseases and Infection Control, the National Microbiology Laboratory, and 54 largely university-affiliated tertiary care sentinel hospitals in 10 provinces across Canada.
Objective: To provide a summary of antibiotic resistance rates of four key antibiotic resistant organisms in major hospitals across Canada from January 1, 2007, to December 31, 2012.
Methods: Patients' clinical and demographic data and associated results of laboratory analyses were submitted to the Agency by participating hospitals. The infection rates were summarized per 1,000 patient admissions at national and regional levels.
Results: In Canada, the overall health care-associated Clostridium difficile infection (HA-CDI), HA-CDI rates peaked in 2008 at 5.8 HA-CDI infections per 1,000 patient admissions then remained stable between 2009 and 2012 at approximately 5 HA-CDI infections per 1,000 admissions; the West and Central regions had higher rates than the Eastern region. The rates of methicillin-resistant Staphylococcus aureus (MRSA) peaked in 2009 at 9.5 MRSA infections per 1,000 patient admissions then decreased to 8.8 MRSA infections per 1,000 admissions in 2012, with the Central region having higher rates than the Western and Eastern regions. The rates of vancomycin-resistant Enterococci (VRE), have been low but rising with 0.08 VRE infections per 1,000 patient admissions in 2007, gradually rising to 0.5 VRE infections per 1,000 admissions in 2012, with consistently higher rates in the Western region, slightly lower rates in the Central region and the lowest rates in the Eastern region. The rates of carbapenem-resistant Enterobacteriaceae (CRE) have been measured since 2010 and have been low and stable, with 0.11 CRE infections per 1,000 patient admissions in 2010 and 0.14 CRE infections per 1,000 admissions in 2012, with higher rates in the Western and Central regions and lower rates in the Eastern region.
Conclusion: In Canada, of the four antibiotic resistant organisms under surveillance, HA-CDI and MRSA have been gradually decreasing, VRE is low but rising, and CRE remains low with Western and Central rates consistently higher than Eastern rates.
Introduction
Since the initial use of antibiotics in the 1940s, resistant strains of bacteria have emerged. Increasingly however, antibiotic resistance is seen as a challenge in both clinical care and public health. Antibiotic resistance has spread around the world, affecting both human health and the food supply.
The Public Health Agency of Canada (the Agency, or PHAC) collects national data on antimicrobial resistant organisms in humans through the Canadian Nosocomial Infection Surveillance Program (CNISP). This is a collaborative effort of the Centre for Communicable Diseases and Infection Control, the National Microbiology Laboratory (NML) and sentinel hospitals across Canada that participate as members of the Canadian Hospital Epidemiology Committee, a subcommittee of the Association of Medical Microbiology and Infectious Disease Canada (AMMI). CNISP is intended to identify trends and inform infection prevention and control programs and policies across the country.
The CNISP surveillance reports are published on a regular basis. The objective of this paper is to provide a summary of antibiotic resistance rates of four key antibiotic resistant organisms in major hospitals across Canada: health care-associated Clostridium difficile infection (HA-CDI), methicillin-resistant Staphylococcus aureus (MRSA), vancomycin-resistant Enterococci (VRE), and carbapenem-resistant Enterobacteriaceae (CRE). This paper focuses on trends for both adult and children hospitalized in participating CNISP hospitals based on patient admissions per year. The most recent full CNISP report, Antimicrobial Resistant Organisms (ARO) Surveillance - Surveillance Report for Data from January 1 2007 to December 31 2012, is available online Footnote 1.
Methods
Data collection
Case definitions were agreed upon for each of the four organisms. Following a case identification in one of the participating hospitals, a standardized patient questionnaire was completed that included patient demographics, clinical information, previous hospitalization within the past 12 months, and site of positive culture. Data were then submitted electronically through a web-based information management system, the Canadian Network for Public Health Intelligence (CNPHI), to PHAC for further statistical analysis and storage. Participating hospitals also provided the Agency with the number of patient-admissions and the number of patients-days for the corresponding surveillance year. [Note: very slight differences in reported numbers occur in this paper compared to the online report due to recent updates from participating sites; where differences exist, CCDR should be taken as correct.]
Standard National Healthcare Safety Network (NHSN) surveillance definitions that include both laboratory and clinical criteria were used to determine infection. (If there were no clinical signs, the patient was determined to be colonized; not infected.)
Laboratory analysis
Based on an agreed upon protocol for each organism, a sampling of isolates were sent to the National Microbiology Laboratory (NML) for molecular testing. The NML sent the laboratory results to PHAC through CNPHI as well. Both the laboratory results and data collected through the patient questionnaires were linked using a unique, anonymized patient identifier.
Data analysis
Data from both participating hospitals and the NML were extracted, validated, and statistically analyzed by PHAC staff. Infection rates per 1,000 patient admissions were calculated by dividing the number of cases over the total number of admissions per year multiplied by 1,000. Rates are calculated using only eligible data, that is to say only the hospitals that supplied both numerator (cases) and denominator (patient admissions) data are used to calculate the rates. For reporting purposes, and to ensure confidentiality, provinces were grouped into three regions: Western (British Columbia, Alberta, Saskatchewan, and Manitoba), Central (Ontario and Québec), and Eastern (Nova Scotia, New Brunswick, Prince Edward Island, and Newfoundland and Labrador). (Prince Edward Island began submitting data in 2011; the territories do not currently submit data.)
Surveillance at participating hospitals is considered to be within the mandate of hospital infection prevention and control programs and does not constitute human research; therefore, no research ethics board approval was sought.
Results
Health care-associated Clostridium difficile
Clostridium difficile is the most common cause of infectious diarrhea and pseudomembranous colitis in hospitals and long-term care facilities in Canada Footnote 2. C. difficile causes a range of illness from no symptoms at all to a severe, life-threatening disease Footnote 3. The population at risk of acquiring Clostridium difficile infection (CDI) includes the elderly, or people with certain antibiotics exposure, immunocompromising conditions or serious underlying disease. Only health-care associated cases of C. difficile are reported here as per the case definition (see box below).
Case definition of hospital-acquired Clostridium difficile infection
A patient is identified as having Clostridium difficile infection (CDI) if the patient:
- has diarrhea or fever, abdominal pain and/or ileus, and a laboratory confirmation of a positive toxin assay or positive polymerase chain reaction (PCR) test for C.difficile;
- has a diagnosis of pseudomembranes on sigmoidoscopy or colonoscopy or histological/ pathological diagnosis of CDI; or
- is diagnosed with toxic megacolon (in adult patients only).
In addition, a patient is considered to have hospital-acquired Clostridium difficile infection (HA-CDI) if:
- the patient's CDI symptoms occur in the admitting hospital less than 72 hours after admission; or
- CDI is seen in a patient who had been hospitalized in the admitting hospital and discharged within the previous four weeks.
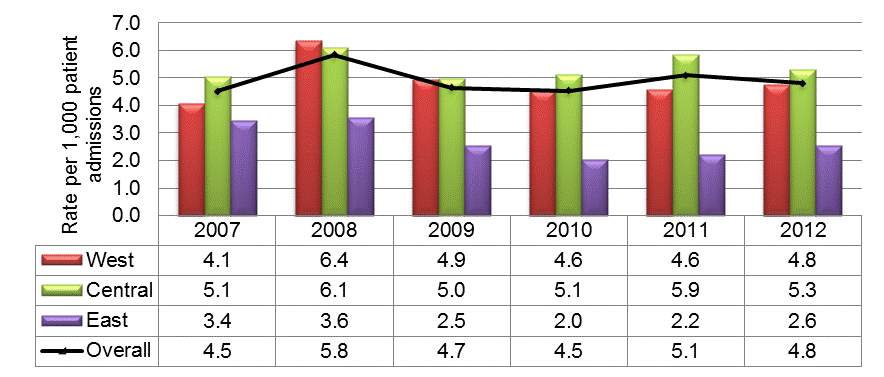
In Canada, national rates of health care-associated Clostridium difficile infection (HA-CDI) peaked in 2008 at 5.8 HA-CDI infections per 1,000 patient admissions then remained stable between 2009 and 2012 at approximately 5 HA-CDI infections per 1,000 admissions; the West and Central regions had higher rates than the Eastern region (Figure 1).
Figure 1: National and regional Health care-associated Clostridium Difficile Infection (HA-CDI) incidence rates per 1,000 patient admissions, January 1, 2007, to December 31, 2012, N = 18,871
Text equivalent - Figure 1
This figure is a histogram showing national and regional incidence rates of hospital-acquired Clostridium difficile infections per 1,000 patient admissions between January 1, 2007 and December 31, 2012 and reflects 18,871 cases. The y axis represents rate per 1,000 patient admissions. The x axis represents each year from 2007 to 2012. Data from the West, Central and East regions are represented by different coloured bars. The West shows incidence rates between 4-5 cases per 1,000 admissions, except for 2008 when the rate goes up to 6.4 cases per 1,000 admissions. The Central region shows incidence rates between 5 and 5.3 except in 2008 and 2011 when the rates go up to 6.1 and 5.9 cases, respectively. The East shows incidence rates between 2 - 2.5 cases per 1,000 admissions except in 2007 and 2008 when the rates go up to 3.4 and 3.6 cases respectively. In addition to the bars there is a black line showing national rates overall. The national rate ranged between 4-5 cases per 1,000 admissions except in 2008 when it was 6.4 cases per 1,000 admissions.
Overall, the North American pulsed field type 1 (NAP 1) strain was the most dominant strain. Of the 2,497 submitted stool specimens, the NAP 1 strain was found in 1,059 (42.4%) specimens; 11.0% were NAP 4 strain type and 10.3% were NAP 2 (data not shown).
Methicillin-resistant Staphylococcus aureus (MRSA)
Staphylococcus aureus (S. aureus) typically colonizes the skin and mucosal surfaces of healthy humans. It can also cause wound, urine, skin and soft tissue infections, osteomyelitis, endocarditis, and bacteremia. S. aureus can be acquired in the community or in the hospital or other health care settings such as long-term care, dialysis, and rehabilitation facilities. S. aureus is particularly successful in becoming antibiotic resistant, explaining in part its high associated burden of disease worldwide Footnote 4. MRSA is a S. aureus that has become resistant to first line beta-lactam antibiotics such as methicillin, oxacillin, penicillin, and amoxicillin. Only health care-associated cases of Clostridium difficile are reported here as per the case definition (see box below).
Case definition of methicillin-resistant Staphylococcus aureus (MRSA) infection
- Isolation of Staphylococcus aureus from any body site
AND - Resistance of isolate to oxacillin
AND - Patient must be admitted to the hospital
AND - Is a "newly identified MRSA case" at a participating CNISP hospital at the time of hospital admission or identified during hospitalization
This includes:
- MRSA cases identified for the first time during this hospital admission
- Cases that have been previously identified at other non-CNISP hospitals
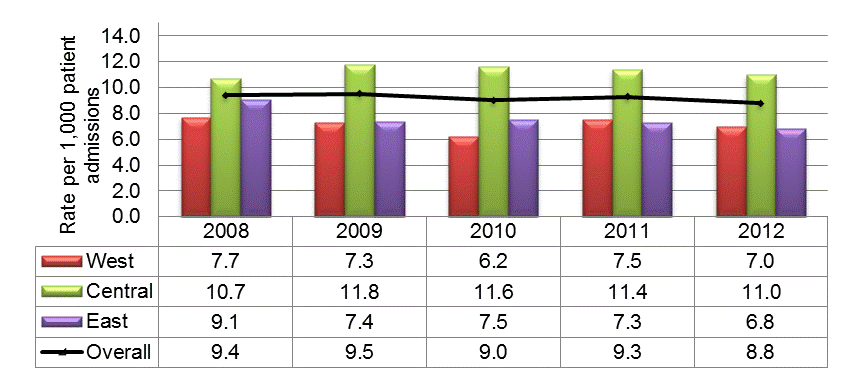
The rates of MRSA peaked in 2009 at 9.5 MRSA infections per 1,000 patient admissions then decreased to 8.8 MRSA infections per 1,000 admissions in 2012. Rates in the Central region have increased slightly since 2008 and are higher than the national average in each surveillance year (Figure 2).
Figure 2: National and regional methicillin-resistant Staphylococcus aureus (MRSA) infection and colonization rates per 1,000 patient admissions, January 1, 2008 to December 31, 2012. N = 9,650
Text equivalent - Figure 2
This figure is a histogram showing national and regional incidence rates of Methicillin-resistant Staphylococcus aureus infections and colonizations per 1,000 patient admissions between January 1, 2008 and December 31, 2012 and reflects 9650 cases. The y axis represents rate per 1,000 patient admissions. The x axis represents each year from 2008 to 2012. Data from the West, Central and East regions are represented by different coloured bars. The West shows incidence rates between 7-7.7 cases per 1,000 admissions, except for 2010 when the rate goes down to 6.2 cases per 1,000 admissions. The Central region shows incidence rates between 11 and 11.8 except in 2008 when the rates is down to 10.7 per 1,000 admissions. The East shows incidence rates between 6.8 - 7.5 cases per 1,000 admissions except in 2008 when the rates go is 9.1 cases per 1,000 admissions. In addition to the bars there is a black line showing national rates overall. The national rate ranges between 8.8 -9.5 cases per 1,000 admissions over the entire time period.
Infections identified as skin, soft tissue or burn were the most common source of MRSA clinical infections and represent, on average, approximately 40% of all clinical infections over the surveillance period. From 2008 to 2012, approximately 9% of patients with a clinical MRSA infection died, and 25% of patients with a MRSA bloodstream infection died at 30 days after the date of positive culture.
Vancomycin-resistant Enterococci (VRE)
VRE infections occur most commonly among those who are hospitalized and immunocompromised, who have been previously treated with vancomycin or other antibiotics for long periods of time, or who are older and have undergone surgical procedures or who have indwelling medical devices such as urinary catheters (see box below).
Case definition of vancomycin-resistant Enterococci
Any inpatient from whom Enterococcus faecium or Enterococcus faecalis having a minimum inhibitory concentration of vancomycin of ≥8 ug/mL was isolated from a clinical specimen.
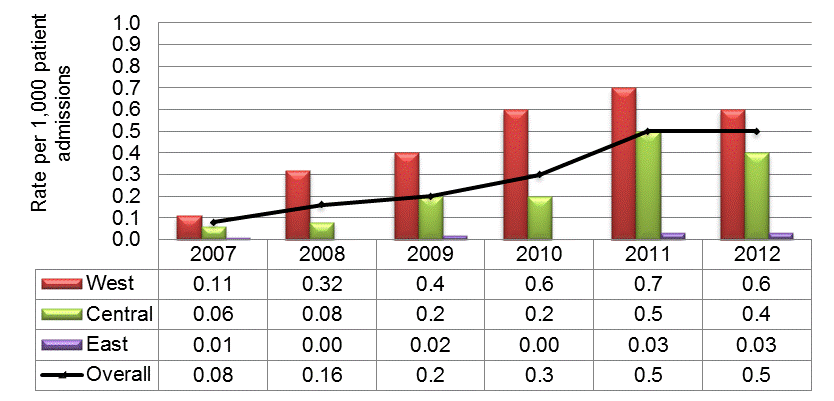
The rates of VRE have been low but rising with 0.08 VRE infections per 1,000 patient admissions in 2007, rising to 0.5 VRE infections per 1,000 admissions in 2012, with consistently higher rates in the Western region, slightly lower rates in the Central region, and the lowest rates in the Eastern region (Figure 3). The vanA gene remains the predominant gene among VRE bloodstream infections.
Figure 3: National and regional vancomycin-resistant Enterococci (VRE) infection incidence rates per 1,000 patient admissions, January 1, 2007 to December 31, 2011. N = 1,510
Text equivalent - Figure 3
This figure is a histogram showing national and regional incidence rates of Vancomycin-resistant Enterococci infections per 1,000 patient admissions between January 1, 2007 and December 31, 2012 and reflects 1510 cases. The y axis represents rate per 1,000 patient admissions. The x axis represents each year from 2007 to 2012. Data from the West, Central and East regions are represented by different coloured bars. The West shows an incident rate of 0.11 cases per 1,000 admissions in 2007 and this increases every year to a high of 0.7 cases per 1,000 admissions in 2011 and then 0.6 cases per 1,000 admissions in 2012. The Central region shows an incident rate of 0.06 cases per 1,000 admissions in 2007 and this increases every year to a high of 0.5 cases per 1,000 admissions in 2011 and then 0.4 cases per 1,000 admissions in 2012. The East shows 0.01 cases per 1000 admissions in 2007, a zero incidence rate in 2008 and 2010 and then incidence rates of 0.02, 0.03 and 0.03 cases per 1,000 admissions in 2009, 2011 and 2012 respectively. In addition to the bars there is a black line showing national rates overall. The national rate begins at 0.08 cases per 1,000 admissions in 2007 and rises to 0.5 cases per 1,000 admissions by 2012.
Carbapenem-resistant Enterobacteriaceae (CRE)
Gram-negative bacilli cause a variety of diseases, ranging from pneumonia to urinary tract infections, wound infections to septicemia. They typically occur in ill patients with exposure to acute and long-term care settings. Infections are commonly caused by species belonging to the Enterobacteriaceae family, such as Escherichia coli, Klebsiella pneumoniae, and Enterobacter cloaca. These bacteria are often resistant to many commonly prescribed antibiotics, but typically remain susceptible to the carbapenem group of antimicrobials. There are currently no new antibiotics in development to combat bacteria resistant to carbapenems. The case definition of carbapenem-resistant Enterobacteriaceae has evolved over time (see box below).
Case definition of carbapenem-resistant Enterobacteriaceae isolates
From January 1, 2010, to August 31, 2010, any patient with an Enterobacteriaceae that exhibited a minimum inhibitory concentration (MIC) value ≥2 mg/ml for any of three carbapenem antimicrobials (imipenem, meropenem, ertapenem); or a disk diffusion diameter ≤1mm was eligible for inclusion.
From September 1, 2010, to December 31, 2012, the MIC for ertapenem was decreased to ≥0.5 mg/ml and a disk diffusion diameter for any carbapenem ≤22 mm was considered eligible for inclusion.
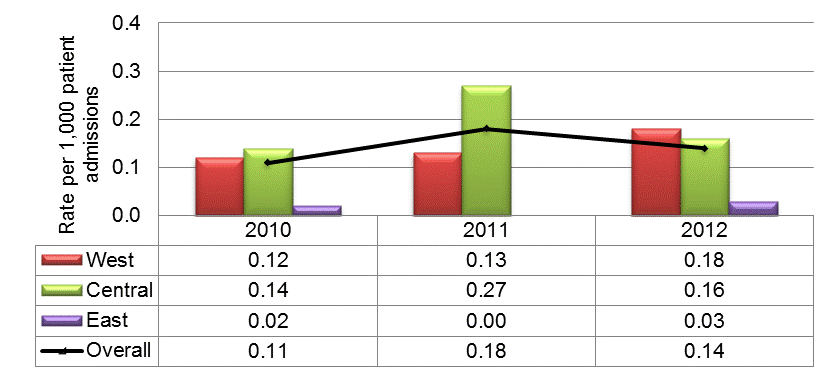
The rates of carbapenem-resistant Enterobacteriaceae (CRE) have been measured since 2010 and have been low and stable, with 0.11 infections per 1,000 patient admissions in 2010 and 0.14 infections per 1,000 admissions in 2012, with higher rates in the Western and Central regions and lower rates in the Eastern region (Figure 4).
Figure 4: National and regional carbapenem-resistant Enterobacteriaceae (CRE) rates per 1,000 patient admissions, January 1, 2010 to December 31, 2012. N = 231
Text equivalent - Figure 4
This figure is a histogram showing national and regional incidence rates of Carbapenem-resistant Enterobacteriaceae infections per 1,000 patient admissions between January 1, 2010 and December 31, 2012 and reflects 231 cases. The y axis represents rate per 1,000 patient admissions. The x axis represents the three years of 2010, 2011 and 2012. Data from the West, Central and East regions are represented by different coloured bars. The West shows an incident rate of 0.12 cases per 1,000 admissions in 2010 and gradually goes up to 0.18 cases per 1,000 admissions in 2012. The Central region shows an incident rate of 0.14 cases per 1,000 admissions in 2010, it increases to 0.27 cases per 1,000 admissions in 2011 and then drops back to 0.16 cases per 1,000 admissions in 2012. The East shows 0.02 cases per 1,000 admissions in 2010, a zero incidence rate in 2010 and then an incidence rate of 0.03 cases per 1,000 admissions in 2012. In addition to the bars there is a black line showing national rates overall. The national rate begins at 0.11 cases per 1,000 admissions in 2010 rises to 0.18 cases in 2011 and then declines to 0.14 cases per 1,000 admissions in 2012.
Discussion
In Canada over the last few years, of the four antibiotic resistant organisms under surveillance, health care-associated Clostridium difficile and methicillin-resistant Staphylococcus aureus have been gradually decreasing; vancomycin-resistant Enterococci infections have been low but are rising; and carbapenem-resistant Enterobacteriaceae infection remains low, with Western and Central rates consistently higher than Eastern rates.
Comparison of Canadian rates with international rates is difficult due to different definitions and analyses. For example, some countries report on MRSA bacteremia versus all types of MRSA. A number of countries report rates per 100,000 population, whereas these Canadian rates have been calculated using patient admissions to hospital. In addition, regional variation in rates is seen in countries and regions around the world. However, the overall trends seen in Canada are not dissimilar from trends observed elsewhere in the world.
Several limitations should be considered when interpreting the data presented here. First, the CNISP surveillance data is likely an underestimate as it does not represent the total number of inpatients in Canada with these infections. These data can only tell us about inpatients who have been tested and diagnosed, and not those who remain untested and undiagnosed. Cases identified in outpatient settings such as emergency departments and clinics are not captured by this surveillance system. Participating hospitals are not necessarily representative of all Canadian hospitals; for example, they tend to be large, tertiary acute care centres located in major cities. Antibiotic prescribing practices and implementation of infection prevention, and control measures may vary across hospitals, but because this surveillance system does not collect data regarding these factors, it is not possible to correlate them with the occurrence of these infections. And, as always, these results are subject to change as new data are made available.
Antimicrobial resistance will continue to challenge the health of Canadians and of people around the world for some time to come. Surveillance will help document the progress we continue to make in curbing it.
Acknowledgements
The authors would like to acknowledge all those involved in CNISP at the participating hospitals for providing the non-nominal confidential data. Without their close collaboration and participation, the analysis and reporting of this data would not have been possible. A list of all the collaborators can be found in the full report Footnote 1.
Conflict of interest
None.
Funding
This work was supported by the Public Health Agency of Canada.
Page details
- Date modified: