
Binge drinking and academic performance, engagement, aspirations, and expectations: a longitudinal analysis among secondary school students in the COMPASS study
Health Promotion and Chronic Disease Prevention in Canada
Karen A. Patte, PhDEndnote 1; Wei Qian, MScEndnote 2; Scott T. Leatherdale, PhDEndnote 2
https://doi.org/10.24095/hpcdp.37.11.02
This article has been peer reviewed.
Author references:
- Endnote 1
-
Department of Health Sciences, Brock University, St. Catharines, Ontario, Canada
- Endnote 2
-
School of Public Health and Health Systems, University of Waterloo, Waterloo, Ontario, Canada
Correspondence: Karen Patte, Assistant Professor, Department of Health Sciences, Brock University, Niagara Region, 1812 Sir Isaac Brock Way, STH 326a, St. Catharines, ON L2S 3A1; Tel: 905-688-5550 ext. 3882; Email: kpatte@brocku.ca
Abstract
Introduction: The longitudinal relationship between binge drinking and academic engagement, performance, and future aspirations and expectations was examined among a cohort of secondary school students.
Methods: In separate multinomial generalized estimating equations models, linked data from Year 1 (Y1: 2012-2013), Year 2 (Y2: 2013-2014), and Year 3 (Y3: 2014-2015) of the COMPASS study (N = 27 112) were used to test the relative likelihood of responses to seven academic indices when binge drinking was initiated in varying frequencies, adjusting for gender, grade, race/ethnicity, tobacco use, and the individual mean of the predictor and all time-varying covariates.
Results: Among students who had never engaged in binge drinking at baseline, those who reported regular binge drinking at follow-up were relatively less likely to complete their homework, attend class, and value and achieve high grades, with more frequent binge drinking at follow-up generally resulting in larger relative risk ratios. Interestingly, shifting from "never" to "rare/sporadic" binge drinking one to two years later resulted in an increased relative risk of wanting to pursue all levels of postsecondary education. Beginning binge drinking on a "monthly" basis also increased the likelihood of college/trade or bachelor degree ambitions, relative to high school, but not graduate/professional pathways; while degree aspirations were not associated with initiating weekly binge drinking.
Conclusions: Results suggest students who initiate binge drinking have poor school performance and engagement, which may interfere with achieving their future academic goals. This study reinforces the reasons substance use prevention should be considered an academic priority, as such efforts may also prove beneficial for educational achievement.
Keywords: binge drinking, alcohol, education, academic achievement, adolescents, school
Highlights
- Linked longitudinal data were used to test the relative likelihood of responses to seven academic indices when binge drinking was initiated in varying frequencies among a large cohort of secondary school students.
- Students who initiated regular binge drinking at follow-up were relatively less likely to complete their homework, to attend class, and to value and achieve high grades.
- Results indicate that adolescents who initiate binge drinking have a relatively higher risk of poor academic performance, and a lack of preparedness and engagement, while their future academic aspirations and expectations remain largely intact.
- Substance use prevention efforts may also prove beneficial for academic achievement and engagement.
Introduction
Adolescent substance use prevention is a key public health priority. Alcohol is the most frequently abused substance and is associated with the leading causes of death and serious injury (including motor vehicle accidents and suicide) among youth.Footnote 1,Footnote 2 Among adolescents who use alcohol, the proportion who drink heavily appears higher than among adult drinkers, and tends to occur in a more episodic manner, with binge drinking—the consumption of large volumes of alcohol (i.e. five or more standard drinks) on a single occasion—acknowledged as the dominant pattern at this age.Footnote 2,Footnote 3,Footnote 4,Footnote 5 Based on 2011–2012 estimates, one-third of Canadians in Grades 10 to 12 had engaged in binge drinking within the past year.6 Similarly, in 2012–2013, about one-quarter of Ontario secondary school students reported binge drinking in the prior year, reaching up to 36.7% of students in grade 12.Footnote 5,Footnote 7
Binge drinking typically emerges around 13 to 15 years of age, peaking in the late teenage years or early 20s, followed by a slow decline.Footnote 4,Footnote 8 Underage drinking is often deemed a common transitory behaviour, reflective of the increased propensity for risk-taking during this phase; however, experts argue that adolescents are particularly vulnerable to experiencing adverse consequences from alcohol use, and binge consumption magnifies the risk.Footnote 1,Footnote 3,Footnote 9,Footnote 10 The initiation of alcohol use occurs alongside changes in life roles and neurobiological maturationFootnote 11 and, therefore, has the potential to disrupt processes critical to the successful transition from childhood to adulthood. Educational achievement is an important determinant of how well this developmental stage is navigated. School failure, noncompletion, and truancy increase the likelihood of numerous problems later in life, including health-risk behaviours, criminality, violence, unemployment, and poverty.Footnote 12
Alcohol use during adolescence may foster academic underachievement and disengagement, based on several cross-sectional studiesFootnote 13,Footnote 14 and selected longitudinal analyses.Footnote 15,Footnote 16 For instance, heavy drinking among youth has been linked to lower school grades,Footnote 13,Footnote 14,Footnote 15,Footnote 16 truancy,Footnote 13Footnote 17,Footnote 18,Footnote 19 and degree noncompletion.Footnote 20 However, many conflicting results also exist in the literature.Footnote 21,Footnote 22 Moreover, reasons for the proposed link between substance use and education achievement remain poorly understood.
Direct causal theories point to the neurotoxicity of alcohol. Scholars widely agree that adolescence represents a period of heightened vulnerability, as the brain continues to undergo substantial development until at least the mid-20s.Footnote 3 Imaging research reveals reduced brain matter volume and integrity, as well as neurocognitive deficits (e.g. impaired memory and decision making), among heavy drinking adolescents compared to their non-/low drinking peers.Footnote 10,Footnote 23,Footnote 24 Frequent binge behaviour appears especially harmful, based on associations between the quantity and frequency of alcohol consumption with the persistence and degree of structural and functional abnormalities.Footnote 3,Footnote 9,Footnote 10,Footnote 11 As the majority of studies have been cross-sectional in design, questions persist regarding whether reported neurocognitive differences predate (i.e. as genetic liabilities for substance use or pre-existing cognitive deficits) or result from alcohol use.Footnote 10,Footnote 11
Similarly, the direction of influence between substance use and academic achievement is uncertain. Problematic alcohol use is largely assumed to predict lower educational performance and degree attainment. In support, Latvala et al.Footnote 16 found both alcohol use and drinking to intoxication in adolescence predicted later school completion, and not vice-versa. In contrast, some evidence suggests reverse causationFootnote 14,Footnote 15,Footnote 17 or mutually reinforcing effects.Footnote 25,Footnote 26 For example, Wang and FredricksFootnote 26 found a bidirectional relationship between school engagement and youth substance use over time, and both factors predicted the likelihood of dropping out of school, although the independent effect of alcohol was not reported. Indirect or noncausal pathways have also been proposed.Footnote 21,Footnote 22 Shared underlying risk factors such as mental health problems, low socio-economic status (SES), family instability, and a lack of parental monitoring and support may predispose adolescents to both underachievement and substance use. A similar theory contends drug use is simply one aspect of an overall pattern of problem behaviours.
Interpretation of the existing literature is also hindered by inconsistent measures of academic achievement or the reliance on degree completion as the only outcome measure. School dropout is likely preceded by a period of student apathy, declining grades, truancy, and/or disciplinary problems. Incorporating a range of academic outcomes would help to elucidate the potential mechanisms through which binge drinking may lead to school dropout. Also, focusing solely on degree attainment overlooks any adverse influences of binge drinking on school performance and engagement among students who manage to graduate. Past research on alcohol use may fail to adequately capture the impact on academic outcomes experienced by adolescents who binge drink, the dominant pattern of alcohol use at this age. To help clarify the above discussed ambiguities, the current study tested multiple models among a large cohort of secondary school students with the initiation of binge drinking in varying frequencies predicting several indices of educational engagement, performance, aspirations, and expectations.
Methods
Design
The COMPASS study is a prospective cohort study designed to collect hierarchical longitudinal data from a sample of Grade 9 to 12 secondary school students and the schools they attend in Ontario and Alberta, Canada.Footnote 28 The current study reports longitudinal student-level linked data from Year 1(Y1: 2012–2013), Year 2(Y2: 2013–2014), and Year 3(Y3: 2014–2015). A full description of the COMPASS study methods is available in printFootnote 27 or online (www.compass.uwaterloo.ca). The University of Waterloo Office of Research Ethics (ORE #17264) and appropriate school board committees approved all procedures.
Participants
In Y1, 43 schools were purposefully recruited because they permitted use of active-information passive-consent parental permission protocols,Footnote 28 which is critical for collecting robust data on youth substance use.Footnote 29 Students could decline to participate at any time. In Y1, data were collected from 24 173 Grade 9-12 students (80.2% participation rate) in 43 schools. Y2 data were collected from 23 424 Grade 9-12 students (78.2% participation rate) in the same 43 schools, and an additional 46 schools were recruited into the study where data were collected from 21 874 Grade 9-12 students (80.2% participation rate). Y3 data were collected from 42 355 Grade 9-12 students (78.7% participation rate) in 87 schools (two schools of the 43 Y1 schools dropped out between Y2 and Y3). Missing respondents resulted primarily from scheduled spares/free periods or absenteeism during data collection.
To explore longitudinal changes, we linked Y1, Y2, and Y3 student-level data within schools. The process of linking the student data across waves is described in more detail by Qian and colleagues.Footnote 30 Due to the rolling sample design,Footnote 28 it was not possible to link the Grade 12 students in Y1 or the Grade 12 students in Y2 that graduated, or the Grade 9 students that were newly admitted to schools in Y3. The other main reasons for non-linkage included students transferring schools, absent or on spares, dropping out of school, or inaccurate or missing data provided in the linkage measures. Overall, 27 329 students were successfully linked for at least two years of the study (linkage rates for Y1, Y2, and Y3 were 51.4%, 57%, and 50%, respectively), with 18.0% (n = 4914) completing the questionnaire in all three years. Only students that were linked for two or three waves of data were included in the analyses. Missing data were treated as missing at random and excluded on an analysis-by-analysis basis. Based on previous analyses,Footnote 30 students with better academic performance were less likely to be missing; however, results of a preliminary longitudinal regression analysis (generalized estimating equations [GEE] model) supported our assumption that the transition/change in the academic outcomes over study waves were similar for missing and nonmissing groups, with the exception of the homework completion variable. Homework completion may be subject to nonresponse bias and should be interpreted with caution.
Data collection tool
The student-level questionnaire for COMPASS (Cq) collects individual student data pertaining to multiple behavioural domains (substance use, physical activity, diet, etc.), correlates, and demographic characteristics. In each school, the Cq was used to collect whole-school samples during class time. The Cq items were based on national standards or current national public health guidelines as described elsewhere.Footnote 28 The cover page of the Cq contains measures required to create a unique self-generated code for each respondent in a school to ensure the anonymity of the survey participants, while still allowing COMPASS researchers to link each student's unique identifier data over multiple years.
Measures
Binge drinking
To assess binge drinking, students were asked "In the last 12 months, how often did you have 5 drinks of alcohol or more on one occasion?". Responses were recoded as "never" if students reported they had never drunk alcohol, had only had a sip of alcohol, had never had 5 or more drinks on one occasion, or had not done so within the past 12 months. Participants were considered to binge drink on a "rare/sporadic" basis if they responded "less than once a month", on a "monthly" basis if they responded "once a month" or "two to three times a month", and "weekly" if they engaged in binge drinking "once a week" or "two to five times a week." Students who responded "daily or almost daily" binge drinking over the last 12 months were deemed probable misreports and excluded. While the available Cq measure does not align with the low-risk drinking guideline for binge drinking among females,Footnote 31 it is consistent with previous researchFootnote 5,Footnote 7,Footnote 28 and national surveillance tools.Footnote 32
Academic variables
Academic aspirations and expectations were assessed by asking, "What is the highest level of education you would like to get?" and "What is the highest level of education you think you will get?" respectively.
To measure academic performance, students were asked "In your current or most recent Math course, what is your approximate overall mark?" The same question was used to assess English marks.
The following survey items were intended to reflect different aspects of school engagement. The value students assigned to school performance was assessed by how strongly they agreed with the statement, "Getting good grades is important to me". Truancy was determined by the number of classes skipped when not supposed to in the last four weeks. Lastly, participants were asked, "how often do you go to class without your homework complete?"
Spearman rank correlation coefficients were calculated to examine correlations between the academic variables. Overall, the coefficients indicated significant weak correlations in the expected direction between the various indices (See Table 1). Response categories for all academic variables are shown in Table 2. Some categories were collapsed if the number of responses was insufficient to be modelled.
| N/A | 1 | 2 | 3 | 4 | 5 | 6 |
|---|---|---|---|---|---|---|
| 1. Level of education would like to get | N/A | N/A | N/A | N/A | N/A | N/A |
| 2. Level of education expect to get | 0.72Table 1 footnote * | N/A | N/A | N/A | N/A | N/A |
| 3. How often goes to class without homework complete | 0.09Table 1 footnote * | −0.11Table 1 footnote * | N/A | N/A | N/A | N/A |
| 4. Number of classes skipped in last 4 weeks | −0.12Table 1 footnote * | −0.14Table 1 footnote * | 0.23Table 1 footnote * | N/A | N/A | N/A |
| 5. "Getting good grades is important to me" | −0.20Table 1 footnote * | −0.23Table 1 footnote * | N/A0.29Table 1 footnote * | 0.20Table 1 footnote * | N/A | N/A |
| 6. English course mark | −0.21Table 1 footnote * | −0.24Table 1 footnote * | N/A0.20Table 1 footnote * | 0.13Table 1 footnote * | 0.34Table 1 footnote * | N/A |
| 7. Math course mark | −0.18Table 1 footnote * | −0.21Table 1 footnote * | 0.20Table 1 footnote * | 0.13Table 1 footnote * | 0.30Table 1 footnote * | 0.44Table 1 footnote * |
|
Notes: Year 1: 2012–2013, year 2: 2013–2014 and year 3: 2014–2015.
For the level of education students would like to or expect to get, higher numbers indicate higher degrees (i.e. in the order of: high school, college/trade/vocational, bachelor's, graduate/professional). For other variables, higher numbers indicate lower English or Math marks, or that students report skipping classes or not completing their homework more often. Student responses are pooled for all available data for the three years of available data, as each year closely resembled the other years when calculated separately. |
||||||
Covariates
All regression models were adjusted for student-reported gender (male, female), grade (9-12), and race/ethnicity (White, Black, Asian, Hispanic, Off-Reserve Aboriginal, Other/mixed/missing), given evidence of variations in drinking behaviour and in educational engagement, performance, and/or degree attainment among these socio-demographic groups.Footnote 2,Footnote 33,Footnote 34,Footnote 35 Models also adjusted for tobacco cigarette use (current, past, never), as it tends to cluster with many suggested confounders (e.g. parental education and substance use, as well as low SES). Age was not included due to the high correlation with grade, which is a more meaningful indicator for school-based prevention planning.
Statistical analysis
Descriptive statistics were calculated using statistical package SAS version 9.4 (SAS Institute Inc., Cary, NC, USA) for responses at first participation in the COMPASS study (baseline).
Multinomial GEE models were used to explain the within-individual associations of each of the academic variables with binge drinking. Models require specification of marginal regression models and correlations. Suppose there are response categories and the category is the baseline. We modeled the marginal regression model as a baseline category logit model, such that,
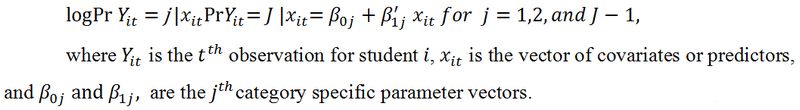
Figure: Equation 1 - Text Description
The coefficient of a predictor/covariate represents the amount of increase in the relative log odds of a student being in a group (j) vs. being in the reference group (J) associated with a one-unit increase in this predictor/covariate, holding other predictors/covariates fixed.
Person-mean centering is used for time-varying predictors to disaggregate between-person and within-person effects for the time-varying predictor.Footnote 36 As binge-drinking status has multiple categories, we first transformed the categorical predictor into multiple dummy variables and then calculated their personal means across time. Those dummy variables and their personal means are included in the model.Footnote 37 This technique was also applied to other time-varying covariates.
To evaluate the impact of within-school association, Kendall's tau coefficients were calculated for all pairs of observations from different students within the same school for all academic variables. The values ranged from -0.013 to -0.001, which suggested weak within-school association. In contrast, Kendall's tau coefficients for all pairs of observations from the same student (range 0.32, 0.60) indicated strong within-individual association. In the model, the within-individual association at the student level were constructed using local odds ratios.
The computation was implemented using the R package multgee.Footnote 38 More details can be found in Touloumis et al.Footnote 39,Footnote 40 Separate models were constructed for the effect of binge drinking on each academic outcome variable. The total sample (i.e. students linked for at least two waves of data) was included in all models. To simplify our tables, and to inform prevention strategies, only the relative results for students who went from "never" binge drinking at baseline to the other binge drinking groups at follow-up are presented. Models were adjusted for gender, grade, race/ethnicity, and tobacco use.
Results
Descriptive statistics
After excluding students with probable misreports (i.e. "daily or almost daily" binge drinking over the last year; n = 217), a final sample of 27 112 remained for the analyses. Table 2 presents the baseline frequency statistics in the first year that students participated. Few students had used tobacco, and the majority identified as White, and 52.8% as female. At baseline, 38.0% of females and 35.6% of males had engaged in binge drinking, with about 15% doing so once a month or more. Baseline responses to the academic variables were encouraging, with most students valuing good grades, achieving high marks, attending classes, regularly completing their homework, and aspiring to pursue postsecondary education.
| N/A | Females n = 14 323 n (%)Table 2 footnote a |
Males n = 12 789 n (%)Table 2 footnote a |
Chi-square |
|---|---|---|---|
| Grade | |||
| 9 | 6301 (44.0) | 5747 (44.9) | p < .0001 |
| 10 | 4494 (31.4) | 3862 (30.2) | |
| 11 | 3319 (23.2) | 2839 (22.2) | |
| 12 | 209 (1.5) | 341 (2.7) | |
| Race/ethnicity | |||
| White | 11 060 (77.2) | 9646 (75.4) | p < .0001 |
| Black | 409 (2.9) | 554 (4.3) | |
| Asian | 761 (5.3) | 677 (5.3) | |
| Off-reserve Aboriginal | 374 (2.6) | 334 (2.6) | |
| Hispanic | 257 (1.8) | 274 (2.1) | |
| Other/mixed/missing | 1462 (10.2) | 1304 (10.2) | |
| Tobacco use (cigarettes only) | |||
| Current | 273 (1.9) | 355 (2.8) | p < .0001 |
| Past | 64 (0.5) | 56 (0.4) | |
| Never | 13 986 (97.6) | 12 378 (96.8) | |
| Binge drinking frequency | |||
| Never | 8879 (62.0) | 8242 (64.5) | p < .0001 |
| Rare/sporadic | 3378 (23.6) | 2634 (20.6) | |
| Monthly | 1691 (11.8) | 1502 (11.7) | |
| Weekly | 375 (2.6) | 411 (3.2) | |
| Level of education would like to get | |||
| High school equivalency or less | 451 (4.0) | 596 (5.9) | p < .0001 |
| College diploma/trade/vocational | 1929 (17.0) | 3078 (30.3) | |
| University bachelor's degree | 2386 (21.0) | 2267 (22.3) | |
| Master's/PhD/law/medical/teacher's college | 6582 (58.0) | 4223 (41.6) | |
| Level of education expect to get | |||
| High school equivalency or less | 688 (6.3) | 702 (6.9) | p < .0001 |
| College diploma/trade/vocational | 2563 (23.6) | 3576 (35.3) | |
| University bachelor's degree | 3059 (28.2) | 2764 (27.3) | |
| Master's/PhD/law/medical/teacher's college | 4557 (41.9) | 3093 (30.5) | |
| Math course mark | |||
| 90–100% | 2907 (20.8) | 2356 (19.0) | p < .0001 |
| 80–89% | 4479 (32.0) | 3765 (30.4) | |
| 70–79% | 3422 (24.4) | 3176 (25.6) | |
| 60–69% | 1795 (12.8) | 1764 (14.2) | |
| Less than 60% | 1401 (10.0) | 1343 (10.8) | |
| English course mark | |||
| 90–100% | 2259 (16.2) | 1053 (8.6) | p < .0001 |
| 80–89% | 6097 (43.6) | 4201 (34.1) | |
| 70–79% | 3932 (28.2) | 4468 (36.3) | |
| 60–69% | 1208 (8.7) | 1765 (14.3) | |
| Less than 60% | 469 (3.4) | 822 (6.7) | |
| "Getting good grades is important to me" | |||
| Disagree/strongly disagree | 411 (2.9) | 719 (5.8) | p < .0001 |
| Agree | 4790 (33.9) | 5436 (43.6) | |
| Strongly agree | 8924 (63.2) | 6304 (50.6) | |
| How often goes to class without homework complete | |||
| Never | 3454 (24.5) | 2448 (19.6) | p < .0001 |
| Seldom | 7807 (55.4) | 6782 (54.3) | |
| Often | 1959 (13.9) | 2245 (18.0) | |
| Usually | 869 (6.2) | 1016 (8.1) | |
| Number of classes skipped in last 4 weeks | |||
| 0 | 11 376 (80.5) | 10 392 (83.1) | p < .0001 |
| 1-5 | 2535 (18.0) | 1891 (15.1) | |
| 6+ | 204 (1.5) | 223 (1.8) | |
|
Notes:Year 1: 2012–2013, year 2: 2013–2014 and year 3: 2014–2015.
Student responses are reported for the first year a respondent participated. |
|||
The cross-sectional distribution of student responses to the binge drinking frequency measure by year of data collection is presented in Figure 1 for the total sample, and in Figure 2 for students with all three years of linked data available. The transition of students between binge drinking categories from Y1 to Y2 and from Y2 to Y3 is presented in Table 3.
Figure 1. Binge drinking frequency in the total three-year linked sample of secondary school students in the COMPASS study
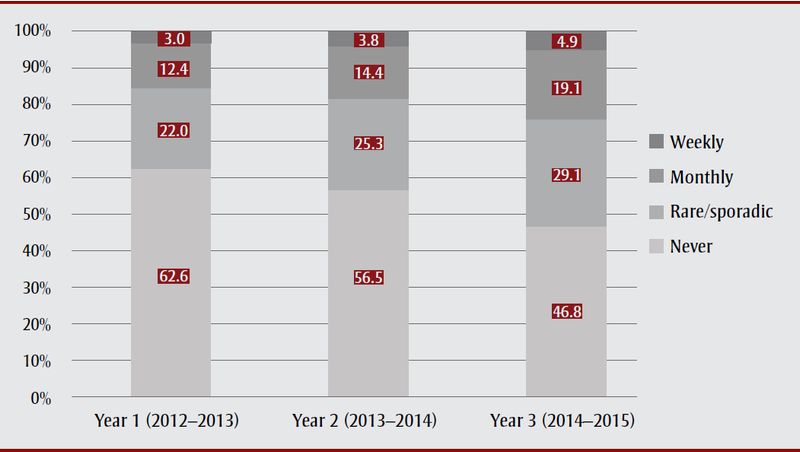
Note: Sample size is 12 317 in year 1, 25 675 in year 2 and 21 088 in year 3.
Figure 1: Binge drinking frequency in the total three-year linked sample of secondary school students in the COMPASS study - Text Description
The cross-sectional distribution of student responses to the binge drinking frequency measure by year of data collection is presented for the total sample is presented in this figure.
In Year 1 (2012/2013), 3.0% engaged in binge drinking weekly, 12.4% monthly, 22.0% rarely or sporadically, and 62.6% never. In Year 2 (2013/2014), 3.8% engaged in binge drinking weekly, 14.4% monthly, 25.3% rarely or sporadically, and 56.5% never. In Year 3 (2014/2015), 4.9% engaged in binge drinking weekly, 19.1% monthly, 29.1% rarely or sporadically, and 46.8% never.
Figure 2. Binge drinking frequency by study wave among secondary school students with three years of linked data from the COMPASS study
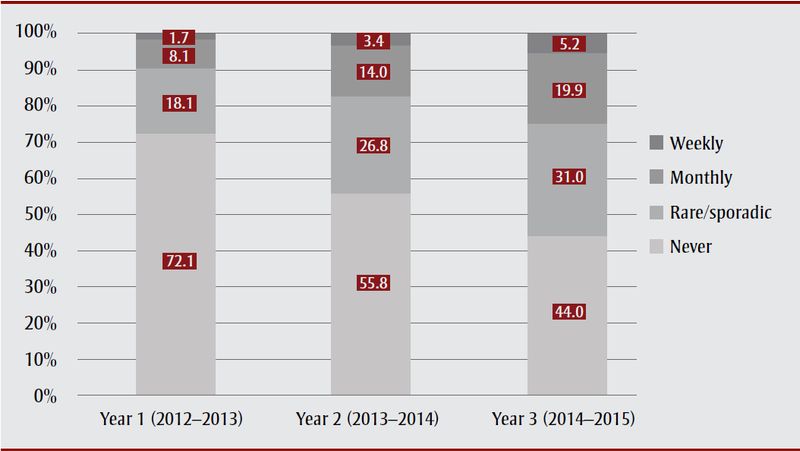
Note: Sample size is 4856.
Figure 2: Binge drinking frequency by study wave among secondary school students with three years of linked data from the COMPASS study - Text Description
The cross-sectional distribution of student responses to the binge drinking frequency measure by year of data collection is presented for students with all three years of linked data available is presented in this figure.
In Year 1 (2012/2013), 1.7% engaged in binge drinking weekly, 8.1% monthly, 18.1% rarely or sporadically, and 72.1% never. In Year 2 (2013/2014), 3.4% engaged in binge drinking weekly, 14.0% monthly, 26.8% rarely or sporadically, and 55.8% never. In Year 3 (2014/2015), 5.2% engaged in binge drinking weekly, 19.9% monthly, 31.0% rarely or sporadically, and 44.0% never.
| Year 1 | Year 2 | ||||
|---|---|---|---|---|---|
| Never n (%) |
Rare/sporadic n (%) |
Monthly n (%) |
Weekly n (%) |
Total | |
| Never | 4629 (68.2) | 1559 (23.4) | 469 (6.7) | 84 (1.6) | 6741 |
| Rare/sporadic | 373 (14.1) | 1246 (51.1) | 720 (29.6) | 112 (5.1) | 2451 |
| Monthly | 87 (5.1) | 346 (25.3) | 722 (53.3) | 209 (16.3) | 1364 |
| Weekly | 13 (3.5) | 38 (11.9) | 110 (33.9) | 163 (50.7) | 324 |
| Total | 5102 | 3189 | 2021 | 568 | 10 880 |
| Year 2 | Year 3 | ||||
| Never n (%) |
Rare/sporadic n (%) |
Monthly n (%) |
Weekly n (%) |
Total | |
| Never | 8382 (69.2) | 2755 (22.7) | 845 (7.0) | 139 (1.2) | 12 121 |
| Rare/sporadic | 733 (15.6) | 2311 (50.2) | 1378 (30.0) | 179 (3.9) | 4601 |
| Monthly | 166 (7.1) | 560 (23.9) | 1242 (53.0) | 380 (16.2) | 2348 |
| Weekly | 42 (7.2) | 66 (11.4) | 224 (38.6) | 249 (42.9) | 581 |
| Total | 9323 | 5692 | 3689 | 947 | 19 651 |
| Note: Year 1: 2012–2013, year 2: 2013–2014 and year 3: 2014–2015. | |||||
Multinomial GEE models
Table 4 presents the relative risk ratios (RRRs) of students reporting college, university, or graduate/professional academic aspirations and expectations over "high school equivalency or less", when student reports shifted from "never" binge drinking at baseline to "rare/sporadic", "monthly", or "weekly" in the one to two years following. Reported results are adjusted for student-identified gender, race/ethnicity, and grade. Students who began binge drinking on a rare/sporadic basis at follow-up were more likely to report aspirations to pursue all levels of higher education rather than aim to discontinue their education at high school, but were no more or less likely to report different degree expectations. Starting to binge drink monthly in the following year or two increased the odds of college/trade school and university bachelor ambitions and expectations after high school, but did not impact the likelihood of reporting graduate/professional degree goals or expectations. The initiation of binge drinking on a weekly basis at follow-up did not influence the relative likelihood of the degree students aspired or expected to achieve.
Table 4 also presents the academic engagement and performance models, adjusted for the covariates. Students who went from never binge drinking at baseline to regular binge drinking at follow-up were more likely to attend class with incomplete homework, skip class, achieve high marks, and disagree that good grades were important to them, than to complete their homework, attend class, report marks less than 60%, and strongly agree that good grades were important to them. Students who initiated rare/sporadic binge drinking were also relatively less likely to complete their homework, achieve high English marks, and agree that good grades were important, in comparison to the reference category response options.
Overall, based on the RRRs, the more frequent the initiated binge drinking, the lower the likelihood of high academic performance and engagement.
| N/A | Binge drinking frequency (vs. Never) | ||
|---|---|---|---|
| N/A | Rare/sporadic RRRTable 4 footnote a (95% CI) |
Monthly RRRTable 4 footnote a (95% CI) |
Weekly RRRTable 4 footnote a (95% CI) |
| Level of education would like to get (vs. High school equivalency or less) (n = 20 458)Table 4 footnote b | |||
| College/trade/vocational | 1.38 (1.13–1.68), p = .0014 | 1.39 (1.08–1.78), p = .0095 | 1.35 (0.93–1.97), p = .1128 |
| Bachelor's | 1.43 (1.18–1.72), p = .0002 | 1.39 (1.09–1.77), p = .0089 | 1.46 (1.00–2.12), p = .0514 |
| Graduate/professional | 1.27 (1.06–1.52), p = .0098 | 1.25 (0.99–1.59), p = .0598 | 1.08 (0.75–1.55), p = .6832 |
| Level of education expect to get (vs. High school equivalency or less) (n = 19 869) | |||
| College/trade/vocational | 1.16 (0.98–1.37), p = .0753 | 1.32 (1.06–1.63), p = .0116 | 1.28 (0.92–1.79), p = .1475 |
| Bachelor's | 1.14 (0.98–1.34), p = .0950 | 1.28 (1.04–1.57), p = .0213 | 1.16 (0.83–1.62), p = .3803 |
| Graduate/professional | 1.08 (0.93–1.26), p = .3115 | 1.16 (0.95–1.42), p = .1408 | 1.05 (0.76–1.47), p = .7536 |
| How often do you go to class without your homework complete? (vs. Never) (n = 26 310) | |||
| Seldom | 1.38 (1.21–1.58), p < .0001 | 1.90 (1.58–2.28), p < .0001 | 2.33 (1.75–3.11), p < .0001 |
| Often | 1.40 (1.27–1.54), p < .0001 | 1.59 (1.39–1.83), p < .0001 | 1.87 (1.48–2.37), p < .0001 |
| Usually | 1.19 (1.10–1.29), p < .0001 | 1.19 (1.06–1.34), p = .0040 | 1.12 (0.90–1.39), p = .3041 |
| Number of classes skipped (when not supposed to) in the last 4 weeks (vs. 0) (n = 26 360) | |||
| 1-5 | 1.43 (1.32–1.55), p < .0001 | 1.80 (1.62–1.99), p < .0001 | 2.17 (1.85–2.54), p < .0001 |
| 6+ | 1.59 (1.23–2.06), p = .0004 | 2.66 (2.00–3.55), p < .0001 | 4.77 (3.35–6.80), p < .0001 |
| "Getting good grades is important to me" (vs. Strongly agree) (n = 26 239) | |||
| Agree | 1.21 (1.05–1.39), p = .0078 | 1.41 (1.17–1.69), p = .0003 | 1.78 (1.38–2.30), p < .0001 |
| Disagree/strongly disagree | 1.05 (0.99–1.11), p = .0846 | 1.20 (1.11–1.30), p < .0001 | 1.39 (1.21–1.59), p < .0001 |
| Mark in most recent English course (vs. Less than 60%) (n = 26 021) | |||
| 60–69% | 0.95 (0.83–1.09), p = .4795 | 0.93 (0.78–1.11), p = .4286 | 0.72 (0.55–0.95), p = .0206 |
| 70–79% | 0.85 (0.76–0.95), p = .0060 | 0.77 (0.67–0.90), p = .0006 | 0.62 (0.49–0.78), p < .0001 |
| 80–89% | 0.86 (0.77–0.96), p = .0079 | 0.85 (0.74–0.97), p = .0195 | 0.74 (0.60–0.92), p = .0062 |
| 90–100% | 0.87 (0.78–0.98), p = .0164 | 0.82 (0.71–0.95), p = .0089 | 0.71 (0.56–0.90), p = .0051 |
| Mark in most recent Math course (vs. Less than 60%) (n = 26 132) | |||
| 60–69% | 0.87 (0.72–1.05), p = .1433 | 0.83 (0.65–1.06), p = .1335 | 0.65 (0.47–0.92), p = .0135 |
| 70–79% | 0.91 (0.77–1.07), p = .2341 | 0.79 (0.64–0.97), p = .0224 | 0.51 (0.38–0.69), p < .0001 |
| 80–89% | 0.86 (0.74–1.01), p = .0588 | 0.75 (0.61–0.91), p = .0041 | 0.53 (0.39–0.70), p < .0001 |
| 90–100% | 0.85 (0.72–1.00), p = .0549 | 0.70 (0.56–0.87), p = .0014 | 0.47 (0.33–0.68), p < .0001 |
|
Abbreviations: CI, confidence interval; GEE, generalized estimating equations; RRR, relative risk ratio.
Notes: Year 1: 2012–2013, year 2: 2013–2014 and year 3: 2014–2015. Results reflect the likelihood of students reporting the indicated response category relative to reference category when they shift from reporting "Never" binge drinking at baseline to "Rare/Sporadic", "Monthly", or "Weekly" at follow-up. |
|||
Discussion
Previous research has been inconsistent on the link between alcohol use and academic achievement. To ascertain whether the findings were similar among high-risk drinkers—the population typically targeted by prevention strategies—the current study examined how the initiation of binge drinking during adolescence impacts educational performance, engagement, and future goals and expectations. Among a large cohort of secondary school students in the COMPASS study, linked longitudinal data was used to test the relative likelihood of different responses to various academic indices when participants went from never binge drinking at baseline to reporting varying frequencies of binge drinking one or two years later.
As expected, students who started regular binge drinking were more likely to report academic disengagement and poor performance than to regularly attend class, complete their homework, consider good grades important, and achieve high marks. Results lend support to a step-wise relationship; that is, the more frequent the binge drinking reported at follow-up, the lower the likelihood of being engaged and performing well in school. On the other hand, when asked about their academic goals, youth who began binge drinking on a rare/sporadic or monthly basis had a greater relative risk of reporting ambitions and expectations to pursue higher education past high school. Students who commenced weekly binge drinking were no more or less likely to indicate postsecondary degree ambitions. Similarly, the degree-level students expected to achieve did not appear to change when binge drinking was initiated at a rare/sporadic or weekly frequency.
The multiple academic indices and range of binge drinking frequencies included in this study, and the varying findings among the models, shed light on potential sources of disagreement in past research, which was often limited to dichotomous alcohol use variables or single academic outcome measures. The majority of the various academic indices included in the current study had weak correlations. Wormington and colleaguesFootnote 41 argue literature inconsistencies resulted from aggregation of qualitatively different types of educational motives. Past conflicting results tend to centre around degree attainment,Footnote 21,Footnote 22 whereas findings with school engagement have been more consistent, although many of these studies only included truancy to indicate disengagement.Footnote 13,Footnote 17,Footnote 18 In the current study, while students who started binge drinking had the anticipated greater risk of disengagement and poor performance, which increased with the initiation of more frequent binge drinking, results of the academic expectations and aspirations models were null or in the opposing direction. In other words, although engagement and performance suffered, the future ambitions to pursue higher education appeared to remain largely intact when students commenced binge drinking. Consistent with this finding, the academic expectation and aspiration variables had relatively weaker correlations with the indicators of academic engagement and performance. Whether the disengagement and poor performance prevents students from achieving their educational goals may depend on whether binge drinking is sustained,Footnote 42 supporting the need for early intervention efforts targeting heavy alcohol users.
Compared to other substances of abuse, the literature demonstrates less robust or consistent links between alcohol and education.Footnote 21,Footnote 22,Footnote 27 Some experts theorize alcohol is more compatible with academic achievements than other drug use.Footnote 22 Drinking is legal and socially accepted, or even encouraged, in certain circles. The models of students' academic aspirations to pursue postsecondary school are interesting, as alcohol is often affiliated with the culture of higher education. Some evidence suggests the perception of more permissive drinking cultures contributes to heavier alcohol intakes, and postsecondary students are shown to overestimate their classmates' alcohol consumptionFootnote 43 and to have higher drinking frequencies than their peers not attending school.Footnote 44 In light of these findings, interventions have been developed to alter campus culture and correct misperceptions of student drinking norms.Footnote 45 Similar programs may be valuable earlier, as it is plausible that perceptions of postsecondary cultures contribute to drinking among adolescents planning to pursue scholarly paths.
Alternatively, drawing from the drinking motives literature, students may binge drink to cope with the pressure to succeed academically. It is plausible that distress related to school pressures, particularly higher-educational aspirations, may drive binge drinking via coping motives, which in turn, adversely impacts school performance and engagement. Some evidence suggests increased drinking predicts declining socio-emotional functioning, which has negative implications on academic performance.Footnote 15 In addition to a mediator role, poor mental health or emotional dysregulation likely represents a common risk factor, placing students at greater risk of both problematic alcohol use and academic underachievement.Footnote 34 Some studies indicate the effects of substance use on educational variables are attenuated or no longer significant after adjustment for mental health;Footnote 19 however, King et al.Footnote 46 found support for substance use as both a mediator and a marker of a broader spectrum of problems which reduce academic achievement.
Future research should confirm the current study results with control for student mental health, as well as other potential confounders, such as parental substance use, education, and income. Adolescents from low-SES households may have greater risk of exposure to substance abuse by family members, and lack role models with higher degrees. Moreover, parents with lower education or incomes potentially provide less support for school work and scholarly pursuits due to longer and less flexible work hours, lower perceived competence, or insufficient financial resources to support scholarly goals. Interestingly, Roebroek and KoningFootnote 25 found a bi-directional relationship between alcohol consumption and school engagement, but only among adolescents with lower levels of parental support. Tobacco use was adjusted for in the models as it tends to cluster with many proposed confounders. Indeed, classification as a current smoker had the largest adverse effect on the academic outcomes in all models, relative to binge drinking status and the other covariates (results not shown). Students who identified as female, in higher grades, and/or as Aboriginal or Black were also more vulnerable to academic disengagement, poorer performance, and a lack of postsecondary degree aspirations and expectations, relative to their counterparts who reported they were male, in lower grades, and/or White, respectively (results not shown).
Considering the prevalence of binge drinking among youthFootnote 5,Footnote 6,Footnote 7 and importance of educational achievement to their future opportunities,Footnote 12 increased prevention efforts are of critical importance. Schools have been identified as the ideal setting for such strategies given the ability to reach the large majority of the population, regardless of SES. Targeted efforts at marginalized groups more vulnerable to academic underachievement may be warranted. Based on the current study, school-based prevention programs may ultimately benefit not only students' wellbeing, but their academic engagement and performance. Some evidence indicates enhancing recognition of the hazards of alcohol use may assist in reducing adolescent binge drinking, and in turn, improve educational attainment.Footnote 47 For example, young teenagers with high risk perceptions of substance use were less likely to binge drink as high school seniors, which was associated with greater chances of graduating from high school and attending college.Footnote 48
Strengths and limitations
Primary strengths of the study include the large sample and linked data, as well as the multiple academic indices and range of binge drinking frequencies; Nonetheless, certain limitations should be taken into account when interpreting results. While the longitudinal design and statistical procedures strengthen inferences, bidirectional effects were not tested. Secondly, no data was available on certain suggested confounders (e.g. mental health, SES, family support, parental substance use). Also, although self-report methods are considered reliable and valid approaches to measuring alcohol consumption,Footnote 49 recall bias and underreporting remain possible, and linkage rates are lower for students who use substances and are less engaged in school.Footnote 30 Missing data were treated as missing at random and excluded based on analyses indicating the transition in academic outcomes was similar in missing and nonmissing samples, with the exception of the homework completion outcome, which may be subject to nonresponse bias, and should be interpreted with caution. To encourage honest reporting, and improve participation and representativeness, passive-consent procedures were used, and students were not asked to provide their names, were assured confidentiality, and were not made aware of the data collection date ahead of time.Footnote 50 Lastly, to be consistent with previous researchFootnote 5,Footnote 7 and tools,Footnote 32 binge drinking was defined as consuming five or more alcoholic beverages on one occasion and assessed with reference to the past 12 months; however, measures using shorter time frames can be more reliable,Footnote 49 and lower cut-off points have been suggested for females and/or youth.Footnote 2
Conclusion
Results showcase the need to increase and improve prevention strategies for problematic drinking among youth, a cohort believed to have heightened vulnerability to the negative effects of substance use. These efforts should be considered a priority in educational systems, given the potential to improve student engagement and performance, and avoid the many lifelong consequences associated with school failure and dropout.Footnote 12 Based on this study, the initiation and escalating frequency of binge drinking appears detrimental to student attendance, homework completion, grades, and perceived value of school achievement, which may impede students from reaching their future academic goals.
Acknowledgements
The COMPASS study was supported by a bridge grant from the Canadian Institutes of Health Research (CIHR) Institute of Nutrition, Metabolism and Diabetes (INMD) through the "Obesity – Interventions to Prevent or Treat" priority funding awards (OOP-110788; grant awarded to S. Leatherdale) and an operating grant from the CIHR Institute of Population and Public Health (IPPH) (MOP-114875; grant awarded to S. Leatherdale). Dr. Leatherdale is a Chair in Applied Public Health Research funded by the Public Health Agency of Canada (PHAC) in partnership with CIHR.
Conflicts of interest
The authors have no conflicts of interest to report.
Authors' contributions and statement
KP led the writing of the manuscript and the study concept. WQ carried out the data analysis. All authors informed the data analysis and design, contributed to interpretation of the results, and approved the final version.
The content and views expressed in this article are those of the authors and do not necessarily reflect those of the Government of Canada.
References
- Footnote 1
-
Miller JW, Naimi TS, Brewer RD, et al. Binge drinking and associated health risk behaviors among high school students. Pediatrics. 2007;119:76-85.
- Footnote 2
-
Siqueria L, Smith VC. Binge Drinking. Pediatrics. 2015;136:718-26.
- Footnote 3
-
Feldstein Ewing SW, Sakhardande A, Blakemore S-J. The effect of alcohol consumption on the adolescent brain: a systematic review of MRI and fMRI studies of alcohol-using youth. NeuroImage: Clinical. 2014;5:420-37.
- Footnote 4
-
Skala K, Walter H. Adolescence and alcohol: a review of the literature. Neuropsychiatr. 2013;27:202.11.
- Footnote 5
-
Herciu AC, Laxer RE, Cole A, et al. A cross-sectional study examining factors associated with youth binge drinking in the COMPASS study: Year 1 data. Alcohol Drug Depen. 2014;2:172.
- Footnote 6
-
Health Canada. Summary of results of the 2010–11 Youth Smoking Survey [Internet]. Ottawa (ON): Health Canada; 2012. Available from: http://www.hc-sc.gc.ca/hc-ps/tobac-tabac/research-recherche/stat/_survey-sondage_2010–2011/result-eng.php
- Footnote 7
-
Leatherdale ST. An examination of the co-occurrence of modifiable risk factors associated with chronic disease among youth in the COMPASS study; Cancer Cause Control. 2015;26:519-28.
- Footnote 8
-
Thompson K, Stockwell T, Leadbeater B, Homel J. Association among different measures of alcohol use across adolescence and emerging adulthood. Addiction. 2014;109:894-903.
- Footnote 9
-
Luciana M, Feldstein Ewing SW. Introduction to the special issue: substance use and the adolescent brain: developmental impacts, interventions, and longitudinal outcomes. Dev Cogn Neurosci. 2015;16:1-4.
- Footnote 10
-
Pferrerbaum A, Rohlfing T, Pohl KM, et al. Adolescent development of cortical and white matter structure in the NCANDA sample: role of sex, ethnicity, puberty, and alcohol drinking. Cereb Cortex. 2015;1-21.
- Footnote 11
-
Brown SA, Brumback T, Tomlinson K, et al. The National Consortium on Alcohol and Neurodevelopment in Adolescence (NCANDA): a multisite study of adolescent development and substance use. J Stud Alcohol Drugs 2015;76:895-908.
- Footnote 12
-
Flaherty CW, Sutphen RD, Ely GE. Examining substance abuse in truant youths and their caregivers: implications for truancy intervention. Children and Schools. 2012;34:201-11.
- Footnote 13
-
Donath C, Grӓβel E, Baier D, et al. Predictors of binge drinking in adolescents: ultimate and distal factors – a representative study. BMC Public Health. 2012;12:263.
- Footnote 14
-
Pikos BF, Kovacs E. Do parents and school matter? Protective factors for adolescent substance use. Addict Behav 2010;35:53-6.
- Footnote 15
-
Crosnoe R, Benner AD, Schneider B. Drinking, socioemotional functioning, and academic progress in secondary school. J Health Soc Behav. 2012;53:150-64.
- Footnote 16
-
Latvala A, Rose RJ, Pulkkinen L, et al. Drinking, smoking, and educational achievement: Cross-lagged associations from adolescence to adulthood. Drug Alcohol. Depen. 2014; 137:106-13.
- Footnote 17
-
Engberg J, Morra AR. Reducing substance use improves adolescents' school attendance. Addiction. 2006;101:1741-51.
- Footnote 18
-
Hemphill SA, Heerde JA, Scholes-Balog KE, et al. Jr. Effects of early adolescent alcohol use on mid-adolescent school performance and connection: a longitudinal study of students in Victoria, Australia and Washington State, United States. J Sch Health. 2014;74:706-15.
- Footnote 19
-
Holtes M, Bannink R, Joosten-van Zwanenburg E, et al. Associations of truancy, perceived school performance, and mental health with alcohol consumption among adolescents. Journal of School Health. 2015;85:852-60.
- Footnote 20
-
Kelly AB, Evans-Whipp TJ, Smith R, et al. A longitudinal study of the association of adolescent polydrug use, alcohol use and high school non-completion. Addiction 2015; 110:627-35.
- Footnote 21
-
Lynskey MT, Coffey C, Degenhardt L, Carlin JB, Patton G. A longitudinal study of the effects of adolescent cannabis use on high school completion. Addiction. 2003;98;685-92.
- Footnote 22
-
Silins E, Fergusson DM, Patton GC, et al. Adolescent substance use and educational attainment: An integrative data analysis comparing cannabis and alcohol from three Australasian cohorts. Drug Alcohol Depen. 2015;156:90-6.
- Footnote 23
-
Squeglia LM, Jacobus J, Tapert SF. The effect of alcohol use on human adolescent brain structures and systems. Handb Clin Neurol. 2014;125:501-10.
- Footnote 24
-
Townshend JM, Duka T. Binge drinking, cognitive performance and mood in a population of young social drinkers. Alcohol Clin Exp Res. 2005;29:317-25.
- Footnote 25
-
Roebroek L, Koning IM. The reciprocal relation between adolescents' school engagement and alcohol consumption, and the role of parental support. Prev Sci. 2016;17:218-26.
- Footnote 26
-
Wang M-T, Fredricks JA. The reciprocal links between school engagement, youth problem behaviors, and school dropout during adolescence. Child Dev. 2014;85:722-37.
- Footnote 27
-
Bachman JG, O'Malley PM, Schulenberg JE, Johnston L, Freedman-Doan P, Messersmith EE. The education-drug use connection: how successes and failures in school relate to adolescent smoking, drinking, drug use, and delinquency. New York, NY: Lawrence Erlbaum Associates/Taylor and Francis; 2008.
- Footnote 28
-
Leatherdale ST, Brown KS, Carson V, et al. The COMPASS study: a longitudinal hierarchical research platform for evaluating natural experiments related to changes in school-level programs, policies and built environment resources. BMC Public Health 2014; 14; 331.
- Footnote 29
-
White VM, Hill DJ, Effendi Y. How does active parental consent influence the findings of drug-use surveys in schools? Evaluation Rev. 2004;28:246-60.
- Footnote 30
-
Qian W, Battista K, Bredin C, et al. Assessing longitudinal data linkage results in the COMPASS study (Technical Report 2015-3). Waterloo, Ontario: University of Waterloo. Available at: https://uwaterloo.ca/compass-system/publications#technical
- Footnote 31
-
Butt P, Beirness D, Cesa F, Gliksman L, Paradis C, Stockwell T. Alcohol and health in Canada: A summary of evidence and guidelines for low-risk drinking. Ottawa, ON: Canadian Centre on Substance Abuse; 2011.
- Footnote 32
-
Elton-Marshall T, Leatherdale ST, Manske SR, et al. Research methods of the Youth Smoking Survey (YSS). Chronic Dis Inj Can. 2011;32(1):47-54.
- Footnote 33
-
Brown SA, McGue M, Maggs J, et al. A developmental perspective on alcohol and youths 16 to 20 years of age. Pediatrics. 2008;121:S290-310.
- Footnote 34
-
Wills TA, Simons JS, Sussman S, Knight R. Emotional self-control and dysregulation: a dual-process analysis of pathways to externalizing/internalizing symptomatology and positive well-being in younger adolescents. Drug Alcohol Depen. 2016;163:S37-45.
- Footnote 35
-
Yang J, Anyon Y. Race and risk behaviors: the mediating role of school boding. Child and Youth Services Review. 2016;69:39-48.
- Footnote 36
-
Fitzmaurice GM, Laird NM, Ware JH. Applied Longitudinal Analysis. Hoboken, NJ: John Wiley & Sons; 2011.
- Footnote 37
-
Hoffman L. Longitudinal Analysis: Modeling Within-Person Fluctuation and Change. New York, NY: Taylor & Francis; 2015.
- Footnote 38
-
R Core Team. R: A Language and Environment for Statistical Computing. Vienna, Austria: R Foundation for Statistical Computing; 2014. Available from: http://www.R-project.org/
- Footnote 39
-
Touloumis A, Agresti A, Kateri M. Generalized Estimating Equations for Multinomial Responses Using a Local Odds Ratio Parameterization. Biometrics. 2013;69:633–40.
- Footnote 40
-
Touloumis A. R Package multgee: A Generalized Estimating Equations Solver for Multinomial Responses. J Stat Software. 2015;64:1-14.
- Footnote 41
-
Wormington SV, Anderson KG, Corpus JH. The role of academic motivation in high school students' current and lifetime alcohol consumption: adopting a self-determination theory perspective. J Stud Alcohol Drugs. 2011;72:965-74.
- Footnote 42
-
Wellman RJ, Contreras GA, Dugas EN, et al. Determinants of sustained binge drinking in young adults. Alcohol Clin Exp Res. 2014;38:1409-15.
- Footnote 43
-
Denham BE. Adolescent perceptions of alcohol risk: variation by sex, race, student activity levels and parental communication. J Ethnicity Substance Abuse. 2014;13:385-404.
- Footnote 44
-
O'Malley P, Johnston L. Epidemiology of alcohol and other drug use among American college students. J Stud Alcohol. 2002;14:23-39.
- Footnote 45
-
Foxcroft DR, Moreira MT, Almeida Santimano et al. Social norms information for alcohol misuse in university and college students. Cochrane Database of Systematic Reviews 2015;12;Art. No.: CD006748.
- Footnote 46
-
King KM, Meehan BT, Trim RS, Chassin L. Marker or mediator? The effects of adolescent substance use on young adult educational attainment. Addiction. 2006;101:1730-40.
- Footnote 47
-
Grevenstein D, Nagy E, Kroeninger-Jungaberle H. Development of risk perception and substance use of tobacco, alcohol and cannabis among adolescents and emerging adults: evidence of directional influences. Subst Use Misuse. 2015;50:376-86.
- Footnote 48
-
Yan J, Brocken S. Adolescent risk perception, substance use, and educational attainment. J Risk Res. 2013;16:1037-55.
- Footnote 49
-
Del Boca FK, Darkes J. The validity of self-reports of alcohol consumption: state of the science and challenges for research. Addiction. 2003;98(Suppl. 2):1-12.
- Footnote 50
-
Thompson-Haile A, Bredin C, Leatherdale ST. Rationale for using an Active-Information Passive-Consent Permission Protocol in COMPASS (Technical Report 2015-1). Waterloo, Ontario: University of Waterloo; Available at: www.compass.uwaterloo.ca
Page details
- Date modified: