
Annex I: Self-identification data collection in support of equity, diversity and inclusion
This annex represents a data set drawn from the self-identification questionnaire for tri-agency and agency-specific (CIHR, NSERC, SSHRC and CFI) major funding opportunities from the 2021 competition year.Footnote 1 The tables and figures from the data set present a snapshot of self-identification information about the following groups: women, Indigenous Peoples, members of visible minorities and persons with disabilities. Completing the self-identification questionnaire is mandatory; however, all questions provide an option to select “I prefer not to answer.”
The data set presents a summary of the application and award ratesFootnote 2Footnote 3 of tri-agency and agency-specific major funding opportunities (Tables 1a and 1b; Figures 1a-1d).Footnote 4 The data distinguish between applications and award rates for research and training programs and provide an overview of the nominations and active chairs awards for the Canada Research Chairs Program.
Application and award rates for tri-agency and agency-specific major funding opportunities
Application and award rates for major funding opportunities for competition year 2021 are outlined below as they relate to the four groups identified in the self-identification questionnaire. The data are collected from the questionnaires completed by the individual who has the primary responsibility for the application.
The collection of this data is still relatively new, and caution should be exercised in interpreting the data, particularly for competitions with low numbers of applications. As more data are collected in coming years, trends can be tracked and analyzed for a clearer picture of each group’s participation in the Canadian research enterprise and in accessing available funds.
| Women | Indigenous Peoples | Persons with disabilities | Members of visible minorities | |||||
|---|---|---|---|---|---|---|---|---|
| Research program | App. rate | Award rate | App. rate | Award rate | App. rate | Award rate | App. rate | Award rate |
| SSHRC Insight Grants | 51.6% | 54.0% | 2.0% | 2.7% | 4.1% | 3.9% | 22.5% | 20.5% |
| SSHRC Partnership Grants | 60.0% | 62.2% | 2.4% | 2.7% | 5.6% | 5.3% | 19.2% | 19.7% |
| NSERC Discovery Grants | 26.0% | 27.5% | 0.6% | - | 2.4% | 2.3% | 31.1% | 28.9% |
| NSERC Partnership Grants | 18.2% | 18.2% | - | - | 2.8% | 2.6% | 39.8% | 39.5% |
| New Frontiers in Research FundFootnote * | 29.7% | 34.3% | - | - | 5.0% | - | 40.5% | 33.3% |
| CIHR Project Grants | 35.9% | 37.2% | 0.7% | 1.3% | 2.2% | 1.4% | 24.8% | 22.2% |
| CFI John R. Evans Leaders Fund | 37.6% | 37.9% | 2.1% | 2.6% | 3.6% | 3.7% | 33.4% | 32.1% |
| Training program | App. rate | Award rate | App. rate | Award rate | App. rate | Award rate | App. rate | Award rate |
| Canada Graduate Scholarships– Master’sFootnote * | 62.0% | 64.5% | 2.0% | 2.1% | 6.1% | 5.9% | 25.6% | 22.8% |
| Vanier Canada Graduate ScholarshipsFootnote * | 57.9% | 62.7% | 3.0% | 6.0% | 7.2% | 9.6% | 32.8% | 38.0% |
| Banting Postdoctoral FellowshipsFootnote * | 46.7% | 44.3% | - | - | 4.0% | - | 32.0% | 21.4% |
| SSHRC Doctoral Awards | 64.8% | 66.9% | 5.6% | 5.3% | 8.1% | 7.8% | 22.0% | 25.0% |
| SSHRC Postdoctoral Fellowships | 53.6% | 56.9% | 1.4% | - | 6.5% | 6.9% | 24.4% | 16.3% |
| NSERC Postdoctoral Fellowships | 36.3% | 45.6% | - | - | 3.3% | - | 34.7% | 24.8% |
| NSERC Postgraduate Scholarships (Doctoral) | 42.3% | 45.1% | 1.8% | - | 3.8% | 5.4% | 30.4% | 29.0% |
| CIHR Postdoctoral Fellowships | 55.9% | 56.6% | - | - | 2.2% | - | 32.4% | 30.9% |
| CIHR Doctoral Research Awards | 67.9% | 63.7% | 2.8% | - | 5.1% | 4.1% | 31.2% | 36.8% |
| Women | Indigenous Peoples | Persons with disabilities | Members of visible minorities | |||||
|---|---|---|---|---|---|---|---|---|
| Program | Nominations | Filled alloc.Footnote * | Nominations | Filled alloc.Footnote * | Nominations | Filled alloc.Footnote * | Nominations | Filled alloc.Footnote * |
| Canada Research Chairs Program | 45.0% Footnote ** | 42.7% | 5.0% | 3.6% | 7.0% | 6.0% | 34.0% | 23.0% |
Note: Figures 1a to 1d below are visual representations of the data provided in Table 1a, above.
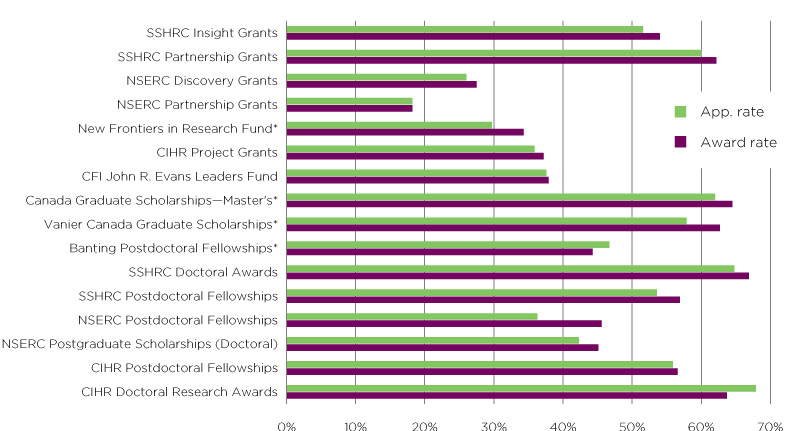
Figure 1a: Application and award rates for women by tri-agency and agency-specific funding opportunities
*Tri-agency funding opportunities
Description of Figure 1a
This horizontal bar graph shows, in percentages, the application and award rates for women by tri-agency and agency-specific funding opportunity for the 2021 competition year. The y-axis lists the funding opportunities. The x-axis shows the percentages, from 0 to 80%
The New Frontiers in Research Fund, Canada Graduate Scholarships‒Master’s, Vanier Canada Graduate Scholarships and Banting Postdoctoral Fellowships are each marked with an asterisk to indicate they are tri-agency funding opportunities. All other funding opportunities listed are agency-specific.
The horizontal bar graph shows the application and award rates for women, by funding opportunity, as follows:
- For SSHRC Insight Grants, the application rate was 51.6% and the award rate was 54.0%.
- For SSHRC Partnership Grants, the application rate was 60.0% and the award rate was 62.2%.
- For NSERC Discovery Grants, the application rate was 26.0% and the award rate was 27.5%.
- For NSERC Partnership Grants, the application rate was 18.2% and the award rate was 18.2%.
- For the New Frontiers in Research Fund, the application rate was 29.7% and the award rate was 34.3%.
- For CIHR Project Grants, the application rate was 35.9% and the award rate was 37.2%.
- For the CFI John R. Evans Leaders Fund, the application rate was 37.6% and the award rate was 37.9%.
- For the Canada Graduate Scholarships‒Master’s program, the application rate was 62.0% and the award rate was 64.5%.
- For Vanier Canada Graduate Scholarships, the application rate was 57.9% and the award rate was 62.7%.
- For Banting Postdoctoral Fellowships, the application rate was 46.7% and the award rate was 44.3%.
- For SSHRC Doctoral Awards, the application rate was 64.8% and the award rate was 66.9%.
- For SSHRC Postdoctoral Fellowships, the application rate was 53.6% and the award rate was 56.9%.
- For NSERC Postdoctoral Fellowships, the application rate was 36.3% and the award rate was 45.6%.
- For the NSERC Postgraduate Scholarships–Doctoral program, the application rate was 42.3% and the award rate was 45.1%.
- For CIHR Postdoctoral Fellowships, the application rate was 55.9% and the award rate was 56.6%.
- For CIHR Doctoral Research Awards, the application rate was 67.9% and the award rate was 63.7%.
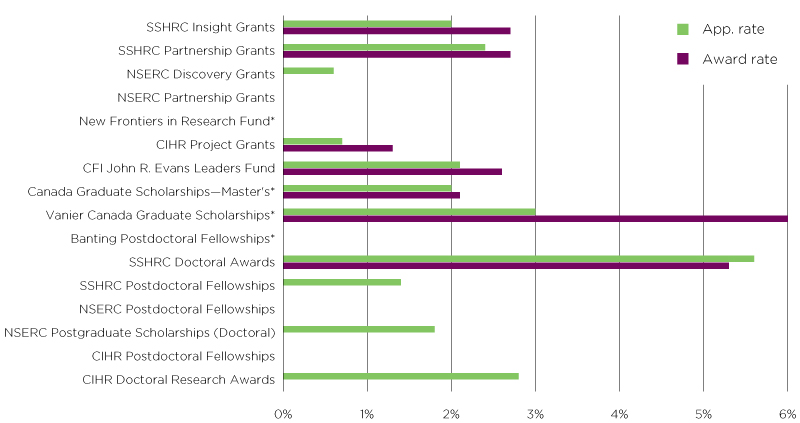
Figure 1b: Application and award rates for Indigenous Peoples by tri-agency and agency-specific funding opportunities
*Tri-agency funding opportunities
Description of Figure 1b
This horizontal bar graph shows, in percentages, the application and award rates for Indigenous Peoples, by tri-agency and agency-specific funding opportunity for the 2021 competition year. The y-axis lists the funding opportunities. The x-axis shows the percentages, from 0 to 7%.
The New Frontiers in Research Fund, Canada Graduate Scholarships‒Master’s, Vanier Canada Graduate Scholarships and Banting Postdoctoral Fellowships are each marked with an asterisk to indicate they are tri-agency funding opportunities. All other funding opportunities listed are agency-specific.
The horizontal bar graph shows the application and award rates for Indigenous Peoples, by funding opportunity, as follows:
- For SSHRC Insight Grants, the application rate was 2.0% and the award rate was 2.7%.
- For SSHRC Partnership Grants, the application rate was 2.4% and the award rate was 2.7%.
- For NSERC Discovery Grants, the application rate was 0.6% and the award rate was 0%.
- For NSERC Partnership Grants, the application rate was 0% and the award rate was 0%.
- For the New Frontiers in Research Fund, the application rate was 0% and the award rate was 0%.
- For CIHR Project Grants, the application rate was 0.7% and the award rate was 1.3%.
- For the CFI John R. Evans Leaders Fund, the application rate was 2.1% and the award rate was 2.6%.
- For the Canada Graduate Scholarships‒Master’s program, the application rate was 2.0% and the award rate was 2.1%.
- For Vanier Canada Graduate Scholarships, the application rate was 3.0% and the award rate was 6.0%.
- For Banting Postdoctoral Fellowships, the application rate was 0% and the award rate was 0%.
- For SSHRC Doctoral Awards, the application rate was 5.6% and the award rate was 5.3%.
- For SSHRC Postdoctoral Fellowships, the application rate was 1.4% and the award rate was 0%.
- For NSERC Postdoctoral Fellowships, the application rate was 0% and the award rate was 0%.
- For the NSERC Postgraduate Scholarships–Doctoral program, the application rate was 1.8% and the award rate was 0%.
- For CIHR Postdoctoral Fellowships, the application rate was 0% and the award rate was 0%.
- For CIHR Doctoral Research Awards, the application rate was 2.8% and the award rate was 0%.
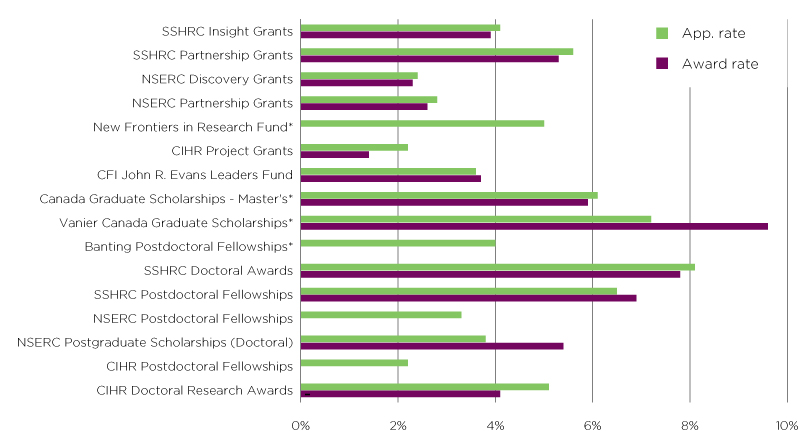
Figure 1c: Application and award rates for persons with disabilities by tri-agency and agency-specific funding opportunities
*Tri-agency funding opportunities
Description of Figure 1c
This horizontal bar graph shows, in percentages, the application and award rates for persons with disabilities by tri-agency and agency-specific funding opportunity for the 2021 competition year. The y-axis lists the funding opportunities. The x-axis shows the percentages, from 0 to 12%.
The New Frontiers in Research Fund, Canada Graduate Scholarships‒Master’s, Vanier Canada Graduate Scholarships and Banting Postdoctoral Fellowships are each marked with an asterisk to indicate they are tri-agency funding opportunities. All other funding opportunities listed are agency-specific.
The horizontal bar graph shows the application and award rates for persons with disabilities, by funding opportunity, as follows:
- For SSHRC Insight Grants, the application rate was 4.1% and the award rate was 3.9%.
- For SSHRC Partnership Grants, the application rate was 5.6% and the award rate was 5.3%.
- For NSERC Discovery Grants, the application rate was 2.4% and the award rate was 2.3%.
- For NSERC Partnership Grants, the application rate was 2.8% and the award rate was 2.6%.
- For the New Frontiers in Research Fund, the application rate was 5.0% and the award rate was 0%.
- For CIHR Project Grants, the application rate was 2.2% and the award rate was 1.4%.
- For the CFI John R. Evans Leaders Fund, the application rate was 3.6% and the award rate was 3.7%.
- For the Canada Graduate Scholarships‒Master’s program, the application rate was 6.1% and the award rate was 5.9%.
- For Vanier Canada Graduate Scholarships, the application rate was 7.2% and the award rate was 9.6%.
- For Banting Postdoctoral Fellowships, the application rate was 4.0% and the award rate was 0%.
- For SSHRC Doctoral Awards, the application rate was 8.1% and the award rate was 7.8%.
- For SSHRC Postdoctoral Fellowships, the application rate was 6.5% and the award rate was 6.9%.
- For NSERC Postdoctoral Fellowships, the application rate was 3.3% and the award rate was 0%.
- For the NSERC Postgraduate Scholarships–Doctoral program, the application rate was 3.8% and the award rate was 5.4%.
- For CIHR Postdoctoral Fellowships, the application rate was 2.2% and the award rate was 0%.
- For CIHR Doctoral Research Awards, the application rate was 5.1% and the award rate was 4.1%.
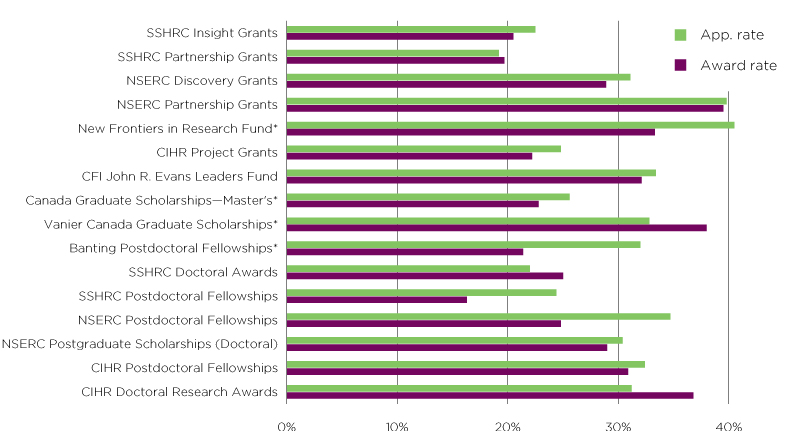
Figure 1d: Application and award rates for members of visible minorities by tri-agency and agency-specific funding opportunities
*Tri-agency funding opportunities
Description of Figure 1d
This horizontal bar graph shows, in percentages, the application and award rates for members of visible minorities by tri-agency and agency-specific funding opportunity for the 2021 competition year. The y-axis lists the funding opportunities. The x-axis shows the percentages, from 0 to 45%.
The New Frontiers in Research Fund, Canada Graduate Scholarships‒Master’s, Vanier Canada Graduate Scholarships and Banting Postdoctoral Fellowships are each marked with an asterisk to indicate they are tri-agency funding opportunities. All other funding opportunities listed are agency-specific.
The horizontal bar graph shows the application and award rates for members of visible minorities, by funding opportunity, as follows:
- For SSHRC Insight Grants, the application rate was 22.5% and the award rate was 20.5%.
- For SSHRC Partnership Grants, the application rate was 19.2% and the award rate was 19.7%.
- For NSERC Discovery Grants, the application rate was 31.1% and the award rate was 28.9%.
- For NSERC Partnership Grants, the application rate was 39.8% and the award rate was 39.5%.
- For the New Frontiers in Research Fund, the application rate was 40.5% and the award rate was 33.3%.
- For CIHR Project Grants, the application rate was 24.8% and the award rate was 22.2%.
- For the CFI John R. Evans Leaders Fund, the application rate was 33.4% and the award rate was 32.1%.
- For the Canada Graduate Scholarships‒Master’s program, the application rate was 25.6% and the award rate was 22.8%.
- For Vanier Canada Graduate Scholarships, the application rate was 32.8% and the award rate was 38.0%.
- For Banting Postdoctoral Fellowships, the application rate was 32.0% and the award rate was 21.4%.
- For SSHRC Doctoral Awards, the application rate was 22.0% and the award rate was 25.0%.
- For SSHRC Postdoctoral Fellowships, the application rate was 24.4% and the award rate was 16.3%.
- For NSERC Postdoctoral Fellowships, the application rate was 34.7% and the award rate was 24.8%.
- For the NSERC Postgraduate Scholarships–Doctoral program, the application rate was 30.4% and the award rate was 29.0%.
- For CIHR Postdoctoral Fellowships, the application rate was 32.4% and the award rate was 30.9%.
- For CIHR Doctoral Research Awards, the application rate was 31.2% and the award rate was 36.8%.
Notes:
- A dash (‒) indicates categories where fewer than 10 responses were received.
- The CRCP requires that all nominees submit a self-identification form as part of a complete nomination package; as such the data presented in this table correspond to the nomination rate and filled allocations. This data must not be used to calculate award rates or success rates. For additional program statistics, consult the program website.
- The CRC nominations represent the number of nominations in all cycles of the reporting year (e.g., 2020-21 and 2020-22) in which nominees self-identify as a member of an underrepresented group, divided by the total number of nominees in all cycles of the reporting year, multiplied by 100 (to calculate a percentage).
- The filled CRC allocations (total representation in program) represent the number of active chairs who self-identify as a member of an underrepresented group, divided by the total number of active chairs, multiplied by 100 (to calculate a percentage). Due to the nature of the program, these data are only available as point in time.
Page details
- Date modified: