
2016-17 Management Accountability Framework government-wide report
Introduction
The Management Accountability Framework (MAF) is an annual assessment of management practices and performance in most Government of Canada departments and agencies. Established in 2003, it sets out expectations for sound public sector management. Its objectives are to support the management accountability of deputy heads and to improve management practices across government.
All participating organizations are assessed on 4 core areas of management (AoMs) considered to be central to good management:
- Financial management
- People management
- Information management and information technology management (IM/IT)
- Management of integrated risk, planning and performance
In addition, select organizations are assessed on one or more of the following department-specific management areas, when there is a strong alignment between a department’s operations and the AoM:
- Management of acquired services and assets
- Security management
- Service management
A renewed MAF was launched for the 2014 to 2015 cycle following extensive engagement with deputy heads through the Public Sector Management Advisory Committee, with updated management expectations. The MAF 2016 to 2017 was the final year of this 3-year cycle. An evaluation of this cycle is underway, with the aim of fine-tuning the MAF methodology for the next 3-year cycle.
This report highlights government-wide trends in these 7 AoMs, highlighting trends over the past 3 years while profiling select indicators that were part of the MAF methodologies for fiscal year 2016 to 2017. A total of 60 departments and agencies (37 large and 23 small) are assessed annually over this cycle. Small departments and agencies (SDAs) are assessed on a subset of the core AoM indicators and accordingly are only represented in the core AoM sections, while large departments and agencies (LDAs) are profiled throughout the report.
On this page
Performance by core area of management
Financial management
Context
The annual MAF assessment in the area of financial management aims to improve oversight and management practices in departments, as well as to support the Government of Canada’s strategic direction for financial management. This AoM measures the departmental financial management performance in key foundational areas.
Overall trends
What is working well?
- The vast majority of organizations stated that they proactively assess multi-year financial risks.
- 94% of organizations have implemented a risk-based ongoing monitoring program to support the effectiveness of their internal controls over financial reporting.
- Payments on due date have improved with more organizations paying over 98% of their payments to suppliers on time.
- Departments are increasing their collection efforts and taking action to write-off any uncollectible debts.
What requires improvement?
- 9 of the 37 LDAs assessed take longer than 30 days to allocate approved budgets to the lowest-level managers in the departmental financial system.
- The quality and clarity of the salary information available to managers to support staffing decisions is not consistent government-wide.
Key findings
Resource management
The effective management of public funds depends on the collection of reliable data and the availability of sound financial information for decision making. It must also be supported by effective planning, budgeting, monitoring and reporting.
Multi-year financial planning
Multi-year financial planning is critical in order to proactively manage current and future financial risks an organization may face. Departments and agencies should identify and assess financial risks over a multi-year period as part of their approach to financial planning and budgeting.
Almost all organizations indicated they proactively assessed the multi-year financial risks associated with projected salary expenditures, budgetary changes, revenue fluctuations and funding pressures.
Total adjusted lapse
The amount of lapsed funds at year-end can provide insight into an organization’s planning, budgeting, monitoring, and reporting practices. If an organization regularly lapses amounts less than 2% or greater than 5% of total voted authorities, there may be a need to identify the underlying drivers of the lapses and determine whether action is required.
The amount of funds lapsed at year-end has continued to decline for LDAs, dropping from 6.0% in fiscal year 2012 to 2013 to 2.5% in fiscal year 2015 to 2016. For SDAs, the 2015 to 2016 fiscal year adjusted lapse dropped to 1.5% after being stable at 2.1% for the 2013 to 2014 and 2014 to 2015 fiscal years.
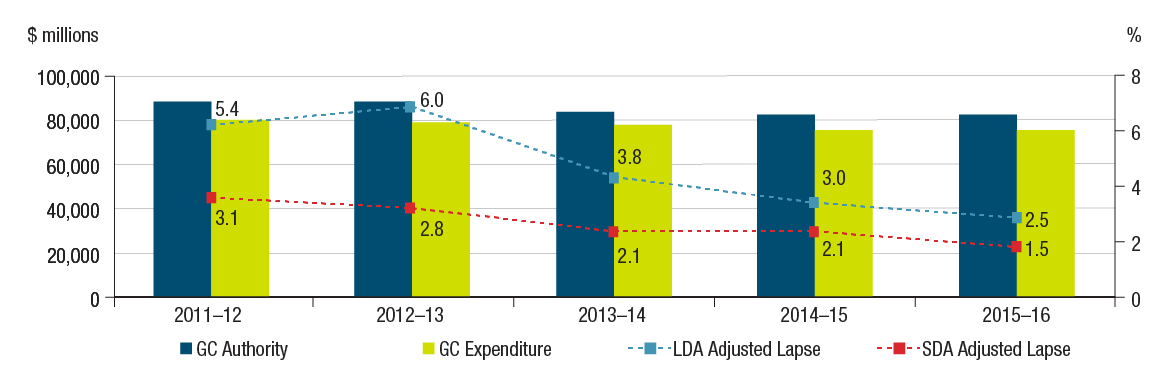
Figure 1 - Text version
Adjusted lapse at year-end as a percentage of annual voted authorities for large departments and agencies was:
- 5.4% in the 2011 to 2012 fiscal year
- 6.0% in the 2012 to 2013 fiscal year
- 3.8% in the 2013 to 2014 fiscal year
- 3.0% in the 2014 to 2015 fiscal year
- 2.5% in the 2015 to 2016 fiscal year
Adjusted lapse at year-end as a percentage of annual voted authorities for small departments and agencies was:
- 3.1% in the 2011 to 2012 fiscal year
- 2.8% in the 2012 to 2013 fiscal year
- 2.1% in the 2013 to 2014 fiscal year
- 2.1% in the 2014 to 2015 fiscal year
- 1.5% in the 2015 to 2016 fiscal year
A further breakdown highlighted the operating adjusted lapse for all organizations assessed: 23 of the 57 organizations assessed reported an operating adjusted lapse of less than 2%, with a 1.4% average for all organizations assessed. These results indicate that departments may have less flexibility in the future to absorb additional pressures to meet operational demands.
Budget allocations
Earlier access to budget enables managers to plan their program and financial implementation effectively. Department or agency managers should have access to their budget within 30 days of the start of the fiscal year.
MAF results suggest that departmental practices vary. While most departments (only LDAs were assessed) allocate budgets within 30 days of the start of the fiscal year, 9 out of 37 LDAs assessed take well beyond 30 days (76 days on average between those 9 organizations) to allocate approved budgets to the lowest-level managers with delegated authorities. Those departments not meeting the 30-day objective should address the issue and strive to significantly improve early access to budgets.
Internal control management
The Policy on Internal Control requires deputy heads to ensure the maintenance of effective internal control over financial management in order to mitigate risks to programs, operational and resource management.
Implementation of a risk-based ongoing monitoring program
There has been a significant improvement in the area of risk-based monitoring, with almost all of the organizations (94%) having put in place an ongoing monitoring program to support the effectiveness of their internal controls over financial reporting in fiscal year 2016 to 2017, compared with less than half (44%) in fiscal year 2014 2015.
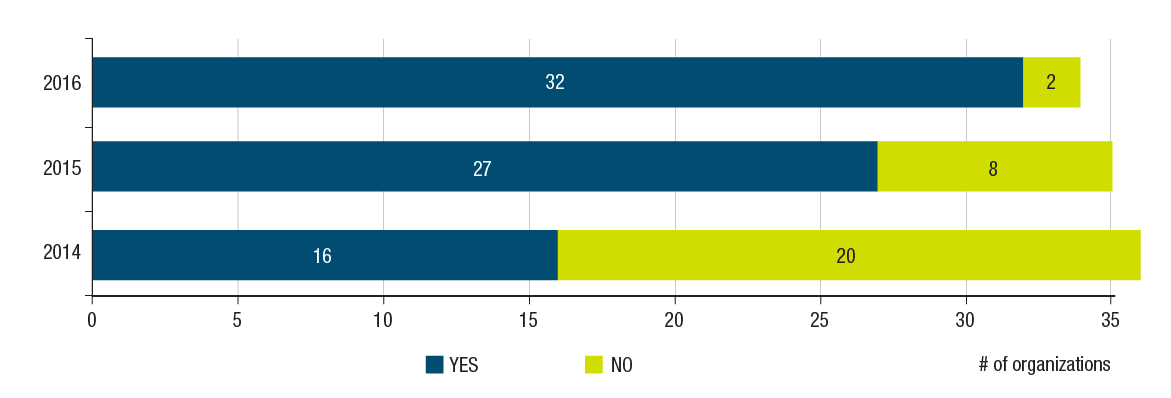
Figure 2 - Text version
In 2014, 16 organizations answered “Yes” to whether they had implemented a risk-based ongoing monitoring program, and 20 organizations answered “No.”
In 2015, 27 organizations answered “Yes” to whether they had implemented a risk‑based ongoing monitoring program, and 8 large departments and agencies answered “No.”
In 2016, 32 organizations answered “Yes” to whether they had implemented a risk‑based ongoing monitoring program, and 2 large departments and agencies answered “No.”
Access to salary reports
Organizations should ensure that salary commitments are recorded at the time of expenditure initiation and that delegated managers have ongoing access to salary reports identifying the portion of their salary budget that remains unencumbered.
Managers within all organizations have ongoing access to salary reports that provide information to support staffing decisions. However, the Office of Comptroller General notes that the quality and clarity of the financial information available to managers to support staffing decisions is not consistent government-wide. This directly impacts managers’ ability to understand their salary position, particularly as they move from one department to another.
Outstanding accounts receivable
The outstanding accounts receivable represent debts due to the Crown, excluding debts classified in other sections of the Public Accounts of Canada such as taxes receivable. The Directive on Receivables Management requires that departments recognize and record receivable transactions in departmental accounts and take appropriate, timely and cost-effective collections actions.
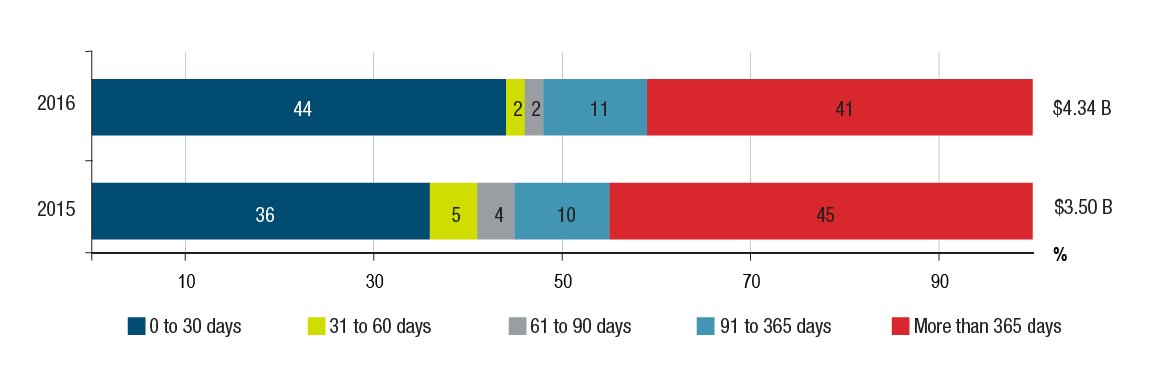
Figure 3 - Text version
For large departments and agencies:
In 2015:
- 36% of accounts receivable had been outstanding for 0 to 30 days
- 5% had been outstanding for 31 to 60 days
- 4% had been outstanding for 61 to 90 days
- 10% had been outstanding for 91 to 365 days
- 45% had been outstanding for more than 365 days
In 2015, overall outstanding accounts receivable for large departments and agencies totalled $3.50 billion.
In 2016:
- 44% of accounts receivable had been outstanding for 0 to 30 days
- 2% had been outstanding for 31 to 60 days
- 2% had been outstanding for 61 to 90 days
- 11% had been outstanding for 91 to 365 days
- 41% had been outstanding for more than 365 days
In 2016, overall outstanding accounts receivable for large departments and agencies totalled $4.34 billion.
For SDAs, there has not been much change with regard to outstanding accounts more than 365 days, from 17% in 2015 to 19% in 2016. Although the overall amounts are higher for LDAs, it trended down in 2016.
Overall, while noting the increased focus among organizations on the management of accounts receivable, there is still $1.8 billion of non-tax accounts receivable outstanding over 365 days. Further improvements are still required in this area.
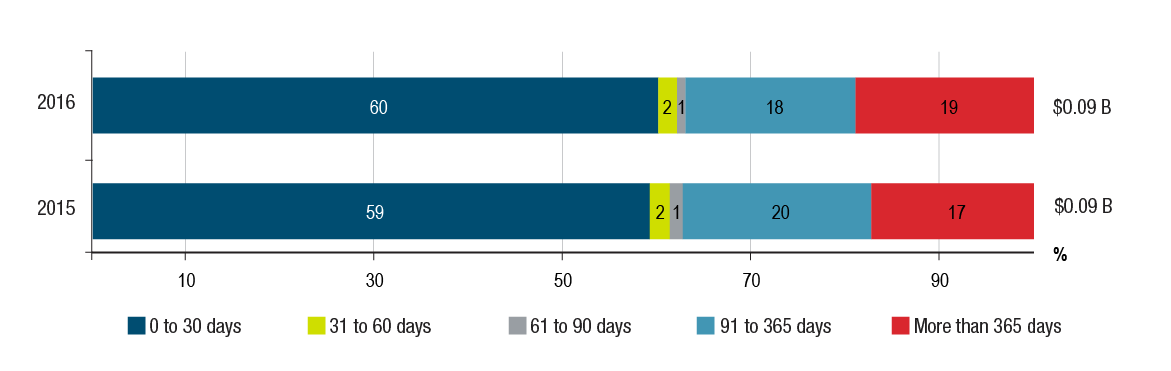
Figure 4 - Text version
For small departments and agencies:
In 2015:
- 59% of accounts receivable had been outstanding for 0 to 30 days
- 2% had been outstanding for 31 to 60 days
- 1% had been outstanding for 61 to 90 days
- 20% had been outstanding for 91 to 365 days
- 17% had been outstanding for more than 365 days
Overall outstanding accounts receivable for small departments and agencies totalled $0.09 billion.
In 2016:
- 60% of accounts receivable had been outstanding for 0 to 30 days
- 2% had been outstanding for 31 to 60 days
- 1% had been outstanding for 61 to 90 days
- 18% had been outstanding for 91 to 365 days
- 19% had been outstanding for more than 365 days
Overall outstanding accounts receivable for small departments and agencies totalled $0.09 billion.
Transfer payments
The Policy on Transfer Payments requires that departments establish reasonable and practical service standards for transfer payment programs. Furthermore, the Policy on Service requires that service standards and real-time service delivery performance information for priority services be available to clients on Canada.ca for external services.
Organizations are expected to meet the service standards established for their transfer payment programs and ensure that service standard performance results are publicly available. Progress in this area has a direct impact on applicants and recipients and is an important part of the Government of Canada Action Plan to Reform the Administration of Grant and Contribution Programs.
On average, 73% of LDA service standard targets for transfer payment programs are being met. In addition, 76% of LDA service standard performance results for transfer payment programs are available on a public website. Although the vast majority of the organizations assessed (17 out of 22) have 100% of service standard performance results available online, there are 4 organizations that did not make any service standard performance results available online while 1 had 50% online.
People management
Context
Effective people management is a cornerstone of a high-performing public service and a key enabler in building Canadians’ trust in government. Significant progress in modernizing human resources has been made in recent years in the Government of Canada. The objective of this AoM is to assess people management practices and performance across the public service to provide deputy heads and heads of human resources with information on trends and issues, to enable the development of evidence-based people management strategies.
Overall trends
What is working well?
- Representation and recruitment levels of women and Aboriginal peoples exceed their availability in the labour market in over 72% of 34 LDAs.
- In most organizations, linguistic profiles of positions reflect the duties of employees and obligations with respect to the public.
- Use of paid sick leave has decreased slightly for both LDAs and SDAs over the last 3 years.
What requires improvement?
- Representation levels of members of a visible minority group do not meet their availability in the labour market in half (50%) of large organizations.
- Recruitment levels of persons with disabilities exceed their availability in the labour market in only 39% of large organizations.
- Performance on time to staff AS-01 and EX-01 positions continues to vary broadly across organizations.
Key findings
Workforce and work culture
The Government of Canada is committed to ensuring a respectful workplace for all employees, free of harassment and discrimination, as well as a diverse, flexible and agile workforce capable of adapting quickly to changing priorities.
Diversity and inclusion
The Employment Equity Act requires employers to monitor and, where necessary, enhance the representativeness of its workforce for the four designated groups: women, Aboriginal peoples, persons with disabilities, and visible minorities. Workforce availability estimates allow federal organizations to compare the representation of the employment equity designated groups in their organizations with the workforce availability by designated group in the labour pool from which they can recruit.
For federal public service purposes, workforce availability is based on the population of Canadians who are active in the workforce and work in those occupations that correspond to the occupations in the public service. The estimates are derived from the 2011 National Household Survey and the 2012 Canadian Survey on Disability.
Overall, most organizations meet the legislative requirements of the Employment Equity Act in terms of the representation of women, Aboriginal peoples and persons with disabilities. Representation and recruitment levels for women and Aboriginal peoples exceed their availability in the labour force in over 72% of the assessed 34 LDAs and 18 SDAs. These results are consistent with last year’s findings. Representation levels for persons with disabilities exceed their availability in the labour force in 82% of the LDAs assessed, while their recruitment levels exceeds their availability in the labour force in only 39% of the LDAs.
Representation levels for members of a visible minority group exceed their availability in the labour market in only 50% of the LDAs, while their recruitment levels exceed their availability in the labour market in 59% of LDAs. In SDAs, representation levels for members of a visible minority group meet or exceed their availability in the labour market in only 44% of organizations, while their recruitment levels exceed their availability in the labour market in 60% of organizations.
Respectful workplace and prevention of harassment
Departments and agencies are expected to foster a respectful workplace free of harassment and discrimination by ensuring that preventive activities are in place. Overall, organizations have mechanisms in place to foster a respectful work culture free of harassment and discrimination.
Almost all of the LDAs (97% of LDAs assessed) and SDAs (94% of SDAs assessed) conduct department-wide activities to foster a respectful workplace such as workshops, information sessions or group discussions. The vast majority of organizations report offering leadership training to develop accountability and foster an ethical culture and mandate training for employees on harassment prevention and/or respectful communication.
In addition, most organizations reported ensuring easily accessible mechanisms for reporting and resolving incidents of harassment or discrimination.
Official languages
Organizations are expected to create, reflect and maintain a work environment that is conducive to the use of both official languages and in which employees are encouraged to use the official languages of their choice in the workplace. Employees play a vital role in fulfilling their organization’s official language obligations when providing services to or communicating with the public or employees. The organization’s leaders lead by example and promote this objective. The measures on official languages provide an indication of the extent to which departments and agencies meet the requirements of the Policy on Official Languages.
In 48 out of the 52 LDAs and SDAs that were assessed, linguistic profiles of positions reflect the duties of employees and obligations with respect to the public in 70% or more of the cases. In addition, in 98% of organization assessed, oral communications occur in the official language chosen by the public in over 70% of cases. Written communications occur in the official language chosen by the public in over 70% of the cases for all organizations assessed.
Of the 34 LDAs and 18 SDAs assessed, 79% and 70% of executives occupying a designated bilingual position have second language evaluation results that are not expired, respectively.
Workplace health
The average number of paid sick days per full-time equivalent is a key metric that provides useful information for the management of sick leave in the federal public service and the development of workplace and wellness strategies in the workplace. The average number of paid sick days has declined slightly for SDAs (10.9 in 2014, 10.8 in 2015 and 10.3 in 2016), and for LDAs over the 3-year cycle (11.5 in 2014, 11.6 in 2015 and 11.3 in 2016). However, there remains a great variation in paid sick leave usage across organizations depending on their size, mandate and nature of operations.
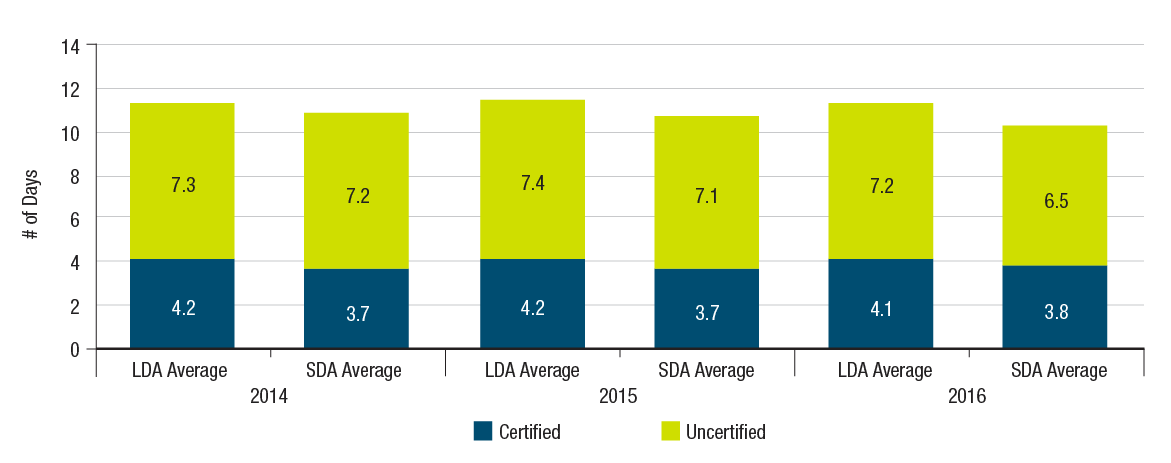
Figure 5 - Text version
In 2014, the average number of paid certified and paid uncertified sick days per full-time equivalent for large departments and agencies was 4.2 days and 7.3 days, respectively. For small departments and agencies, the average number of paid certified and paid uncertified sick days per full-time equivalent was 3.7 days and 7.2 days, respectively.
In 2015, the average number of paid certified and paid uncertified sick days per full-time equivalent for large departments and agencies was 4.2 days and 7.4 days, respectively. For small departments and agencies, the average number of paid certified and paid uncertified sick days per full-time equivalent was 3.7 days and 7.1 days, respectively.
In 2016, the average number of paid certified and paid uncertified sick days per full-time equivalent for large departments and agencies was 4.1 days and 7.2 days, respectively. For small departments and agencies, the average number of paid certified and paid uncertified sick days per full-time equivalent was 3.8 days and 6.5 days, respectively.
The public service must show leadership in building a healthy, respectful and supportive work environment where concrete actions are taken to support open and stigma-free dialogues on mental health.
In support of open and stigma-free dialogues on mental health in the workplace, organizations have undertaken a number of activities, such as the development of an action plan on mental health, and the appointment of a champion for mental health. Organizations are educating and equipping managers, supervisors and occupational health and safety committee members to manage issues related to mental health. In addition, organizations are offering awareness sessions to employees on mental health and health support services available.
Service standards
Service standards are essential for maintaining efficient and effective client-centred services that support the achievement of program-delivery objectives.
Time to staff an AS-01 and EX-01
The time to staff measure represents the average number of days elapsed between the day the human resources division was contacted to initiate the staffing action and the day the letter of offer was issued for staffing of positions.
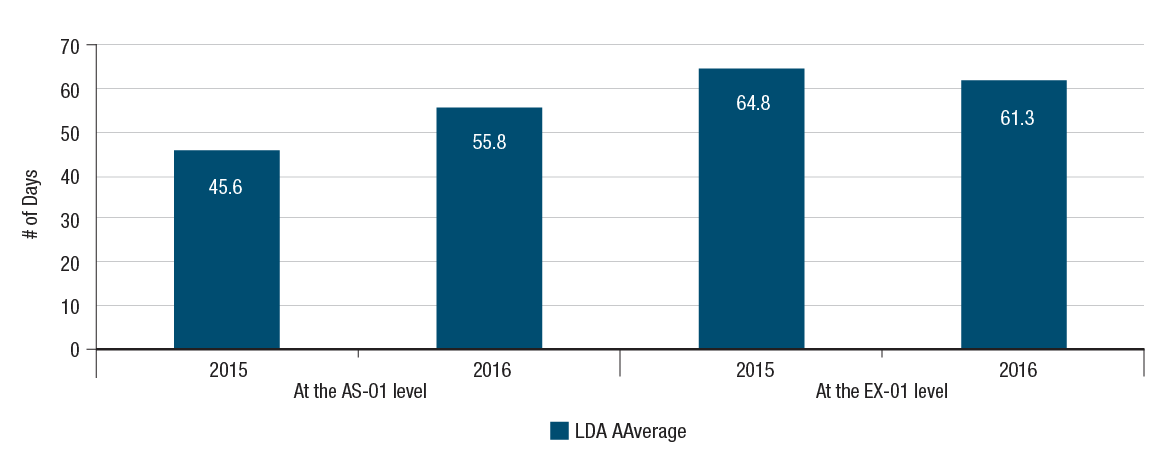
Figure 6 - Text version
In 2015:
For large departments and agencies, the average number of days taken to staff indeterminately a vacant position using an internal hiring process at the AS-01 level was 45.6 days. For large departments and agencies, the average number of days taken to staff indeterminately a vacant position using an internal hiring process at the EX-01 level was 64.8 days.
In 2016:
For large departments and agencies, the average number of days taken to staff indeterminately a vacant position using an internal hiring process at the AS-01 level was 55.8 days. For large departments and agencies, the average number of days taken to staff indeterminately a vacant position using an internal hiring process at the EX-01 level was 61.3 days.
Average time to staff an AS-01 position is 56 days within LDAs, an increase from 46 days in cycle 2015 to 2016. This is largely due to 2 organizations with 167 and 434 days. Removing these 2 departments, the average time becomes 39 days in 2016. Average time to staff an EX-01 position is 61 days within LDAs, a decrease from 65 days in cycle 2015 to 2016. Performance on time to staff these positions continues to vary broadly across organizations. Number of days should be consistent with or lower than the previous year’s results. Departments are encouraged to staff positions as efficiently as possible without delays.
Use of existing pools
This measure is an indicator of the effectiveness of collective staffing. For the purpose of this measure, appointments from pools include pools from the department, other government departments, public service-wide pools and partially assessed inventories.
In 2016, 380 individuals were appointed from existing pools to an indeterminate position across the LDAs assessed. The total number of indeterminate appointments was 705 within the same year. 51% of the indeterminate appointments were from the existing pools.
Generic job descriptions
Generic and standardized work descriptions can assist departments and agencies in reducing the time and effort required to write, classify, and update work descriptions; simplify recruitment, staffing, career development, and learning efforts; facilitate mobility within an occupational group. Departments and agencies are expected to implement departmental and interdepartmental standardized job descriptions wherever possible, using unique job descriptions only on an exceptional basis.
Of the 34 LDAs and 18 SDAs assessed, 76% and 68%, respectively, had a generic or standardized job description. 2016-17 was the baseline year for these 2 indicators: use of existing pools and generic job descriptions.
Information management and information technology management
Context
Information, enabled by technology and protected by security, underpins all Government of Canada programs and services. The IM/IT AoM assesses the overall state of compliance with federal information and technology policy requirements, and where possible, provides year-over-year comparisons in key areas of stewardship, program and service enablement, enterprise priorities, and workforce and leadership capacity.
Overall trends
What is working well?
- 91% of LDAs have an IM plan.
- 93% of the departments have demonstrated that they have effective IT planning documents in place.
- Strong Open Government results, with completion of data inventories and publication of datasets.
- 34 of the LDAs have complete IM plans (up from 31).
- Departmental submissions of plans to retire end-of-life applications improved by 35%.
What requires improvement?
- The low volume of information in a designated corporate repository and low disposition rates lead to risks for the government.
- The government is creating more electronic information but is not managing it as well as it could be.
- More departments need to demonstrate they are better prepared for Chief Information Officer turnover and for changes in the role and environment.
- Many legacy applications require investment by departments to guard against aging IT.
Key findings
IM stewardship
The Directive on Recordkeeping aims to ensure that departments create, acquire, capture, manage and protect the integrity of information resources of business value in the delivery of Government of Canada programs and services.
Recordkeeping maturity
Departments are required to perform regular disposition activities for all information resources. The percentage of planned disposition completed is an indicator of an organization’s maturity in the management of its information resources. Although 91% of LDAs have an IM plan, recordkeeping maturity continues to be a challenge 2 years after the deadline to comply with the Directive on Recordkeeping.
Of the 60 organizations assessed, the level of compliance is 77% and is comparable to last year’s results.
Paper records management maturity remains on solid foundation. Since fiscal year 2015 to 2016, the percentage of planned paper disposition completion rates has increased from 43% to 51% for LDAs and from 34% to 42% for SDAs. There is also a slight decrease in paper holdings in LDAs.
By comparison, the government is creating more electronic information but is not managing it as well. In 2016, only 19% of LDAs and 29% of SDAs planned disposition for electronic information resources were completed, which is a slight increase from the 2015 figures (16% and 22%, respectively).
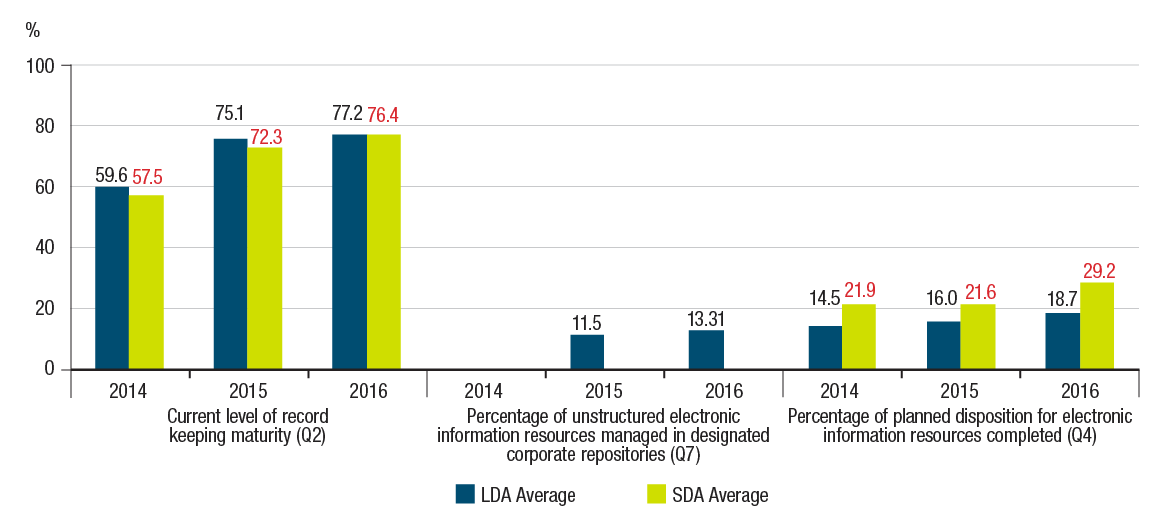
Figure 7 - Text version
In 2014, the average current level of recordkeeping maturity for large departments and agencies and small departments and agencies was 59.6% and 57.5%, respectively. In 2015, the average level of maturity for large departments and agencies and small departments and agencies was 75.1% and 72.3%, respectively. In 2016, the average level of maturity for large departments and agencies and small departments and agencies was 77.2% and 76.4%, respectively.
The average percentage of unstructured electronic information resources that were managed in designated corporate repositories for large departments and agencies was 23.7% in 2014, 11.5% in 2015 and 13.3% in 2016.
The average percentage of planned disposition for electronic information resources completed in 2014 was 14.5% for large departments and agencies and 21.9% for small departments and agencies. In 2015, the average for large departments and agencies was 16.0%, and the average for small departments and agencies was 21.6%. In 2016, the average for large departments and agencies was 18.7%, and the average for small departments and agencies was 29.2%.
Designated corporate repositories
Designated corporate repositories, such as GCDOCS, support departmental recordkeeping requirements throughout the information life cycle. The Directive on Recordkeeping requires that departments identify, establish, implement and maintain repositories in which information resources of business value are stored or preserved in a physical or electronic storage space. The percentage of unstructured electronic information resources maintained in designated corporate repositories is a government-wide performance measure for the IM internal service.
Of the 37 LDAs, over half of them (19) are saving less than 10% of their information in a corporate repository and 82% of total information is saved outside of a corporate repository. Over 60% of LDAs and 48% of SDAs did not undertake any planned electronic disposition during the 3 years of MAF.
The low volume of information in a designated corporate repository and low disposition rates could lead to risks for the government. Risks include the inability to respond to requirements under the Access to Information Act or under the Privacy Act, or to respond to litigation in a timely manner; decreased productivity; increased cost to manage information; and increased difficulties to protect information.
IM program or service enablement
The Government of Canada, through its work on Open Government, is fostering greater openness and accountability, strengthening democracy and driving innovation and economic opportunities for all Canadians.
The Directive on Open Government requires departments to confirm that structural elements are in place as it moves toward government data and information being open by default, such as the data inventory. At the same time, the ability of public servants to find and reuse information and data is fundamental to ensuring the delivery of evidence-based decisions and results for the Government of Canada.
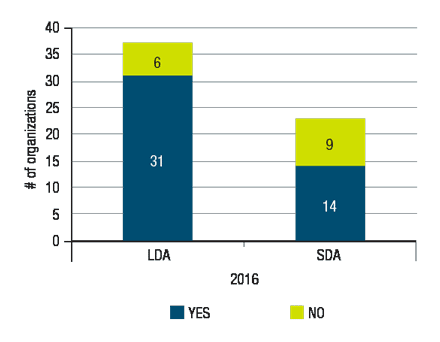
Figure 8 - Text version
In 2016, 31 large departments and agencies had completed data inventory, while 6 did not have a completed data inventory. 14 small departments and agencies had a completed data inventory, while 9 did not have a completed data inventory.

Figure 9 - Text version
In 2015, 244,605 datasets were released via open.canada.ca. In 2016, 121,747 datasets were released.
If the information can be efficiently located, retrieved and used, with its sensitivity and security managed appropriately, the Government of Canada can be responsive and accountable to Canadians. As such, strong IM practices are the cornerstone of the Government of Canada’s open government activities. The Directive on Open Government advances IM practices through the proactive and ongoing release of government data and information.
Support for implementation of the Directive on Open Government is evident in the completion of data inventories and publication of datasets. Of the organizations assessed, 31 of the 37 LDAs and 12 of the 23 SDAs produced their data inventories. Departments continue to manage their datasets. While the number of published datasets decreased in 2016 to 121,747 (from 244,605 in 2015), this is due to departmental efforts to make the data more useful for Canadians through consolidation and reorganization.
IT stewardship
Effective practices for IT stewardship include maintaining and implementing departmental IT plans, management of IT expenditures and application portfolio management.
Overall, the majority of LDAs (93%) have demonstrated that they have effective IT planning documents in place. This will result in the ability to prioritize demand for Shared Services Canada services.
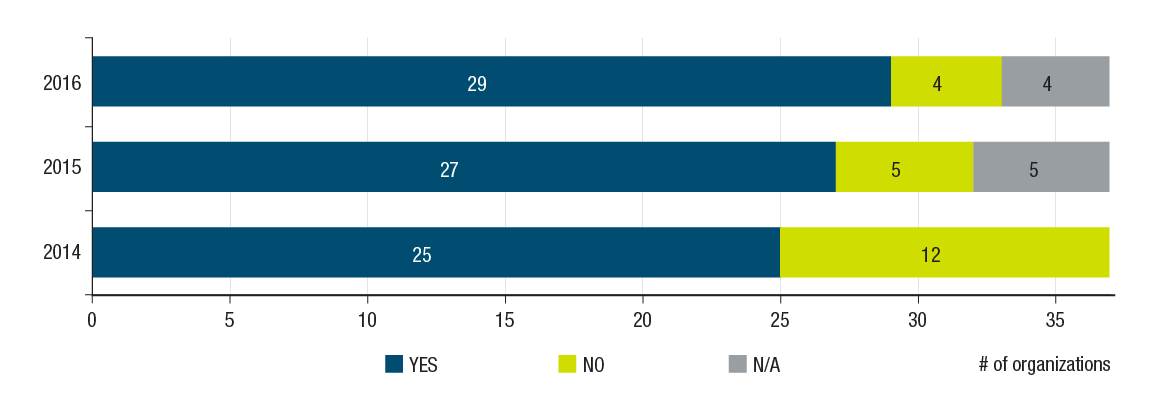
Figure 10 - Text version
In 2014, 25 large departments and agencies answered “Yes” and 12 answered “No” to whether they had a sustainability plan for all mission-critical applications in the submitted Information Technology Plan.
In 2015, 27 large departments and agencies answered “Yes” and 5 answered “No” to whether they had a sustainability plan for all mission-critical applications in the submitted Information Technology Plan, while 5 large departments and agencies answered “Not Applicable.”
In 2016, 29 large departments and agencies answered “Yes” and 4 answered “No” to whether they had a sustainability plan for all mission-critical applications in the submitted Information Technology Plan, while 4 large departments and agencies answered “Not Applicable.”
Of the 37 LDAs assessed, 36 have provided an annual IT plan. All 37 of the LDAs provided an annual IT expenditure report and an inventory of all applications. In 2016, 29 organizations provided a sustainability plan within their IT plan, while 4 organizations had not provided a sustainability plan and an additional 4 organizations had no mission-critical applications in place, therefore they were not applicable to be assessed on this particular indicator. Of the 37 LDAs assessed, 32 had provided an end-of-life retirement plan within their IT plan.
IT program or service enablement
Regular reporting on the status of IT-enabled projects to the appropriate internal governance bodies supports oversight, effective decision-making and successful execution of projects.
Departments have generally done well in reporting the status of IT-enabled projects over the last 2 years, with fiscal year 2016 to 2017 being the second year for the assessment of this practice. In the 2016 to 2017 fiscal year, 32 of the 37 LDAs assessed had projects with an estimated cost of $1 million or more to which the Standard for Project Complexity and Risk applied. Based on the evidence provided for a sample of their projects, they have demonstrated that they provided the status of key IT-enabled project elements to appropriate internal governance bodies on a regular basis. Five LDAs did not have projects subject to the Standard for Project Complexity and Risk, therefore the assessment of their reporting practice did not apply for fiscal year 2016 to 2017.
The Policy on Acceptable Network and Device Use requires deputy heads to ensure that authorized individuals have open access to the internet, including Government of Canada and external Web 2.0 tools and services that enhance productivity, communication and collaboration.
The majority of the organizations have regularly informed authorized individuals of expectations for acceptable use, electronic network monitoring projects being applied and the consequences for unacceptable use of Government of Canada electronic networks and devices.
Enterprise priorities alignment
The government’s IT modernization agenda comprises a number of enterprise-wide initiatives that will result in efficient and effective delivery of programs and services while reducing IT business costs.
In 2016, of the 28 organizations that have participated in common email solutions (ETI), 4 organizations had ETI users on-boarded, while 5 departments had not participated at all.
Thirty departments had participated in the department-wide implementation of myGCHR, while 7 departments had users on-boarded.
Twenty-eight departments had participated in the implementation of Enterprise GCDOCS, while 9 departments had users on-boarded and 2 departments had not participated altogether.
While departments are making some progress with ever-greening of outdated operating systems, a total of 5,402 Windows 2003 operating systems instances were still reported. With current extended support expiring in July 2017, this opens the government to additional security risks and operating costs.
Service performance
Service performance measurement gives an indication of how well IT services are meeting the needs of programs and clients. Below are 2 service performance indicators for IT: mean repair times and incident resolution rates.
Mean time to repair for workplace technology device related incidents
Organizations should strive for short times to resolve workplace technology device related incidents. There is a broad range of mean repair times reported by LDAs, ranging from 1 hour to 293 hours, with an average mean time of 52 hours. In 2015, the average was 57 hours, therefore, departments are showing some improvement, although the range is still very broad from department to department.
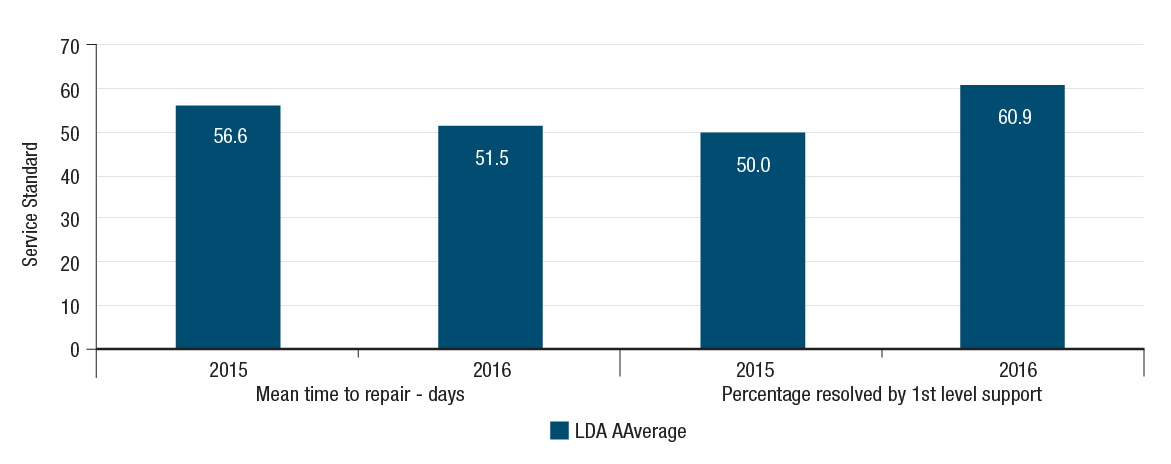
Figure 11 - Text version
The mean time to repair workplace devices was 56.6 days in 2015 and 51.5 days in 2016. The percentage of incidents resolved by 1st-level support was 50.0 in 2015 and 60.9 in 2016.
Percentage of incidents resolved by 1st-level support for workplace technology device related incidents
Organizations should strive to have a high percentage of incidents resolved by 1st-level support for workplace technology device related incidents. In 2016, on average, 61% of such incidents are resolved by 1st-level support, which is an 11-percentage-point increase from 2015.
Application portfolio health
A continual evaluation of the health of applications in departments’ portfolios, based on the risk level and the criticality of the applications is essential to guard against aging IT. Over half of departments assessed have an application portfolio health index below the departmental average of 23%, indicating many legacy applications require investment by departments.
Management of integrated risk, planning and performance
Context
The management of integrated risk, planning and performance reflects the Government of Canada’s priority to better inform expenditure management decisions with performance information, as well to achieve effective and efficient government management. Performance measurement practices are assessed to provide a system-wide view of the extent to which departments create, use and report on quality performance information to inform their program management and decision making so that their programs deliver the expected results and advance the organization’s mandate and priorities.
Overall trends
What is working well?
- Almost all departments have a plan in place to ensure that they can generate and report performance data at the Program Inventory level in support of the Policy on Results.
- A solid majority of departments have governance in place in support of the Policy on Results.
What requires improvement?
- Use of performance information in decision making needs improvement.
- The quality of performance information included in first draft proposals to Treasury Board requires strengthening.
- Improvements are needed by departments on completing evaluations as planned in their departmental evaluation plan.
Key findings
Creation of quality performance information
The Policy on Results sets out expectations for establishing performance measurement functions within organizations. Departments are required to establish a Departmental Results Framework, with departmental results and indicators, and a supporting inventory of programs with performance measures for each program, to monitor progress and overall performance of program results, financial expenditures and human resources. This includes developing and collecting data on program results to measure, evaluate and improve the performance of programs, policies, and services; and upon request, to provide this information to the Treasury Board of Canada Secretariat.
Of the 37 LDAs assessed in 2016, all had performance results plans in place, 35 had plans in place for the purpose of financial expenditures and human resources (full-time equivalents), while 29 had tagging plans in place. Overall, departments are doing generally well in having a plan in place for the majority of the aforementioned purposes.
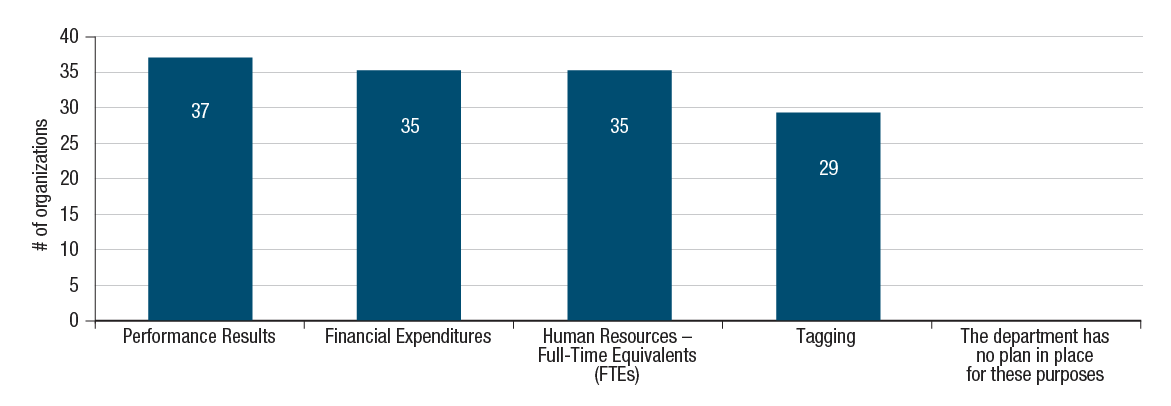
Figure 12 - Text version
37 large departments and agencies had a performance results plan, 35 had a plan for financial expenditures, 35 had a plan for human resources full-time equivalents, 29 had a plan for tagging, and no departments had no plan in place for any of the aforementioned purposes.
In terms of governance in place in support of the new Policy on Results, a solid majority of departments have governance in place to establish performance management functions. Program officials and head of performance measurement functions are not required until November 1, 2017. Results to date demonstrate that LDAs will be well positioned to comply with requirements.
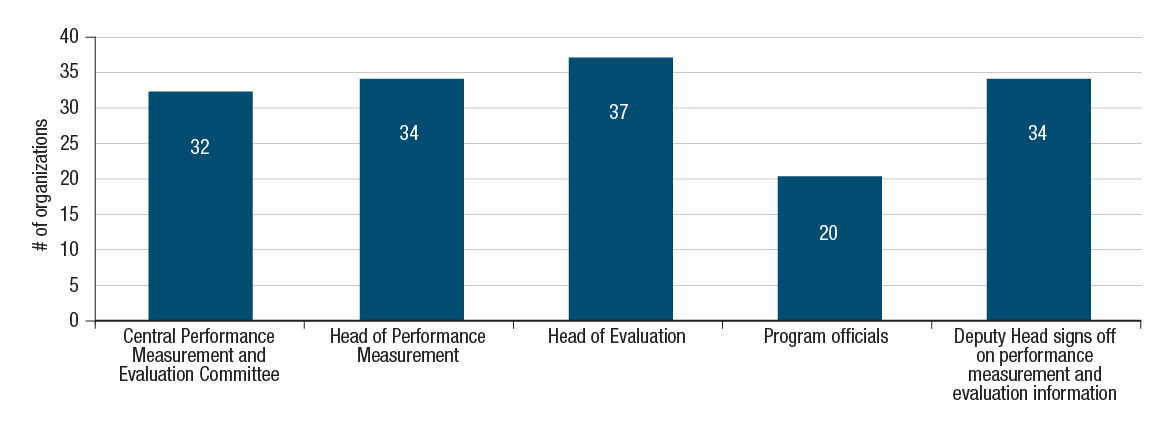
Figure 13 - Text version
32 large departments and agencies have a central performance measurement and evaluation committee, 34 have a head of performance measurement, 37 have a head of evaluation, 20 have program officials, and 34 have deputy head sign-off on performance measurement and evaluation information.
Use of performance information in decision making
The Policy on Results sets out the requirement for Treasury Board submissions to be supported by performance information. Departments are expected to include performance information in their proposals to Treasury Board (including performance measures, actual past program results and evaluation information) and to track progress on all included performance measures.
Almost half of the departments (49%) reported that their senior management use performance information on program efficiency and effectiveness to identify risk, establish priorities, and support resource allocation decisions. These numbers are comparable to last year’s results.
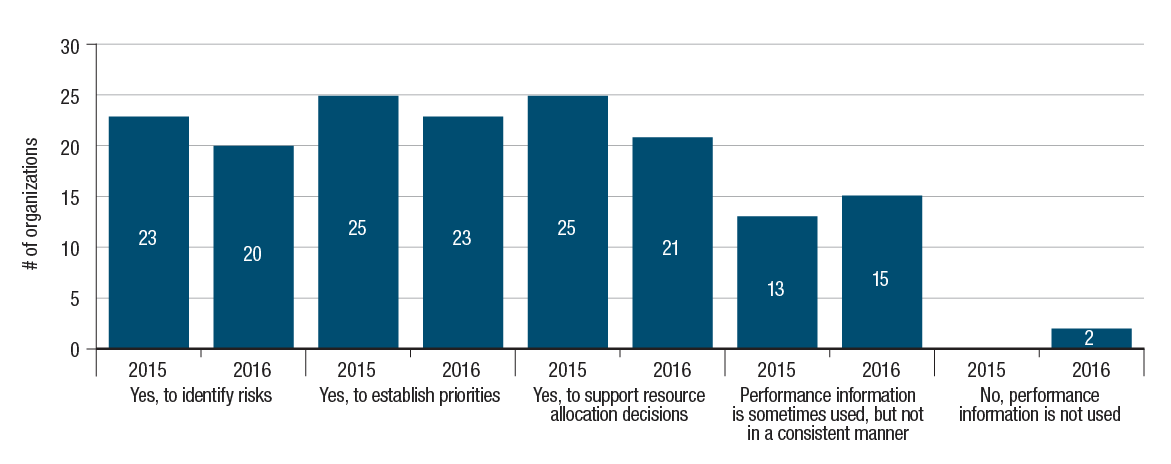
Figure 14 - Text version
In 2015, 23 large departments and agencies answered “Yes” to whether they use performance information on program efficiency and effectiveness to identify risks; 25 large departments and agencies answered “Yes” to whether they establish priorities; 25 answered “Yes” to whether they use support decisions on resource allocation; and 13 reported using performance information sometimes but not consistently. None of the large departments and agencies answered “No, performance information is not used.”
In 2016, 20 large departments and agencies answered “Yes” to whether they use performance information on program efficiency and effectiveness to identify risks; 23 large departments and agencies answered “Yes” to whether they establish priorities; 21 answered “Yes” to whether they use support decisions on resource allocation; and 15 reported using performance information sometimes, but not consistently. Two of the large departments and agencies answered “No, performance information is not used.”
Overall, improvements are required in terms of the quality of performance information included in proposals to Treasury Board.
Twenty departments (67%) track between 85% and 100% of performance indicators included in proposals to Treasury Board, 4 (13%) departments track between 65% and 84% of performance indicators, 2 (7%) departments track between 50% and 64% of performance indicators, and 3 departments (10%) track between 0% and 49% of performance indicators.
Of the departments that submitted first drafts of Treasury Board submissions between September and November 2016, 95% needed to strengthen expected outcomes, 100% needed to strengthen performance indicators, 65% needed to strengthen evaluation information. In addition, only 37% always included past program results, 37% sometimes included past program results, and 26% rarely included past program results.
Internal and external performance reporting
Evaluation informs decision making, improvements, innovation and accountability. As per the Policy on Results, departments are required to annually provide to the Treasury Board of Canada Secretariat a 5-year, rolling departmental evaluation plan that presents planned evaluation coverage of organizational spending and programs.
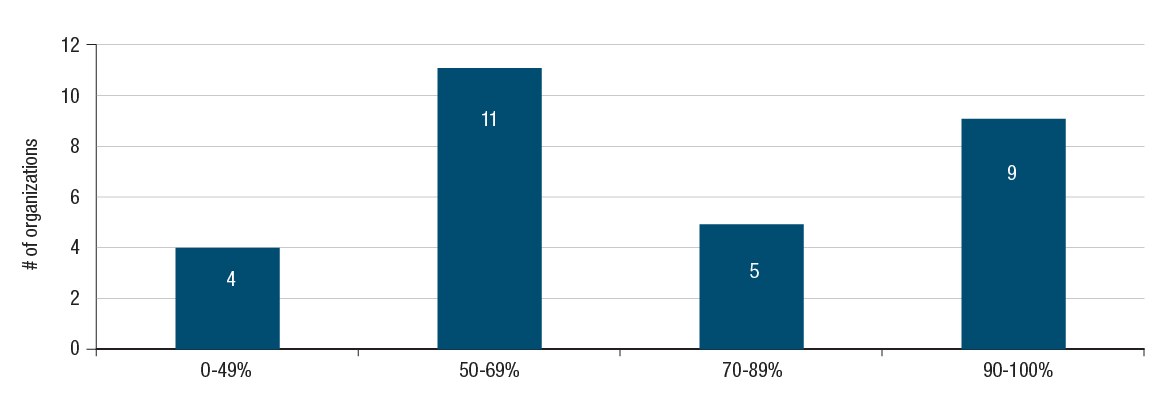
Figure 15 - Text version
From 2015 to 2016, 4 departments completed 0% to 49% of evaluations that were planned for that fiscal year, 11 departments completed 50% to 69%, 5 departments completed 70% to 89%, and 9 departments completed 90% to 100%.
Improvements are needed by departments on completing evaluations as planned in their departmental evaluation plan. Only 9 out of 30 departments completed between 90% and 100% of planned evaluations, while 15 of departments have completed 69% or less of planned evaluations.
Management of acquired services and assets
Context
The objective of this AoM is to monitor controls and practices for investment planning and the management of projects; procurement; the management of real property and materiel assets. The assessment includes departmental capacity to deliver on government priorities through a knowledgeable and skilled work force in these functional communities. Ten LDAs are assessed, representing 77% of federal spending on assets and acquired services; 8 are real property custodians.
Overall trends
What is working well?
- Departments continue to demonstrate risk-based, integrated investment planning across their respective organizations.
- Departments continue to have strong procurement governance regimes in place and have improved in the area of procurement planning.
- 8 out of 10 departments assessed have complete and accurate materiel information.
- 9 out of 10 departments continue to increase the enrollment of their procurement specialists in the Certification Program for the Federal Government Procurement and Materiel Management Communities.
What requires improvement?
- Timely and accurate procurement reporting and procurement service standards continue to be a challenge government-wide.
- Generating cost estimates at the work-package level on a more consistent basis in order to effectively monitor, control and deliver projects.
Key findings
Investment planning and management of projects
The Policy on Investment Planning – Assets and Acquired Services requires that investment planning, in terms of governance, systems and people, be in place and maintained. Departmental investment planning is expected to support departmental strategic planning and incorporate a horizontal and government-wide perspective. An investment plan should align with outcomes set out in the Departmental Results Frameworks.
All 10 of the departments assessed have complied with the Policy on Investment Planning. The Policy on the Management of Projects requires that projects be managed in a manner that is consistent with the assessed level of complexity and risk. This includes demonstrating that both knowledgeable, integrated, multi-disciplinary project teams and effective project management systems and processes support the project management function.
It is expected that project outcomes are achieved within time, scope and budget constraints. Departments and agencies are expected to define a methodology to collect and track project performance information.
Reliable cost estimates are essential for the successful delivery of projects. All 10 of the departments assessed have a project management framework in place. In addition, majority of departments use lessons learned from their past projects, generate cost estimates for individual components of their projects at the work-package level and validate estimated costs using available data.
The majority of departments have processes in place to track whether completed projects were delivered on time, on scope and on budget using a department-defined methodology, which includes rebaselining for some departments.
Procurement
Procurement is the function of obtaining goods and services and carrying out construction. A significant part of investment planning includes procurement planning, a component that has consistently been identified as a challenge for many departments. Stakeholder engagement and strong planning practices are a necessary step in promoting and improving fair, open and transparent procurement.
Departments have good procurement governance regimes in place. All 10 departments have procurement governance regimes in place that are commensurate with the volume and the complexity of their procurement. Departments have improved their procurement planning practices since 2015 by including procurement information in their investment plans and sharing their procurement plans with stakeholders.
Reporting on procurement obligations
Departments are expected to report on their procurement obligations in a timely and accurate manner. This includes the Procurement Strategy for Aboriginal Business, Comprehensive Land Claim Agreements, Proactive Disclosure and the Purchasing Activity Report.
Some challenges still remain in the area of procurement reporting. While there has been improvement in timely reporting of the Purchasing Activity Report, many departments still struggle to submit their reports for Comprehensive Land Claim Agreements and the Procurement Strategy for Aboriginal Business.
Service standards have been flagged as an important issue both by departments and by Treasury Board of Canada Secretariat officials. Ensuring that reasonable service standards are in place and are met is an essential component of sound procurement practices.
In 2016, 7 organizations reported their procurement obligations in a timely and accurate manner, which is a slight increase from 2014 and 2015.
Procurement service standards continue to be a challenge government-wide. Of the 10 departments assessed, 6 have internal service standards in place and have measured results against the standard.

Figure 16 - Text version
In both 2014 and 2015, 6 large departments and agencies answered “Yes” to whether they report in a timely and accurate manner on their procurement obligations, while 4 large departments and agencies answered “No.” In 2016, 7 large departments and agencies answered “Yes” to whether they report in a timely and accurate manner on their procurement obligations, while 3 large departments and agencies answered “No.”
Contracts over $25 thousand awarded through a competitive bidding process
The Government Contracts Regulations require a competitive approach to soliciting bids before any contract is entered into, with certain exceptions (for example, contracts under $25 thousand). A best practice is for organizations to have the majority of contracts over $25 thousand awarded through a competitive bidding process. The percentage of all departmental contracts over $25 thousand awarded through a competitive bidding process is a government-wide performance indicator for the Acquisition Services internal service.
In 2016, 83% of all department or agency contracts over $25 thousand were awarded through a competitive bidding process, which is comparable to 2015 results.
Low-dollar acquisitions (under $10 thousand) using acquisition cards
The Directive on Acquisition Cards aims to reduce or eliminate costly and inefficient procurement transaction and payment methods such as the use of Receiver General cheques, requisitions and purchase orders. Accordingly, departments should strive to have the majority of acquisitions under $10 thousand carried out using acquisition cards as a procurement instrument.
In 2016, 55% of department or agency low-dollar acquisitions (under $10 thousand) were carried out using acquisition cards, which is slightly lower than the 2015 average of 58%. In addition, departments range from 6% to 92% in using acquisition cards for contracts valued at $10 thousand or less. Two departments are at 90% and above while 2 departments are under 20%.
Contracts that used mandatory and non-mandatory standing offers
The Treasury Board Contracts Directive prescribes the requirement for the mandatory use of certain standing offers. A best practice is to issue call-ups against standing offers, as frequently as possible, given that this approach promotes transparent and efficient processes. The percentage of all departmental contracts that used mandatory and non-mandatory standing offers is also a government-wide performance measure for the Acquisition Services internal service.
In 2016, 23% of all department or agency contracts used mandatory and non-mandatory standing offers, which is comparable to 2015 results at 26%. Departmental results ranged from 3% to 51%.
Real property and materiel
Real property and materiel asset management frameworks, requirements under the Policy on Management of Real Property and the Policy on Management of Materiel, are intended to support program objectives and the active management of portfolios.
The Policy Framework for the Management of Assets and Acquired Services sets the direction for these activities to optimize value for money and sound stewardship. Departmental strategies that follow a life-cycle management approach, reflecting direct and indirect costs of assets and services enables affordability, cost-effectiveness and performance.
Asset management frameworks enable timely and informed decisions and support program delivery. They should have clear accountability and decision-making structures; authorities and responsibilities that are appropriate to organizational needs and capacity; and systems that provide relevant financial and performance information.
Most departments are able to demonstrate that they have asset management frameworks in place to manage real property and materiel.
The Policy on Management of Materiel requires that a materiel management information system be in place to enable the collection and generation of complete and accurate data on materiel asset holdings, and the Reporting Standard on Real Property requires custodians to maintain current, complete and accurate records in the Directory of Federal Real Property.
Most departments have complete and accurate real property information and materiel asset information. Departments and agencies are required to develop strategies that achieve value for money and sound stewardship through the acquisition, operating and maintenance, and disposition phases of asset management. For real property assets, cost savings can result from managing on a portfolio basis.
Seven out of 8 organizations do develop strategies that achieve value for money and sound stewardship over the life of their real property assets. For their materiel assets, 6 out of 10 organizations develop such strategies.
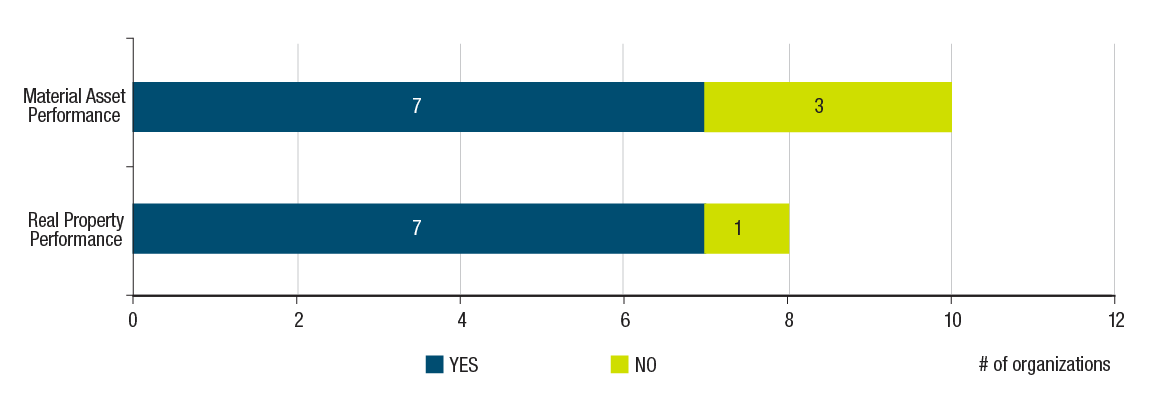
Figure 17 - Text version
In 2016, 7 organizations answered “Yes” to whether they use material asset performance in decision making while 3 departments answered “No.” 7 organizations answered “Yes” to whether they use real property performance information in decision making while 1 organization answered “No.”
Deputy heads are responsible for monitoring policy compliance and for ensuring that management practices and controls are in place to act expeditiously when control failures are identified. For real property, departments and agencies are required to develop acquisition, operation, maintenance and disposal strategies based on the findings of performance assessments and on an economic and program analysis that considers the full life-cycle cost and benefits of the real property options to meet ongoing program requirements.
All but one of the organizations demonstrate use of real property performance information in decision making. A slightly lower number of departments (7 out of 10) demonstrate use of materiel asset performance information in decision making.
Procurement, materiel management and real property communities
Competencies and accreditation for functional communities are key elements for effective talent management. Applying them consistently across government ensures that communities have the knowledge, skills and behaviours to effectively deliver on government priorities.
Four departments have demonstrated consistent strength, leadership, and continuous improvement in communities’ talent management questions over the past 3 years. Nine out of 10 departments continue to increase the enrolment of their procurement specialists in the Certification Program for the Federal Government Procurement and Materiel Management Communities.
Departments need to be more consistent in how they identify and report on the population of their functional specialists within procurement and materiel management communities. Four departments have consistently struggled with the use of functional competencies for the talent management of their functional communities over the past 3 years.
Security management
Context
Sound security management supports the continuity and integrity of programs and service delivery, which contributes to the health, economic well-being, safety and security of Canadians and meets the challenges of a dynamic and evolving risk environment.
This AoM includes 20 departments and is intended to generate management performance information on security management practices and to help strengthen the overall security posture of the Government of Canada.
Overall Trends
What is working well?
- A Government of Canada average of 76% completion of planned activities outlined in departmental security plans indicates these plans are effective in driving desired security outcomes.
- Completion of assurance level assessments for online external services to clients has increased by 22%.
- Applications that support critical services are being assessed for security risks and have been authorized for operation.
- 17 out of 20 LDAs assessed reported that all critical services have a business continuity plan in place.
What requires improvement?
- Security assessment of facilities remains a challenge, increasing only modestly over last year. While small annual increases over the 3 years are evident, the Government of Canada performance level remains low and below performance expectations.
- There is still low implementation of the mandatory service for single secure login (username and password) for clients of Government of Canada online services.
Key findings
Effective and integrated security management
The Policy on Government Security requires that the departmental security program be effective and that the objectives detailed in the departmental security plan remain appropriate to the needs of the organization and the government as a whole.
On average across the 17 organizations reporting against this indicator, 76% of activities identified in the departmental security plan that were planned for completion for the previous fiscal year (2015 to 2016) were completed as planned.
This result is comparable to the results from the 2014 to 2015 fiscal year, when this indicator was last assessed and indicates these plans continue to be effective in driving security outcomes.
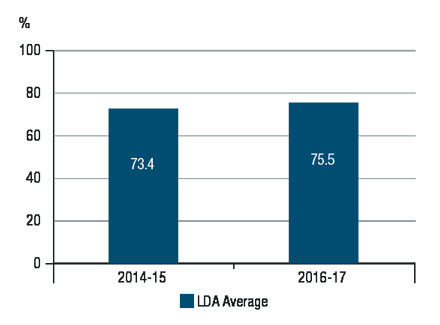
Figure 18 - Text version
In the 2014 to 2015 fiscal year, 73.4% of activities identified in the Departmental Security Plan, planned for completion for the previous fiscal year, were completed as planned. In the 2015 to 2016 fiscal year, 75.5% of activities identified in the Departmental Security Plan, planned for completion for the previous fiscal year, were completed as planned.
Protection of Government of Canada assets and continued program or service delivery
Information technology security
The Operational Security Standard: Management of Information Technology Security requires departments to continuously manage the IT security risks to information and IT assets throughout the life of their programs and services.
The formal authorization of applications through which critical services of a department or agency are delivered, as well as vulnerability assessments for IT systems and applications, are key IT security practices which can reduce department or agency risk exposure.
The government-wide average of mission critical applications currently in operation that have been authorized has increased from 52% in fiscal year 2014 to 2015 to 69% in 2015 to 2016, and 81% in 2016 to 2017.
Among the 20 LDAs with a risk remediation plan for mission critical applications operating under conditions, an average of 28% of remediation conditions have been met. Overall maturity tracking progress of remediation plans and activities is weak with 7 of 19 organizations not tracking progress.
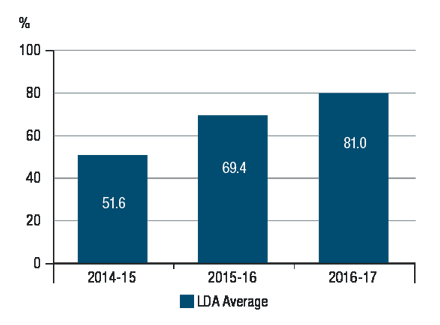
Figure 19 - Text version
In the 2014 to 2015 fiscal year, 51.6% of mission-critical applications currently in operation have been authorized for operation. In the 2015 to 2016 fiscal year, 69.4% of mission critical applications currently in operation have been authorized for operation. In the 2016 to 2017 fiscal year, 81.0% of mission-critical applications currently in operation have been authorized for operation.
Physical security
The Operational Security Standard on Physical Security requires that the external and internal environments of a facility be managed to create conditions that, together with specific physical security controls, reduce the risk of workplace violence, protect against unauthorized access, detect attempted or actual unauthorized access and activate an effective response.
Security assessments provide an understanding of the effectiveness of security controls at mitigating risks and serve as the basis for establishing action plans for strengthening the physical security posture within an organization and across the Government of Canada.
Among the assessed LDAs, the percentage of facilities that have an up-to-date security assessment has increased by 12 percentage points from 2015 to 2016. As well, the percentage of facilities with material residual security deficiencies that have an approved and funded risk mitigation plan has increased over the 3 years by 14 percentage points. While this demonstrates positive increasing performance trends, the government-wide performance level remains low and below performance expectations.
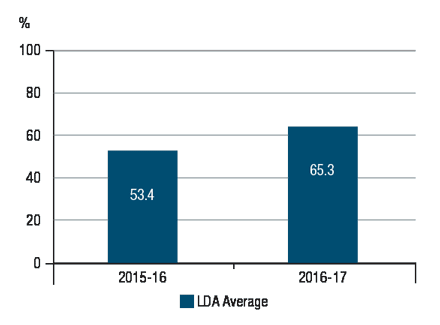
Figure 20 - Text version
In the 2015 to 2016 fiscal year, on average, 53.4% of the large departments’ and agencies’ facilities have an up-to-date security assessment. In the 2016 to 2017 fiscal year, on average, 65.3% of the large departments’ and agencies’ facilities have an up-to-date security assessment.
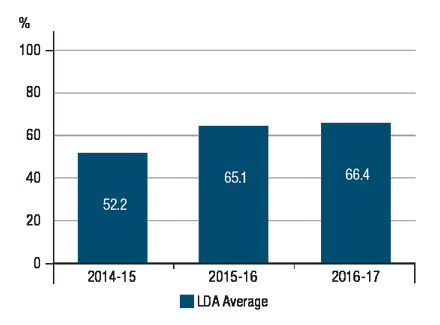
Figure 21 - Text version
In the 2014 to 2015 fiscal year, on average 52.2% of the large departments’ and agencies’ facilities with material residual security deficiencies have an approved and funded (where required) risk mitigation action plan. In the 2015 to 2016 fiscal year, on average, 65.1% of the large departments’ and agencies’ facilities with material residual security deficiencies have an approved and funded (where required) risk mitigation action plan. In the 2016 to 2017 fiscal year, on average, 66.4% of the large departments’ and agencies’ facilities with material residual security deficiencies have an approved and funded (where required) risk mitigation action plan.
Business continuity planning
The Operational Security Standard: Business Continuity Planning Program requires departments to establish a business continuity planning program to provide for the continued availability of services and associated resources that are critical to the health, safety, security or economic well-being of Canadians, or the effective functioning of government.
Business continuity planning practices continue to be a strong area of performance government-wide. Seventeen out of the 20 LDAs reported that all critical services have a business continuity plan in place, and where the majority of business continuity plans were last updated in the 2016 to 2017 fiscal year. Of the critical services with a business continuity plan, the average across the LDAs is 84% that have been tested or exercised, which is a 7-percentage-point increase since the 2015 to 2016 fiscal year. Fifteen out of the 20 LDAs assessed review their business continuity planning on a cyclical basis.
Government of Canada Security Policy priority alignment
Canada’s Cyber Security Strategy
The Government of Canada’s Cyber Security Event Management Plan outlines the stakeholders and actions required to ensure that cyber security events are addressed in a consistent, coordinated and timely fashion government-wide.
Departments have demonstrated effective records and tracking of cyber security incidents, including tracking when cyber security incidents have been reported to the Government of Canada Computer Incident Response Team. This practice enables the team to optimally support the departments during cyber incidents and supports the Government of Canada’s ability to conduct an enterprise response to cyber security incidents.
Federating identity
The objectives of the Directive on Identity Management are to manage risk, to protect program integrity, and to ensure consistency of experience when delivering an external service to a client. The mandatory use of the external credential management service (GCKey or Commercial Broker Service) provides a consistent, standardized solution that supports these objectives while enabling clients to use their credential of choice to securely access external online services provided by the Government of Canada, reducing cyber security risk.
Completion of assurance level assessments for online external services to clients increased by 22 percentage points between the 2015 to 2016 and the 2016 to 2017 fiscal years. While online external services are being assessed for identity and credential risk, there is still low implementation of the mandatory service for single secure login (username and password) for Government of Canada clients, which increased only moderately over the last 3 years from 31% in 2014 to 47% in 2016.
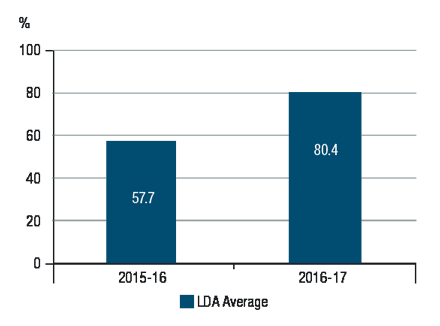
Figure 22 - Text version
In the 2015 to 2016 fiscal year, on average, 57.7% of the large departments’ and agencies’ online external services that require client authentication have a completed assurance level assessment. In the 2016 to 2017 fiscal year, on average, 80.4% of the large departments’ and agencies’ online external services that require client authentication have a completed assurance level assessment.
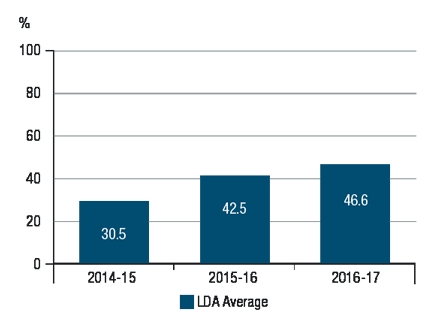
Figure 23 - Text version
In the 2014 to 2015 fiscal year, on average, 30.5% of the large departments’ and agencies’ online external services require a client to sign-in with a username and password. In the 2015 to 2016 fiscal year, on average, 42.5% of the large departments’ and agencies’ online external services require a client to sign-in with a username and password. In the 2016 to 2017 fiscal year, on average, 46.6% of the large departments’ and agencies’ online external services require a client to sign-in with a username and password.
Service management
Context
The service AoM supports oversight of the recent Policy on Service that came into effect in October 2014, and assists the Treasury Board of Canada Secretariat and deputy heads in measuring progress in establishing a more strategic and coherent government-wide approach to the design and delivery of services. The AoM covers a broad range of external services delivered to individuals, businesses and other organizations, as well as a variety of services delivered internally between departments and agencies. The effective management of these services contributes to value for money, produces high levels of client satisfaction, and promotes confidence in government.
Through the upcoming Government of Canada Service Strategy, the government is seeking to further evolve online services and establish new performance standards to promote a better client experience for Canadians. In response to the government’s commitment to improve services, there has been increased activity in many departments in this transition year to review priority services. Next year, departments and agencies will be under increased scrutiny to demonstrate positive results, particularly those relating to service standards, client feedback, client satisfaction and the prevalence of online services.
Overall trends
What is working well?
- All departments have service inventories, and most are comprehensive and updated annually.
- All departments have a multi-year corporate service management strategy.
- Departments are increasingly aware of the importance of client-centric services and the new Government of Canada service agenda.
What requires improvement?
- More progress is required to make external and internal enterprise services available online from end to end.
- Departments need to articulate clear targets for increasing the availability of online services.
- More progress is required to improve service standards and to increase the availability of real-time performance information and real-time application status.
Key findings
Service stewardship
Departments and agencies are expected to develop and implement strong service management practices for the design and delivery of better services, including the establishment of service inventories, service management strategies, service standards and performance monitoring and reporting.
The Policy on Service requires that departments develop a service inventory and update it annually. A service inventory contains data elements that enable service providers to fully understand and manage their services. Ten out of the 11 LDAs have updated their service inventory during the review period in 2016.
The Policy on Service requires that a multi-year departmental service management strategy be developed and implemented in alignment with the government’s service direction, and that progress be measured annually. A service management strategy outlines a department’s multi-year overall approach to managing and improving its services, and identifies objectives, initiatives and milestones for service improvement. On average 57% of the service management strategy commitments were achieved amongst the LDAs assessed between April 1, 2015 and March 31, 2016.
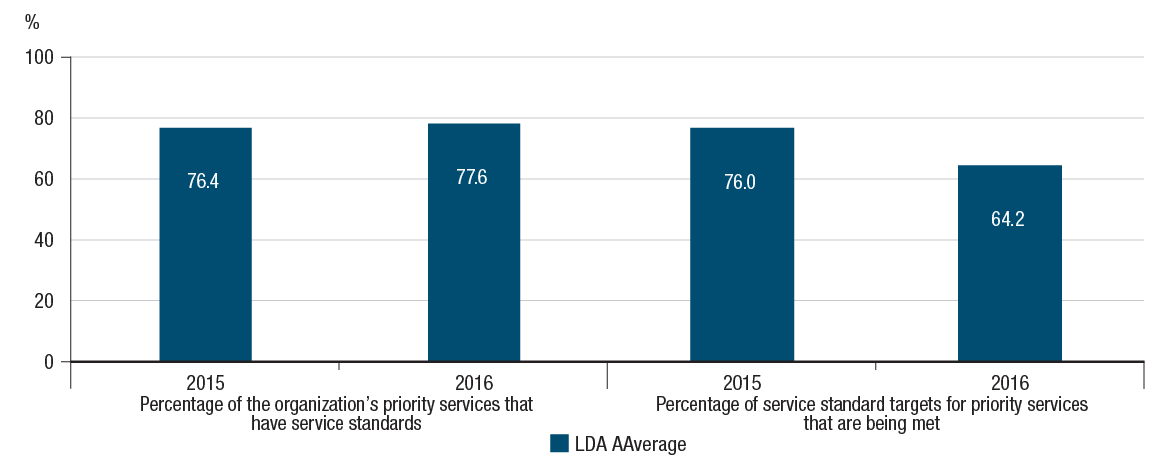
Figure 24 - Text version
The percentage of the large departments’ and agencies’ priority services that have service standards was 76.4% in 2015 and 77.0% in 2016. The percentage of the large department’s and agencies’ service standard targets for priority services that are being met was 77.6% in 2015 and 64.2% in 2016.
The Policy on Service requires that service standards for priority services be available to clients on Canada.ca for external services and on internal collaborative tools for internal enterprise services. Service standards establish expectations for the level of service clients are to receive, and are a cornerstone in determining client satisfaction with Government of Canada services.
The percentage of priority services with service standards has remained relatively stable at 78%, and 64% of service standard targets for priority services are being met. There is a considerable variation between organizations on the extent to which their service standards are being met for priority services, with some organizations meeting 0% of their targets, while others meet 100% of their targets.
On average, 17% of priority external services have real-time performance information published on Canada.ca. Only 3 out of 9 departments assessed have at least some information published on Canada.ca, while 6 out of 9 departments have no real-time performance information published.
There has been little improvement in this indicator since 2015, and due to the significant changes required to business processes and systems, considerable effort will be required to increase the amount of real-time performance information available through Canada.ca for priority external services.
Enterprise alignment
The Policy on Service requires that priority services be reviewed regularly to identify opportunities for service redesign, improved usability, channel integration and mobile optimization, and, where appropriate, adopt best-in-class service delivery approaches, alternative service delivery mechanisms and partnership arrangements.
Of the 11 LDAs assessed, 6 organizations have reviewed 100% of their priority services during the review period to identify opportunities for improvement while 3 organizations have reviewed none of their priority services. The overall LDA average is 60%.
Client-centric services
Departments are expected to deliver their services with an increasing reliance on e-services. Canadians and businesses expect access to convenient and secure end-to-end e-services that respect their privacy. In addition, online service delivery is significantly more cost-effective than delivery through traditional channels such as the in-person and telephone channels.
The Policy on Service requires that the proportion of external and internal enterprise e-services be increased annually. Departments need to articulate clear targets for increasing the availability of their online services.
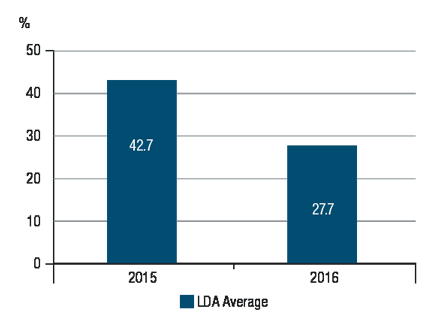
Figure 25 - Text version
In 2015, an average of 42.7% of priority services from large departments and agencies could be completed online from end to end. In 2016, an average of 27.7% of priority services from large departments and agencies could be completed online from end to end.
This year’s results established a new baseline for these indicators against which future performance can be assessed. In 2016, of the 9 LDAs assessed, only 21% of external services could be completed online from end to end service. Out of the 5 departments assessed for internal enterprise services, only 38% of these could be completed online. With regard to priority services, only 28% of these could be completed online from end to end. Significant effort across the Government of Canada will be required to improve performance in this area.
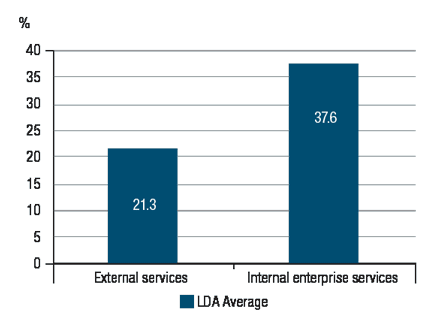
Figure 26 - Text version
On average, 21.3% of external services can be completed online from end to end within the large departments and agencies. On average, 37.6% of internal enterprise services can be completed online from end to end within the large departments and agencies.
Of the 9 LDAs assessed for external services, an average of 47% of their services can be completed online. Of the 5 LDAs assessed for internal enterprise services, an average of 48% of their services can be completed online.
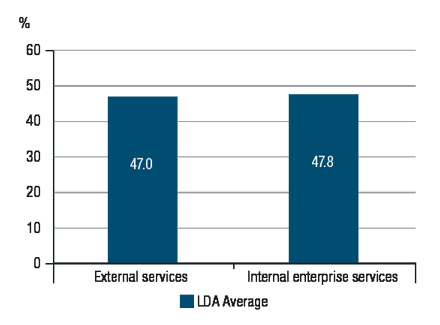
Figure 27 - Text version
On average, 47.0% of each external service can be completed online within the large departments and agencies. On average, 47.8% of internal enterprise services can be completed online within the large departments and agencies.
© Her Majesty the Queen in Right of Canada, represented by the President of the Treasury Board, 2017,
ISSN: 2561-1186
Page details
- Date modified: