
Employment Equity in the Office of the Auditor General of Canada—Annual Report 2021–22
Table of Contents
- Introduction
- Employment Equity Environment
- Application of the Employment Equity Act
- Employment Equity Plan
- Employment Equity Implementation
- Employment Equity Representation
- Key Performance Indicators
- Call to Action on Anti-Racism, Equity, and Inclusion
- Conclusion
- Appendix A—Office of the Auditor General of Canada Employment Equity Action Plan: 2021–22 Commitments, Targets, and Results
- Appendix B—Statistics
- List of Tables
Introduction
This annual report on employment equity in the Office of the Auditor General of Canada (OAG) outlines the state of employment equity representation for the 2021–22 fiscal year.
Employment Equity Environment
Enabling legislation
The OAG has a legislative basis in the Auditor General Act, the Financial Administration Act, and a number of other statutes. The Auditor General’s powers are set forth in legislation passed by Parliament.
Application of the Employment Equity Act
The OAG is subject to the Employment Equity Act, in accordance with subsection 4(1)(c).
Work
The OAG serves Parliament by providing it with objective, fact-based information and expert advice on government programs and activities, gathered through audits. Parliamentarians use OAG reports to oversee government activities and hold the federal government to account for its handling of public funds.
The work completed by the OAG is called legislative auditing. The Auditor General of Canada is an Officer of Parliament who carries out work on behalf of Parliament and who is accountable to Parliament.
The OAG carries out 3 main types of legislative audits: financial audits, performance audits of federal departments and agencies, and special examinations of Crown corporations.
The OAG audits a vast range of activities conducted by the Government of Canada and the governments of Yukon, Northwest Territories, and Nunavut. These activities cover a wide variety of topics such as health, culture, the environment, finance, agriculture, transportation, and scientific research. Since 1995, the OAG has also had a specific environment and sustainable development mandate, established through amendments to the Auditor General Act.
The Auditor General’s responsibilities regarding environmental matters increased with the creation of the position of Commissioner of the Environment and Sustainable Development in 1995.
The Commissioner is responsible for monitoring sustainable development strategies of federal departments, overseeing the environmental petitions process, and auditing the federal government’s management of environmental and sustainable development issues.
Employees
As of 31 March 2022, the OAG employed 791 people between its head office in Ottawa and 4 regional offices in Vancouver, Edmonton, Montréal, and Halifax.
The OAG’s audit professionals are highly qualified in their fields and bring a rich mix of academic disciplines and experience to their work. They include accountants, engineers, lawyers, management experts, information technology professionals, environmental specialists, and economists.
Our audit staff have either a graduate degree or a bachelor’s degree and Chartered Professional Accountant (CPA) designation, and some also have additional credentials. All financial audit trainees have a bachelor’s degree.
The OAG’s staff also includes employees in a range of professions, such as legal services, professional development, editorial services and translation, international relations, information technology, security, information management, human resource management, financial management, communications, audio visual services, parliamentary liaison, and desktop publishing and publications and graphic design.
Work environment
The OAG is committed to providing a caring work environment where all are treated with dignity and respect and are supported as they strive to fulfill their career aspirations. The OAG encourages open and honest communication to create a climate of trust and collaboration. The OAG values diversity and promotes mental health, continuous learning, and a work-life balance for its employees.
OAG employees are expected to demonstrate personal integrity and ethics and to adhere to OAG values, standards, and codes of conduct. People management competencies and behaviours are evaluated when staffing positions and are discussed periodically during check-ins between managers and employees. These discussions serve to support employees’ development, engagement, and achievement of desired results.
Through its Mental Health Strategy, which was launched in June 2019, the OAG aims to raise awareness about mental health and to foster a healthy, safe, supportive, and inclusive workplace. The strategy’s Roadmap for 2019 to 2022 sets out organizational goals, the necessary activities to achieve them, and the measurable outcomes for employees and the OAG. As part of this strategy, the OAG identifies actions to increase diversity and raise awareness about inclusion and respect in the workplace.
Commitment to diversity and inclusion starts at the top. That is why the OAG’s Executive Committee and the Equity, Diversity, and Inclusion Champion signed an anti-racism statement that commits to concrete actions with regards to diversity and inclusion. Senior managers have been educating themselves about diversity and inclusion to better understand their biases and privilege and to become stronger allies and leaders who create change.
Structure
The Principal, Human Resources, serves as the Equity, Diversity, and Inclusion Champion and plays a leadership role in developing strategies to
- meet or exceed employment equity representation
- hire and develop a workforce that reflects the diversity of Canada’s population
- foster inclusivity
In addition, the OAG’s Diversity and Inclusion Committee promotes awareness of equity, diversity, and inclusion topics and issues. This volunteer committee aims to increase awareness of inclusion and undertakes activities to promote a workplace culture of trust, respect, and belonging. The committee’s chairperson reports to the Equity, Diversity, and Inclusion Champion on employment equity issues that are discussed during committee and individual meetings. In addition, the chairperson offers advice to help shape the equity, diversity, and inclusion agenda and is invited to participate at executive-level meetings and share comments and perspectives on plans.
Employees at the executive level have been selected to act as sponsors: the Executive Sponsor for Sustainable Development Goals and the Executive Sponsor for Equity, Diversity, and Inclusion and the Champion for Gender-based Analysis Plus. The executive sponsors ensure that the United Nations’ Sustainable Development Goals and gender-based analysis plus are considered in the OAG’s work and act as the Executive Committee’s liaisons for diversity and inclusion topics.
The OAG also has an Ombuds, whose mission is to provide a safe environment where employees can discuss and resolve work-related issues without fear of reprisal. The Ombuds monitors the pulse of the organization, shares resources and information, and provides aggregated feedback to OAG’s senior management to encourage a healthy work environment.
To further support employment equity groups, the OAG has created an IT accessibility team, which is dedicated to inclusive design, and a dedicated disability management and wellness team. The purpose of these teams is to support employees’ mental and physical health, safety, and well-being along with the Occupational Health and Safety team. The OAG has also hired a Talent Acquisition Specialist to engage with equity-seeking communities to better identify and attract diverse candidates.
Employment Equity Plan
In accordance with the requirements in section 10 of the Employment Equity Act, the OAG maintains an employment equity plan. The Triennial Employment Equity Plan―2021–2024 was finalized and presented to the Executive Committee in fall 2021. It identifies the OAG’s commitments to enhancing representation across occupational groups and levels; highlights the OAG’s efforts to sustain an inclusive, diverse, and respectful workplace; and reports on activities carried out to comply with legislation. Appendix A presents the OAG’s commitments, targets, and results for the 2021–22 fiscal year.
Employment Equity Implementation
Implementation of legislation
The OAG implements the requirements of the employment equity legislation by administering a voluntary self-identification questionnaire. It then conducts an annual workforce analysis to determine the degree of representation that designated groups have in each occupational group. The results (as of 31 March 2022) are presented in Appendix B.
Recruitment
The OAG has developed an updated resourcing strategy for 2021–24 that establishes priorities that will enable the OAG to develop, attract, and acquire a qualified and experienced workforce to achieve its vision, mission, and strategic outcomes. The strategy reinforces the OAG’s continued focus on building and retaining a diverse workforce that reflects Canada’s population, with particular emphasis on recruiting Indigenous persons and persons with disabilities into positions across the organization and increasing the representation at senior levels of persons in a visible minority group (Tables 8 and 9).
The OAG has partnered with different organizations, including Indigenous Link and the Employment Accessibility Resource Network, to increase representation at all levels of Indigenous persons and persons with disabilities. In addition, the use of blind hiring processes has been introduced as a means to reduce barriers for candidates.
Activities, training, and communications
In the 2021–22 fiscal year, the OAG planned and participated in the following activities to promote a corporate environment that supports diversity awareness:
Activities
| Name of initiative | Description |
|---|---|
|
We The North! |
This initiative was a Fireside Chat. We were joined by Amy Amos, the energetic northern leader and Director of Arctic Operations for Fisheries and Oceans Canada. Amy gave her perspective on northern culture and Indigenous issues. In addition, JP Hoe performed some of his original songs, live from Winnipeg, Manitoba. Finally, Frank Turner, Yukon dog musher and winner of the Yukon Quest, provided his insights on leadership and team strengthening using powerful and inspiring metaphors. |
|
Finding Your Voice |
This initiative was a Fireside Chat. We were joined by Dawolu Saul, a strong advocate for diversity and inclusion in the public service and Executive Director of Communications at the Privy Council Office. He shared his experience and best advice for promoting and celebrating the richness of diversity in the workplace. |
|
Diversity and Inclusion Book Club |
The Diversity and Inclusion Committee organized 6 book club gatherings over the course of the year to explore, learn, and share information on a broad range of topics such as gender, women and data, Métis history, Black experiences, and residential school experiences. |
|
Guest speaker for managers |
The OAG invited a speaker to share the challenges faced by Black employees in the workplace. The presentation was delivered through Management Link, an internal network for managers and executives, with the purpose of laying the foundation for more inclusive thinking. |
|
Publication of One Plate at a Time cookbook |
The Diversity and Inclusion Committee published a cookbook, One Plate at a Time, profiling dishes from a diversity of employees with text describing why they are family favorites. Staff shared over 60 recipes and raised almost $1,000 for the Government of Canada Workplace Charitable Campaign. |
|
Phyllis’s Orange Shirt |
The Diversity and Inclusion Committee organized a panel discussion based around Phyllis’s Orange Shirt, a memoir by Phyllis Webstad detailing her first day at a residential school. Two First Nations employees shared their experiences, and this event allowed participants to explore the residential schools experience and the concept of reconciliation more broadly. |
Training
The OAG promotes respect, diversity, and inclusion in the workplace through its employee onboarding program and through courses from the Canada School of Public Service. Some of the courses offered to all managers and employees are on the following topics:
- diversity
- Indigenous history
- prevention of violence, harassment, and discrimination
- respect and inclusion
- unconscious bias
- values and ethics
- gender-based analysis plus
Communications
The OAG posts information throughout the year to raise awareness of various cultural days and celebrations by internal and external communication tools (Microsoft Teams, Instagram, LinkedIn, Facebook, and so on). Over the past year, these posts highlighted Passover and Easter, Ramadan, Dharma Day, Eid‑al‑Adha, Emancipation Day, Rosh Hashanah, Yom Kippur, Diwali, Bandi Chhor Divas, Black History Month, and National Indigenous History Month. The Diversity and Inclusion Committee uses Microsoft Teams to share and explore diversity and inclusion events, issues, and successes.
Numerical goals
The OAG strives to meet and exceed 100% representation of workforce availability for each of the designated groups: women, Indigenous persons, persons with disabilities, and persons in a visible minority group.
Employment Equity Representation
The OAG’s employment equity reports are prepared according to the National Occupational Classification (NOC) developed by Employment and Social Development Canada. This classification comprises 14 employment equity occupational groups (EEOGs)—as defined in Schedule II of the Employment Equity Regulations—and 500 NOC unit groups.
A closer look at this system shows that the OAG has a specialized workforce:
- The OAG’s 791 employees fall into 7 of the 14 EEOGs (Exhibit 1).
- Most employees (84.5%) are concentrated in just 2 EEOGs: professionals and middle and other managers (Exhibit 2).
Exhibit 1—Employment equity occupational groups under which OAG employees are classified
1–Senior managers
2–Middle and other managers
3–Professionals
4–Semi-professionals and technicians
5–Supervisors
7–Administrative and senior clerical personnel
10–Clerical personnel
Exhibit 2—Distribution of OAG employees by employment equity occupational group
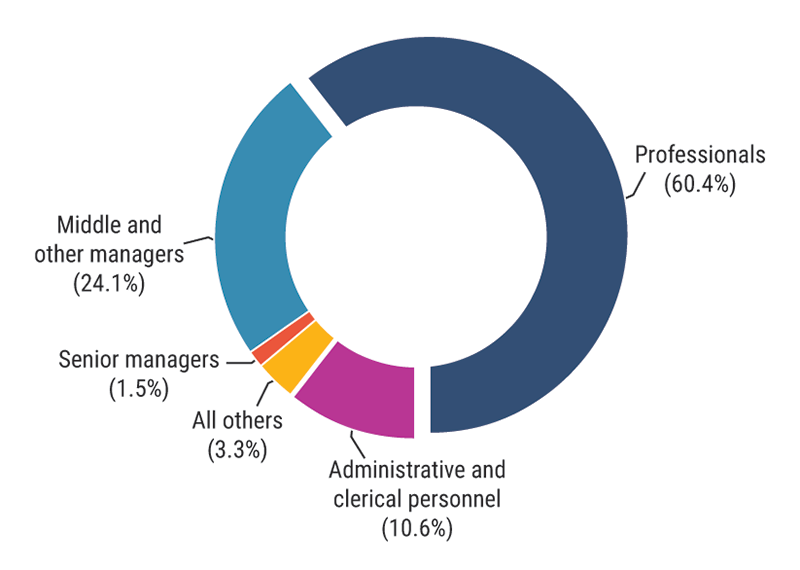
Note: Total may not add up to 100% because of rounding
Exhibit 2—text version
Exhibit 2 is a donut chart showing the distribution of employees in the Office of the Auditor General of Canada, according to employment equity occupational groups.
The chart indicates that 10.6% of the Office’s employees are administrative and clerical personnel and 1.5% of employees are senior managers. Middle and other managers make up 24.1%, and 60.4% are professionals. Another 3.3% of employees fall into the “all others” category.
The majority of the employees—84.5%—are concentrated into two groups, middle and other managers and professionals.
Representation in designated groups—Highlights
The OAG compared its representation in each designated group with the most recent workforce availability figures provided by Employment and Social Development Canada in the department’s 2016 Employment Equity Data Report. The OAG used national figures for this comparison in most areas, except for the administrative and senior clerical personnel and the clerical personnel categories, for which the OAG used data from the National Capital Region.
Exhibit 3 shows the 4 designated groups’ representation in the OAG as a percentage of workforce availability by aggregated occupational group (managerial, professional, and administrative) as at 31 March 2022. The results are as follows:
- Women and persons in a visible minority group are well represented in all 3 aggregated occupational groups. This is the first year that the OAG has achieved over 100.0% representation for persons in a visible minority group in all aggregated occupational groups.
- Increased representation of Indigenous persons in the managerial and professional groups is needed.
- Increased representation of persons with disabilities in all 3 occupational groups is needed.
Exhibit 3—Designated groups’ representation in the Office of the Auditor General of Canada as a percentage of workforce availability by aggregated occupational group as at 31 March 2022
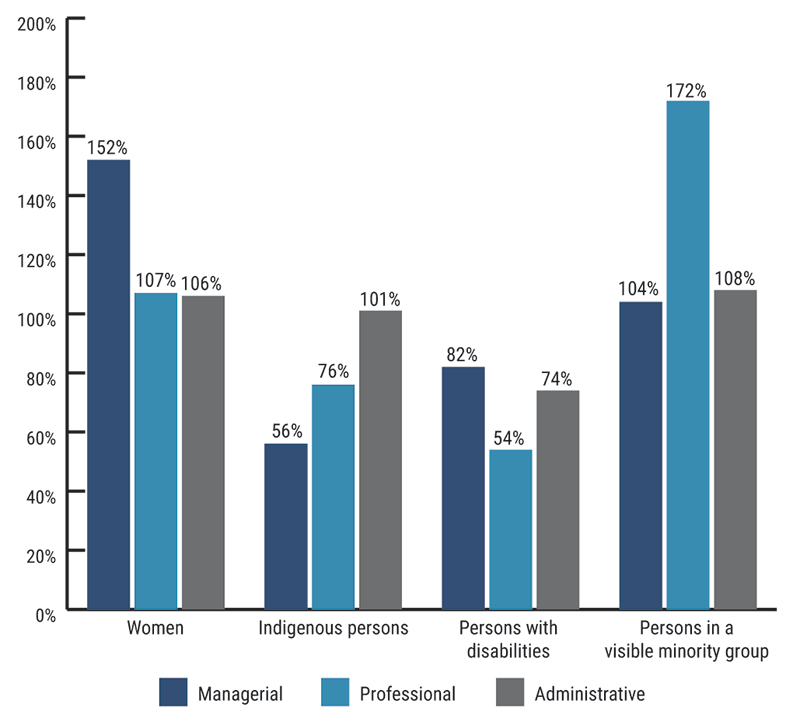
Exhibit 3—text version
| Designated groups in the Office of the Auditor General of Canada | Percentage of workforce availability by aggregated occupational group | ||
|---|---|---|---|
| Managerial | Professional | Administrative | |
| Women | 152 | 107 | 106 |
| Indigenous persons | 56 | 76 | 101 |
| Persons with disabilities | 82 | 54 | 74 |
| Persons in a visible minority group | 104 | 172 | 108 |
Women
As of 31 March 2022, women represented 61.2% (484 employees) of the OAG’s workforce, which surpasses the workforce availability of 52.3 % (414 employees) (Table 4). This percentage has remained stable since the previous report.
Women are well represented in most EEOGs and salary bands (Table 11).
Indigenous persons
Indigenous employees represented 2.5% (20 employees) of the OAG’s workforce, which is lower than the workforce availability of 3.6% (29 employees) (Table 5). This year’s share represents an increase of 1.3 percentage points since the previous report.
Indigenous persons are represented in most salary bands (Table 11).
Persons with disabilities
Persons with disabilities represented 4.9% (39 employees) of the OAG’s workforce, which is lower than the workforce availability of 8.0 % (64 employees) (Table 6). This year’s share represents an increase of 34 percentage points year over year.
Persons with disabilities are slightly underrepresented in the highest salary bands. (Table 11).
Persons in a visible minority group
Persons in a visible minority group represented 28.1% (222 employees) of the OAG's workforce, which surpasses the workforce availability of 17.9% (142 employees) (Table 7). This year’s share represents an increase of 4.7 percentage points year over year.
Persons in a visible minority group are significantly underrepresented in the highest salary bands (Table 11).
Representation in hires, promotions, and separations
This annual report includes an analysis of the number of employees from each designated group who were hired, were promoted, or left the OAG.
Hires
During the 2021–22 fiscal year, 93 people joined the OAG (Table 8). Of these new hires,
- 59 identified themselves as women (63.4%)
- 8 identified themselves as persons with a disability or disabilities (8.6%)
- 36 identified themselves as persons in a visible minority group (38.7%)
The number of people hired who identified themselves as Indigenous persons is too low to be reported while maintaining confidentiality.
Hiring of women and people in a visible minority group has remained high since the previous report. Hiring of persons with disabilities has increased in the 2021–22 fiscal year.
Promotions
During the 2021–22 fiscal year, 74 employees were promoted (Table 9). Of these promotions,
- 60 people were women (81.1%)
- 23 people were in a visible minority group (31.1%)
The number of promotions for Indigenous persons and people with a disability or disabilities is too low to be reported while maintaining confidentiality.
The number of promotions for women has increased since the previous report, while promotions for people in a visible minority group have remained stable.
Separations
During the 2021–22 fiscal year, 68 employees left the OAG (Table 10). Of the employees who left (97.1%),
- 48 people were women (70.6%)
- 18 people were from a visible minority group (26.5%)
The number of separations for Indigenous persons and people with a disability or disabilities is too low to be reported while maintaining confidentiality.
More employees left the OAG in 2021–22 than in the previous fiscal year. The number of separations for women increased, while the number of people in a visible minority group who left the organization decreased slightly.
Key Performance Indicators
As part of the Triennial Employment Equity Plan—2021–2024, 2 specific performance indicators for the 2021–22 fiscal year were identified to help achieve the OAG’s objective of supporting recruitment initiatives that address the under-representation of members and designated groups:
- an increase of 10% representation of employees identifying as Indigenous in 2021–22
- an increase of 10% representation of employees identifying as persons with disabilities in 2021–22
Exhibit 4 shows the OAG’s progress as at 31 March 2022 on these 2 specific key performance indicators. The results are as follows:
- We exceeded our target, with a 34% increase over last year’s reporting numbers of persons with disabilities. The majority of this increase is because of newly hired employees in 2021–22, while the remaining is because of employees updating their questionnaire responses.
- While the target for Indigenous representation was not reached, an increase of 1.3% was achieved.
Exhibit 4—Targets and results for 2 key performance indicators for the 2021–22 fiscal year
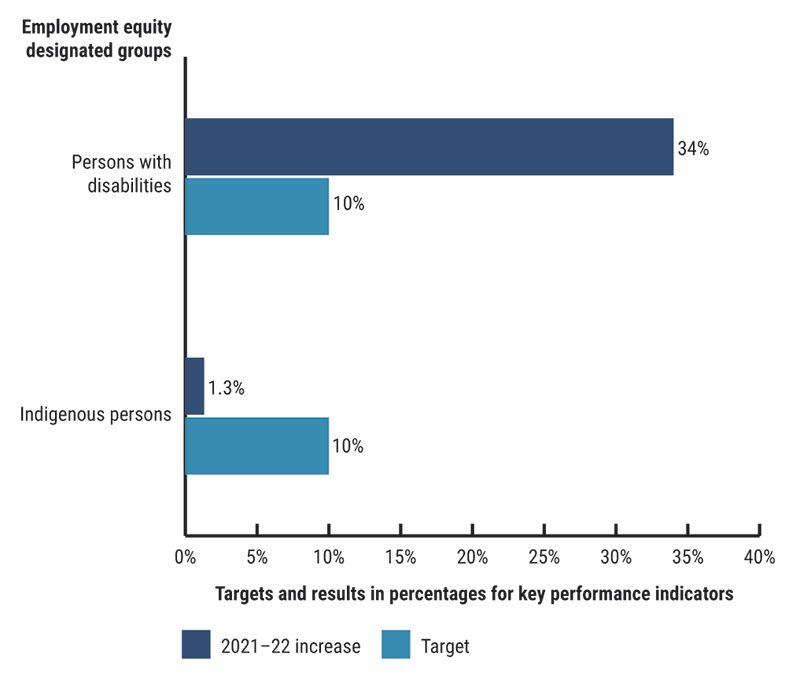
Exhibit 4—text version
| Employment equity designated group | Targets and results in percentages for key performance indicators | |
|---|---|---|
| 2021–22 increase | Target | |
| Persons with disabilities | 34 | 10 |
| Indigenous persons | 1.3 | 10 |
Call to Action on Anti-Racism, Equity, and Inclusion
The OAG has made progress toward advancing anti-racism, equity, and inclusion since the Clerk of the Privy Council released the call to action in November 2021.
The OAG has begun work on the development of an equity, diversity, and inclusion strategy that will include an action plan. This strategy will enable managers and employees to contribute to creating and maintaining a diverse workplace where all employees can feel a sense of belonging.
In addition, the OAG has created a new Equity, Diversity, and Inclusion portfolio to undertake performance audits across the federal government. The first audit from this portfolio, planned to be tabled in spring 2023, will examine an inclusive public service for racialized employees.
Finally, a new team within the OAG was formed to provide technical advice to audit teams on gender-based analysis plus. This team ensures that all performance audit products published by the OAG include a gender-based analysis plus lens. Reporting on these findings and recommendations will assist Parliament in holding government departments to account on their gender-based analysis plus progress, and will provide objective and impartial information to Canadians. The information gathered in these audits, including best practices, will contribute to the development and improvement of OAG policies, programs, practices, and services.
Conclusion
The OAG’s vision is “to bring together people, expertise and technology to transform Canada’s future, one audit at a time.” It is no accident that people are first in our vision statement. People are the key to our success, and we believe that diversity brings a richness and resonance that improves our work and its value to Canadians.
Fostering a diverse and inclusive environment is a priority for the OAG. Therefore, our strategic framework includes 2 specific diversity- and inclusion-focused objectives:
- Prioritize diversity and inclusion in all aspects of the OAG.
- Promote a culture that values people.
Moreover, these objectives are reinforced by specific business outcomes:
- The OAG workforce is inclusive and reflects the diversity of Canada’s population.
- Employees feel welcome and valued while working at the OAG.
The OAG will achieve these outcomes by providing managers and employees with the information, tools, and awareness training they need so that everyone is empowered to contribute to and can feel part of an inclusive work environment and culture.
Attracting, hiring, and retaining a greater diversity of candidates continues to be a challenge for the OAG and is definitely a focus of ours. While women and people in a visible minority group were well represented in our workforce as of 31 March 2022, the representation of Indigenous persons and people with disabilities did not meet the respective workforce availability for these groups.
The OAG is convinced of the importance of continuing the work to increase the representation of designated groups, reducing barriers, identifying opportunities for improvement, and implementing solutions. To address the gaps identified in this report, specific numerical goals have been identified as performance indicators in the OAG’s Strategic Plan 2022–24 and in the Triennial Employment Equity Plan—2021–2024. The OAG will strive to increase the representation and the inclusion of these groups within its workforce through activities identified in its Resourcing Roadmap—2021–24, accessibility projects, and ongoing awareness and learning events and training. In addition, the OAG will be conducting an employment systems review to identify and remove the barriers that have been identified.
Appendix A—Office of the Auditor General of Canada Employment Equity Action Plan: 2021–22 Commitments, Targets, and Results
| Legislative requirements and objectives | Activities | Targets | Results |
|---|---|---|---|
|
1. Collection of workforce information Objective: Maintain accurate data on designated groups to build on successes and identify opportunities for improvement. |
1a. Achieve a 100% completion rate for self-identification forms by closely monitoring the receipt of forms from new and newly promoted employees. |
100% completion rate for all new and newly promoted employees |
Achieved. All indeterminate employees and determinate employees with terms of 6 months or more as of 31 March 2022 completed and signed a self-identification form. |
|
1b. Remind employees that they can self-identify at any time, and that the information they provide will be used in compiling statistics on employment equity. |
1 communication per year |
Achieved. A reminder that employees can self-identify at any time was published in the Microsoft Teams channel of the Office of the Auditor General of Canada (OAG) on 3 November 2021. |
|
|
1c. Update the OAG's self-identification questionnaire on the basis of a new Treasury Board of Canada Secretariat approach. |
3 months after Treasury Board of Canada Secretariat approval |
In-progress. The new questionnaire is planned to be implemented prior to the end of the 2022–23 fiscal year. |
|
|
2. Workforce analysis and establishment of numerical goals Objective: Support recruitment initiatives that address the under- representation of members of designated groups. |
2a. Establish a staffing dashboard and distribute it 3 times per year to monitor progress toward achieving employment equity targets and to influence hiring decisions. |
3 times per year |
Partially achieved. A dashboard that supports timely monitoring of progress toward achieving representation using disaggregated data was created in fall 2021. An additional full-time-equivalent employee in Human Resources has been approved to assist in the development of the strategy, coordinate its implementation, and manage diversity and inclusion programs and activities. |
|
2b. Share with and train hiring managers and members of selection panels on their responsibilities related to employment equity during staffing processes. |
100% completion rate of training for all members of selection panels |
In-progress. Human Resources advisors have begun discussing responsibilities and priorities related to employment equity with hiring managers. Discussions have begun to add formal employment equity training to the mandatory curriculum of hiring managers. Senior management shared a message with hiring managers, regarding the importance of hiring candidates from diverse backgrounds and the expectation to increase representation during hiring and promotions. |
|
|
2c.Review and share demographic information on designated group members when planning all hiring processes. Leverage staffing options to achieve numerical goals, such as restricting the area of selection to designated groups and using non-advertised appointment processes. |
Indigenous employees:
Persons with disabilities:
|
Partially achieved. There was an increase of 1.3% and 34.0% in the representation of Indigenous employees and persons with disabilities respectively in the 2021–22 fiscal year. |
|
|
3. Employment systems review Objective: Review policies, practices, and processes to identify systemic barriers and recommendations to eliminate them. |
3a. Review the OAG's current policies, practices, and processes to identify systemic barriers. |
Ongoing, starting in summer 2022 |
In progress. The Human Resources group and the Procurement and Contracting team are currently managing a high volume of work while dealing with reduced capacity. They are focusing on filling the vacancies and acquiring required resources. The Human Resources group began drafting the statement of work and evaluation criteria for the request for proposal. |
|
4. Employment equity plan— positive practices Objective: Build a workplace that promotes diversity and inclusion. |
4a. Implement an employment equity policy, and ensure that it is reviewed every 5 years so that it is aligned with best practices. Institute positive practices for integrating employment equity into other OAG policies and guidelines. |
Documents reviewed and updated every 5 years |
Ongoing. The OAG is currently reviewing many of its human resources policies with a diversity and inclusion lens. Once the Employment Equity Act has been reviewed, the OAG will assess the need to develop and implement a new employment equity policy. |
|
4b. Identify and build a diverse pool of employees for selection boards and for pools of pre-qualified candidates from the 3 designated groups: persons in a visible minority group, Indigenous persons, or persons with disabilities. |
Creation of pools for the 3 designated groups |
In progress. Selection boards We encourage the creation of diverse selection boards. We have started identifying pools of candidates from various designated groups such as from the Black Employees Network, the Employment Accessibility Resource Network, and the Federal Student Work Experience Program. Candidates are actively encouraged to voluntarily identify as part of a designated group when applying to the OAG. This information can then be shared with selection boards and used in the boards' decision-making processes. The implementation of the new self-identification form will help achieve this goal. Pools of pre-qualified candidates Job advertisements encourage candidates to self-identify as members of one or more employment equity group when applying to the OAG. Consent is also obtained to ensure the employment equity information of candidates who meet the essential qualifications can be shared with selection boards and considered during the right-fit justification. |
|
|
4c. Ensure that more than 50% of selection boards include at least 1 member of one of the following 3 designated groups: persons in a visible minority group, Indigenous persons, or persons with disabilities. |
50% of selection boards on an on-going basis |
In progress. Although we encourage the creation of diverse selection boards, results were not tracked in 2021–22 fiscal year. Results will be tracked in the next fiscal year. |
|
|
4d. Analyze and evaluate the requirement for hiring managers and members of selection panels to follow unconscious-bias training before participating in a selection panel. |
Pilot: 2021–22 |
In progress. After analysis, hiring managers, members of selection panels, and employees were prompted to follow unconscious-bias training. Training related to unconscious bias was introduced in the 2021–22 curriculum not only for hiring managers and members of selection committees but also for employees at all levels. |
|
|
4e. Implement an exit survey for all employee groups with an offer of one-on-one interviews to gather data on the reasons employees leave the organization. Produce a report, analyze the data to determine whether barriers exist for members of designated groups, consult with key stakeholders to address issues, and communicate the action plan to appropriate audiences. |
Exit survey sent to 100% of departing employees and completion of an annual report. |
In progress. Exit interviews are currently being offered by our Ombuds. A report highlighting the key messages for the 2021–22 fiscal year has been drafted and will be presented to the People Management Committee in 2022–23. The use of an electronic exit survey is currently being explored. |
|
|
4f. Proactively identify current topics on employment equity, and promote related courses available at the OAG or through the Canada School of Public Service by sending quarterly communications (at a minimum). |
Quarterly |
Ongoing. Diversity and inclusion training has been incorporated as part of our 2021–22 curriculum. We went beyond quarterly communications, by making this training part of all employees' recommended curriculum. |
|
|
4g. Organize and support a minimum of 3 employment equity awareness activities and events per year. |
3 employment equity-related activities or events per fiscal year |
Achieved. 6 employment equity-related activities or events were held in the 2021–22 fiscal year. |
|
|
4j. Implement accessible software solutions and inclusive design (for Internet, INTRAnet, and desktop publishing). |
Ongoing starting in 2021–22 |
Ongoing. An accessibility framework for digital products was finalized in late 2020–21. An action plan was created in 2021–22 to support the implementation of the framework. Work has started to complete the action items in the plan. Accessibility is now being considered in the processes of procuring and configuring new software solutions and in the implementation of major enhancements to existing software. |
|
|
4k. Review, improve, and proactively add assistive technology and equipment to the OAG standard equipment kit. |
Ongoing starting in 2021–22 |
Ongoing. The OAG implemented the closed captioning functionality in Microsoft Teams as part of offering assistive technology. The OAG started to use Interprefy to provide high-quality simultaneous interpretation services. This solution has proven reliable and easy to use while sacrificing nothing in terms of quality and accessibility. In early 2021, the Facilities group worked with the Procurement group to put in place proper procurement vehicles so that sit-stand desks and chairs are standard equipment and anyone can request this equipment (without requiring a medical note). |
|
|
5. Monitoring of progress and review and revision of the plan Objective: Proactively identify gaps and resolve them on an ongoing basis. |
5a. Provide updates to the Principal, Human Resources, on the status of the activities, and identify changes required to achieve objectives. |
Reviews conducted twice a year and included as part of the annual employment equity report |
Achieved. The Triennial Employment Equity Plan—2021–2024 was finalized and presented to the Executive Committee in fall 2021. An update was provided as part of the annual employment equity report. The OAG developed a new governance structure over the last year. Semi-annual updates will be presented to the new People Management Committee. |
|
5b. Review opportunities for improving this plan as part of the annual reporting process to ensure ongoing progress. Analyze data and consult with key stakeholders, and adjust the plan to address new areas for improvement or risks identified. Obtain approval from the Principal, Human Resources, and communicate any changes to the plan to employees. |
Annually |
Not applicable. Since the new plan was implemented in fall 2021, the review is required for the 2022–23 fiscal year. |
|
|
6. Communication with employees Objective: Consistently promote employment equity to employees. |
6a. Develop an integrated communication plan that allows the OAG to highlight employment equity through the Our Diverse and Inclusive Workplace INTRAnet page and other communication mediums, including Microsoft Teams. |
100% of activities and events communicated to employees |
Achieved. All the activities and events organized by the Diversity and Inclusion Committee were communicated to employees in the 2021–22 fiscal year. |
|
6b. Identify special topics for discussion related to employment equity, and determine the best communication medium for these messages. |
Special topics included in communication plan (6a) |
Achieved. |
|
|
7. Consultation and collaboration with employee representatives Objective: Understand the needs and issues that affect designated group members by engaging in meaningful consultation. |
7a. Consult with OAG employees and the union on the development of the employment equity plan and any subsequent changes. |
OAG employees and union consulted on the development of the employment equity plan every 3 years, with subsequent revisions made when appropriate |
Achieved. |
|
8. Maintenance of records Objective: Maintain the confidentiality of sensitive employee data with the goal of building and maintaining trust. |
8a. Ensure that records are confidentially maintained by restricting access to employment equity data in the information system. |
100% of requests for access to employment equity data in the system approved by Human Resources Director |
Achieved. Two requests for additional access were submitted in 2021–22. The access aligned with our access procedures and the principles of need-to-know and segregation of duties. |
Appendix B—Statistics
Report coverage
This report contains information as of 31 March 2022 on the Office of the Auditor General of Canada’s (OAG’s) indeterminate employees and determinate employees with terms of 6 months or more. Employees who were on secondment to other organizations are also included in the OAG’s numbers.
No information is reported in the tables on students or casual workers.
Data on people in the designated groups
All data was obtained through voluntary self-identification.
The completeness and accuracy of employment equity data depend on employee willingness to self-identify and being given the opportunity to do so.
The OAG’s voluntary self-identification process began in April 1997. All employees are asked to complete a questionnaire before their first day at the OAG and upon promotion. In addition, at any time during the year, all employees can resubmit a self-identification questionnaire, available on the OAG’s Human Resources INTRAnet page.
Tables 4 to 7 show the OAG’s representation as a percentage of workforce availability, with comparative figures for the previous year. The OAG believes that this is the best way to measure the current state of representation for each designated group.
The OAG provides information by employment equity occupational group (EEOG). Tables 4 to 7 include information for the 3 National Occupational Classification (NOC) unit groups that account for the majority of employees—audit managers (NOC unit group 0414), financial auditors (NOC unit group 1111), and performance auditors (NOC unit group 4169).
Workforce availability
Workforce availability is the distribution of people in the designated groups as a percentage of the total Canadian workforce. For federal public service purposes, workforce availability is based on Canadian citizens in occupations in the Canadian workforce that correspond to the occupations in the public service and is derived from 2016 Census data.
List of Tables
Table 1—Representation of designated groups in the Office of the Auditor General of Canada
Table 2—Distribution of employees by designated group and region of work
Table 3—Representation of designated groups by Employment Equity Occupational Group
Table 8—Hiring by designated group and Employment Equity Occupational Group
Table 9—Promotions by designated group and Employment Equity Occupational Group
Table 10—Separations by designated group and Employment Equity Occupational Group
Table 11—Distribution of employees by designated group and salary band
Table 1—Representation of designated groups in the Office of the Auditor General of Canada
As at 31 March 2022
| Office | Number | Percentage of population | Workforce availability |
|---|---|---|---|
| All employees | 791 | ||
| Women | 484 | 61.2 | 52.3 |
| Indigenous persons | 20 | 2.5 | 3.6 |
| Persons with disabilities | 39 | 28.1 | 17.9 |
| Persons in a visible minority group | 222 | 4.9 | 8.0 |
Totals may not equal the sum of components because of rounding and suppression.
Table 2—Distribution of employees by designated group and region of work
As at 31 March 2022
| Region of work | All employees | Women | Indigenous persons | Persons with disabilities | Persons in a visible minority group |
||||
|---|---|---|---|---|---|---|---|---|---|
| Number | Number | Percentage | Number | Percentage | Number | Percentage | Number | Percentage | |
| Alberta | 19 | 12 | 63.2 | Footnote * | – | Footnote * | – | 8 | 42.1 |
| British Columbia | 18 | 11 | 61.1 | Footnote * | – | Footnote * | – | 11 | 61.1 |
| Quebec | 34 | 23 | 67.6 | Footnote * | – | Footnote * | – | 16 | 47.1 |
| Nova Scotia | 13 | 7 | 53.8 | Footnote * | – | * | – | * | – |
| Ontario | 707 | 431 | 61.0 | 18 | 2.5 | 34 | 4.8 | 186 | 26.3 |
| Total | 791 | 484 | 61.2 | 20 | 2.5 | 39 | 4.9 | 222 | 28.1 |
Totals may not equal the sum of components because of rounding and suppression.
Table 3—Representation of designated groups by Employment Equity Occupational Group
As at 31 March 2022
| Employment Equity Occupational Group | All employees | Women | Indigenous persons | Persons with disabilities | Persons in a visible minority group |
||||
|---|---|---|---|---|---|---|---|---|---|
| Number | Number | Percentage | Number | Percentage | Number | Percentage | Number | Percentage | |
| All occupations | 791 | 484 | 61.2 | 20 | 2.5 | 39 | 4.9 | 222 | 28.1 |
|
Senior managers
|
12 | 7 | 58.3 | Footnote * | – | Footnote * | – | Footnote * | – |
|
Middle and other managers
|
191 | 128 | 67.0 | 6 | 3.1 | 9 | 4.7 | 19 | 9.9 |
|
Professionals
|
478 | 274 | 57.3 | 10 | 2.1 | 24 | 5.0 | 180 | 37.7 |
|
Semi-professionals and technicians
|
23 | 10 | 43.5 | Footnote * | – | Footnote * | – | 8 | 34.8 |
|
Supervisors
|
3 | Footnote * | – | Footnote * | – | Footnote * | – | Footnote * | – |
|
Administrative and senior clerical personnel
|
44 | 40 | 90.9 | Footnote * | – | Footnote * | – | 6 | 13.6 |
|
Clerical personnel
|
40 | 24 | 60.0 | Footnote * | – | Footnote * | – | 7 | 17.5 |
Totals may not equal the sum of components because of rounding and suppression.
Table 4—Representation of women by Employment Equity Occupational Group and the 3 largest National Occupational Classification unit groups
As at 31 March 2022
| Employment Equity Occupational Group | All employees | Women | Workforce availability | Representation as a percentage of workforce availability |
||
|---|---|---|---|---|---|---|
| Number | Number | Percentage | Percentage | March 2022 | March 2021 | |
| All occupations | 791 | 484 | 61.2 | 52.3 | 100.0+ | 100.0+ |
|
Senior managers
|
12 | 7 | 58.3 | 46.0 | 100.0+ | 100.0+ |
|
Middle and other managers
|
191 | 128 | 67.0 | 43.2 | 100.0+ | 100.0+ |
|
Professionals
|
478 | 274 | 57.3 | 53.7 | 100.0+ | 100.0+ |
|
Semi-professionals and technicians
|
23 | 10 | 43.5 | 33.0 | 100.0+ | 100.0+ |
|
Supervisors
|
3 | Footnote * | – | 52.1 | – | – |
|
Administrative and senior clerical personnel
|
44 | 40 | 90.9 | 76.9 | 100.0+ | 100.0+ |
|
Clerical personnel
|
40 | 24 | 60.0 | 65.9 | 91.1 | 87.4 |
| National Occupational Classification unit group | All employees | Women | Workforce availability | Representation as a percentage of workforce availability |
||
|---|---|---|---|---|---|---|
| Number | Number | Percentage | Percentage | March 2022 | March 2021 | |
| Audit Managers (0414) | 129 | 90 | 69.8 | 40.5 | 100.0+ | 100.0+ |
| Financial Auditors (1111) | 243 | 133 | 54.7 | 55.5 | 98.5 | 98.6 |
| Performance Auditors (4169) | 133 | 77 | 57.9 | 58.8 | 98.4 | 99.0 |
Totals may not equal the sum of components because of rounding and suppression.
Table 5—Representation of Indigenous persons by Employment Equity Occupational Group and the 3 largest National Occupational Classification unit groups
As at 31 March 2022
| Employment Equity Occupational Group | All employees | Indigenous persons | Workforce availability | Representation as a percentage of workforce availability |
||
|---|---|---|---|---|---|---|
| Number | Number | Percentage | Percentage | March 2022 | March 2021 | |
| All occupations | 791 | 20 | 2.5 | 3.6 | 70.9 | 75.0 |
|
Senior managers
|
12 | Footnote * | – | 7.1 | – | – |
|
Middle and other managers
|
191 | 6 | 3.1 | 5.1 | 61.5 | 53.4 |
|
Professionals
|
478 | 10 | 2.1 | 2.9 | 71.8 | 80.1 |
|
Semi-professionals and technicians
|
23 | Footnote * | – | 2.6 | – | – |
|
Supervisors
|
3 | Footnote * | – | 3.3 | – | – |
|
Administrative and senior clerical personnel
|
44 | Footnote * | – | 3.5 | – | – |
|
Clerical personnel
|
40 | Footnote * | – | 3.6 | – | – |
| National Occupational Classification unit group | All employees | Indigenous persons | Workforce availability | Representation as a percentage of workforce availability |
||
|---|---|---|---|---|---|---|
| Number | Number | Percentage | Percentage | March 2022 | March 2021 | |
| Audit Managers (0414) | 129 | Footnote * | – | 6.3 | – | – |
| Financial Auditors (1111) | 243 | Footnote * | – | 1.5 | – | – |
| Performance Auditors (4169) | 133 | Footnote * | – | 6.4 | – | – |
Totals may not equal the sum of components because of rounding and suppression.
Table 6—Representation of persons with disabilities by Employment Equity Occupational Group and the 3 largest National Occupational Classification unit groups
As at 31 March 2022
| Employment Equity Occupational Group | All employees | Persons with disabilities | Workforce availability | Representation as a percentage of workforce availability |
||
|---|---|---|---|---|---|---|
| Number | Number | Percentage | Percentage | March 2022 | March 2021 | |
| All occupations | 791 | 39 | 4.9 | 8.0 | 61.4 | 44.8 |
|
Senior managers
|
12 | Footnote * | – | 5.0 | – | – |
|
Middle and other managers
|
191 | 9 | 4.7 | 5.0 | 94.6 | 58.7 |
|
Professionals
|
478 | 24 | 5.0 | 8.9 | 56.1 | 39.0 |
|
Semi-professionals and technicians
|
23 | Footnote * | – | 7.6 | – | – |
|
Supervisors
|
3 | Footnote * | – | 27.5 | – | – |
|
Administrative and senior clerical personnel
|
44 | Footnote * | – | 10.0 | – | – |
|
Clerical personnel
|
40 | Footnote * | – | 9.3 | – | – |
| National Occupational Classification unit group | All employees | Persons with disabilities | Workforce availability | Representation as a percentage of workforce availability |
||
|---|---|---|---|---|---|---|
| Number | Number | Percentage | Percentage | March 2022 | March 2021 | |
| Audit Managers (0414) | 129 | 6 | 4.7 | 5.0 | 93.4 | 49.4 |
| Financial Auditors (1111) | 243 | 13 | 5.3 | 8.9 | 59.8 | 43.7 |
| Performance Auditors (4169) | 133 | 7 | 5.3 | 8.9 | 58.8 | 33.4 |
Workforce availability is not available based on National Occupational Classification unit group, so the workforce availability percentage is based on the Employment Equity Occupation Group.
Totals may not equal the sum of components because of rounding and suppression.
Table 7—Representation of persons in a visible minority group by Employment Equity Occupational Group and the 3 largest National Occupational Classification unit groups
As at 31 March 2022
| Employment Equity Occupational Group | All employees | Persons in a visible minority group | Workforce availability | Representation as a percentage of workforce availability |
||
|---|---|---|---|---|---|---|
| Number | Number | Percentage | Percentage | March 2022 | March 2021 | |
| All occupations | 791 | 222 | 28.1 | 17.9 | 100.0+ | 100.0+ |
|
Senior managers
|
12 | Footnote * | – | 6.4 | – | – |
|
Middle and other managers
|
191 | 19 | 9.9 | 10.0 | 99.2 | 100.0+ |
|
Professionals
|
478 | 180 | 37.7 | 21.8 | 100.0+ | 100.0+ |
|
Semi-professionals and technicians
|
23 | 8 | 34.8 | 21.6 | 100.0+ | 100.0+ |
|
Supervisors
|
3 | Footnote * | – | 13.0 | – | – |
|
Administrative and senior clerical personnel
|
44 | 6 | 13.6 | 12.8 | 100.0+ | 85.3 |
|
Clerical personnel
|
40 | 7 | 17.5 | 15.9 | 100.0+ | 100.0+ |
| National Occupational Classification unit group | All employees | Persons in a visible minority group | Workforce availability | Representation as a percentage of workforce availability |
||
|---|---|---|---|---|---|---|
| Number | Number | Percentage | Percentage | March 2022 | March 2021 | |
| Audit Managers (0414) | 129 | 10 | 7.8 | 6.8 | 100.0+ | 100.0+ |
| Financial Auditors (1111) | 243 | 114 | 46.9 | 29.0 | 100.0+ | 100.0+ |
| Performance Auditors (4169) | 133 | 48 | 36.1 | 9.9 | 100.0+ | 100.0+ |
Totals may not equal the sum of components because of rounding and suppression.
Table 8—Hiring by designated group and Employment Equity Occupational Group
As at 31 March 2022
| Employment Equity Occupational Group | All employees | Women | Indigenous persons | Persons with disabilities | Persons in a visible minority group |
||||
|---|---|---|---|---|---|---|---|---|---|
| Number | Number | Percentage | Number | Percentage | Number | Percentage | Number | Percentage | |
| All occupations | 93 | 59 | 63.4 | Footnote * | – | 8 | 8.6 | 36 | 38.7 |
|
Senior managers
|
1 | Footnote * | – | Footnote * | – | Footnote * | – | Footnote * | – |
|
Middle and other managers
|
22 | 16 | 72.7 | Footnote * | – | Footnote * | – | Footnote * | – |
|
Professionals
|
50 | 29 | 58.0 | Footnote * | – | 7 | 14.0 | 25 | 50.0 |
|
Semi-professionals and technicians
|
4 | Footnote * | – | Footnote * | – | Footnote * | – | Footnote * | – |
|
Supervisors
|
0 | Footnote * | – | Footnote * | – | Footnote * | – | Footnote * | – |
|
Administrative and senior clerical personnel
|
9 | 7 | 77.8 | Footnote * | – | Footnote * | – | Footnote * | – |
|
Clerical personnel
|
7 | Footnote * | – | Footnote * | – | Footnote * | – | Footnote * | – |
| Hiring as a percentage of workforce availability | All employees | Women | Indigenous persons | Persons with disabilities | Persons in a visible minority group |
||||
|---|---|---|---|---|---|---|---|---|---|
| Number | Number | Percentage | Number | Percentage | Number | Percentage | Number | Percentage | |
| All occupations | 93 | 59 | 63.4 | Footnote * | – | 8 | 8.6 | 36 | 38.7 |
| Workforce availability | 52.3 | 3.6 | 8.0 | 17.9 | |||||
| Hiring as a percentage of workforce availability | 100.0+ | – | 100.0+ | 100.0+ | |||||
Totals may not equal the sum of components because of rounding and suppression.
Table 9—Promotions by designated group and Employment Equity Occupational Group
(includes all promotions since the beginning of the chosen fiscal year, including those who have since left)
As at 31 March 2022
| Employment Equity Occupational Group | All employees | Women | Indigenous persons | Persons with disabilities | Persons in a visible minority group |
||||
|---|---|---|---|---|---|---|---|---|---|
| Number | Number | Percentage | Number | Percentage | Number | Percentage | Number | Percentage | |
| All occupations | 74 | 60 | 81.1 | Footnote * | – | Footnote * | – | 23 | 31.1 |
|
Senior managers
|
1 | Footnote * | – | Footnote * | – | Footnote * | – | Footnote * | – |
|
Middle and other managers
|
11 | 10 | 90.9 | Footnote * | – | Footnote * | – | Footnote * | – |
|
Professionals
|
56 | 43 | 76.8 | Footnote * | – | Footnote * | – | 22 | 39.3 |
|
Semi-professionals and technicians
|
0 | Footnote * | – | Footnote * | – | Footnote * | – | Footnote * | – |
|
Supervisors
|
0 | Footnote * | – | Footnote * | – | Footnote * | – | Footnote * | – |
|
Administrative and senior clerical personnel
|
5 | Footnote * | – | Footnote * | – | Footnote * | – | Footnote * | – |
|
Clerical personnel
|
1 | Footnote * | – | Footnote * | – | Footnote * | – | Footnote * | – |
| Promotion rate | Women | Indigenous persons | Persons in a visible minority group |
Persons with disabilities | |||||
|---|---|---|---|---|---|---|---|---|---|
| Number | Number | Percentage | Number | Percentage | Number | Percentage | Number | Percentage | |
| Total number of employees as at 31 March 2021 | 761 | 467 | 19 | 204 | 28 | ||||
| Number and percentage | 74 | 60 | 81.1 | Footnote * | – | 23 | 31.1 | Footnote * | – |
Data includes promotions and reclassifications.
Totals may not equal the sum of components because of rounding and suppression.
Table 10—Separations by designated group and Employment Equity Occupational Group
As at 31 March 2022
| Employment Equity Occupational Group | All employees | Women | Indigenous persons | Persons with disabilities | Persons in a visible minority group | ||||
|---|---|---|---|---|---|---|---|---|---|
| Number | Number | Percentage | Number | Percentage | Number | Percentage | Number | Percentage | |
| All occupations | 68 | 48 | 70.6 | Footnote * | – | Footnote * | – | 18 | 26.5 |
|
Senior managers
|
4 | Footnote * | – | Footnote * | – | Footnote * | – | Footnote * | – |
|
Middle and other managers
|
10 | 6 | 60.0 | Footnote * | – | Footnote * | – | Footnote * | – |
|
Professionals
|
33 | 22 | 66.7 | Footnote * | – | Footnote * | – | 12 | 36.4 |
|
Semi-professionals and technicians
|
2 | Footnote * | – | Footnote * | – | Footnote * | – | Footnote * | – |
|
Supervisors
|
3 | Footnote * | – | Footnote * | – | Footnote * | – | Footnote * | – |
|
Administrative and senior clerical personnel
|
12 | 11 | 91.7 | Footnote * | – | Footnote * | – | Footnote * | – |
|
Clerical personnel
|
4 | Footnote * | – | Footnote * | – | Footnote * | – | Footnote * | – |
| Attrition rate | All employees | Women | Indigenous persons | Persons with disabilities | Persons in a visible minority group | |||||
|---|---|---|---|---|---|---|---|---|---|---|
| Number | Percentage | Number | Percentage | Number | Percentage | Number | Percentage | Number | Percentage | |
| Total number of employees as at 31 March 2021 | 761 | 467 | 19 | 28 | 204 | |||||
| Number and percentage | 68 | 8.9 | 48 | 70.6 | Footnote * | – | Footnote * | – | 18 | 26.5 |
Totals may not equal the sum of components because of rounding and suppression.
Table 11—Distribution of employees by designated group and salary band
As at 31 March 2022
| Salary band ($) | All employees | Women | Indigenous persons | Persons with disabilities | Persons in a visible minority group |
|||||||||
|---|---|---|---|---|---|---|---|---|---|---|---|---|---|---|
| Number | Percentage of all employees | Number | Percentage of salary band | Percentage of designated group | Number | Percentage of salary band | Percentage of designated group | Number | Percentage of salary band | Percentage of designated group | Number | Percentage of salary band | Percentage of designated group | |
| 45,000 to 49,999 | 3 | 0.4 | Footnote * | – | – | Footnote * | – | – | Footnote * | – | – | Footnote * | – | – |
| 50,000 to 54,999 | 7 | 0.9 | Footnote * | – | – | Footnote * | – | – | Footnote * | – | – | Footnote * | – | – |
| 55,000 to 59,999 | 26 | 3.3 | 18 | 69.2 | 3.7 | Footnote * | – | – | Footnote * | – | – | 7 | 26.9 | 3.2 |
| 60,000 to 64,999 | 31 | 3.9 | 22 | 71.0 | 4.5 | Footnote * | – | – | Footnote * | – | – | 13 | 41.9 | 5.9 |
| 65,000 to 69,999 | 46 | 5.8 | 32 | 69.9 | 6.6 | Footnote * | – | – | Footnote * | – | – | 15 | 32.6 | 6.8 |
| 70,000 to 74,999 | 46 | 5.8 | 28 | 60.9 | 5.8 | Footnote * | – | – | Footnote * | – | – | 13 | 28.3 | 5.9 |
| 75,000 to 79,999 | 46 | 5.8 | 34 | 73.9 | 7.0 | Footnote * | – | – | Footnote * | – | – | 9 | 19.6 | 4.1 |
| 80,000 to 89,999 | 94 | 11.9 | 60 | 63.8 | 12.4 | Footnote * | – | – | Footnote * | – | – | 38 | 40.4 | 17.1 |
| 90,000 to 99,999 | 95 | 12.0 | 46 | 48.4 | 9.5 | Footnote * | – | – | 6 | 6.3 | 15.4 | 34 | 35.8 | 15.3 |
| 100,000 to 109,999 | 104 | 13.1 | 54 | 51.9 | 11.2 | Footnote * | – | – | Footnote * | – | – | 40 | 38.5 | 18.0 |
| 110,000 to 119,999 | 36 | 4.6 | 18 | 50.0 | 3.7 | Footnote * | – | – | Footnote * | – | – | 15 | 41.7 | 6.8 |
| 120,000 to 129,1000 | 82 | 10.4 | 48 | 58.5 | 9.9 | Footnote * | – | – | Footnote * | – | – | 21 | 25.6 | 9.5 |
| 130,000 to 139,1000 | 23 | 2.9 | 15 | 65.2 | 3.1 | Footnote * | – | – | Footnote * | – | – | Footnote * | – | – |
| 140,000 to 149,1001 | 7 | 0.9 | Footnote * | – | – | Footnote * | – | – | Footnote * | – | – | Footnote * | – | – |
| 150,000+ | 145 | 18.3 | 98 | 67.6 | 20.2 | Footnote * | – | – | 7 | 4.8 | 17.9 | 9 | 6.2 | 4.1 |
| Total | 791 | 100.0 | 484 | 61.2 | 100.0 | 20 | 2.5 | 100.0 | 39 | 4.9 | 100.0 | 222 | 28.1 | 100.0 |
Totals may not equal the sum of components because of rounding and suppression.