
Recipient Survey Results (2021-2022) – Recovery and Reopening Funds for Arts, Culture, Heritage and Sport Sectors
This survey was conducted by Canadian Heritage, in collaboration with the Canada Council for the Arts, Telefilm Canada, the Canada Media Fund, Canadian Association of Broadcasters and the Community Radio Fund of Canada to help determine whether the Recovery Fund for Arts, Culture, Heritage and Sport Sectors and the Reopening Fund achieved their main objectives in:
- providing additional relief to arts, culture, heritage and sport organizations that are still struggling with operational viability due to the pandemic;
- helping organizations build organizational resilience and pursue business innovation and transformation, including contributing to advancing equity, diversity and inclusion, and environmental sustainability activities;
- supporting organizations and projects that deliver in-person experiences and events that draw visitors to our communities.
The design of the Recovery and Reopening Funds (RRF) recipient survey was based on the Emergency Support Fund (ESF) recipient survey conducted between September 2020 and April 2021. The RRF recipient survey will be administered in two waves:
- Wave 1: Organizations who received funds in 2021-22;
- Wave 2: Organizations who received funds in 2022-23.
The first wave of the survey was sent to 5,024 RRF recipients between August 2022 and September 2022, and used mixed methods to gather quantitative and qualitative information. The key findings from the survey are presented below.
On this page
- With a 62% response rate, the survey had 3,095 responses from recipients across multiple sectors
- Impacts of the RRF on business continuity, jobs and organizations
- How organizations recovered from pandemic’s impacts - Organizational health
- How organizations adapted, and complementary supports
- Recipient satisfaction with the RRF delivery process
- Impacts of the RRF on the sector overall
- Impacts of the RRF on Indigenous peoples and equity-deserving communities
- Organizational strategies in place to support Inclusion, Diversity, Equity, and Accessibility (IDEA), Reconciliation with Indigenous Peoples, and Environmental Sustainability
- Future directions
- Conclusion
With a 62% response rate, the survey had 3,095 responses from recipients across multiple sectors

Description of the infographic: RRF Survey Responses
A pie chart containing the sentence “Wave one of the R&R recipient survey was completed by 3,095 recipient organizations” surrounded by four snapshots of the four sectors the funding supported, with a breakdown of involved programs in each sector and the total number of responses from that sector.
| Sector and respondents | Programs included |
|---|---|
| Heritage and Communities – 1,157 respondents |
|
| Sport – 51 respondents |
|
| Arts – 892 respondents |
|
| Cultural Industries and Trade – 995 respondents |
|
Impacts of the RRF on organizations
Responses show that the RRF met their intended objectives
- 96% of respondents reported that the Recovery Fund (Volet 1) was successful in helping the organization stay in operation.
- 91% of respondents reported that the Recovery Fund (Volet 2) was successful in helping organizations advance one or more of the following objectives:
- Build organizational resilience;
- Pursue business innovation and/or transformation;
- Advance equity, diversity, accessibility and inclusion;
- Advance environmental sustainability.
- 95% of respondents reported that the Reopening Fund was successful in helping organizations reopen or remain open (reconnect people with in-person attendance, live-events and in-person experiences).
- Funds mainly supported operating costs, business model changes, in-person programming and marketing/outreach.
Chart: Ways in which the Fund helped respondents

Description of the infographic: Ways in which the Fund helped respondents
List showing the following results:
Recovery I
- To pay for operating costs other than labour costs - 68%
- To pay the wages of employees in the organization - 49%
- To pay self-employed workers/freelancers - 38%
- To adapt business model - 32%
- To implement new required public health safety measures - 24%
- To pay for increased travel costs - 12%
- Partnership initiatives (business improvement, revenue diversification) - 11%
- Other - 9%
- To complete a planned infrastructure project - 7%
Recovery II
- Adapt/strengthen business model - 61%
- Implement marketing and/or outreach activities - 47%
- Create employment opportunities - 38%
- Undertake strategic planning activities 36%
- Advance equity, diversity, accessibility, and inclusion efforts - 18%
- Address public health safety measures - 17%
- Supports exports-related activities (incl. training) - 14%
- Cover increased travel costs - 14%
- Other - 11%
- Advance environmental sustainability efforts - 7%
Reopening
- Support operating costs - 79%
- Deliver programing in-person - 65%
- Implement marketing and/or outreach activities - 50%
- Address public health safety measures - 35%
- Create new employment opportunities - 26%
- Advance equity, diversity, accessibility, and inclusion efforts - 26%
- Other - 6%
Reopening Fund helped attract local community members to events
86% of Reopening Fund respondents reported that funding helped them attract local tourists/visitors to a large or moderate extent.
Chart: Extent to which the Reopening Fund helped respondents attracts visitors
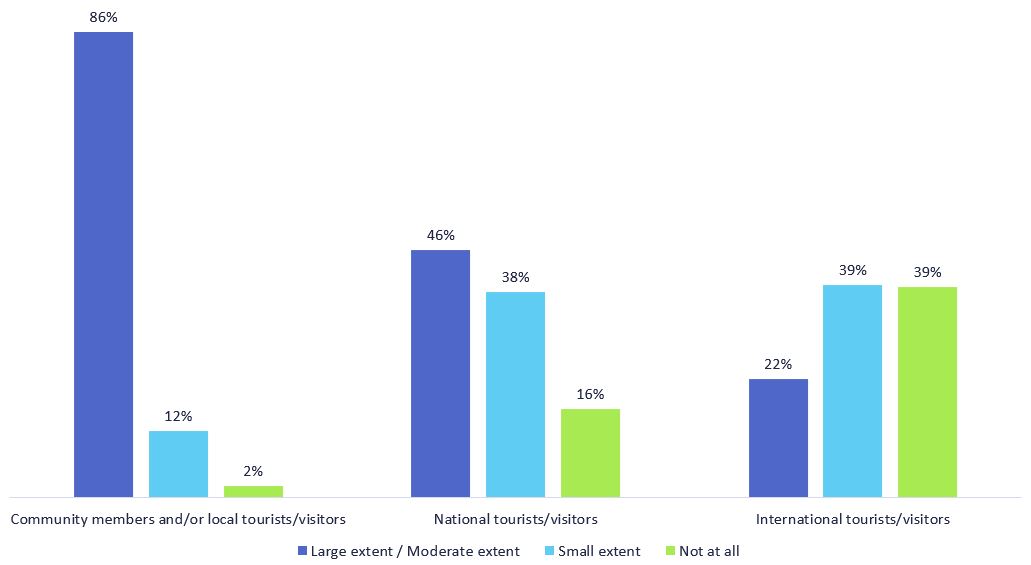
Description of the infographic: Extent to which Reopening Fund helped respondents attract visitors
| Visitors | Extent | Percentage |
|---|---|---|
| Community members and/or local tourists/visitors | Large extent / Moderate extent | 86% |
| Small extent | 12% | |
| Not at all | 2% | |
| National tourists/visitors | Large extent / Moderate extent | 46% |
| Small extent | 38% | |
| Not at all | 16% | |
| International tourists/visitors | Large extent / Moderate extent | 22% |
| Small extent | 39% | |
| Not at all | 39% |
How organizations recovered from the pandemic’s impacts - Organizational health
Most organizations have largely or moderately recovered from the pandemic’s impacts…

Description of the infographic: Extent to which respondents have recovered from the pandemic’s impacts
| Extent | Percentage of respondents |
|---|---|
| Large or moderate extent | 76% |
| Small extent | 20% |
| Not at all | 4% |
Definitions:
- Large or moderate extent: Employment and/or revenue have improved from their lowest point in 2020 to within 50% or greater of pre-pandemic levels.
- Small extent: Employment and/or revenue have improved from their lowest point in 2020 but are less than 50% of their pre-pandemic levels.
- Not at all: Employment and/or revenue have not improved from their lowest point in 2020 or have continued to decline.
…but new challenges are emerging
Qualitative responses from the survey highlight that supply chain issues, record levels of inflation, labour shortages, and anxiety with respect to large or in-person activities have challenged and will likely continue to challenge the sector's post-pandemic recovery. In addition, respondents’ organizations are facing workforce-related challenges as a result of the pandemic. Approximately half of respondents indicated that 50% of their workforce or more has been impacted by burnout and mental health challenges.
Chart: Extent to which respondents faced the following workforce challenges as a result of the pandemic

Description of the infographic: Extent to which respondents faced the following workforce challenges as a result of the pandemic
| Workforce challenges | Extent | Percentage |
|---|---|---|
| Employee retention | 75% or more of workforce impacted | 17% |
| 50% to 74% of workforce impacted | 18% | |
| 25% to 49% of workforce impacted | 19% | |
| Less than 25% of workforce impacted | 22% | |
| None of workforce impacted | 24% | |
| Burnout | 75% or more of workforce impacted | 29% |
| 50% to 74% of workforce impacted | 21% | |
| 25% to 49% of workforce impacted | 17% | |
| Less than 25% of workforce impacted | 19% | |
| None of workforce impacted | 14% | |
| Mental Health | 75% or more of workforce impacted | 28% |
| 50% to 74% of workforce impacted | 19% | |
| 25% to 49% of workforce impacted | 19% | |
| Less than 25% of workforce impacted | 20% | |
| None of workforce impacted | 14% |
How organizations adapted, and complementary supports
Qualitative data details the strategic measures undertaken by respondents to adapt to current context/ensure organizational sustainability
To adapt to the current context and ensure sustainability, many respondents have had to undertake operational strategic measures such as managing staffing levels and remuneration, streamlining operations, and contingency planning.
The table below shows the frequency of qualitative responses about strategic measures undertaken to adapt to current context/ensure organizational sustainability.
| Frequency | Qualitative Response Groupings |
|---|---|
| 379 |
Strategic measures - Operational – managing staffing levels and remuneration, streamlining operations, contingency planning |
| 127 | Modified in-person activities – e.g., small groups/cohorts, hybrid working, PPE, physical distancing |
| 97 | Shift to digital/online – e.g., increasing online presence, social media, virtual activities, digital marketing |
| 92 | Development / Innovation – new processes / services, different ways of offering services, adapting/diversifying business model |
| 33 | Other |
| 30 | Partnerships – developing partnerships with different organizations and communities |
Respondents used complementary support measures to weather the effects of the pandemic
70% of respondents indicated that they had received other emergency or recovery funding to support their operations since the onset of the pandemic, aside from the Recovery and Reopening Funds. Among those respondents who received additional funding, most of this support came from either the Federal Government (e.g., Canada Emergency Wage Subsidy, Canada Emergency Business Account) or provincial and territorial governments.

Description of the infographic: Source of Other Emergency or Recovery Funding
| Respondents | Percentage of respondents |
|---|---|
| Federal government | 67% |
| Provincial/Territorial government | 64% |
| Municipal government | 17% |
| Other | 11% |
| Business | 3% |
| Not-for-profit | 3% |
| Indigenous government/ governing body/organization | 0% |
Recipient satisfaction with the RRF delivery process
Overall, respondents demonstrated strong levels of satisfaction with the funding process.
Strongest levels of satisfaction were with the overall attestation/application submission process (92%) and the timeliness with which funds were received (86%).
Chart: Respondents' satisfaction with the process of receiving the Fund
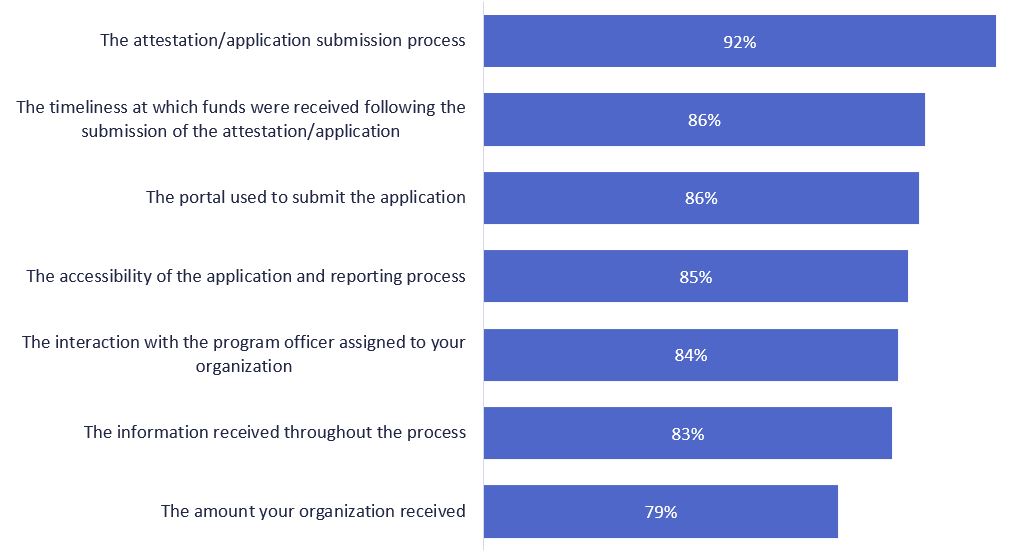
Description of the infographic: Recipient’s Ssatisfaction with the process of receiving the Fund
List showing the following results:
Satisfaction with…
- The attestation/application submission process - 92%
- The timeliness at which funds were received following the submission of the attestation/application - 86%
- The portal used to submit the application - 86%
- The accessibility of the application and reporting process - 85%
- The interaction with the program officer assigned to your organization - 84%
- The information received throughout the process - 83%
- The amount your organization received - 79%
Qualitative data shows that organizations had a positive experience accessing the RRF
Almost all respondents noted that the process was fast, efficient, easy and smooth; this was particularly valued at a time when everything else was entirely unsettled by the pandemic. Program officers were generally considered to have been useful, helpful and available.
Impacts of the RRF on the sector overall
The RRF supported every part of the culture value chain
In general, responses show that the RRF provided good coverage of the entire range of the culture value chain.
Chart: Distribution of funding by culture value chain position

Description of the infographic: The RRF supported every part of the culture value chainDistribution of respondents by culture value chain position
| Culture value chain section | Percentage of respondents |
|---|---|
| Creation | 55% |
| Production | 44% |
| Dissemination | 48% |
| Exhibition/Reception/Transmission (includes training) | 63% |
| Consumption/Participation | 52% |
Definitions:
- Creation: the originating and authoring of ideas and content (e.g. writers) and the making of one-off production (e.g. fine arts).
- Production: the reproducible cultural forms (e.g. TV programs), as well as the specialist tools, infrastructure and processes used in their realization (e.g. the production of musical instruments, the printing of newspapers).
- Dissemination: the bringing of cultural products to consumers and exhibitors (e.g. the wholesale, retail, rental and digital distribution of recorded music and computer games, film distribution).
- Exhibition/Reception/Transmission (includes training): the place of consumption and the provision of live and/or unmediated cultural experiences to audiences by granting or selling access to consume/ participate in time-based cultural activities (e.g. festival organization and production, opera houses, theatres, museums). Transmission relates to the transfer of knowledge and skills (including training) that may not involve any commercial transaction. It includes the transmitting of intangible cultural heritage from generation to generation.
- Consumption/Participation: the activities of audiences and participants in consuming cultural products and taking part in cultural activities and experiences (e.g. book reading, dancing, participating in carnivals, listening to radio, visiting galleries).
Impacts of the RRF on Indigenous peoples and equity-deserving communities
More than one third of respondents indicated funding had a direct impact on equity-deserving communities
38% of respondents responded that funding had a direct impact on equity-deserving communities.
Chart: Equity-deserving communities impacted by the Fund

Description of infographic: Equity-deserving communities impacted by the Fund
| Respondents (Communities/groups/peoples) | Percentage of respondents |
|---|---|
| Ethno-Cultural communities | 18% |
| Indigenous peoples | 17% |
| Women | 16% |
| LGBTQ2+ communities | 16% |
| Racialized communities | 15% |
| Gender diverse communities | 15% |
| Youth | 14% |
| Seniors | 13% |
| Those with low income | 13% |
| Rural communities | 12% |
| Immigrants and Refugees | 11% |
| Persons with disabilities | 10% |
| Official language minority communities | 9% |
| Remote and Northern communities | 4% |
| Deaf communities | 4% |
| Religious minorities | 2% |
| other | 1% |
Definitions:
- Ethno-cultural communities – Communities with a shared sense of group belonging based on common characteristics such as language, geographic origin, nationality, cultural traditions, ancestry and migration history, among others.
- Gender diverse communities – a widely inclusive category that captures non-binary, gender-fluid and transgender people. Members of this community may face challenges that are distinct from other equity-deserving communities (e.g., women, LGBTQ2+).
- LGBTQ2+ – Lesbian, Gay, Bisexual, Transgender, Queer, Two-Spirit and other sexual and gender minorities.
- Official Language Minority Communities – groups of people whose maternal or chosen official language is not the majority language in their province or territory – in other words, Anglophones in Quebec and Francophones outside of Quebec.
- Racialized communities – groups that have come to be socially constructed as belonging to a particular race, based on perceived differences in physical appearance. Historically referred to as “visible minorities”, the term racialized communities generally encompasses all groups that are non-white in colour or non-European in descent.
Funds impacted equity-deserving communities mainly in the form of employment and enhanced partnerships
Funds impacting equity-deserving communities predominantly went towards hiring or contracting members of equity-deserving communities, either as talent (57%) or staff (49%) as well as enhanced partnerships and collaboration (53%).
Chart: Ways in which equity-deserving communities were impacted by the Fund
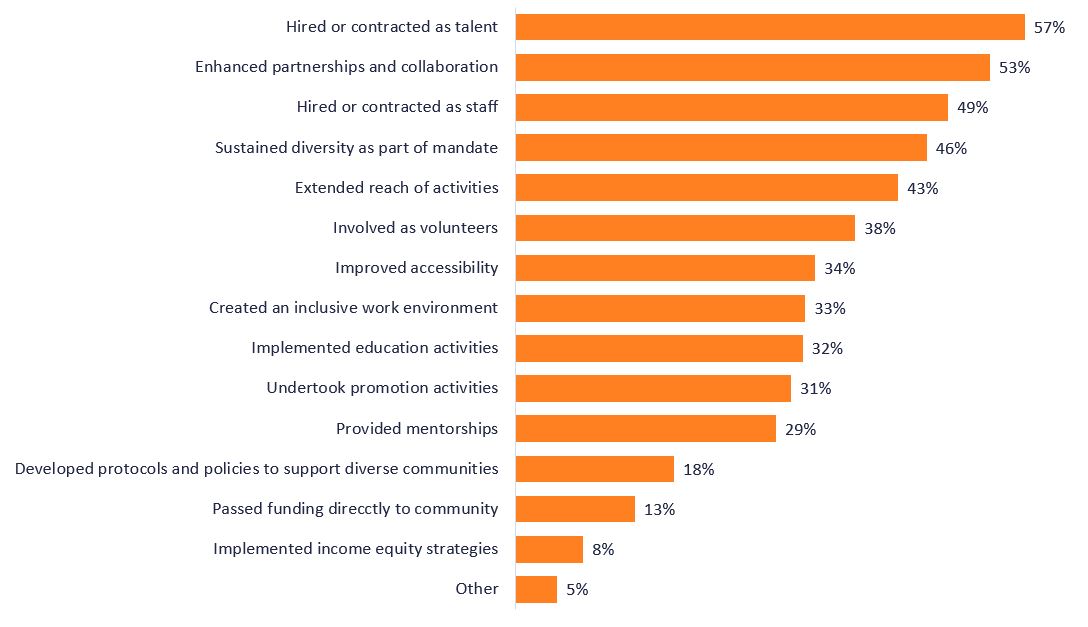
Description of infographic: Ways in which equity-deserving communities were impacted by the Fund
List showing the following results:
- Hired or contracted as talent - 57%
- Enhanced partnerships and collaboration - 53%
- Hired or contracted as staff - 49%
- Sustained diversity as part of mandate - 46%
- Extended reach of activities - 43%
- Involved as volunteers 38%
- Improved accessibility 34%
- Created an inclusive work environment 33%
- Implemented education activities 32%
- Undertook promotion activities 31%
- Provided mentorships 29%
- Developed protocols and policies to support diverse communities 18%
- Passed funding directly to community 13%
- Implemented income equity strategies 8%
- other 5%
Organizational strategies in place to support Inclusion, Diversity, Equity, and Accessibility (IDEA), Reconciliation with Indigenous Peoples, and Environmental Sustainability
Most respondents reported undertaking various strategies to support Inclusion, Diversity, Equity, and Accessibility (IDEA), Reconciliation with Indigenous Peoples, and Environmental Sustainability

- Inclusion, Diversity, Equity, and Accessibility (IDEA): 86% of respondents reported having internal strategies to support IDEA within their organization.
- Reconciliation with Indigenous Peoples: 66% of respondents reported having internal strategies to support reconciliation with Indigenous Peoples.
- Environmental Sustainability: 79% of respondents reported having internal strategies to support environmental sustainability.
Future directions
Respondents indicated needing more government funding, broadened eligibility/flexibility, digitization supports
Respondents most frequently cited a need for more funding (74%) and improved eligibility (51%) for government programming. This was followed by support for increasing digital presence (35%).
Chart: Organizational needs to become more sustainable, adaptable and resilient through future shocks

Description of infographic: Organizational needs to become more sustainable, adaptable and resilient through future shocks
List showing the following results:
- Increased or improved access to government funding - 74%
- Broadened eligibility or flexibility for government programs - 51%
- Support for increasing digital presence - 35%
- Promotional support to improve the accessibility and visibility of content - 22%
- Improvements in physical infrastructure - 22%
- Initiatives to leverage funding from and/or build closer relationships with provincial, territorial, and municipal governments - 19%
- Opportunities to leverage private sources of funding - 18%
- Capacity-building and professional development (e.g., tools, resources, reference material, training) - 17%
- Legislative, regulatory or policy changes - 7%
- More opportunities for federal government engagement - 6%
- Other - 6%
- Funding and support for new health and safety protocols - 3%
Conclusion
At the Department of Canadian Heritage, data has been central in informing decision-making throughout the pandemic. The first wave of results from the Recovery Fund and Reopening Fund recipient survey is one of the data sources that is helping the department design next steps to support these sectors, which are at the heart of Canadian life, our economy, and individual and collective well-being. The second wave of the RRF survey will be administered in late Summer 2023 and will be sent to 2022-23 Recovery Fund and Reopening Fund recipients.
It is important to note that these results represent the views of individual organizations who are recipients of the Recovery and Reopening Funds and do not necessarily reflect the arts, culture, heritage, and sport sectors overall. Departmental officials continue to work closely with stakeholders and monitor a variety of data sources to ensure a holistic view of recovery.
Page details
- Date modified: