
Guidance for improving subway air quality

Table of contents
- 1.0 Executive summary
- 2.0 Introduction
- 3.0 Subway air quality
- 4.0 Subway PM2.5 reduction strategies
- 5.0 Conclusions
- 6.0 References
- Annex A – Subway PM2.5 maps
1.0 Executive summary
Urban rail rapid transit systems are a staple of public transit. They provide access to employment and social services, decrease private vehicle use, and promote physical activity. Collectively, these advantages represent considerable societal benefit. However, studies conducted around the world since 2000 have noted there may be elevated levels of air pollutants in some subway systems. The main pollutant of concern is particulate matter (PM) pollution, particularly the “fine” fraction (PM2.5). It is well-established that PM 2.5 can cause adverse health effects, including increased mortality and the development of heart and lung disease.
This document provides guidance to public transit authorities and their municipal and provincial partners on options to mitigate subway air pollution. It includes background on the sources of subway PM pollution, factors that affect them, a perspective on Canadian subway air quality, and a thorough review of the research on methods to reduce concentrations of PM in subways. This information can support informed decision-making to help improve the air quality in subway systems.
There are six key areas that have been identified in scientific literature as options to improve subway air quality: ventilation, filtration, air quality monitoring, reducing subway PM emissions, vacuuming and washing, and platform screen doors (PSDs). Recommendations in this guidance document are based on the best available scientific data, without considering costs. As well, each of these strategies was noted to have varying efficacy across subway stations, lines, and systems. Before full deployment of the approaches described in this guidance, testing should be conducted to ensure they are effective where implemented.
The following are strategies that have the potential to help improve subway air quality:
- Routinely monitoring subway air quality. This helps system managers to understand where and when high concentrations of PM occur, detect changes in subway PM concentrations, and can inform strategies to improve subway air quality.
- Operating forced (mechanical) ventilation systems rather than relying solely on piston-driven or natural ventilation.
- Automating and optimizing forced ventilation system operation based on train schedules and measured platform and outdoor PM concentrations.
- In-train filtration may be more effective at reducing commuters’ exposures than platform filtration, since station-wide PM reduction would require a substantial number of units, and commuters spend the majority of their time inside subway trains.
- Using particle removal methods that employ magnetism. This approach is ideal for iron-rich particles commonly found in subways.
- Reducing friction brake use and selecting more durable brake materials to help decrease PM generation within the system.
- Performing an audit of the wear and replacement rates of subway components (such as wheels, rails, brake lining materials, electrical components, lubricants, and ballast) to help identify the major contributors to the “subway source” of subway PM.
List of abbreviations
- APTA
- American Public Transportation Association
- AQ
- air quality
- CAS
- Chemical Abstracts Service
- CO
- carbon monoxide
- CO2
- carbon dioxide
- COMEAP
- Committee on the medical effects of air pollution
- FVS
- forced ventilation system
- HVAC
- heating, ventilation and air conditioning
- IAQ
- Indoor air quality
- KMOE
- Korean Ministry of the Environment
- NFPA
- National Fire Protection Association
- NO
- nitrogen monoxide
- NO2
- nitrogen dioxide
- NOx
- nitrogen oxides
- PM
- particulate matter
- PM2.5
- particulate matter less than 2.5 microns in aerodynamic diameter
- PM10
- particulate matter less than 10 microns in aerodynamic diameter
- PSD
- platform screen door
- SAQI
- Subway Air Quality Initiative
- SCAP
- subway air cabin purifier
- SMS
- Seoul Metropolitan Subway
- TfL
- Transport for London
- TTC
- Toronto Transit Commission
- UTES
- Urban Transportation Exposure Study
2.0 Introduction
2.1 Subway systems
Worldwide, urban rail rapid transit systems are expanding to meet the demand for sustainable public mobility. Combined with the provision of rapid, cross-city transit, they promote increased physical activity and decrease reliance on private vehicles, thereby reducing emissions and traffic congestion (James et al., 2014; Li et al., 2019; Toronto Public Health, 2020; Yang et al., 2018).
Urban rail rapid transit systems can have elevated, at-grade (ground level), or below-grade (underground) structures. While underground lines (subways) can be the most expensive form of urban rail rapid transit to construct (ITA, 2004), they can be ideal for extensively developed areas of a city. Since the first subway system was built in London, United Kingdom in the late 19th century, the rate at which such systems have been introduced in new cities and expanded has increased worldwide (UITP, 2019).
2.1.1 Subway systems in Canada
Subways exist in six Canadian cities, each with expansions that are planned or underway. The light rail systems of Calgary, Ottawa, and Edmonton are predominantly at-grade with one, four, and six underground stations, respectively. The systems of Toronto, Montreal, and Vancouver feature lines that are extensively underground. In Vancouver, underground subway lines are located in the downtown core and account for approximately 20% of the otherwise elevated system. In comparison, over 80% of the Toronto system consists of underground subway lines, and the Montreal Metro operates entirely underground. These three systems are the largest in Canada. Montreal, Toronto, and Vancouver’s systems rank third (1.4M), fourth (1.3M), and ninth (0.5M), respectively, for average daily weekday boardings in North America (APTA, 2019). Based on the 2016 Canadian census, over 1.3 million people in Canada use these three subway systems for their daily commute (Statistics Canada, 2017).
2.1.2 Air pollution in subway systems
Over the last 20 years, research characterizing the air quality of subways has noted there may be elevated levels of air pollutants in some subway systems. The restricted airflow combined with the emission of PM from the wear of subway components may pose potential health risks by generating air pollutants such as fine (PM2.5) and coarse (PM10-2.5) PM (COMEAP, 2019; Toronto Public Health, 2020). Concentrations of PM2.5 and PM10-2.5 have also been reported to be higher in subways than in outdoor environments (Xu and Hao, 2017) and highly correlated (Lovett et al., 2017) suggesting their sources to be the same. Components of subway systems which have been studied for their potential to emit PM include wheels, brake material (pads, shoes, or blocks), rails, ballast (gravel beneath tracks), and electric current-carrying components such as catenaries (for overhead electrical systems) and contact shoes (for third-rail electrification systems) (Xu and Hao, 2017).
While subway commuting has been estimated to constitute 5% of a subway commuter’s day (Matz et al., 2014), it can contribute much more of a commuter’s daily PM2.5 exposure due to the elevated concentrations in some subway systems. For example, one study in the published literature, which was conducted under the Improve Life Project, reported PM2.5 concentrations ranging from 10 to 125 µg/m3 for 115 stations (Moreno and de Miguel, 2018). Another study, conducted on the London Underground, reported in-train PM2.5 concentrations ranging from 39 to 734 µg/m3 (Saunders et al., 2019). A study of four systems in the northeastern United States reported platform PM2.5 concentrations ranging from about 100 to 800 µg/m3 (Lugilio et al., 2021). The concentrations of PM2.5 in the platforms and trains of the Shanghai metro system ranged from 50 to 200 µg/m3 (Zhao et al., 2017).
In Health Canada’s Urban Transportation Exposure Study (UTES), subway platform concentrations for the systems of Toronto, Montreal, and Vancouver were estimated to be 106, 36, and 40 µg/m3, respectively (Van Ryswyk et al., 2017). Subway commuting in each of these systems was estimated to account for 11% to 21% of daily PM 2.5 exposure. These findings are consistent with similar studies conducted in Helsinki, Finland (Aarnio et al., 2005), New York, United States (Chillrud et al., 2004), and London, United Kingdom (Seaton et al., 2005; Saunders et al., 2019). Overall, these studies demonstrate the potential for subway system PM2.5 concentrations to contribute to the daily PM2.5 exposures of subway passengers.
2.2 Health effects of PM2.5
The health risks of PM2.5 exposure are well established. While PM10-2.5 exposure can affect health, particularly for respiratory outcomes (Adar et al., 2014), the human health burden of PM 2.5 exposure is greater. It is a component of air pollution defined as particles in the air smaller than 2.5 microns in diameter. When inhaled, these particles pose a risk to human health because they can penetrate deep into the lungs and enter the bloodstream of exposed individuals, causing adverse health effects such as asthma, lung cancer, coronary disease, heart attacks, stroke, and reduced life expectancy (Health Canada, 2012; Health Canada, 2013; US EPA, 2009; World Health Organization, 2016). At present, efforts to improve air quality in subways systems have focused on decreasing PM concentrations and its unique metallic composition is the focus of ongoing epidemiological research.
2.3 Rationale and scope
The purpose of this document is to inform Canadian public transit authorities of strategies to improve air quality in their subway systems. To this end, systematic review techniques were applied to reviewing the available literature on subway air quality. In section 3, a background on the nature of subway air quality is provided as well as a review of two studies which have examined subway air quality in Canada. Finally, section 4 contains a review of studies which have evaluated strategies to improve subway air quality.
This document can support incorporating air quality considerations into the decision-making framework of subway system management. As research on subway air quality continues to clarify the sources, trends, and health effects of subway-sourced PM, identifying and maintaining achievable levels of subway air quality will likely increase in priority for public transit managers.
3.0 Subway air quality
A 2017 review of studies characterizing subway air pollution noted that common findings include the following: PM is the primary pollutant of concern; iron is the most dominant element in airborne PM; and mechanical wear is its primary source (Xu and Hao, 2017). The review also discusses the internal and external factors of subway systems that are related to PM concentrations. With respect to internal factors, aspects of system design, such as depth of the station/tunnel, distance from an outdoor section of the line, presence of platform screen doors (PSDs), age and airtightness of the train, air exchange rate and circulation, and efficiency of ventilation systems and air filtration, have been associated with PM levels in the subway. Subway use and scheduling factors, such as service time, number of passengers, and frequency of passing trains, can also affect subway air quality. With respect to external factors, environmental conditions such as temperature, relative humidity, and ambient pollution levels in outdoor air can impact subway air quality, as evidenced by the seasonal changes in subway PM levels (Lee et al., 2016; Martins et al., 2016; Van Ryswyk et al., 2017).
Train frequency is a dominant factor in subway PM concentrations. Train frequency has been consistently shown to have a close association with subway air quality, due to the combination of PM emission and resuspension. Studies involving subway PM2.5 monitoring campaigns that covered a period of 24 hours over days to weeks describe a diurnal pattern which reflects the daily pattern of train frequency (Song et al., 2008; Son et al., 2013; Van Ryswyk et al., 2021; Saunders et al., 2019). Maximum PM concentrations were observed during peak commuting hours with a decrease to minimum levels during non-service hours (Figure 3.1).
Figure 3.1. The diurnal pattern of subway platform PM2.5. These data represent the platform PM2.5 concentrations for 13 platforms of Line 1 and 18 platforms of Line 2 of the Toronto subway system (Van Ryswyk et al., 2021).
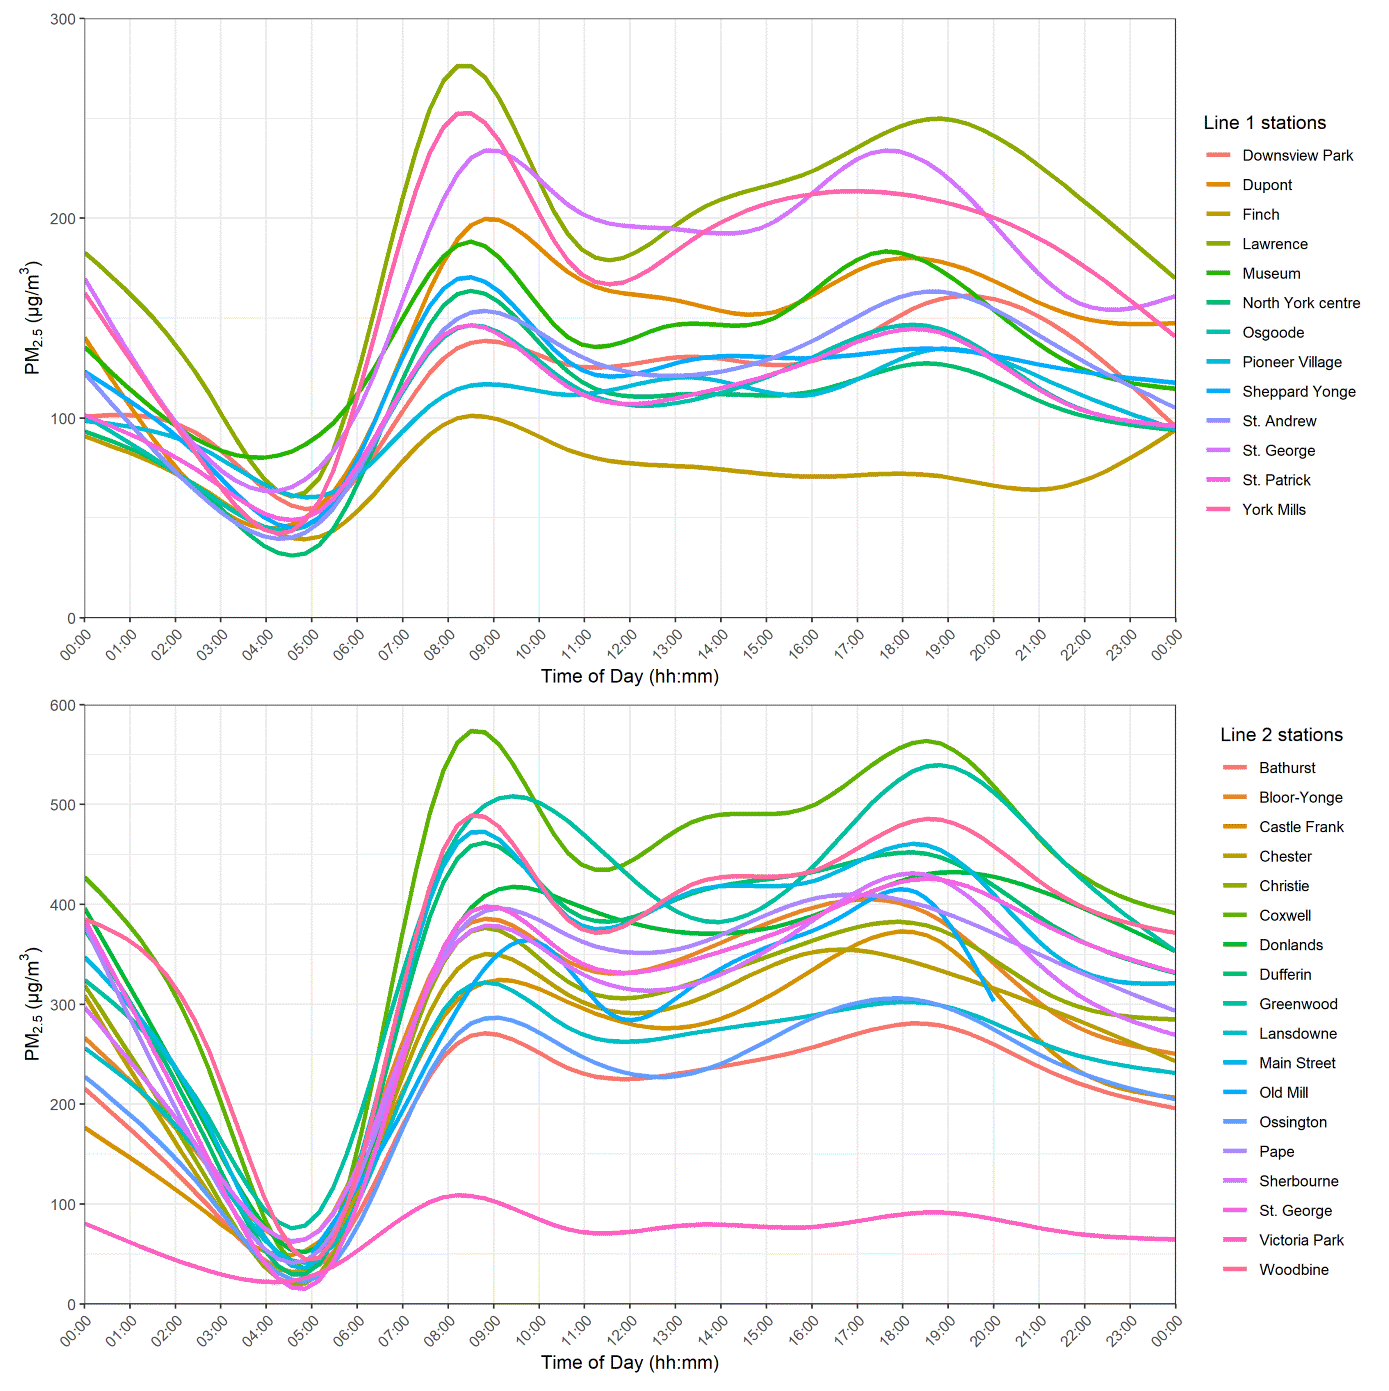
Figure 3.1 - Text description
Figure 3.1 depicts two line graphs showing the diurnal pattern of subway PM 2.5. In each graph, PM2.5 is plotted on the y-axis and time of day on the x-axis. The PM2.5 data for these graphs comes from data collected on 31 Toronto subway platforms. PM2.5 for each station was averaged over each minute of the day. Data for each station is overlayed. There are 13 lines on the upper graph, each representing a station from line 1 of the Toronto subway system. The graph on the bottom displays data for 18 line 2 stations. The y-axis of each graph represents PM2.5 in µg/m3. The maximum for the line 2 graph on the bottom is 600 µg/m3 while the maximum for the upper graph for line 1 is 300 µg/m3. All 31 lines demonstrate a diurnal pattern where PM2.5 varies with the frequency of trains; levels are highest at maximum train frequency during the AM and PM peak periods and lowest during the 2AM-6AM non-service hours.
3.1 The sources of subway particulate matter
A common technique of studies investigating the sources of subway particulate matter is the collection of airborne PM on filters. Using various chemical identification methods, the elemental composition of subway PM can be determined and analyzed to identify sources and estimate their relative contributions. These source apportionment analyses are useful for identifying the proportion of subway PM that originates from outdoor air and the proportion originating from the system itself. Subway air pollution source apportionment studies have estimated that 30% to 91% of subway PM2.5 is derived from system operation (Kang et al., 2008; Minguillón et al., 2018; Park et al., 2014a; Huang et al., 2021). The identification of subway components as the source of subway PM is supported by examining the ratios of elemental pairs. For example, a study conducted in the New York City subway system found that the ratio of manganese to iron (Mn:Fe) in PM was the same in nearly all PM samples collected and was consistent with the Mn:Fe ratio in steel (Chillirud et al., 2004). A similar Mn:Fe ratio was observed in PM2.5 sampled in Canadian systems (Van Ryswyk et al., 2017). The origin of these particles is attributed to emissions from mechanical friction processes between brakes, wheels, rails, and electrical components of the train (Aarnio et al., 2005; Eom et al., 2013; Johansson and Johansson, 2003; Moreno et al., 2015; Van Ryswyk et al., 2017; Namgung et al., 2016). The primary component of subway PM is typically iron, which can account for over 50% of the total PM mass (Bachoual et al., 2007; Minguillón et al., 2018; Loxham et al., 2013; Cusack et al., 2015; Lee et al., 2018; Kim et al., 2010; Park et al., 2014a; Luglio et al., 2021; Van Ryswyk et al., 2021; Smith et al., 2020).
Subway PM is also often found to be highly carbonaceous. The carbonaceous component is likely sourced from train brakes and electrical components such as catenaries, pantographs, and contact shoes, which are typically carbon-based (Querol et al., 2012; Moreno et al., 2015; Minguillón et al., 2018). Other metals found in subway systems are arsenic, barium, cadmium, chromium, cobalt, manganese, nickel, silver, strontium, titanium, and zirconium (Figueroa-Lara et al., 2019; Luglio et al., 2021; Martins et al., 2015; Van Ryswyk et al., 2017).
Examining particle morphology and oxidation state have also been useful in characterizing the source and formation of subway PM. An analysis of airborne subway particles from the Barcelona subway system, using scanning electron microscopy and transmission electron microscopy, identified the particles tended to be planar and flake-like in shape, and were highly oxidized, suggesting that their formation is due to high-temperature frictional processes (Jung et al., 2012; Moreno et al., 2015, 2017a). Image analyses of particles emitted in laboratory-based subway brake dust studies also noted non-spherical shapes (Namgung et al., 2016; Namgung et al., 2017). Examining the distribution of the size of airborne particles on platforms has also provided evidence of the contribution of subway operation to subway PM. On a platform of the Stockholm subway system, a wide variety of particle sizes were measured at a high temporal resolution. These data were used to identify three sources: railway-related mechanical wear, suspension from train movement, and sparking from electrical components (Cha et al., 2018).
3.2 PM2.5 in Canadian subway systems
To investigate air quality in Canadian subway systems, Health Canada conducted the UTES from 2010 to 2013 in Vancouver, Toronto, and Montreal. This study included monitoring of underground and aboveground sections, including both train and platform environments, in summer and winter during peak commuting hours (7 to 10 AM and 3 to 6 PM). Results indicated that the Vancouver system had the lowest PM2.5 concentrations (24 µg/m3), followed by Montreal (38 µg/m 3) and Toronto (111 µg/m3) (Van Ryswyk et al., 2017). The low PM2.5 concentrations in Vancouver were attributed to the aboveground design (about 80% of the system), where the open air permits the dispersion and dilution of particles generated from operations. Also, for Vancouver, higher PM2.5 concentrations were observed in the underground sections located downtown where there was less dispersion or mixing with ambient air compared to in the aboveground sections. In contrast, the subway system in Montreal is built entirely underground, while the Toronto system is about 80% underground. While the systems in Montreal and Toronto are similar in train length and capacity, station depth, system length, and ridership, they differ with respect to the composition of subway components. Specifically, the Montreal system uses rubber wheels, concrete rollways, and wooden brake shoes, while these components (wheels, rails and brake shoes) are metallic in Toronto, resulting in the generation of significantly more steel dust. Elemental analysis of the PM2.5 from these systems indicated that Montreal PM 2.5 had a lower proportion of iron (5%) compared to Toronto (50%).
The difference in the PM2.5 concentrations between the subways of Montreal and Toronto is also likely due to different ventilation practices. While both systems are equipped with forced ventilation, in Montreal the ventilation system must be operated continuously for heat abatement purposes (STM, 2012). The air quality impacts of continual ventilation for cooling can be determined by examining the seasonality of PM2.5 in each system and considering that cooling would require more ventilation in the summer. The Montreal subway system showed lower PM2.5 in summer (26 µg/m3) compared to winter (47 µg/m3). This seasonal difference far exceeds the corresponding difference observed for Montreal’s outdoor PM2.5. In the Toronto system, seasonality was also evident; however, the concentrations were higher in summer (120 µg/m3) than in winter (82 µg/m3). This suggests that in Toronto, forced ventilation is used to a lesser extent for climate control. Several European studies of subways with continuously operating ventilation systems have also noted lower PM levels in summer (Branis, 2006; Martins et al., 2015).
Analyses testing for associations between subway PM2.5 and system factors was conducted in the UTES, and was stratified by underground (i.e. subways) and aboveground sections of each system. The results for the subway portions of each system are presented in Table 3.1. The associations between subway PM2.5 and factors of distance to outside, station depth, and elevation were similar for the subways of Toronto and Vancouver. The PM2.5 in the Montreal system showed no association with elevation or station depth. When the variation of PM2.5 throughout each system is examined (See Figures A1, A2, and A3 in Annex A for Toronto, Montreal, and Vancouver, respectively), the subway sections for Toronto and Vancouver stand out for their greater PM2.5 levels. Substantial variations in PM2.5 levels were noted throughout the subway systems. However, the Montreal Metro exhibited more consistent PM2.5 levels throughout the entirely below-grade system.
| System factors | Toronto | Montreal | Vancouver | |||
|---|---|---|---|---|---|---|
| % change | 95% CI | % change | 95% CI | % change | 95% CI | |
| waiting vs. riding | 61 | 46 to 77 | NS | N/A | 61 | 40 to 84 |
| distance to outside (km) | 6 | 4 to 9 | NS | N/A | 9 | 1 to 17 |
| station depth (10s of metres) | NS | N/A | NS | N/A | 33 | 20 to 47 |
| elevation (10s of metres) | -3 | -6 to -1 | NS | N/A | -8 | -11 to -5 |
| age at sampling (decades) | 9 | 3 to 1 | -3 | -5 to -1 | NS | N/A |
| Reproduced from Van Ryswyk et al., 2017, Table 4. NS=non-significant | ||||||
The main purpose of UTES was to examine the proportion of daily PM 2.5 attributable to a subway commute. It was estimated to be 21% for Toronto and 11% for Montreal and Vancouver. In a follow-up study of the Toronto subway system, Health Canada’s Subway Air Quality Initiative (SAQI; 2018–2020), found that the air quality had improved since UTES was carried out (Van Ryswyk et al., 2021). The reduction in PM2.5 was associated with several changes and improvements within the subway system. On Line 1, there was a complete changeover to newer trains, resulting in a 30% improvement in PM2.5 relative to the previous study (UTES). This decrease in PM 2.5 was observed line-wide as reductions were noted on each of the thirteen Line 1 platforms included in the study. With respect to Line 2, a line-wide increase of approximately 50% in PM2.5 level was initially observed across the 18 platforms included in the study. This increase was linked to an increase in the wheel flat incidents for Line 2 (TTC, 2019; Wong, 2019), resulting from a high rate of friction brake use. After this problem was solved, a reassessment of Line 2 PM2.5 concentrations indicated a marked reduction in PM2.5 to levels below those observed in 2011. The effects of both the new trains introduced on Line 1 and the reduced frequency of brake use on Line 2 highlighted the potential impacts of operations on subway air quality.
The SAQI study reported that within one year of operation, the six-station extension of Line 1 (completed in 2017, just prior to study commencement) had PM2.5 levels similar to those of the neighbouring, older stations. As the older and newer underground sections were separated by a 5 km aboveground section, transport of PM 2.5 from the older to the newer sections was not possible. Therefore, the PM2.5in the newer section was attributable to recent emissions and not to the resuspension of older dust accumulated over decades of operations. This also suggests that PM 2.5 in the older section is predominantly freshly-emitted as well. The study also evaluated the use of a track-bed vacuum car to improve air quality in the system. This car was operated at night during non-service hours to remove the accumulated dust from the system. While the track-bed vacuum was effective in removing debris that can cause track fires, it had no effect on platform PM 2.5 concentrations.
Overall, the SAQI results suggest that measures aimed at reducing emissions (e.g., newer trains and decreased friction brake use and wheel flats) are more effective at reducing PM2.5 concentrations than at removing accumulated dust. These observations suggest that air quality interventions that target the reduction of emissions at the source (such as reducing the rate of dust production from wheels, rails, and brakes) could be more effective than those designed to increase the removal of PM, such as vacuuming and washing methods.
4.0 Subway PM2.5 reduction strategies
Several of the more recent studies on PM2.5 reduction strategies identify interactions between subway operation and air quality. A number of factors such as platform and tunnel ventilation, the installation of PSDs, the application of platform and in-train filtration, the use of vacuum cars and tunnel washing, as well as braking have been investigated for their impact on subway PM concentrations (Park et al., 2018). For example, the Improve Life Project, conducted by the Spanish Research Council’s Air Quality Research Group and the Barcelona public transit authority, investigated the relationship between subway PM concentrations and system factors. This research was published in several papers and summarized in a technical guide intended for public transit authorities (Moreno et al., 2017c). The Seoul Metropolitan Subway (SMS) system, in the Republic of Korea, has been the site of numerous studies on subway air quality. These studies conducted by researchers from the Universities of Kyung Hee, Inha, and Konkuk investigated the impact of magnetic and electrostatic filtration and advanced monitoring networks. This research includes the only longitudinal studies assessing the impact of the installation of PSDs on in-train and platform PM concentrations. A collaborative effort to improve air quality was carried out in the London subway system (the London Underground; United Kingdom) (TfL, 2013; TfL, 2017) through a partnership between the municipal transit authority (Transport for London) and King’s College London (Saunders et al., 2019; Smith et al., 2020). Similarly, Health Canada’s UTES was done in collaboration with the public transit authorities of Vancouver, Toronto, and Montreal; this study informed the design of SAQI, which investigated the impact of new rolling stock, track bed vacuuming, and friction braking frequency on subway air quality. The body of research on subway air quality interventions also includes systems in other countries such as Brazil, Mexico, the United States, France, England, Finland, Greece, Sweden, the Netherlands, Italy, and China.
The following is a review of this research in six areas, specifically ventilation, PSDs, filtration, vacuuming and washing, and braking. Each section ends with several points that summarize the study results. A final section is dedicated to research on subway air quality monitoring.
4.1 Ventilation
Air exchange between the subway and outdoor space can occur through natural, piston-driven, or forced (mechanical) ventilation. Natural ventilation is dependent on a number of factors including meteorology, gravity, the availability of stairwells, and ventilation or pressure relief shafts, as well as the temperature, humidity, and density of subway air relative to that of outdoor air (Brüne et al., 2012). Air exchange achieved through natural ventilation is limited in subway systems (Wen et al., 2020). Air spaces within subways can be quite disconnected from outdoor air if a system was to rely solely on this type of ventilation (Brüne et al., 2012).
Piston-driven ventilation consists of airflow through ventilation shafts driven by train movement. As a train travels through a tunnel, an area of high pressure forms in front of the train and a low-pressure area behind it. Consequently, air is forced up ventilation shafts as the train approaches and outdoor air is then pulled down the shaft as it passes. Tunnel ventilation shafts are located throughout subway systems, typically in close proximity to subway platforms where they provide pressure relief when trains are entering stations. They differ in height as deeper sections of a subway will have longer ventilation shafts. Therefore, the piston-driven ventilation provided by train movement (equal across a system) will yield less ventilation for deeper sections of a system. Tunnel ventilation shafts can also be used to disperse heat emanating from train air conditioner condensers (Zhao et al., 2021). Most of the studies that have examined the potential of piston-driven ventilation to provide air exchange are theoretical or qualitative in nature (Pan et al., 2013).
Forced ventilation systems (FVSs) consist of mechanically operated fans located throughout the system in tunnel and platform ventilation shafts. All Canadian subway systems feature FVSs as required under the Canadian National Fire Protection Association safety code 130 (NFPA 130, Standard for Fixed Guideway Transit and Passenger Rail Systems [National Fire Protection Association, 2020]). The main purpose of FVSs are to reduce smoke hazards during emergency incidents. They are also used to ventilate sections of the system during maintenance activities that create excessive dust (e.g., rail grinding). Lastly, they provide climate control. When the temperature in a given area of the subway reaches a threshold value, the FVS is activated, introducing cool air from the surface which displaces the warmer subway air. The level of FVS operation for cooling purposes can vary greatly between systems. Subways that are extensively or completely enclosed, such as the Montreal Metro, or that exist in warmer climates, may require constant operation of their FVS to ensure the thermal comfort of passengers. Continuous operation of the forced air ventilation system for cooling purposes is common in a number of systems including Montreal, Canada (STM, 2012), Seoul, Republic of Korea (Song et al., 2008), Barcelona, Spain (Moreno et al., 2014; Moreno et al., 2017b) and Chongqing, China (Zhao et al., 2021). The benefits of increased subway air exchange with ground level air are evidenced by studies reporting that the air quality of subway platforms improves with closer proximity to aboveground sections (Martins et al., 2016; Reche et al., 2017; Van Ryswyk et al., 2017; Saunders et al., 2019). Continuous use of forced air ventilation contributes to lower PM concentrations relative to those generated by natural and piston-driven ventilation alone (Martins et al., 2015; Moreno et al., 2014; Son and Ryu, 2018). Tunnel ventilation was implemented in the SMS system and helped reduce PM 10 levels below the Korean IAQ standard (Son et al., 2013).
Results from studies investigating the impact of ventilation protocols in the Barcelona subway system indicated that coordinated FVS operation in both tunnels and platforms had the potential to improve subway PM in single-track tunnels but had little effect on double-track platforms (Moreno et al., 2014; Moreno et al., 2017b). In these studies, the effect of ventilating platform air inwards from outdoors or expelling platform air to the outdoors (impulsion/expulsion) was explored. The study authors noted that when platform ventilation was set to expulsion, platform PM levels increased. This was attributed to the fact that platform expulsion draws tunnel air containing higher PM concentrations onto the platforms. Increased fan speed (higher power) was also found to decrease platform PM.
The continual use of forced ventilation can increase operating costs. For example, an evaluation of a system-representative station in the Barcelona subway system (which uses continual forced ventilation) found that approximately 14% of the station’s non-traction-related energy use was attributable to its mechanical ventilation system (Casals et al., 2014).
Between 2013 and 2021, the Department of Environmental Science and Engineering, College of Engineering, Kyung Hee University, Republic of Korea, published a series of modelling papers that evaluated methods for optimizing the ventilation system of a subway station in the SMS system (Liu et al., 2013; Lee et al., 2015; Kim, G. S., et al., 2016; Kim, M.J., et al., 2016; Li et al., 2019; Loy-Benitez et al., 2018; Loy-Benitez et al., 2021). Each simulation used a combination of model inputs including train schedule, ridership, temperature, relative humidity, and platform and outdoor PM10 in an effort to find the optimal ventilation fan speed that would maintain subway PM 10 levels below the existing Korean indoor PM10 standard (KMOE, 2005; KMOE, 2020). These modelling studies revealed that a decrease in energy consumption ranging from 4% to 36% was possible without a reduction in platform air quality. The use of artificial intelligence-based systems to optimize ventilation and control costs has also been investigated from the standpoint of potential to increase the efficiency of ventilation use (Heo et al., 2019; Kim et al., 2015; Loy-Benitez et al., 2020).
Operators may also wish to look beyond a simple analysis of power consumption in their ventilation system and consider the potential societal benefits of increased ventilation and improved subway air quality. One study on the SMS included a cost-benefit analysis that extended beyond the electricity required to run the tunnel ventilation system. The analysis included the capital costs of replacing fixed speed ventilation fans with variable speed fans, the operation and maintenance cost of the new fans, and the social benefits of improved subway air quality with respect to health, reduction in the amount of fossil fuel burned to generate electricity, and reduction in CO 2 emissions (Quan et al., 2018). Estimated savings (including capital, mechanical and social aspects) were calculated to be US$263,602 per station over 30 years.
Summary
- In Canada, FVSs are installed throughout subway systems as required by law as they provide ventilation during smoke hazards in emergency incidents. They also provide climate control to reduce heat buildup. Systems which require constant cooling typically have lower subway PM in summer months. In comparison, FVSs are not frequently used in systems which have a low demand for cooling.
- A forced ventilation system can improve subway air quality compared with the use of piston-driven or natural ventilation alone. However, its efficacy can depend on station design factors related to station volume.
- Each platform may have unique settings of flow direction in tunnels and platform vents as well as fan speed to obtain improved platform air quality.
- Forced ventilation was used by managers of the SMS system to meet the indoor air quality standards for PM2.5 and PM10.
- Automation and optimization of forced ventilation systems using model inputs (e.g., train schedules, measured platform and outdoor PM concentrations) has the potential to reduce the added energy costs.
4.2 Platform screen doors
Platform screen doors (PSDs) are physical barriers located on the edge of subway platforms; they simultaneously open and close with those of trains. Full PSDs extend from the floor to the ceiling, effectively separating the air spaces of the platform and track areas. They can prevent suicides and also improve energy consumption and climate control (Abdurrahman et al., 2018). In several studies, stations with full PSDs were found to have lower platform PM levels than stations without PSDs (Jung et al., 2010; Moreno et al., 2014; Pang et al., 2020; Reche et al., 2017; Son et al., 2014a).
A series of studies conducted in the SMS system shed light on the effect of PSD installation on platform and in-train PM concentrations. They provide unique insight into the relationship between PSDs and subway air quality as they present PM data before and after the installation of PSDs throughout the SMS system. The first study examined the effect of PSD installation on one platform and reported that platform levels of PM10 decreased following installation (Kim et al., 2012). No effect was observed on PM2.5. A subsequent study involved PM2.5 and PM 10 sampling of the in-train environments of the eight lines. Data were collected throughout the spring of 2008 (pre-installation) and 2010 (post-installation). Overall, in-train PM10 increased by 30% (Son et al., 2014a). As in the platform study, no effect was observed on PM2.5. Subsequent research that monitored PM2.5 and PM10 both inside and outside of subway cabins on five lines of the SMS concluded that the infiltration of PM2.5 from tunnels to trains increased after PSD installation (Lee et al., 2016). It was also observed that in-train radon levels increased (Jeon et al., 2012). Together, these findings suggest that installation of PSDs restricts the movement of subway-sourced PM from tunnels to platforms, thus increasing the tunnel and in-train PM concentrations.
Summary
- As PSDs provide a physical barrier between the platform and track areas, they have been installed in many systems for their safety benefits.
- They have been consistently shown to decrease platform PM concentrations by restricting airflow from rail areas (where subway PM is generated) to platform air spaces.
- Results from a series of studies conducted in the SMS suggest that, following PSD installation, PM levels decrease on platforms but increase in tunnels and trains.
4.3 Filtration
Several research studies have shown that filtration can reduce concentrations of PM in subway trains and on subway platforms. While this research is limited by the small number of trains/platforms, the short duration, or the laboratory setting used in most studies, it provides valuable insights on the range of approaches being explored to capture and remove PM from subway systems. It also considered several innovative hybrid approaches for particle removal.
A study conducted on one platform in the Paris metro reported a 41% reduction in platform PM2.5 at source using an electrostatic precipitator (Tokarek and Bernis, 2006). After one year of operation, a 15% reduction in filtration efficiency was observed, leading the authors to emphasize the need to periodically clean the filters. The electrostatic precipitator was weighed and found to have collected approximately three grams of dust per day. Based on this dust accumulation rate, a station volume of 8,000 m3, an air exchange rate of four changes per hour for 20 hours a day (piston-driven ventilation only, so air exchanges only took place during subway operation), the authors estimated that approximately 20 units would be needed to reduce the station PM2.5 concentration from 230 µg/m3 to 135 µg/m3 (a 50% reduction).
Electrostatic filters, which are thin electrically charged fibre filters, have been investigated in several laboratory-based and field studies. A bundle-type electrostatic filter was evaluated on a subway platform in the SMS. PM concentrations were monitored directly upstream (before) and downstream (after) of filtration. The bundle-type electrostatic filter demonstrated a maximum efficiency of 50% particle removal at a flow rate of 2.5 m/s and a pressure drop of 150 Pa (Jo et al., 2012). The addition of an electret-plated (electrostatic) filter with conventional fibre filters improved subway dust collection efficiency by about 10% without significantly increasing flow resistance (Li and Jo, 2010).
Particle removal methods which employ magnetism to attract and capture particles have been proposed as an ideal method due to the ferromagnetic properties of subway PM. The magnetic field strength of subway PM2.5 was estimated to be twice as great as that of outdoor PM2.5 in Beijing (Cui et al., 2016). In a laboratory setting, a stainless steel woven mesh with permanent magnets was used to filter fine dust PM collected from a subway (Choi et al., 2018). The study investigated filtration efficiency at varying magnetic field strengths and found that the maximum capture efficiency was 7.4%. Installing magnetic filters in fan ventilation openings was tested in an extraction ventilation system on a subway platform (Son et al., 2014b). Researchers concluded that increasing fan speed and the number of magnetic filters increased the removal efficiency of PM10 (52%), PM2.5 (46%), and PM1 (38%). While the study findings were intended to limit the escape of subway PM into ambient air though the forced ventilation systems, they demonstrated the suitability of magnetic filtration for subway PM. In a follow-up study, the efficiency of magnetic filtration was assessed on a subway platform of the SMS system (Son et al., 2019). The hybrid filtration approach utilized two mechanisms for particle capture: a magnetic filter for Fe-bearing (magnetic) particles and a cascade filter (which operates on the basis of inertial impaction) for non-magnetic particles. Results demonstrated that using both filter types in series was more effective than two magnetic filters alone. The filtration efficiency for PM10 was estimated to be 47% for hybrid magnetic and cascade filtration compared to 37% for magnetic-only filtration.
Several studies have demonstrated the potential for train HVAC systems to reduce in-train PM concentrations (Querol et al., 2012; Xu et al., 2016; Ren et al., 2022). The potential of using innovative filtration systems in trains has been evaluated in the SMS system (Kim et al., 2014). Static electricity roll filters featuring automatic filter renewal were installed on the cabin ceilings of four trains. The subway air cabin purifier (SCAP) device featured filter renewal when the back pressure reached a critical level indicating the need for filter replacement. The efficacy of the SCAP system was evaluated by comparing the in-cabin PM2.5 and PM10 concentrations of the four SCAP-equipped train cabins to an adjoining reference cabin. Data from four morning peak periods (about 80 minutes each) were used to evaluate the efficacy of the SCAP system. These surveys were conducted on Line 2 (n=2) and Line 5 (n=2). While the authors reported decreases in PM2.5 and PM10, no statistical methods were used to test for and estimate the effect of the SCAP system. However, time-series plots available in the paper show lower PM2.5 and PM10 concentrations in the SCAP train cabin. These lower PM levels of SCAP-equipped train cabins (relative to unequipped cars) were sustained throughout the 80-minute monitoring sessions. This provides some evidence that with more data and a suitable time-series statistical approach, the efficacy of this filtration system could be estimated and found effective.
Another series of studies in the SMS system investigated the potential of using train movement to drive particle collection devices installed beneath subway trains. Filtration efficiency may be enhanced by positioning air filters in these areas of high PM concentrations and near a major source of their production. A study of the airflow and particle behaviour around trains found that the highest concentration of particles was located under the subway car during operation (Lee et al., 2016). These findings were applied in a study that used a baffle dust collector coupled with a booster fan mounted under the train (Sim et al., 2018). While a field test of the device was conducted to measure airflow at various train speeds, filtration efficiency was assessed in a laboratory setting (wind tunnel). The filtration system was able to maintain a constant inlet velocity at all train speeds. Filtration efficiency was estimated to be 50% at a 7.8 µm particle size. A subsequent study combined the baffle dust collector approach with an electrostatic precipitator in one system (Woo et al., 2019). Since the electrostatic precipitator operates most efficiently at low airspeed and the baffle dust collector at high speed, this hybrid design would maximize particle collection while trains are at stations (low speeds) and in tunnels (high speeds). At inlet velocities of over 2 m/s, the authors were able to collect between 88 and 123 µg/s PM 10 and 30 to 35 µg/s PM2.5.
Summary
- While studies of subway PM filtration on platforms have demonstrated that filtration technologies can effectively capture subway PM, using them for station-wide PM reduction would require a number of units, particularly in large dual-track stations.
- Filtration efficiency can be improved by taking advantage of the ferromagnetic properties of subway PM through the use of particle removal methods that employ magnetism.
- Considering that the in-train air spaces are smaller than those of platform areas and that subway riders spend most of their time inside the train, the in-train environment may be a preferred option for filtration.
4.4 Vacuuming and washing
Several studies have reported that platform PM concentrations increase with station age (Moreno et al., 2014; Martins et al., 2016; Van Ryswyk et al., 2017). It has been suggested that these positive associations between PM concentrations and system age reflect the fact that newer stations typically feature modern ventilation systems, PSDs, and larger station design. The possibility of older stations having more accumulated dust has also been considered (Nieuwenhuijsen et al., 2007). With greater accumulated legacy dust, there would be more dust available for resuspension by train movement. As such, legacy dust could constitute a substantial proportion of subway PM.
Strategies to remove legacy dust have been explored in several systems. The impact of tunnel washing was investigated on one Taiwanese subway platform. Measurements of PM2.5 and PM10 were conducted immediately before and two and three months following a tunnel washing event (Chen et al., 2017). While the study reported decreases in both PM2.5 and PM10 in the months following the tunnel washing event, no statistical tests were performed. As well, subway PM seasonality, which is noted in several studies (Lee et al., 2016; Martins et al., 2016; Van Ryswyk et al., 2017), was not accounted for in the analysis. As the pre- and post-washing data were collected in September and December, respectively, it is likely that seasonality played a role in the differences in PM levels observed in these two time periods. Indeed, a previous study that collected summer and winter PM data observed seasonality on ten platforms of this system (Chen et al., 2016). However, although these results found seasonal patterns of platform PM, they were inconsistent across the ten platforms and two PM size fractions (PM2.5 and PM10) (Chen et al., 2017). Therefore, seasonality may have increased or attenuated the observed impact of tunnel washing.
In Health Canada’s SAQI, the use of a track-bed vacuum car did not result in reductions of platform PM2.5 concentrations (Van Ryswyk et al., 2021). This study compared the daily platform PM 2.5 concentrations before and after ten vacuuming events. These vacuuming events represented the introduction of this cleaning method to the Toronto subway system. While the main objective was to clear track-level debris to decrease the incidence of track fires, the method did not result in a reduction of platform PM2.5. This suggests that legacy dust does not represent a significant source of subway PM in the Toronto system. In addition, SAQI included the comparison of platform PM2.5 between two new stations (opened in 2017) and six older stations (opened in 1963-78) of the same line. Within one year of operation, the two new stations had attained daily PM2.5 concentrations characteristic of the older stations (Van Ryswyk et al., 2021). Similar findings were reported in a study of the Stockholm system where a newly opened station attained PM 2.5 and PM10 concentrations equal to an older station within months of operation (Cha et al., 2019). These findings indicate that subway PM2.5 is attributable to more recent emissions rather than the resuspension of accumulated legacy dust.
Summary
- The application of these approaches is typically restricted to non-service hours when PM levels are at their lowest.
- Intervention studies that assessed the potential of tunnel vacuuming and washing to lower subway PM concentrations have found a limited impact on system air quality.
- This may be related to findings indicating that subway PM consists predominantly of recently emitted dust as opposed to accumulated legacy dust.
4.5 Reducing subway PM emissions
As discussed in section 3.1, several studies have reported subway system components to be a major source of subway PM (Kang et al., 2008; Minguillón et al., 2018; Park et al., 2014b; Huang et al., 2021). This is supported by the particle size distribution and morphology of subway PM, which is characteristic of particles emitted from high temperature mechanical friction processes (Jung et al., 2012; Moreno et al., 2015, 2017a; Namgung et al., 2016; Namgung et al., 2017) and the elemental composition of subway PM which is similar to subway components such as wheels, rails, brake lining materials, electrical components, lubricants, and ballast. Combined, these sources can account for the majority of PM in a subway system. However, few studies have provided estimates of the individual contributions of these components to subway PM. In the Barcelona subway system, brakes were estimated to be the highest contributor among the three main sources of subway PM (brakes, wheels, and rails), which, together accounted for 43% to 90% of total subway PM2.5 (Minguillion et al., 2018). This indicates that reductions in brake dust production could lead to decreases in the emission of subway-sourced PM.
Several studies on reducing the emission of subway PM have focussed on braking. As most subway systems use electrical propulsion, a combination of electrical and friction braking is used to slow trains (Gunay et al., 2020). Braking is initiated by the conversion of kinetic energy to electrical energy. The electrical energy is then converted to heat energy through the use of a resistor (rheostatic braking) or returned to the system (regenerative braking). Upon slowing to ~5 km/h, friction brakes are then applied bringing the train to a complete stop (Günay et al., 2020; Moreno et al., 2015; Van Ryswyk et al., 2021). In emergency situations, friction brakes are applied at higher train speeds. A high rate of emergency brake use can significantly increase PM concentrations in a system. In 2017-2018, platform PM2.5 concentrations on Line 1 of the Toronto subway system were estimated to have increased by 50% relative to measurements taken in 2010-2011 (Van Ryswyk et al., 2021). This increase was attributed to a high rate of emergency (friction) braking (TTC, 2019; Wong, 2019). After the resolution of the issue and a resumption of regular use of friction braking, concentrations of PM2.5 decreased to below 2011 levels. In this example, the rate of PM emission was increased (and subsequently decreased) for a number of subway components including wheels, rails, lubricants, and brakes. These findings demonstrate the use of friction braking to have the potential to substantially influence subway PM2.5 concentrations.
The airborne particle characteristics of brake wear were studied in a controlled laboratory setting using a dynamometer (Wahlstrom et al., 2010). Low metallic and non-asbestos organic pads were tested with grey cast iron rotors and the emitted particles were characterized. Most particles generated were found to be in the PM2.5 size range with a bimodal distribution and were composed of iron, zinc, barium, and copper. An additional study identified nanometre-sized ferromagnetic particles, which could be the result of high temperature mechanical wear between brake surfaces (Moreno et al., 2015). Particle morphology and oxidation state captured by scanning electron microscopy and transmission electron microscopy indicate a flake-like structure and high content of carbonaceous and oxidized iron material originating from braking system components (Moreno et al., 2015, 2017a; Namgung et al., 2016; Namgung et al., 2017).
In a laboratory-based study designed to investigate subway brake emissions, the release of nanoparticles was quantified from brake discs and brake pads under various braking conditions (Namgung et al., 2016). The study demonstrated the relationship between brake temperature and particle production, noting an exponential increase when brake temperature exceeded 70°C. These results suggested that braking protocols resulting in a slower and more even application of brakes could maintain lower brake temperatures, which in turn may reduce the formation of brake dust within the subway system.
Overall, the literature on decreasing the emission of PM from subway operation and its components is limited. More research is required to determine how brake protocols and the composition of subway components (brakes, rails, wheels, lubricants, and electrical components) can impact subway air quality. The research conducted to date suggests that emissions from subway operation are a key source of PM and efforts to reduce the rate of these emissions can result in improved subway air quality. This can be achieved through decreased or gentler use of friction braking and the use of more durable brake lining material. From studies of on-road vehicles, protocols and technologies have the potential to decrease the frequency, duration, and intensity of braking. The application of these may lead to decreases in subway system PM levels, although this has not yet been evaluated in subway systems. This work has examined how brake shoe and disc materials can impact PM generation while also evaluating other factors such as capacity, noise, longevity, heat generation, and expense under a variety of standard braking conditions (Grigoratos and Martini, 2015; Blau, 2003).
Finally, an examination of the wear and replacement rates of a subway system’s consumables (wheels, rails, brake lining materials, lubricants, and electrical components) could inform an assessment of their relative contribution to subway-generated PM. With accurate estimates of their lifespan, number, and loss in mass over the course of their use, their PM emission rates could be estimated and compared. This would allow transit authorities to determine which components are contributing the most to subway PM and prioritize the reduction of their emissions. Monitoring of subway PM (discussed in the next section) could be done in conjunction with these efforts to evaluate these emission reduction strategies. This is recommended as strategy for Canadian systems seeking to reduce the emission of PM from the operation of the system.
Summary
- Emissions from the wear of subway components (wheels, rails, brake lining materials, electrical components, lubricants, and ballast) have been estimated to contribute 30-91% of subway PM.
- Few studies have been able to determine the relative contributions of these components to the total amount of PM emitted from the system.
- Performing an audit of the number, lifespan, and the loss in mass of these components during their use could provide estimates of the relative PM emission rates of these components. This could then inform which components should be prioritized in the formulation of strategies to reduce subway-sourced PM emissions.
- The use of friction brakes in bringing trains to a complete stop, as well as in emergency and hard braking situations, can be responsible for a significant proportion of subway PM, particularly in the fine-fraction range.
- The amount of PM generated during friction braking systems is dependent on brake material and force. When brake components exceed a thermal threshold (estimated in one study to be 70oC) the generation of PM increases exponentially.
- Studies of on-road vehicles show that protocols and technologies which decrease the frequency, duration, and intensity of braking have the potential to decrease PM emissions. The application of these may lead to decreases in subway system PM levels, although this has not yet been evaluated in subway systems.
4.6 Air quality monitoring
Subway air quality monitoring systems have been studied extensively in the Republic of Korea to assess attainment of air quality regulations through mitigation strategies and to maximize the energy efficiency of the FVS. Monitoring systems have been developed to evaluate the time, duration and power required to reduce high pollutant concentrations at minimal cost. First proposed and piloted in 2007, a monitoring system measured several air pollutants and environmental parameters inside and outside the FVS (Kim et al., 2010). This monitoring system initially used statistical methods to optimize ventilation operation (Kim et al., 2010; Lim et al., 2012). Over a decade, the approach was refined using machine learning (Liu and Yoo, 2016; Park et al., 2018; Liu et al., 2020; Tariq et al., 2021) and cloud computing (Jo et al., 2012). In conjunction with model improvements, studies were conducted to improve air pollution sensors and minimize data errors (Liu et al., 2012; Kim, G. S., et al., 2016; Kim, M.J., et al., 2016).
Kim et al. (2010) piloted the first subway air quality monitoring system that controlled the operation of the FVS. Pollutants (NO, NO2, NOx, PM10, PM2.5, CO, CO 2), temperature, and humidity were measured in real time inside and outside of four subway stations. Models were built using these outdoor and indoor conditions along with ridership information to predict when high PM10 and PM2.5 concentrations occur in the subway system. The authors found that station-specific models with seasonality performed better than an annual model for all stations. Lim et al. (2012) used indoor and outdoor data from a single subway station to demonstrate the effectiveness of a less computationally intensive statistical modelling method.
Kim et al. (2016) implemented monitoring of PM10, CO 2, temperature and humidity conditions in waiting rooms, platforms, tunnels, and outdoor sites in subway stations. They showed that subway air quality could be improved if ventilation systems were shut off when outdoor air quality was poor. Park et al. (2018) measured indoor and outdoor PM10 at six major subway transfer stations in the SMS. Along with ventilation rates and subway train frequency for these stations, these authors developed an artificial neural network model that outperformed a statistical modelling method for PM10 predictions.
Monitoring equipment and data undergo real-time quality control/quality assurance checks. Liu et al. (2012) developed algorithms to identify and correct common pollutant measuring equipment faults to improve the reliability of the monitoring system. Liu and Yoo (2016) proposed a machine-learning modelling method to improve measurement outlier detection. Liu et al. (2020) had further improved measurement fault corrections using more advanced statistical techniques. Overall, these studies demonstrate that monitoring equipment maintenance and data quality control/quality assurance are fundamental in sustaining confidence not only in the monitoring system but also in maintaining indoor air quality improvements and the effectiveness of the FVS.
As mentioned in the ventilation section (Section 4.1), real-time monitoring of subway PM is a necessary feedback metric used to optimize forced ventilation system operations. Systems may be designed to turn on or off taking into consideration the need for climate comfort in the subways, outdoor PM levels, and a designated threshold value of subway PM.
The benefits of routine subway air quality monitoring are also discussed in Health Canada’s SAQI study (Van Ryswyk et al., 2021). Long-term (covering 9 months) PM monitoring was necessary to evaluate the effect of system operation parameters (i.e., track bed vacuuming, train modernization, and changes in braking operation) on subway PM 2.5. The subway air quality technical guide published by the Improve Life project outlined an approach for performing a subway air quality audit (Moreno et al., 2017c). The purpose of the audit is to implement a subway air quality improvement program. The guide states that the audit begins with compiling a list of the system’s stations and categorizing each station using a range of factors known to influence subway air quality. These include information on existing station ventilation systems (forced or piston-driven), presence and position of ventilation shafts, station depth and volume, platform design (single vs. double line, central or side platforms, presence and extent of PSDs), and characteristics of the train ventilation systems. The audit should also include information on the number of curves and the gradients of each line, as well as the design factors of the trains (in-train filtration systems, brake shoe or disc type and composition). Finally, the guide suggests the use of PM monitoring methods in keeping with official standards, to facilitate comparison of the monitoring data with published guidelines. The use of low-cost sensors for the purpose of characterizing a subway’s PM concentrations is also discussed. This approach may be suitable. However, such methods should be routinely compared to a reference method for the purpose of calibration.
Summary
- The SMS presently features a sophisticated approach to subway air quality monitoring and modelling which guides the use of forced ventilation to maintain air quality standards.
- Long-term (the majority of a year) subway air quality monitoring has been used to evaluate the impact of subway system operation on subway air quality.
- Subway air quality monitoring provides information on the spatial and temporal variation of PM concentrations that is essential for supporting strategies to improve subway air quality.
- While non-standard methods of measuring subway PM can track trends in subway PM, the use of these data for comparisons with any existing standard would require routine calibration.
5.0 Conclusions
Scientific literature has noted there may be elevated levels of air pollutants in parts of subway systems in Canada and internationally which has triggered the need to assess mitigation measures. The primary air pollutant in subway systems, PM2.5, has a broad range of health effects, including asthma, lung cancer, coronary disease, heart attacks, stroke, and reduced life expectancy. This document provides an overview of subway air quality and identifies several strategies for its improvement.. There are six key areas that have been identified in scientific literature to improve subway air quality: ventilation, filtration, air quality monitoring, reducing subway PM emissions, PSDs, and vacuuming and washing. Overall, this review has provided the following information:
The following are strategies that have the potential to help improve subway air quality:
- Routinely monitoring subway air quality. This helps system managers to understand where and when high concentrations of PM occur, detect changes in subway PM concentrations, and can inform strategies to improve subway air quality.
- Operating forced (mechanical) ventilation systems rather than relying solely on piston-driven or natural ventilation.
- Automating and optimizing forced ventilation system operation based on train schedules and measured platform and outdoor PM concentrations.
- In-train filtration may be more effective at reducing commuters’ exposures than platform filtration, since station-wide PM reduction would require a substantial number of units, and commuters spend the majority of their time inside subway trains.
- Using particle removal methods which employ magnetism. This approach is ideal for iron-rich particles commonly found in subways.
- Reducing friction brake use and selecting more durable brake materials to help decrease PM generation within the system.
- Performing an audit of the wear and replacement rates of subway components (such as wheels, rails, brake lining materials, electrical components, lubricants, and ballast) to help identify the major contributors to the “subway source” of subway PM.
The costs associated with the different air quality improvement strategies are not addressed. It is recognized that while a strategy might be effective at improving subway air quality, the full extent of its application may be prohibitively expensive. It is also recognized that the measures covered in this review may not be equally effective in all subway stations, lines, and/or systems.
6.0 References
Aarnio, P., Yli-Tuomi, T., Kousa, A., Mäkelä, T., Hirsikko, A., Hämeri, K., Räisänen, M., Hillamo, R., Koskentalo, T., and Jantunen, M., 2005. The concentrations and composition of and exposure to fine particles (PM2.5) in the Helsinki subway system. Atmos. 39(28): 5059–5066.
Abdurrahman, U.T., Jack, A., and Schmid, F., 2018. Effects of platform screen doors on the overall railway system. 8th International Conference on Railway Engineering (ICRE 2018). doi:10.1049/cp.2018.0053
Adar, S.D., Filigrana, P.A., Clements, N., Peel, J.L. Ambient coarse particulate matter and human health: a systematic review and meta-analysis. Curr. Environ. Heal. Reports, 1 (2014), pp. 258-274.
American Public Transportation Association (APTA), 2019. Transit Ridership Report Fourth Quarter and End-of-Year 2018.
Bachoual, R., Boczkowski, J., Goven, D., Amara, N., Tabet, L., On, D., Leçon-Malas, V., Aubier, M., and Lanone, S., 2007. Biological effects of particles from the Paris subway system. ChemToxicol. 20(10): 1426–1433.
Blau, P., 2003. Microstructure and Detachment Mechanism of Friction Layers on the Surface of Brake Shoes. Journal of Materials Engineering and Performance 12, 56–60. doi:10.1361/105994903770343484
Braniš, M., 2006. The contribution of ambient sources to particulate pollution in spaces and trains of the Prague underground transport system. Atmos. Environ. 40(2): 348–356.
Brüne, M., Pflitsch, A., Agnew, B., and Spiegel, J. 2012. Dynamics of natural air flow inside subway tunnels. In: A. Lönnermark and H. Ingason (Eds.), Proceedings from the Fifth International Symposium on Tunnel Safety and Security, volume 1, 329–337, Borås, Sweden. SP Technical Research Institute of Sweden.
Casals, M., Gangolells, M., Forcada, N., Macarulla, M., and Giretti, A. 2014. A breakdown of energy consumption in an underground station. Energy Build. 78: 89–97. doi:10.1016/j.enbuild.2014.04.020
Cha, Y.; Olofsson, U.; Gustafsson, M.; Johansson, C. On particulate emissions from moving trains in a tunnel environment. Transport . Res. Part D Transport Environ., 59 (2018), pp. 35-45
Cha Y.,Tu M.,Elmgren M.,Silvergren S.,Olofsson U.Variation in airborne particulate levels at a newly opened underground railway station. Aerosol and Air Quality Research. 2019. 19,(4), 737 - 748.
Chen, Y. Y., Lu, C., Chen, P., Mao, I., and Chen, M., 2017. Analysis of Aerosol Composition and Assessment of Tunnel Washing Performance within a Mass Rapid Transit System in Taiwan. Aerosol Air Qual. Res. 17(6): 1527–1538.
Chen, Y. Y., Sung, F. C., Chen, M. L, Mao, I. F, and Lu, C. Y., 2016. Indoor air quality in the metro system in north Taiwan. Int. J. Environ. Res. Public Health. 13(12): 1200. doi:10.3390/ijerph13121200
Chillrud, S., Epstein, D., Ross, J., Sax, S., Pederson, D., Spengler, J., and Kinney, P., 2004. Elevated Airborne Exposures of Teenagers to Manganese, Chromium, and Iron from Steel Dust and New York City’s Subway System. Environ. Sci. Tech. 38(3): 732–737.
Choi, S. I., Feng, J., Kim, S. B., and Jo, Y. M., 2018. Magnetization of metal mesh for fine dust capture. Aerosol Air . Qual. Res. 18(7): 1932–1943. doi:10.4209/aaqr.2017.11.0491
Committee on the Medical Effects of Air Pollutants (COMEAP). Particulate Air Pollution on London Underground: Health Effects, Jan 9, 2019.
Cui, G., Zhou, L., and Dearing, J., 2016. Granulometric and magnetic properties of deposited particles in the Beijing subway and the implications for air quality management. Sci.Total Environ. 568: 1059–1068.
Cusack, M., Talbot, N., Ondráček, J., Minguillón, M., Martins, V., Klouda, K., Schwarz, J., and Ždímal, V., 2015. Variability of aerosols and chemical composition of PM10, PM2.5 and PM1 on a platform of the Prague underground metro. Atmos. Environ. 118: 176–183.
Eom, H., Jung, H., Sobanska, S., Chung, S., Son, Y., Kim, J., Sunwoo, Y., and Ro, C., 2013. Iron Speciation of Airborne Subway Particles by the Combined Use of Energy Dispersive Electron Probe X-ray Microanalysis and Raman Microspectrometry. Anal. Chem. 85(21): 10424–10431.
Figueroa-Lara, J., Murcia-González, J., García-Martínez, R., Romero-Romo, M., Torres Rodríguez, M., and Mugica-Álvarez, V., 2019. Effect of platform subway depth on the presence of Airborne PM2.5, metals, and toxic organic species. J. Hazard. Mater. 377: 427–436. doi:10.1016/j.jhazmat.2019.05.091.
Grigoratos, T., and Martini, G.,. 2015. Brake wear particle emissions: a review. Environ. Sci. Pollut. Res. 22(4): 2491–2504. doi:10.1007/s11356-014-3696-8
Günay, M., Korkmaz, M.E., and Ozmen, R., 2020. An investigation on braking systems used in railway vehicles. Eng. Science Tech. 23(2): 421–431. doi:10.1016/j.jestch.2020.01.009
Health Canada, 2012. Guidance for fine particulate matter (PM 2.5) in residential indoor air. Government of Canada.
Health Canada. 2013. Canadian Smog Science Assessment, Volume 2: Health Effects. Ottawa, ON, Canada: Health Canada.
Heo, S. K., Nam, K. J., Loy-Benitez, J., Li, Q., Lee, S. C., and Yoo, C. K., 2019. A deep reinforcement learning-based autonomous ventilation control system for smart indoor air quality management in a subway station. Energy Build. 202. doi:10.1016/j.enbuild.2019.109440
Huang, S., Chen, P., Hu, K., Qiu, Y., Feng, W., Ren, Z., Wang, X., Huang, T., and Wu, D. Characteristics and Source Identification of Fine Particles in the Nanchang Subway, China. Build. Environ. 199 (2021): 107925. doi:10.1016/j.buildenv.2021.107925.
International Tunnelling Association (ITA), 2004. Underground or Aboveground? Making the Choice for Urban Mass Transit: A Report by the International Tunnelling Association (ITA). Prepared by Working Group Number 13 (WG13). ‘Direct and Indirect Advantages ofunderground Structures.’;
James, P., Ito, K., Buonocore, J. J., Levy, J. I., and Arcaya, M. C., 2014. A health impact assessment of proposed public transportation service cuts and fare increases in Boston, Massachusetts (U.S.A.). Int. J. Environ. Res. Public Health, 11(8), 8010–8024. doi:10.3390/ijerph110808010
Jeon, J. S., Seo. J. W., Jeon, M. J., Eom, S. W., and Chae, Y. Z., 2012. Indoor Radon levels in the subway cabins of the Seoul metropolitan area. J.Korean Soc. Atmos. Environ. 28 (4): 374–383 (in Korean).
Jo, Y., Kim, W., and Park, H., 2012. Alternative filtration for management of indoor air quality in Seoul metro‐subway. The 2012 World Congress on Advances in Civil, Environmental, and Materials Research (ACEM).
Johansson, C., and Johansson, P. Å., 2003. Particulate matter in the underground of Stockholm. Atmos. Environ.. 37(1): 3–9. doi:10.1016/S1352-2310(02)00833-6
Jung, H. J., Kim, B. W., Malek, M. A., Koo, Y. S., Jung, J. H., Son, Y. S., Kim, J. C., Kim, H. K., and Ro, C. U., 2012. Chemical speciation of size-segregated floor dusts and airborne magnetic particles collected at underground subway stations in Seoul, Korea. J. Hazard. Mater. 213–214: 331–340. doi:10.1016/j.jhazmat.2012.02.006
Jung, H. J., Kim, B. W., Ryu, J. Y., Maskey, S., Kim, J. C., Sohn, J., and Ro, C. U., 2010. Source identification of particulate matter collected at underground subway stations in Seoul, Korea using quantitative single-particle analysis. Atmos. Environ. 44(19): 2287–2293. doi:10.1016/j.atmosenv.2010.04.003
Kang, S., Hwang, H., Park, Y., Kim, H., and Ro, C. U., 2008. Chemical compositions of subway particles in Seoul, Korea determined by a quantitative single particle analysis. Environ. Sci. Tech. 42(24): 9051–9057. doi:10.1021/es802267b
Kelly, F. J., and Fussell, J. C., 2015. Air pollution and public health: emerging hazards and improved understanding of risk. Environ. Geochem. and Health. 37(4): 631–649. doi:10.1007/s10653-015-9720-1
Kim, G. S., Son, Y. S., Lee, J. H., Kim, I. W., Kim, J. C., Oh, J. T., and Kim, H., 2016. Air Pollution Monitoring and Control System for Subway Stations Using Environmental Sensors. J.Sensors. doi:10.1155/2016/1865614
Kim, J. B., Kim, S., Lee, G. J., Bae, G. N., Cho, Y., Park, D., Lee, D. H, and Kwon, S. B. 2014. Status of PM in Seoul metropolitan subway cabins and effectiveness of subway cabin air purifier (SCAP). Clean Technol. Environ. Policy. 16(6): 1193–1200.
Kim, K. H., Ho, X. D., Jeon, J. S., and Kim, J. C., 2012. A noticeable shift in particulate matter levels after platform screen door installation in a Korean subway station. Atmos. Environ., 49: 219–223.
Kim, M., Braatz, R. D., Kim, J. T., and Yoo, C., 2015. Indoor air quality control for improving passenger health in subway platforms using an outdoor air quality dependent ventilation system. Build. Environ. 92(C) 407–417. doi:10.1016/j.buildenv.2015.05.010
Kim, M. J., Braatz, R. D., Kim, J. T., and Yoo, C. K., 2016. Economical control of indoor air quality in underground metro station using an iterative dynamic programming-based ventilation system. Indoor Built Environ., 25 (6): 949–961.
Kim, M. K., Jang, Y., and Park, D., 2020. Determination of the optimum removal efficiency of fine particulate matter using activated carbon fiber (Acf). Int. J. Env. Res. Public Health. 17(20): 1–10.
Kim, Y. S, Kim, J. T., Kim, I. W., Kim, J. C., and Yoo, C., 2010. Multivariate monitoring and local interpretation of indoor air quality in Seoul's metro system. Environ. Eng. Sci. 27(9): 721–731. doi:10.1089/ees.2009.0261
International Association of Public Transport (UITP), 2019. Metros: The Backbone of Mobile Communities and Sustainable Cities. UITP (International Association of Public Transport), pp. 1-6.
Korean Ministry of the Environment (KMOE). Korean Indoor Air Quality Control Act, Amendment No. 15583 (2005)
Korean Ministry of the Environment (KMOE). Strict management of indoor air quality in public transportation such as subways. Press/Explanation. Published April 2, 2020. [accessed September 4, 2021].
Lee, S., Kim, M. J., Pyo, S. H., Kim, J. T., and Yoo, C. K., 2015. Evaluation of an optimal ventilation IAQ control strategy using control performance assessment and energy demand. Energy Build. 98: 134–143. doi:10.1016/j.enbuild.2014.08.040
Lee, E. S., Lee, T. J., Park, M. B., Park, D., Kim, S. D., and Kim, D. S., 2016. The size-oriented particulate mass ratios and their characteristics on the Seoul metropolitan subway lines. Asian J. Atmos. Environ. 10(4): 217–225.
Lee, K. R., Kim, W. G., Woo, S. H., Kim, J. B., Bae, G. N., Park, H. K., Yoon, H., and Yook, S. J., 2016. Investigation of airflow and particle behavior around a subway train running in the underground tunnel. Aerosol Sci. Tech. 50(7): 669–678.
Lee, Y., Lee, Y. C., Kim, T., Choi, J. S., and Park, D., 2018. Sources and Characteristics of Particulate Matter in Subway Tunnels in Seoul, Korea. Int. J. Environ. Res. Public Health, 15 (11) : 2534.
Li, K. and Jo, Y. M., 2010. Dust collection by a fiber bundle electret filter in an MVAC system. Aerosol Sci. Technol. 44(7): 578–587.
Li, S., Liu, Y., Purevjav, A. O., and Yang, L., 2019. Does Subway Expansion Improve Air Quality? J. Env. Econ. Manag. 96: 213–235. doi:10.1016/j.jeem.2019.05.005.
Lim, J. J., Kim, Y. S., Oh, T. S., Kim, M. J., Kang, O. Y., Kim, J. T., Kim, I. W., Kim, J. C., Jeon, J. S., and Yoo, C. K., 2012. Analysis and prediction of indoor air pollutants in a subway station using a new key variable selection method. Korean J. Chem. Eng., 29(8): 994-1003.
Liu, H., Lee, S., Kim, M., Shi, H., Kim, J. T., Wasewar, K. L., and Yoo, C., 2013. Multi-objective optimization of indoor air quality control and energy consumption minimization in a subway ventilation system. Energy Build., 66: 553–561.
Liu, H., Kim, M., Kang, O., Sankararao, B., Kim, J., Kim, J. C., and Yoo, C. K., 2012. Sensor validation for monitoring indoor air quality in a subway station. Indoor Built Environ. 21(1): 205–211.
Liu, H., Yang, C., Huang, M., and Yoo, C. K., 2020. Multivariate statistical monitoring of subway indoor air quality using dynamic concurrent partial least squares. Environ. Sci. Pollut. Res. 27(4): 4159–4169.
Liu, H., and Yoo, C., 2016. A robust localized soft sensor for particulate matter modeling in Seoul metro systems. J. Hazard. Mater. 305: 209–218.
Lovett, C., Shrmohammadi, F., Sowlat, M., Sioutas, C, 2017. Commuting in Los Angeles: Cancer and Non-Cancer Health Risks of Roadway Light-Rail and Subway Transit Routes. Aerosol and Air Quality Research. ISSN:1680-8584.
Loxham, M., Cooper, M. J., Gerlofs-Nijland, M. E., Cassee, F. R., Davies, D. E., Palmer, M. R., and Teagle, D. A. H., 2013. Physicochemical characterization of airborne particulate matter at a mainline underground railway station. Environ. Sci. Tech. 47(8): 3614–3622. doi:10.1021/es304481m
Loxham, M., and Nieuwenhuijsen, M. J, 2019. Health effects of particulate matter air pollution in underground railway systems – A critical review of the evidence. Part. Fibre Toxicol. 16(1). doi:10.1186/s12989-019-0296-2
Loy-Benitez, J., Li, Q., Ifaei, P., Nam, K., Heo, S., Yoo, C., 2018. A dynamic gain-scheduled ventilation control system for a subway station based on outdoor air quality conditions. Building and Environment 144, 159–170.
Loy-Benitez, J., Heo, S. K., and Yoo, C. K., 2020. Imputing missing indoor air quality data via variational convolutional autoencoders: Implications for ventilation management of subway metro systems. Build. Environ. 182. doi:10.1016/j.buildenv.2020.107135
Loy-Benitez, J., Li, Q., Nam, K., Nguyen, H.T., Kim, M., Park, D., Yoo, C., 2021. Multi-objective optimization of a time-delay compensated ventilation control system in a subway facility – A harmony search strategy. Building and Environment 190.
Luglio, D. G., Katsigeorgis, M., Hess, J., Kim, R., Adragna, J., Raja, A., Gordon, C., Fine, F., Thurston, G., Gordon, T., and Vilcassim, M. J. R., 2021. PM2.5 Concentration and Composition in Subway Systems in the Northeastern United States. Environ.Health Perspect. 129(2): 027001. doi:10.1289/ehp7202.
Martins, V., Moreno, T., Mendes, L., Eleftheriadis, K., Diapouli, E., Alves, C. A., Duarte, M., de Miguel, E., Capdevila, M., Querol, X., and Minguillón, M. C., 2016. Factors controlling air quality in different European subway systems. Environ. Res. 146: 35–46. doi:10.1016/j.envres.2015.12.007
Martins, V., Moreno, T., Minguillón, M. C., Amato, F., de Miguel, E., Capdevila, M., and Querol, X., 2015. Exposure to airborne particulate matter in the subway system. Sci. Total Environ. 511: 711–722. doi:10.1016/j.scitotenv.2014.12.013
Matz, C., Stieb, D., Davis, K., Egyed, M., Rose, A., Chou, B., and Brion, O., 2014. Effects of age, season, gender and urban-rural status on time-activity: Canadian Human Activity Pattern Survey 2 (CHAPS 2). Int. J. Environ. Res. Public Health. 11(2): 2108–2124.
Minguillón, M. C., Reche, C., Martins, V., Amato, F., de Miguel, E., Capdevila, M., Centelles, S., Querol, X., and Moreno, T., 2018. Aerosol sources in subway environments. Environ. Res. 167: 314–328. doi:10.1016/j.envres.2018.07.034
Moreno, T., Pérez, N., Reche, C., Martins, V., de Miguel, E., Capdevila, M., Centelles, S., Minguillón, M. C., Amato, F., Alastuey, A., Querol, X., and Gibbons, W., 2014. Subway platform air quality: Assessing the influences of tunnel ventilation, train piston effect and station design. Atmos. Environ. 92: 461–468. doi:10.1016/j.atmosenv.2014.04.043
Moreno, T., Martins, V., Querol, X., Jones, T., BéruBé, K., Minguillón, M. C., Amato, F., Capdevila, M., de Miguel, E., Centelles, S., and Gibbons, W., 2015. A new look at inhalable metalliferous airborne particles on rail subway platforms. Sci. Total Environ. 505: 367–375. doi:10.1016/j.scitotenv.2014.10.013
Moreno, T., Querol, X., Martins, V., Minguillón, M. C., Reche, C., Ku, L. H., Eun, H. R., Ahn, K. H., Capdevila, M., and De Miguel, E., 2017a. Formation and alteration of airborne particles in the subway environment. Environ. Sci. Process. Impacts. 19(1). doi:10.1039/c6em00576d
Moreno, T., Reche, C., Minguillón, M. C., Capdevila, M., de Miguel, E., and Querol, X., 2017b. The effect of ventilation protocols on airborne particulate matter in subway systems. Sci. Total Environ. 584–585: 1317–1323. doi:10.1016/j.scitotenv.2017.02.003
Moreno, T., Reche, C., Minguillón, MC., Querol, X., Martins, V., Amato, F., Pérez, N., Bartolí, R., Cabanas, M., Martínez, S., Vasconcelos, C., de Miguel, E., Capdevila, M., Centelles, S., Pellot, M. (2017c). Improving air quality in the subway environment: Technical Guide. (T. Moreno, Ed.).ISBN: 978-84-697-5167-1, 48 pp. Barcelona, Spain.
Moreno, T., and de Miguel, E., 2018. Improving air quality in subway systems: An overview. Environ Pollut. 239: 829–831. doi:10.1016/j.envpol.2018.01.077
Namgung, H. G, Kim, J. B., Woo, S. H., Park, S., Kim, M., Kim, M. S., Bae, G. N., Park, D., and Kwon, S. B., Generation of nanoparticles from friction between railway brake disks and pads. Environ. Sci. Tech. 50(7): 3453–3461. doi:10.1021/acs.est.5b06252
Namgung, H. G., Kim, J. B., Kim, M. S., S., Woo, S. H., Bae, G. N., Park, D., Kwon, S. B., 2017. Size distribution analysis of airborne wear particles released by subway brake system. Wear. 372–373: 169-176.
National Fire Protection Association (NFPA), 2020. NFPA 130 Standard for Fixed Guideway Transit and Passenger Rail Systems. 2020 Edition.
Nieuwenhuijsen, M. J., Gomez-Perales, J. E., and Colvile, R. N., 2007. Levels ́of particulate air pollution, its elemental composition, determinants and health effects in metro systems. Atmos. Environ. 41, 7995−8006.
Pan, S., Fan, L., Liu, J., Xie, J., Sun, Y., Cui, N., Zhang, L., and Zheng, B., 2013. A Review of the Piston Effect in Subway Stations. Adv. Mech. Eng. 5. doi:10.1155/2013/950205
Pang, L., Yang, C., Cao, X., Tian, Q., and Li, B., 2020. Experimental Investigation of Air Quality in a Subway Station with Fully Enclosed Platform Screen Doors. Int. J. Env. Res.Public Health. 17(14). doi:10.3390/ijerph17145213
Park, D., Lee, T., Hwang, D., Jung, W., Lee, Y., Cho, K., Kim, D., and Lee, K., 2014a. Identification of the sources of PM10 in a subway tunnel using positive matrix factorization. J. Air Waste Manag. Assoc. 64(12): 1361–1368. doi:10.1080/10962247.2014.950766
Park, J. H., Woo, H. Y., and Park, J., C., 2014b. Major factors affecting the aerosol particulate concentration in the underground stations. Indoor Built Environ. 23(5): 629–639. doi:10.1177/1420326X12466875
Park, S., Kim, M., Kim, M., Namgung, H. G., Kim, K. T., Cho, K. H., and Kwon, S. B., 2018. Predicting PM10 concentration in Seoul metropolitan subway stations using artificial neural network (ANN). J. Hazard. Mater., 341: 75–82. doi:10.1016/j.jhazmat.2017.07.050
Park, J. H., Son, Y. S., and Kim, K. H., 2019. A review of traditional and advanced technologies for the removal of particulate matter in subway systems. Indoor Air. 29(2): 177–191. doi:10.1111/ina.12532
Quan, J., Kim, S. H., and Kim, J. H., 2018. A study on probabilistic social cost–benefit analysis to introduce high-efficiency motors into subway station ventilation. Energy Policy. 121C: 92–100.
Querol, X., Moreno, T., Karanasiou, A., Reche, C., Alastuey, A., Viana, M., Font, O., Gil, J., De Miguel, E., and Capdevila, M., 2012. Variability of levels and composition of PM10 and PM2.5 in the Barcelona metro system. Atmos. Chem. Phys. 12(11): 5055–5076. doi:10.5194/acp-12-5055-2012
Reche, C., Moreno, T., Martins, V., Minguillón, M. C., Jones, T., de Miguel, E., Capdevila, M., Centelles, S., and Querol, X., 2017. Factors controlling particle number concentration and size at metro stations. Atmos. Environ. 156, 169–181. doi:10.1016/j.atmosenv.2017.03.002
Ren, J., He, J., Kong, X., Xu, W., Kang, Y., Yu, Z., Li, H. A field study of CO2 and particulate matter characteristics during the transition season in the subway system in Tianjin, China. 2022. Energy and Buildings 254, 111620.
Saunders, B. M., Smith, J. D., Smith T. E. L., Green, D. C., and Barratt, B., 2019. Spatial variability of fine particulate matter pollution (PM2.5) on the London Underground network. Urban Clim. 30 (1–3). doi:10.1016/j.uclim.2019.100535
Seaton, A., Cherrie, J., Dennekamp, M., Donaldson, K., Hurley, J. F., and Tran, C. L., 2005. The London Underground: Dust and hazards to health. Occup. Environ. Med. 62: 355–362
Sim, J. B., Woo, S. H., Yook, S. J., Kim, J. B., Bae, G. N., and Oh, S. G., 2018. Baffle dust collector for removing particles from a subway tunnel during the passage of a train. J. Mech. Sci. Tech. 32(3): 1415–1421. doi:10.1007/s12206-018-0245-2
Smith J. D., Barratt, B. M., Fuller, G. W., Kelly, F. J., Loxham, M., Nicolosi, M., Priestman, M., Tremper, A. H., and Green, D. C., 2020. PM 2.5 on the London Underground. Environ. Int. 134. doi:10.1016/j.envint.2019.105188
Societe du Transport du Montreal (STM). 2012. A Breath of Air for the Metro - YouTube. Retrieved September 3, 2021. Published Online: 25 Jan 2012.
Son, Y. S., Salama, A., Jeong, H. S., Kim, S., Jeong, J. H., Lee, J., Sunwoo, Y., and Kim, J. C., 2013. The effect of platform screen doors on PM10 levels in a subway station and a trial to reduce PM10 in tunnels. Asian J. Atmos. Environ., 7 (1).
Son, Y. S., Jeon, J. S., Lee, H. J., Ryu, I. C., and Kim, J. C., 2014a. Installation of platform screen doors and their impact on indoor air quality: Seoul subway trains. J. Air Waste Manag. Assoc. 64(9): 1054–1061. doi:10.1080/10962247.2014.923350
Son, Y. S., Dinh, T. V., Chung, S. G., Lee, J. H., and Kim, J. C., 2014b. Removal of particulate matter emitted from a subway tunnel using magnetic filters. Environ. Sci. Tech. 48(5): 2870–2876. doi:10.1021/es404502x
Son, Y., and Ryu, J., 2018. Technological advances for particulate matter collection in subway system. KIC News, 21(2): 24–34.
Son, Y. S., Oh, Y. H., Choi, I. Y., Dinh, T. V., Chung, S. G., Lee, J., Park, D., and Kim, J. C., 2019. Development of a Magnetic Hybrid Filter to Reduce PM10 in a Subway Platform. J. Hazard. Mater. 368: 197–203. doi:10.1016/j.jhazmat.2019.01.045.
Song, J., Lee, H., Kim, S. D., and Kim, D. S., 2008. How about the IAQ in subway environment and its management? Asian J. Atmos. Environ. 2: 60–67.
Statistics Canada. 2017. Census in Brief: Commuters using sustainable transportation in census metropolitan areas. Statistics Canada Catalogue no. 98-200-X. Ottawa. Release date: November 29, 2017. Ottawa (accessed on 21 October, 2021).
Tariq, S., Loy-Benitez, J., Nam, K., Lee, G., Kim, M., Park, D., and Yoo, C., 2021. Transfer learning driven sequential forecasting and ventilation control of PM2.5 associated health risk levels in underground public facilities. J. Hazard. Mater. 406. doi:10.1016/j.jhazmat.2020.124753.
Tokarek, S., and Bernis, A., 2006. An example of particle concentration reduction in Parisian subway stations by electrostatic precipitation. Environ. Tech. 27(11): 1279–1287. doi:10.1080/09593332708618746
Toronto Public Health, 2020. Subway Health Impacts Study.
Toronto Transit Commission, 2019. Reducing Subway Wheel Flats Line 2: Community Update.
Transport for London (TfL), 2013. Air Quality on the Underground. [online]
Transport for London (TfL), 2017. Mayor Launches Plan to Improve Air Quality on the Tube. [online]
United States Environmental Protection Agency (US EPA), 2009. Integrated Science Assessment (ISA) for Particulate Matter (final report, December 2009). Washington, DC, EPA/600/R-19/188, 2019.
Van Ryswyk, K., Anastasopolos, A., Evans, G., Sun, L., Sabaliauskas, K., Kulka, R., Wallace, L., and Weichenthal, S., 2017. Metro Commuter Exposures to Particulate Air Pollution and PM2.5-Associated Elements in Three Canadian Cities: The Urban Transportation Exposure Study. Environ. Sci. Tech., 51(10): 5713–5720. doi:10.1021/acs.est.6b05775
Van Ryswyk, K., Kulka, R., Marro, L., Yang, D., Toma, E., Mehta, L., McNeil-Taboika, L., and Evans, G., 2021. Impacts of Subway System Modification on Air Quality in Subway Platforms and Trains. Environ. Sci. Tech. 55(16): 11133–11143. doi:10.1021/acs.est.1c00703
Wahlström, J., Olander, L., and Olofsson, U., 2010. Size, Shape, and Elemental Composition of Airborne Wear Particles from Disc Brake Materials. Tribol. Lett. 38: 15–24. doi:10.1007/s11249-009-9564-x
Wen, Y., Leng, J., Shen, X., Han, G., Sun, L., and Yu, F., 2020. Environmental and health effects of ventilation in subway stations: A literature review. Int. J. Environ. Res. Public Health. 17(3): 1084. MDPI AG. doi:10.3390/ijerph17031084
Wong, R., 2019. Line 2 (Bloor-Danforth) Wheel Flats Update. Toronto Transit Comission.
Woo, S. H., Cheon, T. W., Lee, G., Kim, J. B., Bae, G. N., Kwon, S. B., Jang, H. R., and Yook, S. J., 2019. Performance evaluation of a hybrid dust collector for removing particles during subway train operation. Aerosol Sci. Technol. 53(5): 562–574. doi:10.1080/02786826.2019.1578333
Xu, B., and Hao, J., 2017. Air quality inside subway metro indoor environment worldwide: A review. Environ. Int. 107: 33–46. doi:10.1016/j.envint.2017.06.016
Xu, B., Yu, X., Gu, H., Miao, B., Wang, M., and Huang, H., 2016. Commuters’ exposure to PM2.5 and CO2 in metro carriages of Shanghai metro system. Trans. Res.D: Transp. Environ. 47: 162–170. doi:10.1016/j.trd.2016.05.001
Yang, J., Chen, S., Quin, P., Lu, F., and Liu, A., 2018. The Effect of Subway Expansions on Vehicle Congestion: Evidence from Beijing. J. Env. Econ. Manag. 88: 114–33. doi:10.1016/j.jeem.2017.09.007.
Zhao, L., Wang, J., Gao, H.O., Xie, Y., Jiang, R., Hu, Q., and Sun, Y., 2017. Evaluation of particulate matter concentration in Shanghai’s metro system and strategy for improvement. Trans. Res. D: Transp. Environ. 53: 115–127.
Zhao, Q., Xiao, Y., Lin, J., Mao, H., Zeng, Z., and Liu, Y., 2021. Measurement-based evaluation of the effect of an over-track-exhaust ventilation system on the particulate matter concentration and size distribution in a subway. Tunn. Undergr. Sp. Tech. 109: 103772.
Annex A – Subway PM2.5 maps
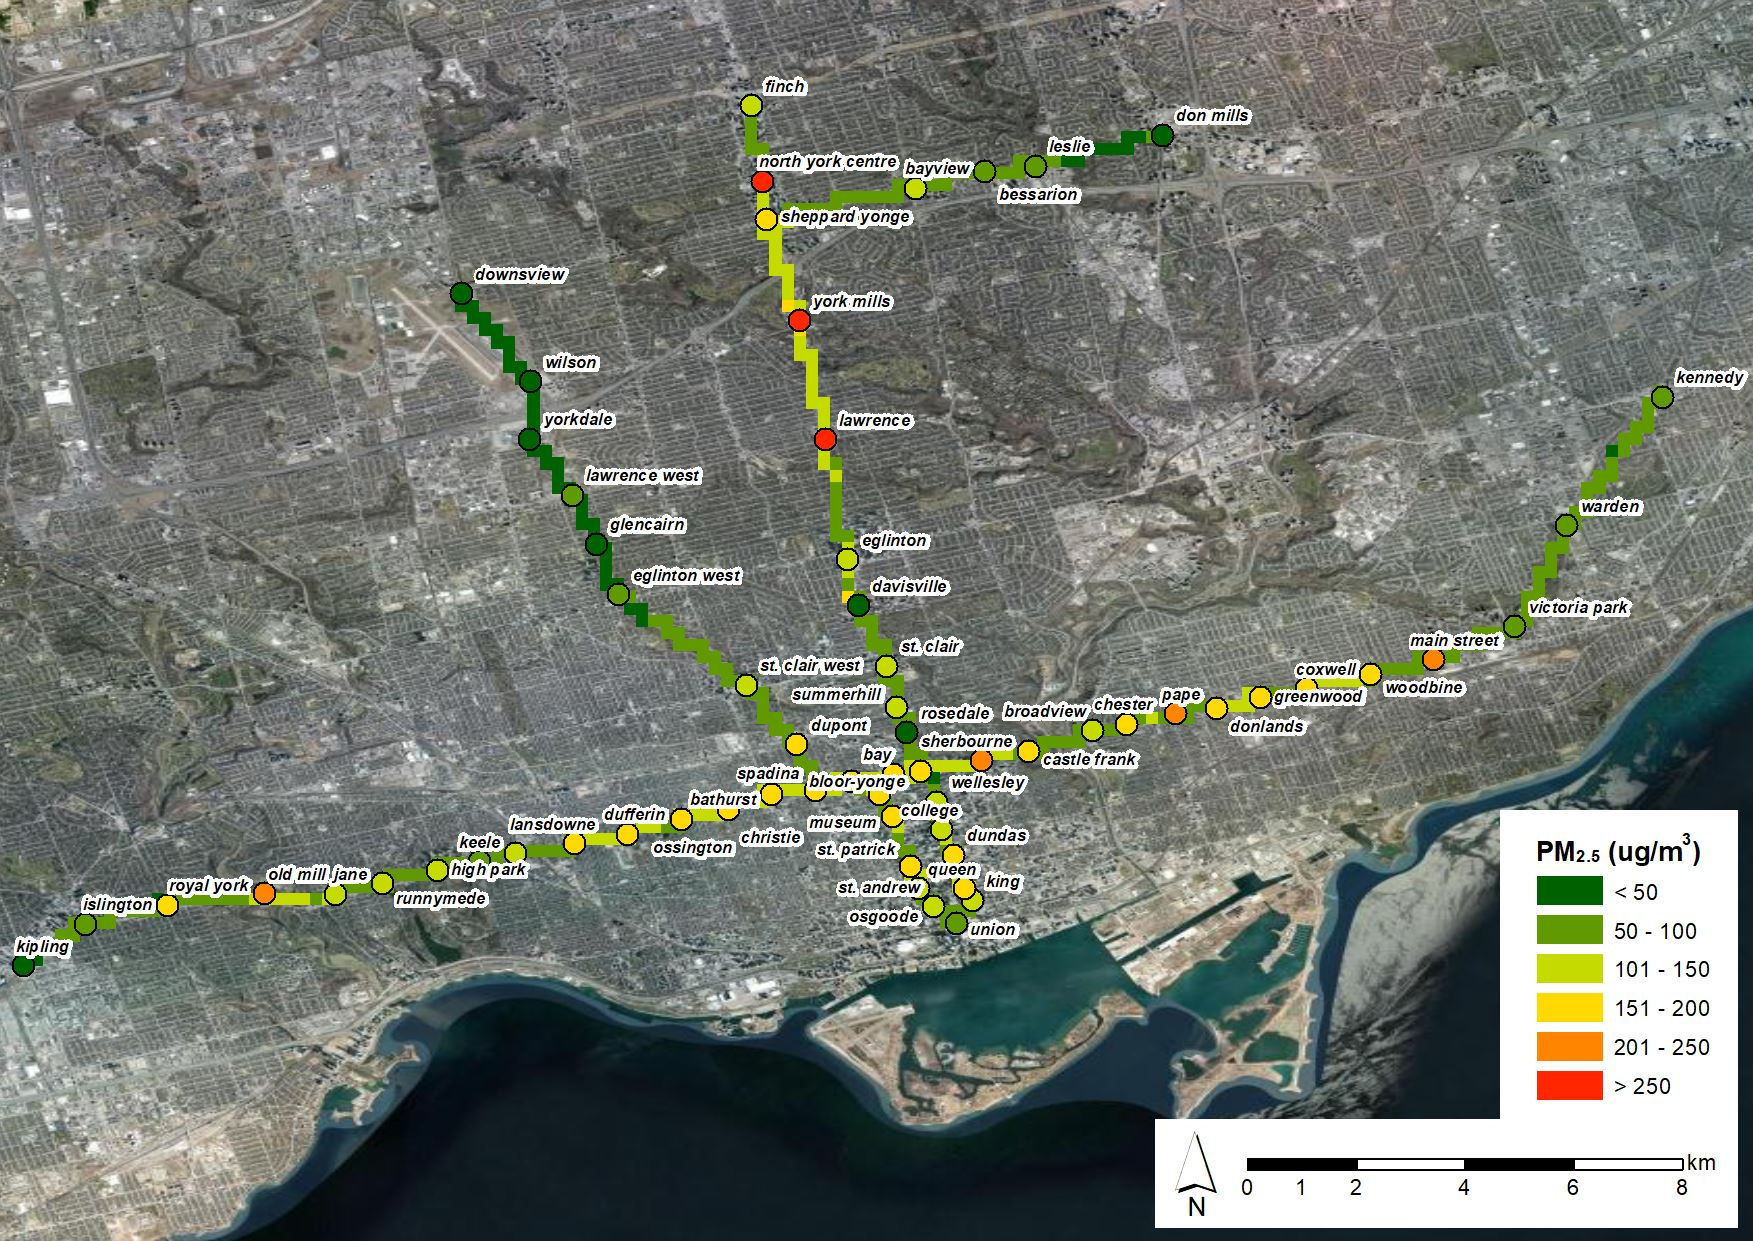
Figure A1 - Text description
Figure A1 depicts a map of the Toronto Subway system. There are circles representing each station and lines representing the rail lines between each station. Each segment of rail and station is coloured according to the level of PM2.5 measured in the study, which ranges from "<50" to ">250" µg/m3. There are six shades of colour from green (<50 µg/m3) to red (>250 µg/m3). The Toronto subway system exhibits a wide range of PM2.5 across its stations and rail lines. Throughout the system, the sections which are above-ground are seen in green (<50 µg/m3) while the extensively underground sections of the system are yellow (151-200 µg/m3), orange (201-250 µg/m3), and red (>250 µg/m3).
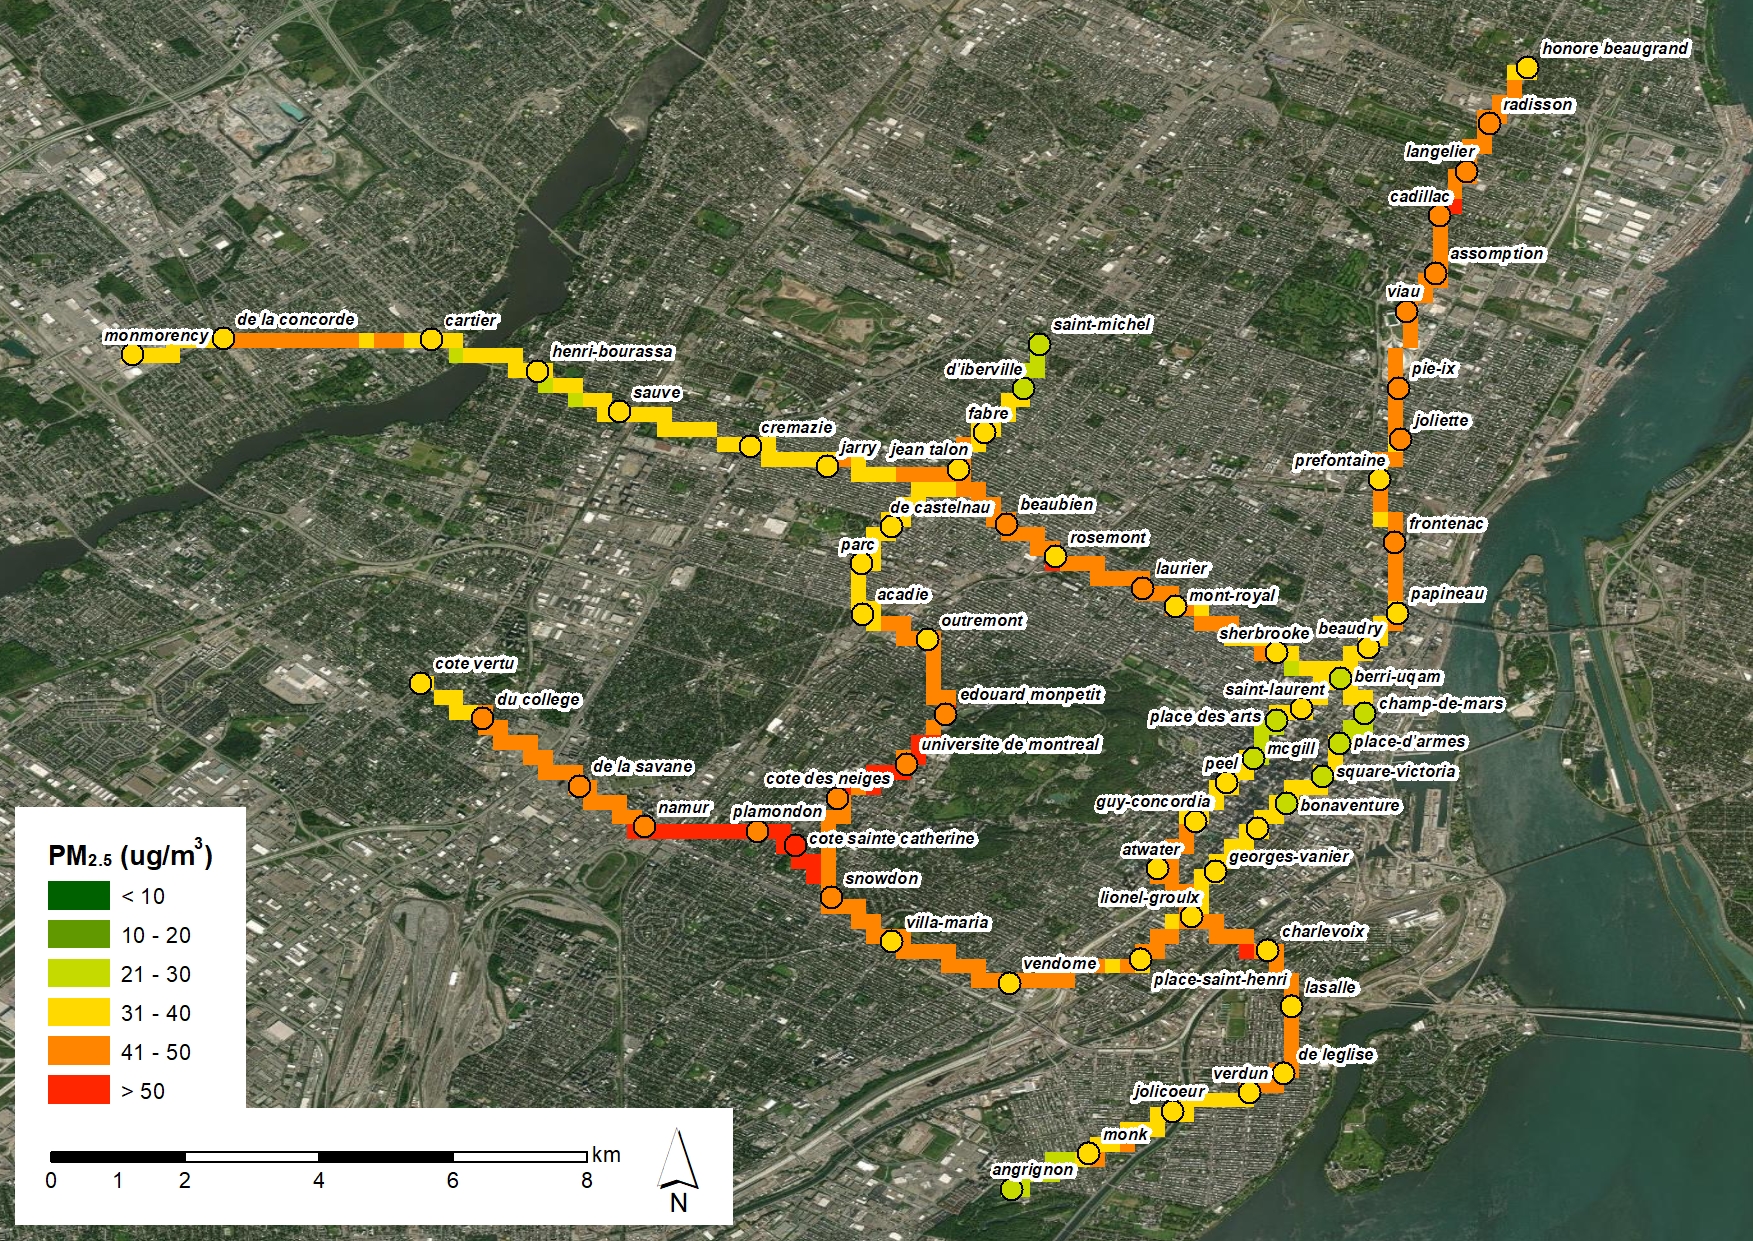
Figure A2 - Text description
Figure A2 depicts a map of the Montreal metro. There are circles representing each station and lines representing the rail lines between each station. Each segment of rail and station is coloured according to the level of PM2.5 measured in the study, which ranges from "<10" to ">50" µg/m3. There are six shades of colour from green (<10 µg/m3) to red (>50 µg/m3). The Montreal metro exhibits a fairly even levels of PM2.5 across its stations and rail lines. Throughout the system, the orange and yellow colours corresponding to 41-50 µg/m3 and 31-40 µg/m3 are seen, respectively.
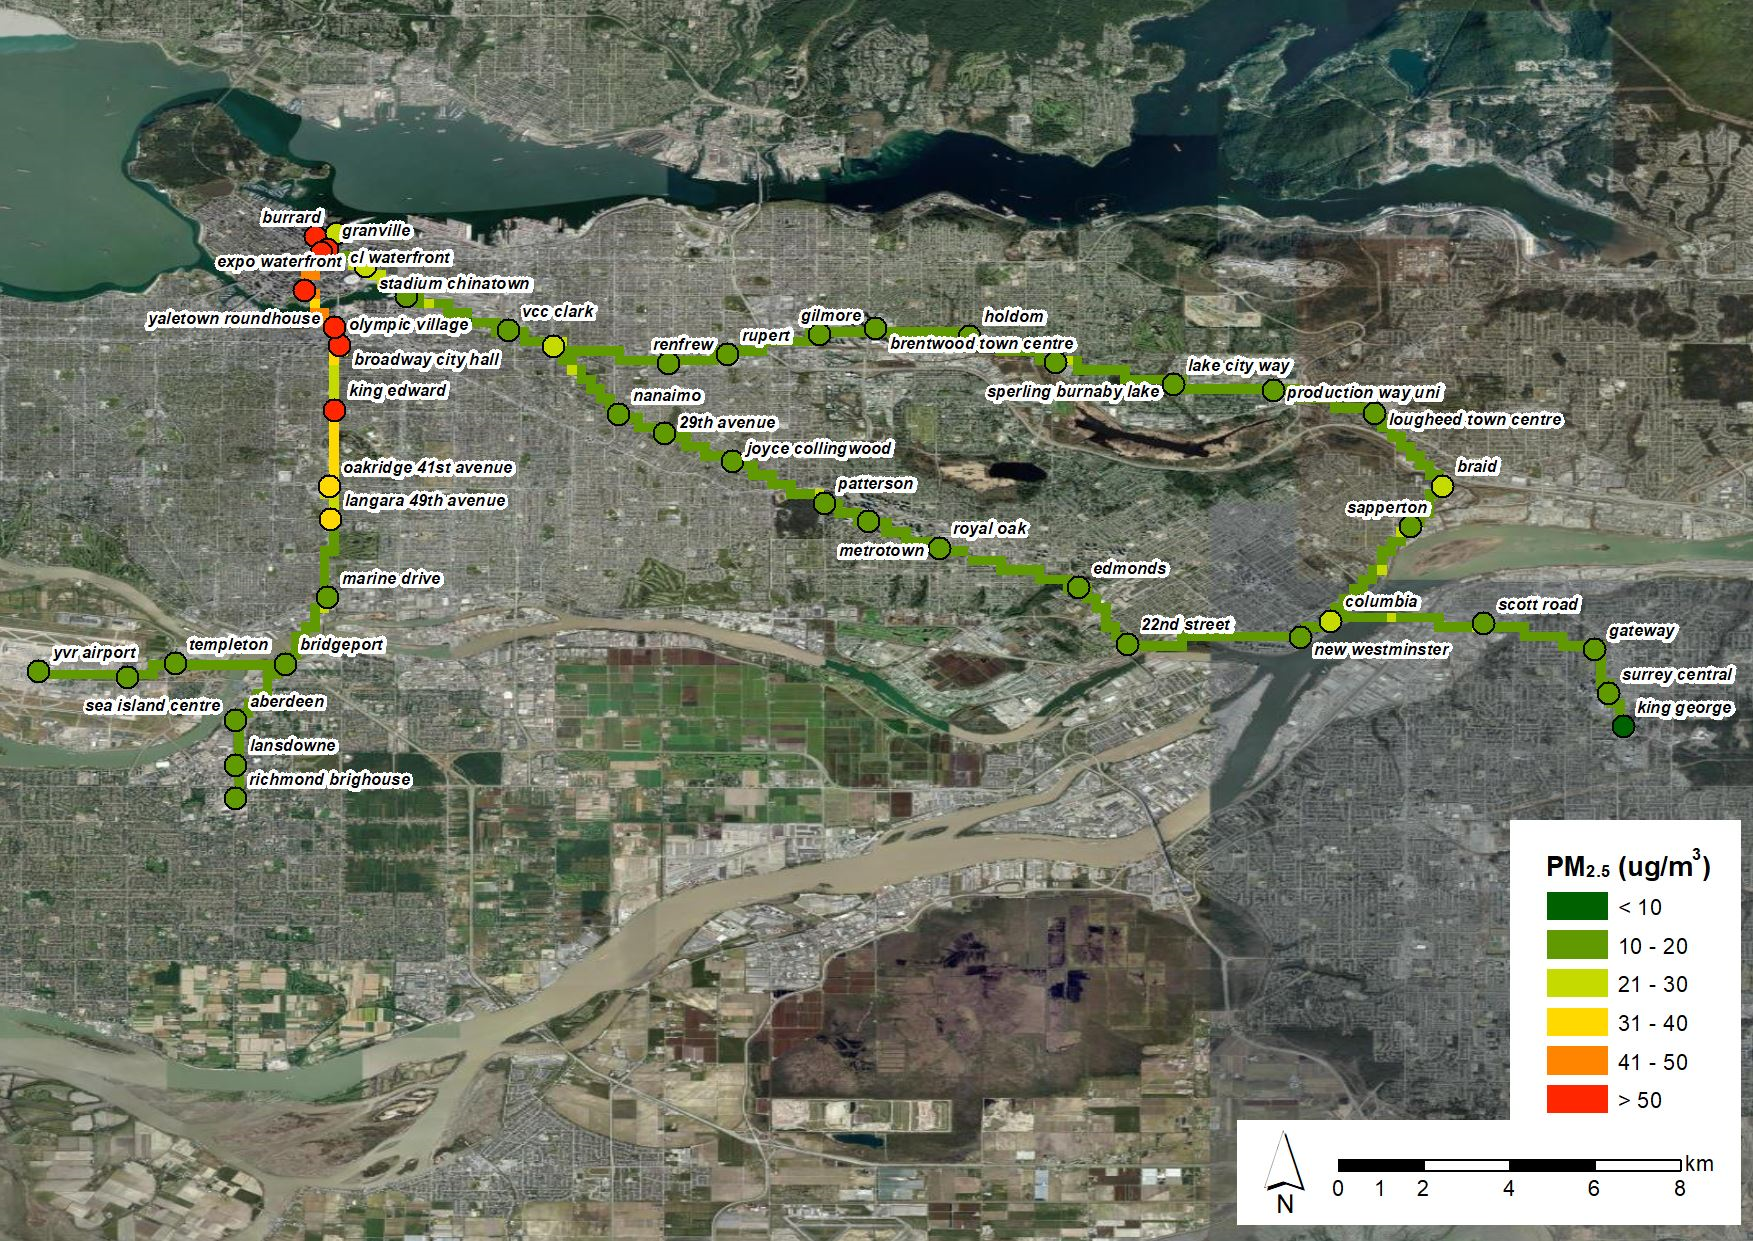
Figure A3 - Text description
Figure A3 depicts a map of the Vancouver "SkyTrain" urban rail system. There are circles representing each station and lines representing the rail lines between each station. Each segment of rail and station is coloured according to the level of PM2.5 measured in the study, which ranges from "<10" to ">50" µg/m3. There are six shades of colour from green (<10 µg/m3) to red (>50 µg/m3 ). The Vancouver system exhibits a wide range of PM2.5 across its stations and rail lines. Throughout the system, the sections which are elevated are seen in green (<10 µg/m3) while the underground sections of the system closer to downtown are red (>50 µg/m3 ).
Page details
- Date modified: