
FluWatch report: August 25 to September 7, 2019 (weeks 35 and 36)
Download the alternative format
(PDF format, 977 KB, 10 pages)
Organization: Public Health Agency of Canada
Date published: 2019-09-13
Related Topics
Overall Summary
- Influenza activity remains at interseasonal levels across the country.
- The majority of regions in Canada are reporting no influenza activity.
- Influenza A continues to be the most common influenza virus circulating in Canada.
- This is the first FluWatch report of the 2019-2020 influenza surveillance season. The next report will be published on September 27, 2019. Weekly reporting of laboratory detections of respiratory viruses continues via our Respiratory Virus Detections Surveillance System.
On this page
- Influenza/ILI Activity (geographic spread)
- Laboratory Confirmed Influenza Detections
- Syndromic/Influenza-like Illness Surveillance
- Participatory Syndromic Surveillance
- Influenza Outbreak Surveillance
- Severe Outcomes Influenza Surveillance
- Influenza Strain Characterizations
- Antiviral Resistance
- Vaccine Monitoring
- Provincial and International Influenza Reports
Influenza/Influenza-like Illness Activity (geographic spread)
During week 36, the following influenza activity levels were reported (Figure 1):
- 26% of regions reported sporadic activity. The majority (82%) of regions reported the same level of influenza activity in week 36 as reported in the previous FluWatch report (week 34).
- Sporadic activity was reported in regions of YT, BC, AB, ON and QC.
Figure 1 – Map of overall influenza/ILI activity by province and territory, Canada, week 2019-36
Number of Regions Reporting in Week 36: 50 out of 53
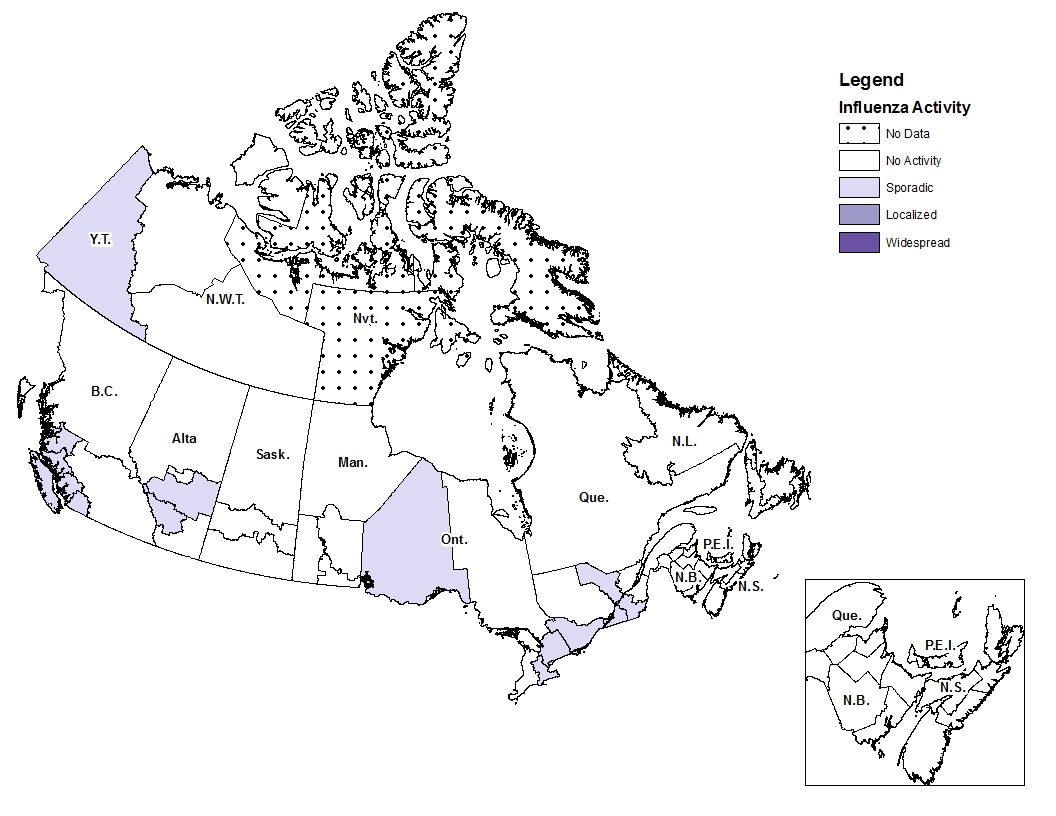
Figure 1 - Text equivalent
| Province | Influenza Surveillance Region | Activity Level |
|---|---|---|
| N.L. | Eastern | No Activity |
| N.L. | Labrador-Grenfell | No Activity |
| N.L. | Central | No Activity |
| N.L. | Western | No Activity |
| P.E.I. | Prince Edward Island | No Activity |
| N.S. | Zone 1 - Western | No Activity |
| N.S. | Zone 2 - Northern | No Activity |
| N.S. | Zone 3 - Eastern | No Activity |
| N.S. | Zone 4 - Central | No Activity |
| N.B. | Region 1 | No Activity |
| N.B. | Region 2 | No Activity |
| N.B. | Region 3 | No Activity |
| N.B. | Region 4 | No Activity |
| N.B. | Region 5 | No Activity |
| N.B. | Region 6 | No Activity |
| N.B. | Region 7 | No Activity |
| Que. | Nord-est | Sporadic |
| Que. | Québec et Chaudieres-Appalaches | No Activity |
| Que. | Centre-du-Québec | No Activity |
| Que. | Montréal et Laval | Sporadic |
| Que. | Ouest-du-Québec | No Activity |
| Que. | Montérégie | Sporadic |
| Ont. | Central East | Sporadic |
| Ont. | Central West | No Activity |
| Ont. | Eastern | No Activity |
| Ont. | North East | No Activity |
| Ont. | North West | Sporadic |
| Ont. | South West | Sporadic |
| Ont. | Toronto | Sporadic |
| Man. | Northern Regional | No Activity |
| Man. | Prairie Mountain | No Activity |
| Man. | Interlake-Eastern | No Activity |
| Man. | Winnipeg | No Activity |
| Man. | Southern Health | No Activity |
| Sask. | North | No Activity |
| Sask. | Central | No Activity |
| Sask. | South | No Activity |
| Alta. | North Zone | No Activity |
| Alta. | Edmonton | Sporadic |
| Alta. | Central Zone | Sporadic |
| Alta. | Calgary | No Activity |
| Alta. | South Zone | No Activity |
| B.C. | Interior | No Activity |
| B.C. | Fraser | Sporadic |
| B.C. | Vancouver Coastal | Sporadic |
| B.C. | Vancouver Island | Sporadic |
| B.C. | Northern | No Activity |
| Y.T. | Yukon | Sporadic |
| N.W.T. | North | No Activity |
| N.W.T. | South | No Activity |
| Nvt. | Qikiqtaaluk | No Data |
| Nvt. | Kivalliq | No Data |
| Nvt. | Kitimeot | No Data |
Laboratory-Confirmed Influenza Detections
In weeks 35 and 36, the following results were reported from sentinel laboratories across Canada (Figures 2 and 3):
- A total of 54 laboratory detections of influenza were reported, of which 93% (50) were influenza A.
- The percentage of tests positive for influenza was 1.4% in week 35 and 1.2% in week 36. This is similar to the percentage observed since mid-July (weeks 29-34).
- Influenza A(H3N2) accounted for 93% of subtyped influenza A detections during this 2-week period. Over the previous 6 weeks (weeks 29-34) 81% of subtyped influenza A detections were A(H3N2).
In weeks 35 and 36, detailed information on age and type/subtype has been received for 25 laboratory-confirmed influenza cases: 21 influenza A and 4 influenza B.
For more detailed weekly and cumulative influenza data, see the text descriptions for Figures 2 and 3 or the Respiratory Virus Detections in Canada Report.
Figure 2 – Number of positive influenza tests and percentage of tests positive, by type, subtype and report week, Canada, weeks 2019-35 to 2019-36
Number of Laboratories Reporting in Week 36: 36 out of 36
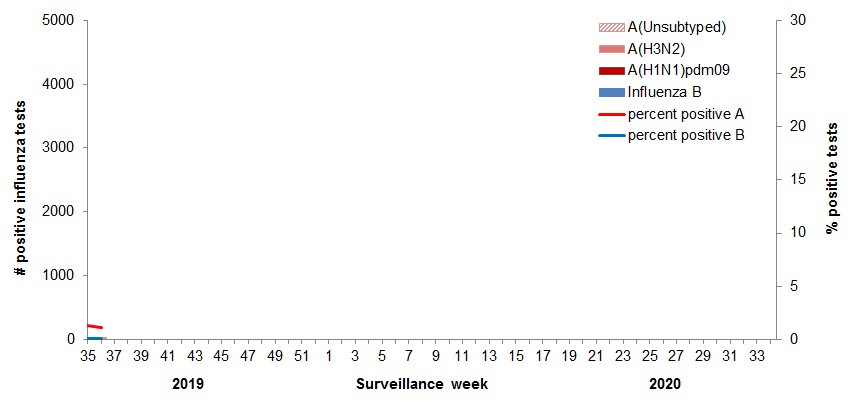
For BC, only data from subtyped influenza A specimens are included in the weekly number of influenza detections (bars). Influenza B detections are attributed to the week in which specimens were screened for influenza, and influenza A detections to the week in which they were subtyped. The proportion of screening tests positive for influenza in BC contributes to the national percentage of tests positive.
Figure 2 - Text equivalent
| Surveillance Week | A(Unsubtyped) | A(H3N2) | A(H1N1)pdm09 | Influenza B | Percent Positive A | Percent Positive B |
|---|---|---|---|---|---|---|
| 35 | 11 | 15 | 0 | 2 | 1.3 | 0.1 |
| 36 | 13 | 11 | 2 | 2 | 1.1 | 0.1 |
Figure 3 – Distribution of positive influenza specimens by type/subtype and province/territory*, Canada, weeks 2019-35 to 2019-36
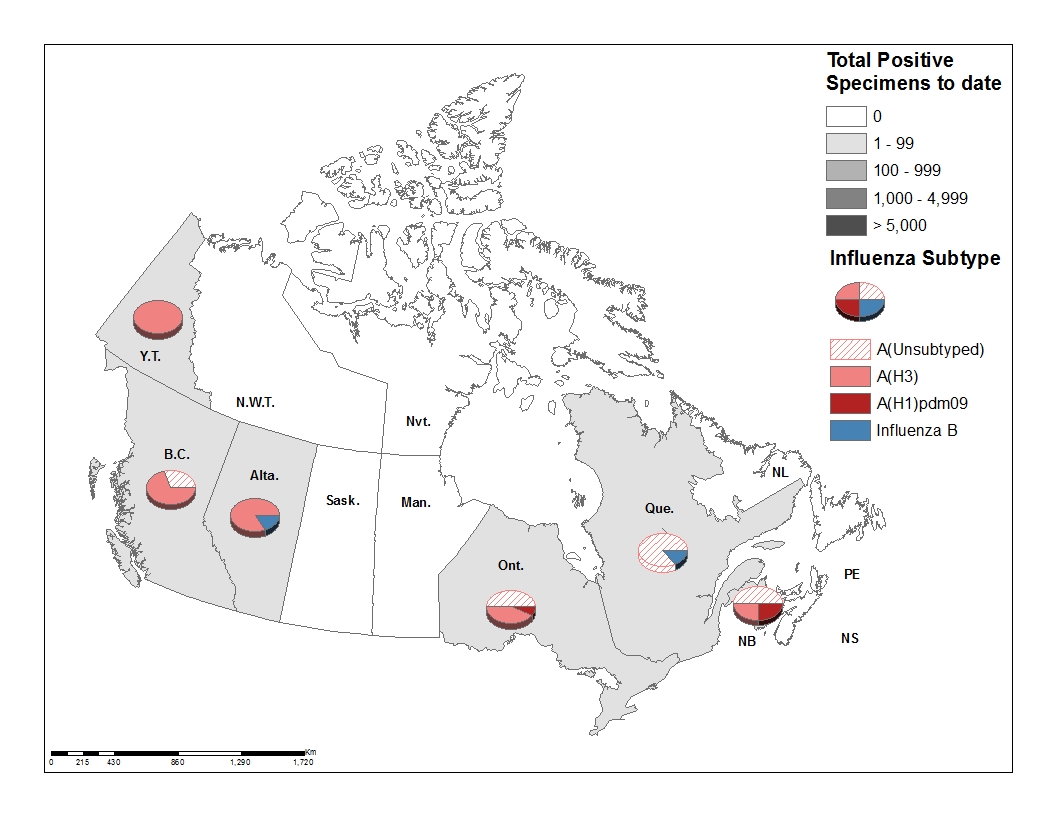
* For BC, only data from subtyped influenza A specimens are included in this figure. The proportion of influenza A detections may be delayed compared to influenza B while subtyping results are pending.
Figure 3 - Text equivalent
| Reporting provincesTable Figure 3 - Footnote 1 | Cumulative (August 25, 2019 to September 7, 2019) | |||||
|---|---|---|---|---|---|---|
| A Total | A(H1N1)pdm09 | A(H3N2) | A(UnS)3 | B Total | A & B Total | |
| BC | 10 | 0 | 7 | 3 | 0 | 10 |
| AB | 10 | 0 | 10 | 0 | 2 | 12 |
| SK | 0 | 0 | 0 | 0 | 0 | 0 |
| MB | 0 | 0 | 0 | 0 | 0 | 0 |
| ON | 14 | 1 | 6 | 7 | 0 | 14 |
| QC | 12 | 0 | 0 | 12 | 2 | 14 |
| NB | 4 | 1 | 1 | 2 | 0 | 4 |
| NS | 0 | 0 | 0 | 0 | 0 | 0 |
| PEI | 0 | 0 | 0 | 0 | 0 | 0 |
| NL | 0 | 0 | 0 | 0 | 0 | 0 |
| YT | 2 | 0 | 2 | 0 | 0 | 2 |
| N.W.T | 0 | 0 | 0 | 0 | 0 | 0 |
| NU | 0 | 0 | 0 | 0 | 0 | 0 |
| Canada | 52 | 2 | 26 | 24 | 4 | 56 |
| PercentageTable Figure 3 - Footnote 2 | 93% | 4% | 50% | 46% | 7% | 100% |
|
||||||
Syndromic / Influenza-like Illness Surveillance
Healthcare Professionals Sentinel Syndromic Surveillance
In week 35, 0.7% and in week 36, 0.4%, of visits to healthcare professionals were due to influenza-like illness (ILI) (Figure 4).
Figure 4 – Percentage of visits for ILI reported by sentinels by report week, Canada, weeks 2019-35 to 2019-36
Number of Sentinels Reporting in Week 36: 67
Average weekly number of reporting sentinels (2018-19 season): 106
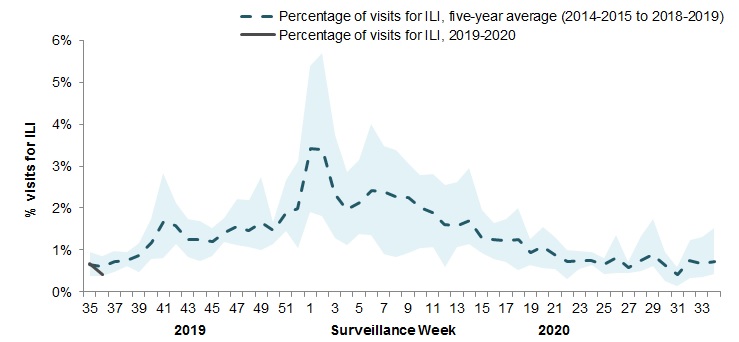
The shaded area represents the maximum and minimum percentage of visits for ILI reported by week from seasons 2014-2015 to 2018-2019
Figure 4 - Text equivalent
| Surveillance Week | 2019-20 | Average | Min | Max |
|---|---|---|---|---|
| 35 | 0.6% | 0.4% | 0.9% | 1.2% |
| 36 | 0.4% | 0.4% | 0.9% | 1.0% |
| 37 | 0.5% | 1.0% | 1.0% | |
| 38 | 0.6% | 1.0% | 1.4% | |
| 39 | 0.5% | 1.2% | 1.4% | |
| 40 | 0.8% | 1.7% | 1.6% | |
| 41 | 0.8% | 2.8% | 2.4% | |
| 42 | 1.2% | 2.1% | 1.9% | |
| 43 | 0.8% | 1.7% | 1.5% | |
| 44 | 0.7% | 1.7% | 1.6% | |
| 45 | 0.9% | 1.5% | 1.5% | |
| 46 | 1.2% | 1.8% | 2.0% | |
| 47 | 1.1% | 2.2% | 1.9% | |
| 48 | 1.1% | 2.2% | 2.1% | |
| 49 | 1.0% | 2.8% | 2.5% | |
| 50 | 1.1% | 1.7% | 3.7% | |
| 51 | 1.4% | 2.7% | 4.1% | |
| 52 | 1.0% | 3.1% | 7.1% | |
| 1 | 1.9% | 5.4% | 5.2% | |
| 2 | 1.8% | 5.7% | 4.5% | |
| 3 | 1.3% | 3.7% | 3.6% | |
| 4 | 1.1% | 2.9% | 3.5% | |
| 5 | 1.4% | 3.1% | 4.4% | |
| 6 | 1.4% | 4.0% | 3.3% | |
| 7 | 0.9% | 3.5% | 3.0% | |
| 8 | 0.8% | 3.4% | 2.7% | |
| 9 | 0.9% | 3.1% | 2.7% | |
| 10 | 1.0% | 2.8% | 2.7% | |
| 11 | 1.1% | 2.8% | 2.7% | |
| 12 | 0.6% | 2.6% | 2.7% | |
| 13 | 1.1% | 2.6% | 2.6% | |
| 14 | 1.1% | 3.0% | 2.4% | |
| 15 | 0.9% | 1.9% | 1.9% | |
| 16 | 0.8% | 1.7% | 1.9% | |
| 17 | 0.7% | 1.7% | 2.2% | |
| 18 | 0.5% | 2.0% | 1.6% | |
| 19 | 0.6% | 1.3% | 1.7% | |
| 20 | 0.6% | 1.5% | 1.4% | |
| 21 | 0.5% | 1.3% | 1.3% | |
| 22 | 0.3% | 1.0% | 1.0% | |
| 23 | 0.6% | 1.0% | 1.2% | |
| 24 | 0.6% | 1.0% | 1.0% | |
| 25 | 0.4% | 0.8% | 1.6% | |
| 26 | 0.5% | 1.4% | 1.4% | |
| 27 | 0.5% | 0.7% | 1.5% | |
| 28 | 0.5% | 1.3% | 1.9% | |
| 29 | 0.6% | 1.7% | 1.1% | |
| 30 | 0.2% | 0.9% | 0.7% | |
| 31 | 0.2% | 0.6% | 1.4% | |
| 32 | 0.3% | 1.2% | 1.6% | |
| 33 | 0.4% | 1.3% | 2.1% | |
| 34 | 0.4% | 1.5% | 0.9% |
FluWatchers
FluWatchers is a participatory ILI surveillance system that relies on weekly voluntary submissions of syndromic information from Canadians across Canada. Click here to learn more about the FluWatchers program.
If you are interested in becoming a FluWatcher for this season, sign up today.
FluWatchers reporting for the 2019-20 season will begin September 29th, 2019 (week 40).
Influenza Outbreak Surveillance
In weeks 35 and 36, no laboratory-confirmed influenza outbreaks nor ILI outbreaks were reported.
Number of provinces and territories reporting in weeks 35 and 36: 12 out of 13.
Severe Outcomes Influenza Surveillance
Provincial/Territorial Influenza Hospitalizations and Deaths
In weeks 35 and 36 less than five influenza-associated hospitalizations were reported by participating provinces and territories1. All cases were associated with influenza A. No ICU admissions or deaths were reported.Footnote 1.
Number of provinces and territories reporting in weeks 35 and 36: 9 out of 9
- Footnote 1
-
Influenza-associated hospitalizations are reported by N.L., P.E.I, N.S., N.B., Man., Alb., Y.T. and N.W.T. Only hospitalizations that require intensive medical care are reported by Sask. The cumulative rate of hospitalizations is calculated using the population by age-group in participating provinces and territories.
Pediatric Influenza Hospitalizations and Deaths
In weeks 35 and 36, fewer than five pediatric (≤16 years of age) hospitalizations with influenza were reported by the Immunization Monitoring Program Active (IMPACT) network.
Adult Influenza Hospitalizations and Deaths
Surveillance of laboratory-confirmed influenza-associated adult (≥16 years of age) hospitalizations by the Canadian Immunization Research Network (CIRN) Serious Outcomes Surveillance (SOS) network has not yet begun for the 2019-20 season.
Influenza Strain Characterizations
The National Microbiology Laboratory has not yet reported influenza strain characterization results for influenza viruses collected during the 2019-20 season.
Antiviral Resistance
The National Microbiology Laboratory has not yet reported antiviral resistance results for influenza viruses collected during the 2019-20 season.
Vaccine Monitoring
Vaccine monitoring refers to activities related to the monitoring of influenza vaccine coverage and effectiveness.
Vaccine Coverage
Influenza vaccine coverage estimates for the 2019-20 season are anticipated to be available in February or March 2020.
Vaccine Effectiveness
Influenza vaccine effectiveness estimates for the 2019-20 season are anticipated to be available in February or March 2020.
Page details
- Date modified: