
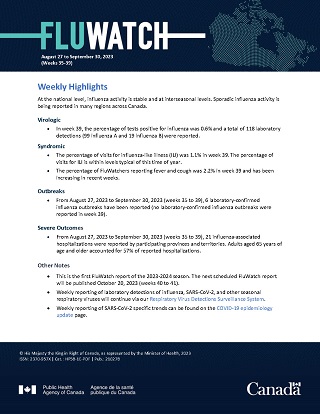
FluWatch report: August 27 to September 30, 2023 (weeks 35-39)
Download in PDF format
(2.59 MB, 10 pages)
Organization: Public Health Agency of Canada
Published: 2023-10-06
Related Topics
Weekly Highlights
- At the national level, influenza activity is stable and at interseasonal levels. Sporadic influenza activity is being reported in many regions across Canada.
Virologic
- In week 39, the percentage of tests positive for influenza was 0.6% and a total of 118 laboratory detections (99 influenza A and 19 influenza B) were reported.
Syndromic
- The percentage of visits for influenza-like illness (ILI) was 1.1% in week 39. The percentage of visits for ILI is within levels typical of this time of year.
- The percentage of FluWatchers reporting fever and cough was 2.2% in week 39 and has been increasing in recent weeks.
Outbreaks
- From August 27, 2023 to September 30, 2023 (weeks 35 to 39), 6 laboratory-confirmed influenza outbreaks have been reported (no laboratory-confirmed influenza outbreaks were reported in week 39).
Severe Outcomes
- From August 27, 2023 to September 30, 2023 (weeks 35 to 39), 21 influenza-associated hospitalizations were reported by participating provinces and territories. Adults aged 65 years of age and older accounted for 57% of reported hospitalizations.
Other Notes
- This is the first FluWatch report of the 2023-2024 season. The next scheduled FluWatch report will be published October 20, 2023 (weeks 40 to 41).
- Weekly reporting of laboratory detections of influenza, SARS-CoV-2, and other seasonal respiratory viruses will continue via our Respiratory Virus Detections Surveillance System.
- Weekly reporting of SARS-CoV-2 specific trends can be found on the COVID-19 epidemiology update
On this page
- Influenza/Influenza-like Illness Activity - Geographic Spread
- Laboratory-Confirmed Influenza Detections
- Syndromic / Influenza-like Illness Surveillance
- Influenza Outbreak Surveillance
- Influenza Severe Outcomes Surveillance
- Influenza Strain Characterization
- Antiviral Resistance
- Influenza Vaccine Monitoring
- Provincial and International Surveillance Links
Influenza/Influenza-like Illness Activity - Geographic Spread
In week 39, 23 regions across Canada reported either sporadic or localized influenza activity (Figure 1). The number of regions reporting influenza activity and the intensity of reported activity remains stable. A total of 22 regions in Canada reported no activity this week.
Number of Regions Reporting in week 39: 45 out of 53
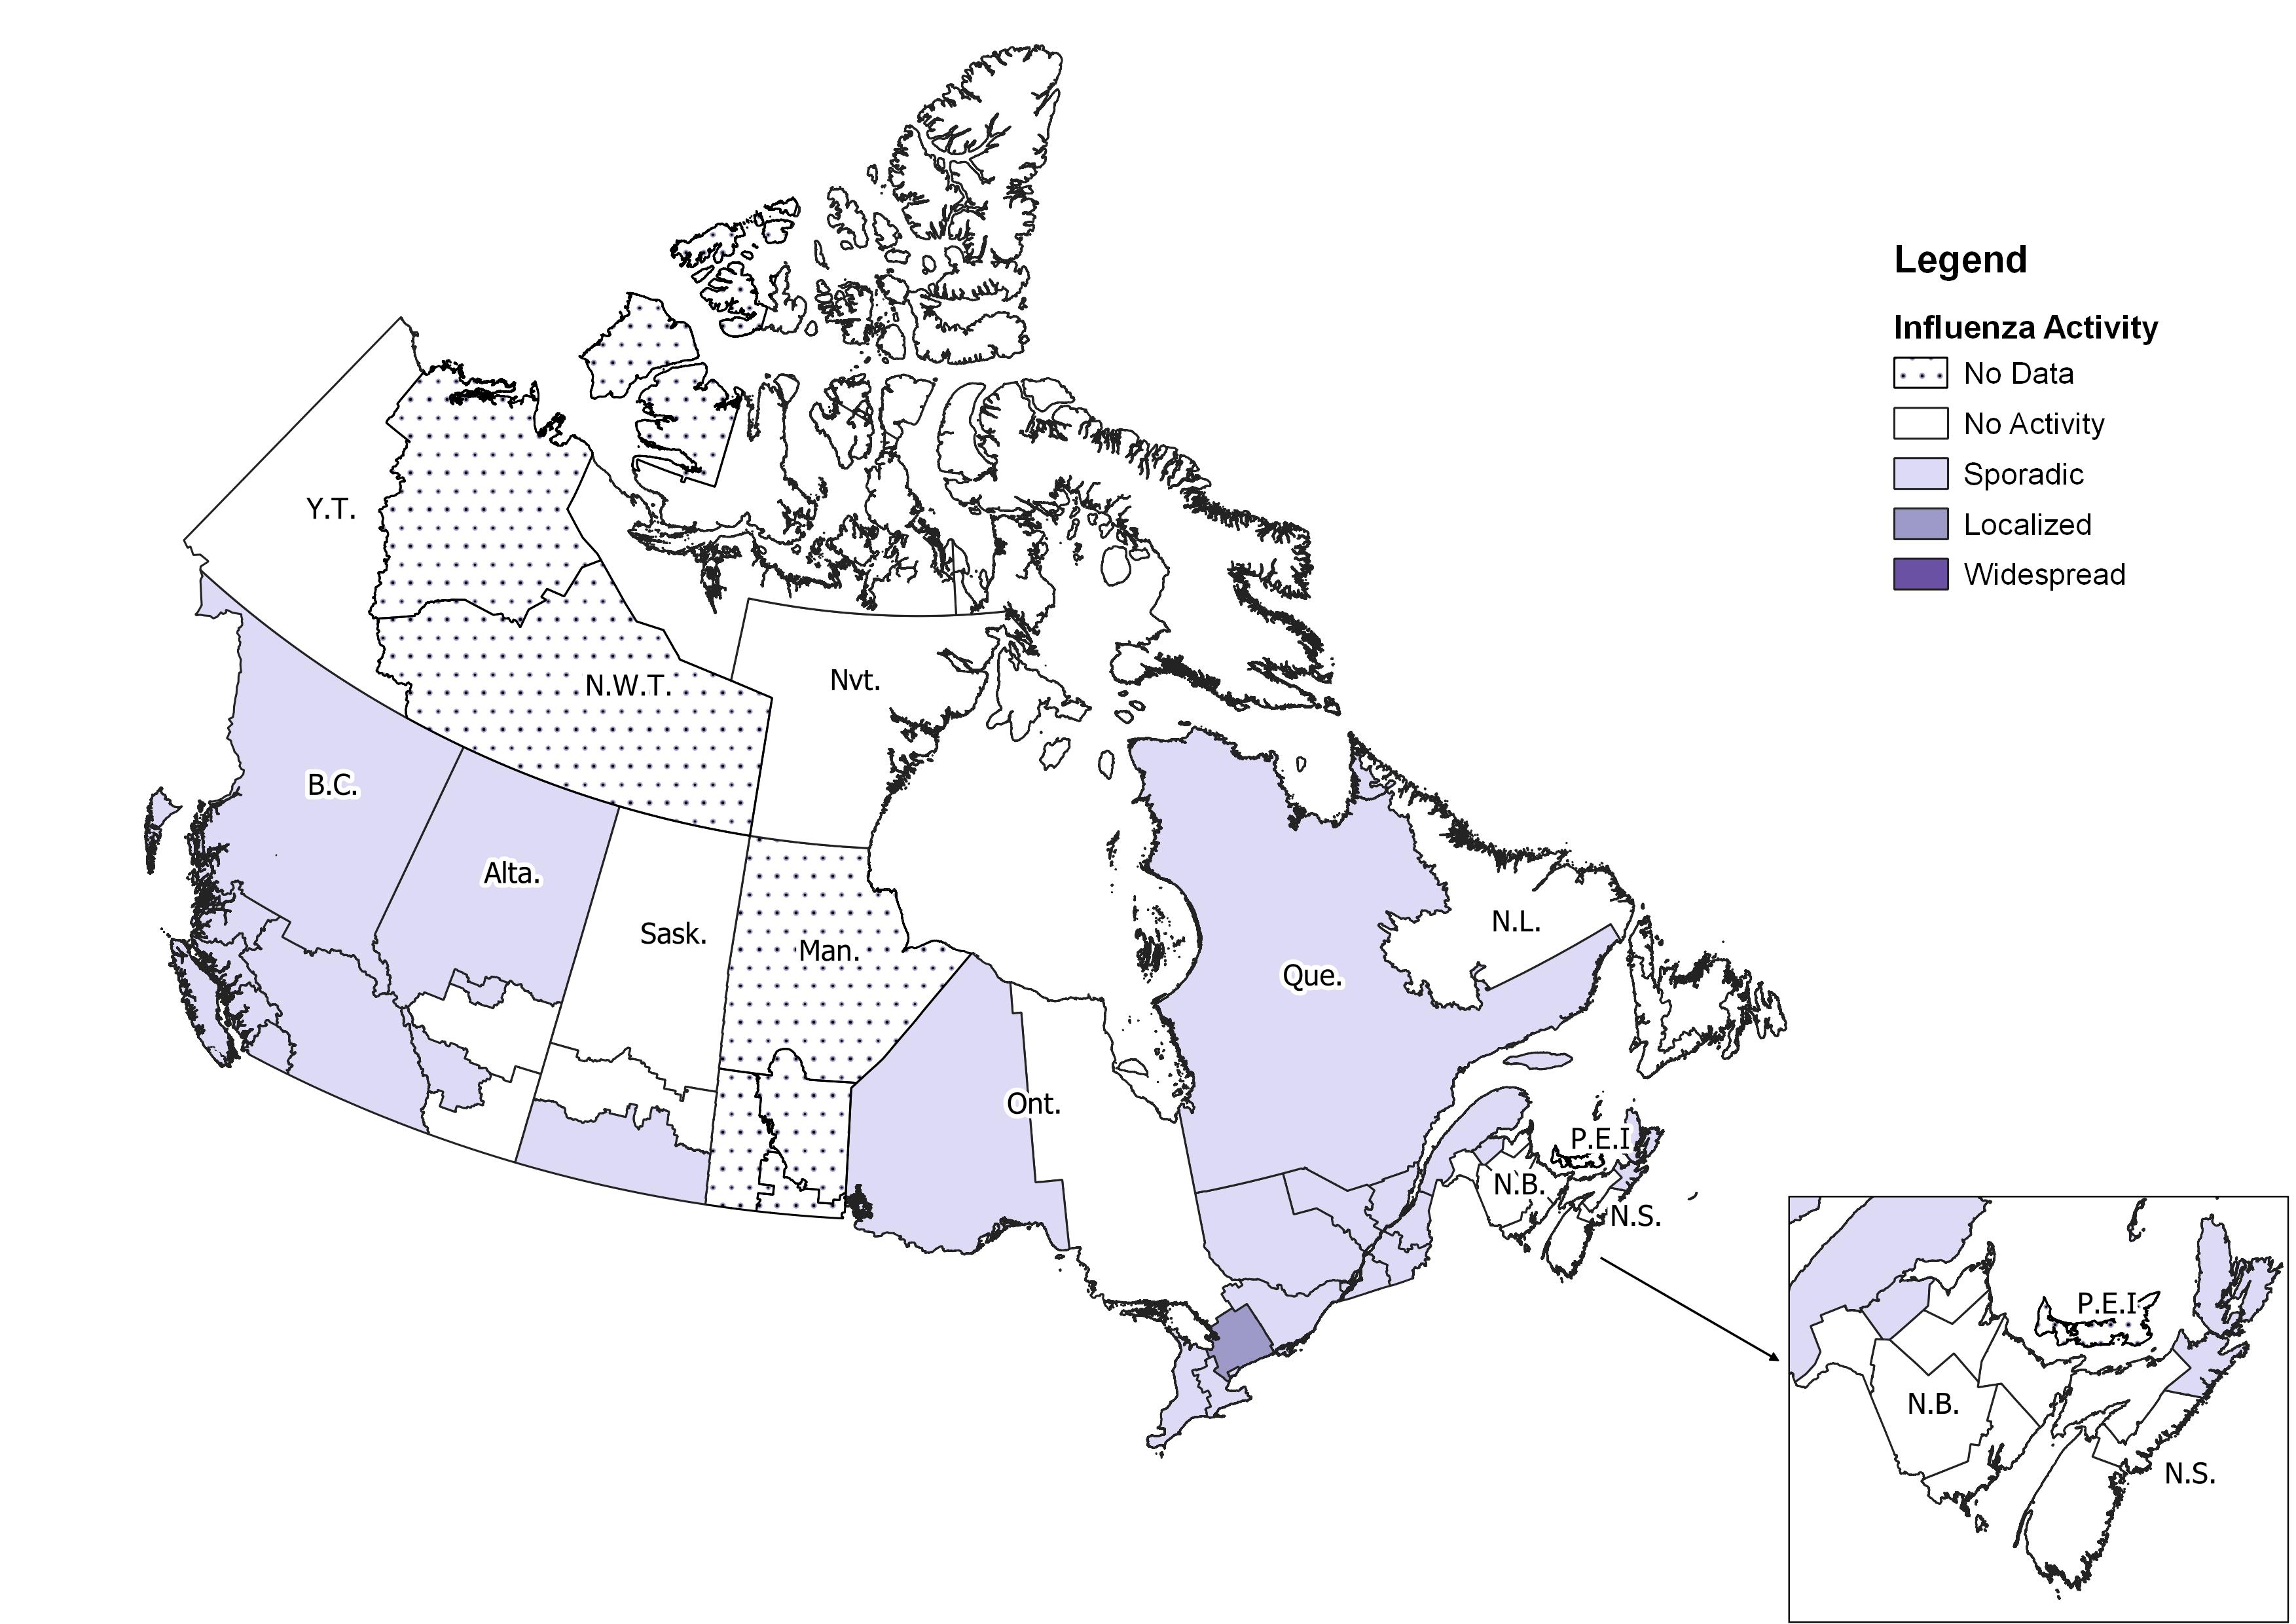
Figure 1 - Text description
| Province | Influenza Surveillance Region | Activity Level |
|---|---|---|
| N.L. | Eastern | No Activity |
| Labrador-Grenfell | No Activity | |
| Central | No Activity | |
| Western | No Activity | |
| P.E.I. | Prince Edward Island | No Data |
| N.S. | Zone 1 - Western | No Activity |
| Zone 2 - Northern | No Activity | |
| Zone 3 - Eastern | Sporadic | |
| Zone 4 - Central | No Activity | |
| N.B. | Region 1 | No Activity |
| Region 2 | No Activity | |
| Region 3 | No Activity | |
| Region 4 | No Activity | |
| Region 5 | Sporadic | |
| Region 6 | No Activity | |
| Region 7 | No Activity | |
| Que. | Nord-est | Sporadic |
| Québec et Chaudieres-Appalaches | Sporadic | |
| Centre-du-Québec | Sporadic | |
| Montréal et Laval | Sporadic | |
| Ouest-du-Québec | Sporadic | |
| Montérégie | Sporadic | |
| Ont. | Central East | Localized |
| Central West | Sporadic | |
| Eastern | Sporadic | |
| North East | No Activity | |
| North West | Sporadic | |
| South West | Sporadic | |
| Toronto | Sporadic | |
| Man. | Northern Regional | No Data |
| Prairie Mountain | No Data | |
| Interlake-Eastern | No Data | |
| Winnipeg | No Data | |
| Southern Health | No Data | |
| Sask. | North | No Activity |
| Central | No Activity | |
| South | Sporadic | |
| Alta. | North Zone | Sporadic |
| Edmonton | Sporadic | |
| Central Zone | No Activity | |
| Calgary | Sporadic | |
| South Zone | No Activity | |
| B.C. | Interior | Sporadic |
| Fraser | Sporadic | |
| Vancouver Coastal | Sporadic | |
| Vancouver Island | Sporadic | |
| Northern | Sporadic | |
| Y.T. | Yukon | No Activity |
| N.W. | North | No Data |
| South | No Data | |
| Nvt. | Qikiqtaaluk | No Activity |
| Kivalliq | No Activity | |
| Kitimeot | No Activity |
Laboratory-Confirmed Influenza Detections
The weekly percentage of tests positive for influenza (0.6% in week 39) remains stable and is at interseasonal levels.
The following results were reported from sentinel laboratories across Canada in week 39 (Figures 2 and 3):
- A total of 118 laboratory detections (99 influenza A and 19 influenza B) were reported.
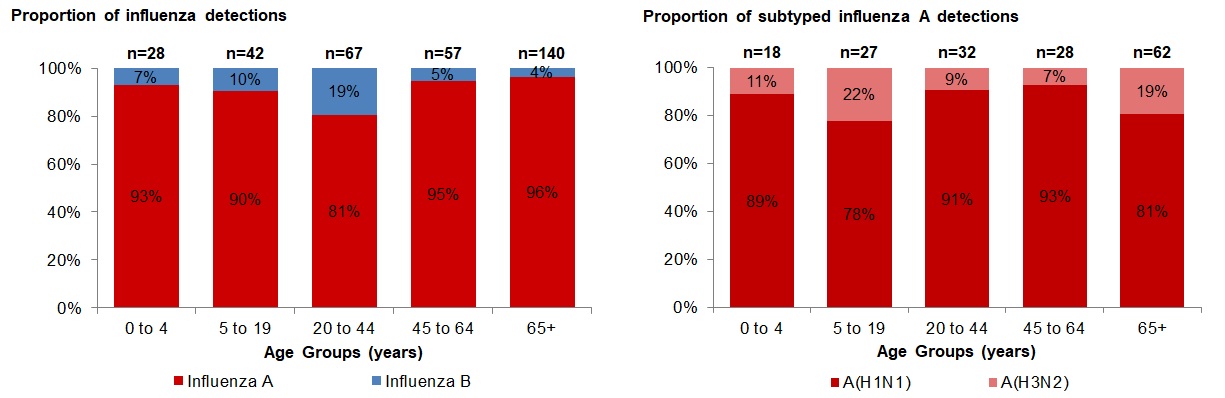
- Among subtyped influenza A detections (54), 87% (47) were influenza A(H1N1).
- Among detections for which age information was reported (72), 34 (47%) of detections were in individuals over the age of 65 years.
To date this season (August 27, 2023 to September 30, 2023):
- 497 influenza detections were reported, of which 91% (450) were influenza A and among subtyped influenza A detections (319), influenza A(H1N1) accounted for 78% of detections.
- 334 laboratory-confirmed influenza detections with age information were reported, of which 140 (42%) were in individuals aged 65+ years old (Figure 4).
For more detailed weekly and cumulative influenza data, see the text descriptions for Figures 2 and 3 or the Respiratory Virus Detections in Canada Report.
Number of Laboratories Reporting in week 39: 33 out of 34
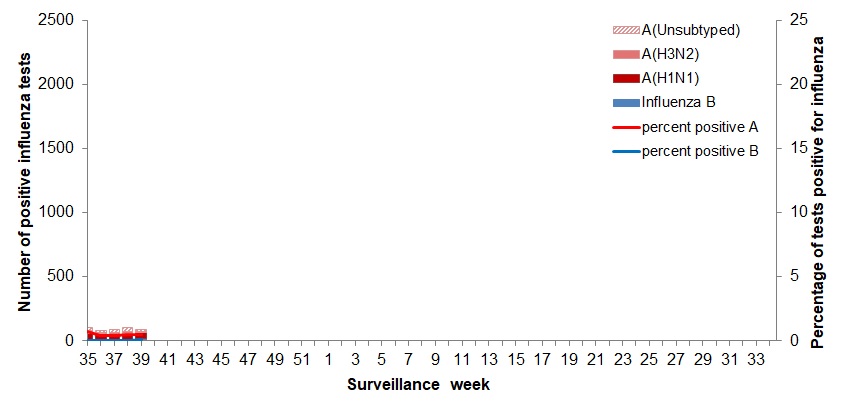
Figure 2 - Text description
| Surveillance Week | A(Unsubtyped) | A(H3N2) | A(H1N1) | Influenza B | Percent Positive A | Percent Positive B |
|---|---|---|---|---|---|---|
| 35 | 20 | 25 | 51 | 9 | 0.7 | 0.06 |
| 36 | 11 | 10 | 50 | 9 | 0.42 | 0.06 |
| 37 | 26 | 13 | 45 | 6 | 0.46 | 0.03 |
| 38 | 29 | 14 | 57 | 4 | 0.51 | 0.02 |
| 39 | 18 | 7 | 47 | 19 | 0.47 | 0.09 |
| 40 | 0 | 0 | 0 | 0 | 0 | 0 |
| 41 | 0 | 0 | 0 | 0 | 0 | 0 |
| 42 | 0 | 0 | 0 | 0 | 0 | 0 |
| 43 | 0 | 0 | 0 | 0 | 0 | 0 |
| 44 | 0 | 0 | 0 | 0 | 0 | 0 |
| 45 | 0 | 0 | 0 | 0 | 0 | 0 |
| 46 | 0 | 0 | 0 | 0 | 0 | 0 |
| 47 | 0 | 0 | 0 | 0 | 0 | 0 |
| 48 | 0 | 0 | 0 | 0 | 0 | 0 |
| 49 | 0 | 0 | 0 | 0 | 0 | 0 |
| 50 | 0 | 0 | 0 | 0 | 0 | 0 |
| 51 | 0 | 0 | 0 | 0 | 0 | 0 |
| 52 | 0 | 0 | 0 | 0 | 0 | 0 |
| 1 | 0 | 0 | 0 | 0 | 0 | 0 |
| 2 | 0 | 0 | 0 | 0 | 0 | 0 |
| 3 | 0 | 0 | 0 | 0 | 0 | 0 |
| 4 | 0 | 0 | 0 | 0 | 0 | 0 |
| 5 | 0 | 0 | 0 | 0 | 0 | 0 |
| 6 | 0 | 0 | 0 | 0 | 0 | 0 |
| 7 | 0 | 0 | 0 | 0 | 0 | 0 |
| 8 | 0 | 0 | 0 | 0 | 0 | 0 |
| 9 | 0 | 0 | 0 | 0 | 0 | 0 |
| 10 | 0 | 0 | 0 | 0 | 0 | 0 |
| 11 | 0 | 0 | 0 | 0 | 0 | 0 |
| 12 | 0 | 0 | 0 | 0 | 0 | 0 |
| 13 | 0 | 0 | 0 | 0 | 0 | 0 |
| 14 | 0 | 0 | 0 | 0 | 0 | 0 |
| 15 | 0 | 0 | 0 | 0 | 0 | 0 |
| 16 | 0 | 0 | 0 | 0 | 0 | 0 |
| 17 | 0 | 0 | 0 | 0 | 0 | 0 |
| 18 | 0 | 0 | 0 | 0 | 0 | 0 |
| 19 | 0 | 0 | 0 | 0 | 0 | 0 |
| 20 | 0 | 0 | 0 | 0 | 0 | 0 |
| 21 | 0 | 0 | 0 | 0 | 0 | 0 |
| 22 | 0 | 0 | 0 | 0 | 0 | 0 |
| 23 | 0 | 0 | 0 | 0 | 0 | 0 |
| 24 | 0 | 0 | 0 | 0 | 0 | 0 |
| 25 | 0 | 0 | 0 | 0 | 0 | 0 |
| 26 | 0 | 0 | 0 | 0 | 0 | 0 |
| 27 | 0 | 0 | 0 | 0 | 0 | 0 |
| 28 | 0 | 0 | 0 | 0 | 0 | 0 |
| 29 | 0 | 0 | 0 | 0 | 0 | 0 |
| 30 | 0 | 0 | 0 | 0 | 0 | 0 |
| 31 | 0 | 0 | 0 | 0 | 0 | 0 |
| 32 | 0 | 0 | 0 | 0 | 0 | 0 |
| 33 | 0 | 0 | 0 | 0 | 0 | 0 |
| 34 | 0 | 0 | 0 | 0 | 0 | 0 |
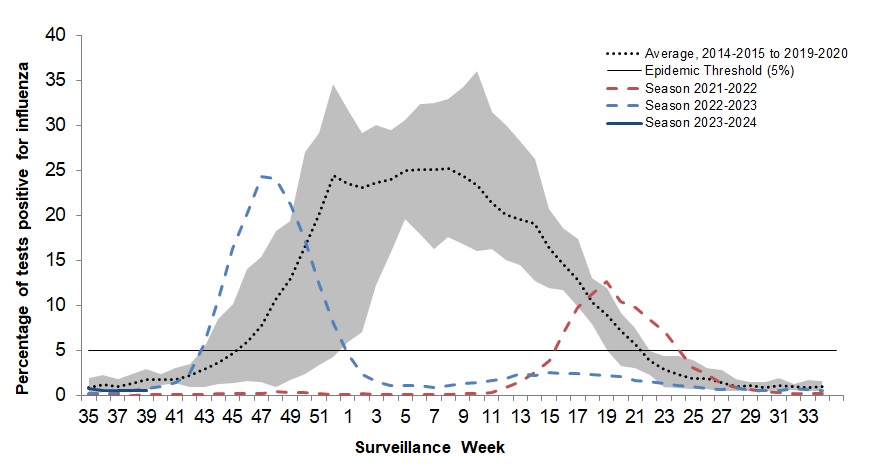
The shaded area represents the maximum and minimum number of influenza tests or percentage of tests positive reported by week from seasons 2014-2015 to 2019-2020. Data from week 11 of the 2019-2020 season onwards are excluded from the historical comparison due to the COVID-19 pandemic.
The epidemic threshold is 5% tests positive for influenza. When it is exceeded, and a minimum of 15 weekly influenza detections are reported, a seasonal influenza epidemic is declared.
Figure 3 - Text description
| Surveillance Week | Percentage of tests positive, 2023-2024 | Percentage of tests positive, 2022-2023 | Percentage of tests positive, 2021-2022 | Maximum Percentage of Tests Positive | Minimum Percentage of Tests Positive | Average Percentage of Tests Positive |
|---|---|---|---|---|---|---|
| 35 | 0.8 | 0.2 | 0.0 | 1.9 | 0.1 | 0.8 |
| 36 | 0.5 | 0.2 | 0.0 | 2.3 | 0.3 | 1.1 |
| 37 | 0.5 | 0.3 | 0.0 | 1.8 | 0.4 | 1.0 |
| 38 | 0.5 | 0.5 | 0.0 | 2.4 | 0.6 | 1.3 |
| 39 | 0.6 | 0.7 | 0.0 | 3.0 | 0.6 | 1.7 |
| 40 | - | 1.0 | 0.0 | 2.3 | 1.1 | 1.7 |
| 41 | - | 1.4 | 0.1 | 3.0 | 1.3 | 1.7 |
| 42 | - | 2.4 | 0.1 | 3.4 | 0.9 | 2.2 |
| 43 | - | 5.5 | 0.1 | 5.3 | 0.8 | 2.8 |
| 44 | - | 10.8 | 0.2 | 8.4 | 1.2 | 3.7 |
| 45 | - | 16.2 | 0.1 | 10.1 | 1.4 | 4.6 |
| 46 | - | 20.3 | 0.2 | 14.1 | 1.5 | 6.0 |
| 47 | - | 24.3 | 0.2 | 15.4 | 1.4 | 7.7 |
| 48 | - | 24.1 | 0.3 | 18.2 | 0.8 | 10.6 |
| 49 | - | 21.2 | 0.3 | 19.3 | 1.6 | 12.9 |
| 50 | - | 17.4 | 0.3 | 27.0 | 2.4 | 16.4 |
| 51 | - | 12.5 | 0.2 | 29.1 | 3.3 | 20.0 |
| 52 | - | 8.0 | 0.1 | 34.5 | 4.3 | 24.4 |
| 1 | - | 4.6 | 0.1 | 31.7 | 5.9 | 23.5 |
| 2 | - | 2.3 | 0.1 | 29.1 | 7.1 | 23.0 |
| 3 | - | 1.5 | 0.1 | 30.1 | 12.2 | 23.7 |
| 4 | - | 1.1 | 0.1 | 29.5 | 15.9 | 24.0 |
| 5 | - | 1.0 | 0.0 | 30.6 | 19.6 | 24.9 |
| 6 | - | 1.0 | 0.0 | 32.4 | 17.9 | 25.0 |
| 7 | - | 0.9 | 0.0 | 32.5 | 16.3 | 25.1 |
| 8 | - | 1.1 | 0.1 | 32.9 | 17.6 | 25.2 |
| 9 | - | 1.3 | 0.1 | 34.3 | 16.8 | 24.4 |
| 10 | - | 1.4 | 0.2 | 36.0 | 16.1 | 23.3 |
| 11 | - | 1.7 | 0.3 | 31.4 | 16.2 | 21.4 |
| 12 | - | 1.9 | 0.9 | 30.0 | 15.0 | 20.1 |
| 13 | - | 2.4 | 1.5 | 28.3 | 14.5 | 19.6 |
| 14 | - | 2.2 | 2.5 | 26.2 | 12.7 | 19.1 |
| 15 | - | 2.5 | 3.9 | 20.7 | 12.0 | 16.3 |
| 16 | - | 2.4 | 7.0 | 18.5 | 11.6 | 14.5 |
| 17 | - | 2.4 | 9.7 | 17.3 | 9.8 | 12.8 |
| 18 | - | 2.3 | 11.3 | 13.0 | 7.9 | 10.3 |
| 19 | - | 2.1 | 12.6 | 12.0 | 5.0 | 9.0 |
| 20 | - | 2.1 | 10.4 | 9.1 | 3.2 | 7.2 |
| 21 | - | 1.6 | 9.8 | 7.5 | 3.0 | 5.6 |
| 22 | - | 1.6 | 8.4 | 4.9 | 2.2 | 3.9 |
| 23 | - | 1.3 | 7.0 | 4.4 | 0.9 | 2.9 |
| 24 | - | 1.1 | 5.0 | 4.4 | 0.8 | 2.3 |
| 25 | - | 1.0 | 3.0 | 4.0 | 0.6 | 1.9 |
| 26 | - | 0.7 | 2.3 | 3.0 | 0.7 | 1.8 |
| 27 | - | 0.6 | 1.2 | 2.8 | 0.4 | 1.4 |
| 28 | - | 0.8 | 0.8 | 1.8 | 0.4 | 0.9 |
| 29 | - | 0.5 | 0.7 | 1.5 | 0.5 | 1.1 |
| 30 | - | 0.5 | 0.4 | 1.5 | 0.5 | 0.9 |
| 31 | - | 0.5 | 0.3 | 1.9 | 0.6 | 1.1 |
| 32 | - | 0.7 | 0.2 | 1.2 | 0.5 | 0.9 |
| 33 | - | 0.7 | 0.2 | 1.7 | 0.4 | 0.9 |
| 34 | - | 0.6 | 0.2 | 1.6 | 0.4 | 0.9 |
Laboratory data notes:
Testing for influenza and other respiratory viruses has been influenced by the COVID-19 pandemic. Changes in laboratory testing practices may affect the comparability of data to previous seasons.
Due to different testing protocols of laboratories across Canada, some influenza A subtype detection counts may not be included in total influenza A detection counts and percent positivity calculations.
Figure 4 - Text description
| Age Group | Proportion of Influenza A | Proportion of Influenza B | Total Number Influenza Detections |
|---|---|---|---|
| 0 to 4 | 92.9% | 7.1% | 28 |
| 5 to 19 | 90.5% | 9.5% | 42 |
| 20 to 44 | 80.6% | 19.4% | 67 |
| 45 to 64 | 94.7% | 5.3% | 57 |
| 65+ | 96.4% | 3.6% | 140 |
| Age Group | Proportion of A(H1N1) | Proportion of A(H3N2) | Total Number of Subtyped Influenza Detections |
|---|---|---|---|
| 0 to 4 | 88.9% | 11.1% | 18 |
| 5 to 19 | 77.8% | 22.2% | 27 |
| 20 to 44 | 90.6% | 9.4% | 32 |
| 45 to 64 | 92.9% | 7.1% | 28 |
| 65+ | 80.6% | 19.4% | 62 |
Syndromic / Influenza-like Illness Surveillance
Healthcare Practitioners Sentinel Surveillance
In week 39, 1.1% of visits to healthcare professionals were due to influenza-like illness (ILI) (Figure 5). The percentage of visits for ILI is within expected levels for this time of year.
ILI symptoms are not specific to any one respiratory pathogen and can be due to influenza, or other respiratory viruses, including respiratory syncytial virus and SARS-CoV-2, the virus that causes COVID-19. This makes the percentage of visits for ILI an important indicator of overall respiratory illness morbidity in the community in the presence of co-circulating viruses.
This indicator should be interpreted with caution as there have been a smaller number of sentinels reporting compared to previous seasons.
Number of Sentinels Reporting in week 39: 35
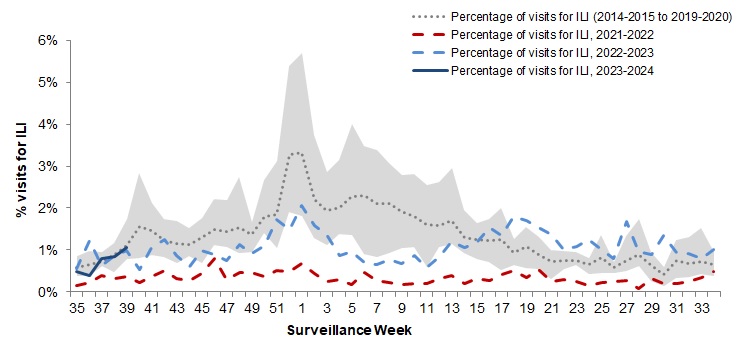
The shaded area represents the maximum and minimum percentage of visits for ILI reported by week from seasons 2014-2015 to 2019-2020. Data from week 11 of the 2019-2020 season onwards are excluded from the historical comparison due to the COVID-19 pandemic.
Figure 5 - Text description
| Surveillance Week | 2023-2024 | 2022-2023 | 2021-2022 | Average | Min | Max |
|---|---|---|---|---|---|---|
| 35 | 0.5% | 0.6% | 0.1% | 0.6% | 0.4% | 0.9% |
| 36 | 0.4% | 1.2% | 0.2% | 0.6% | 0.4% | 0.9% |
| 37 | 0.8% | 0.6% | 0.4% | 0.7% | 0.5% | 1.0% |
| 38 | 0.8% | 0.9% | 0.3% | 0.7% | 0.6% | 1.0% |
| 39 | 1.1% | 1.0% | 0.4% | 0.9% | 0.5% | 1.2% |
| 40 | - | 0.5% | 0.2% | 1.2% | 0.8% | 1.7% |
| 41 | - | 1.1% | 0.4% | 1.7% | 0.8% | 2.8% |
| 42 | - | 1.2% | 0.5% | 1.6% | 1.2% | 2.1% |
| 43 | - | 0.9% | 0.3% | 1.2% | 0.8% | 1.7% |
| 44 | - | 0.6% | 0.3% | 1.2% | 0.7% | 1.7% |
| 45 | - | 1.0% | 0.4% | 1.2% | 0.9% | 1.5% |
| 46 | - | 0.9% | 0.8% | 1.4% | 1.2% | 1.8% |
| 47 | - | 0.7% | 0.3% | 1.6% | 1.1% | 2.2% |
| 48 | - | 1.1% | 0.5% | 1.5% | 1.1% | 2.2% |
| 49 | - | 0.9% | 0.5% | 1.7% | 1.0% | 2.8% |
| 50 | - | 1.1% | 0.4% | 1.5% | 1.1% | 1.7% |
| 51 | - | 1.7% | 0.5% | 1.9% | 1.4% | 2.7% |
| 52 | - | 1.5% | 0.5% | 2.0% | 1.0% | 3.1% |
| 1 | - | 2.1% | 0.7% | 3.4% | 1.9% | 5.4% |
| 2 | - | 1.6% | 0.4% | 3.4% | 1.8% | 5.7% |
| 3 | - | 1.4% | 0.2% | 2.3% | 1.3% | 3.7% |
| 4 | - | 0.9% | 0.3% | 2.0% | 1.1% | 2.9% |
| 5 | - | 1.0% | 0.2% | 2.1% | 1.4% | 3.1% |
| 6 | - | 0.7% | 0.5% | 2.4% | 1.4% | 4.0% |
| 7 | - | 0.7% | 0.3% | 2.4% | 0.9% | 3.5% |
| 8 | - | 0.8% | 0.2% | 2.3% | 0.8% | 3.4% |
| 9 | - | 0.7% | 0.2% | 2.3% | 0.9% | 3.1% |
| 10 | - | 0.9% | 0.2% | 2.0% | 1.0% | 2.8% |
| 11 | - | 0.6% | 0.2% | 1.9% | 1.1% | 2.8% |
| 12 | - | 0.8% | 0.3% | 1.6% | 0.6% | 2.6% |
| 13 | - | 1.2% | 0.4% | 1.6% | 1.1% | 2.6% |
| 14 | - | 1.1% | 0.2% | 1.7% | 1.1% | 3.0% |
| 15 | - | 1.2% | 0.3% | 1.3% | 0.9% | 1.9% |
| 16 | - | 1.5% | 0.3% | 1.2% | 0.8% | 1.7% |
| 17 | - | 1.3% | 0.4% | 1.2% | 0.7% | 1.7% |
| 18 | - | 1.8% | 0.5% | 1.3% | 0.5% | 2.0% |
| 19 | - | 1.7% | 0.3% | 0.9% | 0.6% | 1.3% |
| 20 | - | 1.5% | 0.5% | 1.1% | 0.6% | 1.5% |
| 21 | - | 1.4% | 0.3% | 0.9% | 0.5% | 1.3% |
| 22 | - | 1.0% | 0.3% | 0.7% | 0.3% | 1.0% |
| 23 | - | 1.1% | 0.2% | 0.8% | 0.6% | 1.0% |
| 24 | - | 1.3% | 0.2% | 0.7% | 0.6% | 1.0% |
| 25 | - | 1.0% | 0.2% | 0.6% | 0.4% | 0.8% |
| 26 | - | 0.8% | 0.2% | 0.8% | 0.5% | 1.4% |
| 27 | - | 1.7% | 0.3% | 0.6% | 0.5% | 0.7% |
| 28 | - | 1.0% | 0.1% | 0.7% | 0.5% | 1.3% |
| 29 | - | 0.9% | 0.3% | 0.9% | 0.6% | 1.7% |
| 30 | - | 1.3% | 0.2% | 0.6% | 0.2% | 0.9% |
| 31 | - | 0.9% | 0.2% | 0.4% | 0.2% | 0.6% |
| 32 | - | 0.9% | 0.2% | 0.8% | 0.3% | 1.2% |
| 33 | - | 0.8% | 0.3% | 0.7% | 0.4% | 1.3% |
| 34 | - | 1.0% | 0.5% | 0.7% | 0.4% | 1.5% |
FluWatchers
In week 39, 9,067 participants reported to FluWatchers, of which 2.2% reported symptoms of cough and fever (Figure 6). The percentage of FluWatchers who have reported cough and fever has been increasing in recent weeks, and is likely capturing the community circulation of non-influenza viruses such as SARS-CoV-2.
The reports of cough and fever are not specific to any one respiratory pathogen and can be due to influenza, or other respiratory viruses, including respiratory syncytial virus, rhinovirus, and SARS-CoV-2, the virus that causes COVID-19. This makes the proportion of individuals reporting cough and fever an important indicator of overall respiratory illness activity in the community in the presence of co-circulating viruses.
FluWatchers reporting is not impacted by changes in health services or health seeking behaviours.
Among the 203 participants who reported cough and fever:
- 18% consulted a healthcare professional, and 73% performed a rapid antigen test.
The Northwest Territories had the highest participation rate this week (53 participants per 100,000 population) and the neighbourhood with postal code, K0A had the highest number of participants (116). See what is happening in your neighbourhood! Downloadable datasets are also available on Open Maps.
If you are interested in becoming a FluWatcher, sign up today.
Number of Participants Reporting in week 39: 9,067
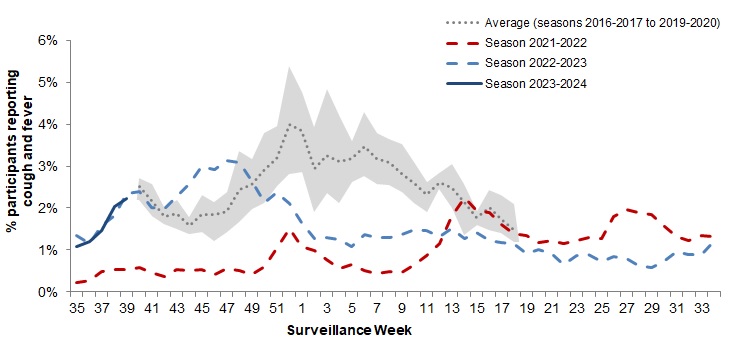
The shaded area represents the maximum and minimum percentage of percentage of participants reporting cough and fever by week, from seasons 2014-2015 to 2019-2020. Data from week 11 of the 2019-2020 season onwards are excluded from the historical comparison due to the COVID-19 pandemic
Figure 6 - Text description
| Surveillance Week | 2023-2024 | 2022-2023 | 2021-2022 | Average | Min | Max |
|---|---|---|---|---|---|---|
| 35 | 1.1% | 1.3% | 0.2% | - | - | - |
| 36 | 1.2% | 1.2% | 0.3% | - | - | - |
| 37 | 1.5% | 1.6% | 0.5% | - | - | - |
| 38 | 2.0% | 1.8% | 0.5% | - | - | - |
| 39 | 2.2% | 2.3% | 0.5% | - | - | - |
| 40 | - | 2.4% | 0.6% | 2.5% | 2.2% | 2.7% |
| 41 | - | 2.0% | 0.5% | 2.2% | 1.8% | 2.6% |
| 42 | - | 2.0% | 0.4% | 1.8% | 1.6% | 2.0% |
| 43 | - | 2.3% | 0.5% | 1.9% | 1.5% | 2.2% |
| 44 | - | 2.6% | 0.5% | 1.6% | 1.4% | 1.8% |
| 45 | - | 3.0% | 0.5% | 1.8% | 1.4% | 2.3% |
| 46 | - | 2.9% | 0.4% | 1.8% | 1.2% | 2.2% |
| 47 | - | 3.1% | 0.6% | 1.9% | 1.4% | 2.4% |
| 48 | - | 3.1% | 0.5% | 2.4% | 1.7% | 3.4% |
| 49 | - | 2.7% | 0.4% | 2.6% | 2.0% | 3.2% |
| 50 | - | 2.1% | 0.6% | 2.9% | 2.1% | 3.8% |
| 51 | - | 2.4% | 1.0% | 3.2% | 2.5% | 3.9% |
| 52 | - | 2.1% | 1.5% | 4.0% | 2.8% | 5.4% |
| 1 | - | 1.7% | 1.1% | 3.8% | 2.9% | 4.8% |
| 2 | - | 1.3% | 1.0% | 2.9% | 1.9% | 3.9% |
| 3 | - | 1.3% | 0.8% | 3.3% | 2.3% | 4.8% |
| 4 | - | 1.2% | 0.6% | 3.1% | 2.1% | 4.2% |
| 5 | - | 1.1% | 0.6% | 3.2% | 2.6% | 3.6% |
| 6 | - | 1.4% | 0.5% | 3.5% | 2.8% | 4.3% |
| 7 | - | 1.3% | 0.4% | 3.2% | 2.6% | 3.8% |
| 8 | - | 1.3% | 0.5% | 3.1% | 2.5% | 3.6% |
| 9 | - | 1.4% | 0.5% | 2.8% | 2.4% | 3.5% |
| 10 | - | 1.5% | 0.6% | 2.6% | 2.1% | 3.1% |
| 11 | - | 1.5% | 0.9% | 2.3% | 1.9% | 2.6% |
| 12 | - | 1.3% | 1.2% | 2.6% | 2.5% | 2.8% |
| 13 | - | 1.5% | 1.8% | 2.5% | 2.0% | 3.1% |
| 14 | - | 1.3% | 2.3% | 2.1% | 1.3% | 2.6% |
| 15 | - | 1.4% | 1.9% | 1.8% | 1.6% | 1.9% |
| 16 | - | 1.2% | 1.9% | 2.0% | 1.5% | 2.4% |
| 17 | - | 1.2% | 1.6% | 1.7% | 1.4% | 2.3% |
| 18 | - | 1.1% | 1.4% | 1.5% | 1.2% | 2.1% |
| 19 | - | 0.9% | 1.3% | - | - | - |
| 20 | - | 1.0% | 1.2% | - | - | - |
| 21 | - | 0.9% | 1.2% | - | - | - |
| 22 | - | 0.7% | 1.2% | - | - | - |
| 23 | - | 0.9% | 1.2% | - | - | - |
| 24 | - | 0.9% | 1.3% | - | - | - |
| 25 | - | 0.7% | 1.3% | - | - | - |
| 26 | - | 0.9% | 1.8% | - | - | - |
| 27 | - | 0.8% | 2.0% | - | - | - |
| 28 | - | 0.6% | 1.9% | - | - | - |
| 29 | - | 0.6% | 1.8% | - | - | - |
| 30 | - | 0.7% | 1.6% | - | - | - |
| 31 | - | 1.0% | 1.3% | - | - | - |
| 32 | - | 0.9% | 1.2% | - | - | - |
| 33 | - | 0.9% | 1.4% | - | - | - |
| 34 | - | 1.2% | 1.3% | - | - | - |
Influenza Outbreak Surveillance
In week 39, no laboratory-confirmed influenza outbreaks were reported.
To date this season (August 27, 2023 to September 30, 2023):
- 6 laboratory-confirmed influenza outbreaks have been reported
- 5 were in LTC facilities (83%)
- 1 was in a facility categorized as 'other' (17%)
- All outbreaks were due to influenza A and among those with subtyping information (4), 50% were due to influenza A(H1N1)
- 3 ILI outbreaks have been reported
- All ILI outbreaks have been reported in schools and/or daycares.
Outbreaks of ILI are not specific to any one respiratory pathogen and can be due influenza, or other respiratory viruses, including respiratory syncytial virus, rhinovirus, COVID-19, or a mixture of viruses.
Number of provinces and territoriesFootnote 1 reporting in week 39: 10 out of 13
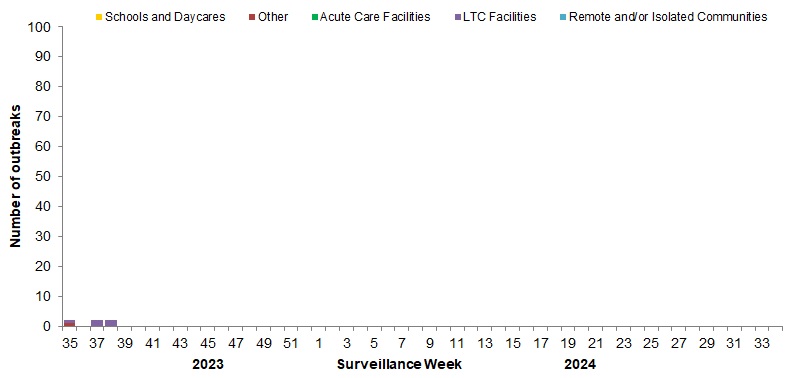
Figure 7 - Text description
| Surveillance Week | Acute Care Facilities | Long Term Care Facilities | Other | Schools and Daycares | Remote and/or Isolated Communities |
|---|---|---|---|---|---|
| 35 | 0 | 1 | 1 | 0 | 0 |
| 36 | 0 | 0 | 0 | 0 | 0 |
| 37 | 0 | 2 | 0 | 0 | 0 |
| 38 | 0 | 2 | 0 | 0 | 0 |
| 39 | 0 | 0 | 0 | 0 | 0 |
| 40 | 0 | 0 | 0 | 0 | 0 |
| 41 | 0 | 0 | 0 | 0 | 0 |
| 42 | 0 | 0 | 0 | 0 | 0 |
| 43 | 0 | 0 | 0 | 0 | 0 |
| 44 | 0 | 0 | 0 | 0 | 0 |
| 45 | 0 | 0 | 0 | 0 | 0 |
| 46 | 0 | 0 | 0 | 0 | 0 |
| 47 | 0 | 0 | 0 | 0 | 0 |
| 48 | 0 | 0 | 0 | 0 | 0 |
| 49 | 0 | 0 | 0 | 0 | 0 |
| 50 | 0 | 0 | 0 | 0 | 0 |
| 51 | 0 | 0 | 0 | 0 | 0 |
| 52 | 0 | 0 | 0 | 0 | 0 |
| 1 | 0 | 0 | 0 | 0 | 0 |
| 2 | 0 | 0 | 0 | 0 | 0 |
| 3 | 0 | 0 | 0 | 0 | 0 |
| 4 | 0 | 0 | 0 | 0 | 0 |
| 5 | 0 | 0 | 0 | 0 | 0 |
| 6 | 0 | 0 | 0 | 0 | 0 |
| 7 | 0 | 0 | 0 | 0 | 0 |
| 8 | 0 | 0 | 0 | 0 | 0 |
| 9 | 0 | 0 | 0 | 0 | 0 |
| 10 | 0 | 0 | 0 | 0 | 0 |
| 11 | 0 | 0 | 0 | 0 | 0 |
| 12 | 0 | 0 | 0 | 0 | 0 |
| 13 | 0 | 0 | 0 | 0 | 0 |
| 14 | 0 | 0 | 0 | 0 | 0 |
| 15 | 0 | 0 | 0 | 0 | 0 |
| 16 | 0 | 0 | 0 | 0 | 0 |
| 17 | 0 | 0 | 0 | 0 | 0 |
| 18 | 0 | 0 | 0 | 0 | 0 |
| 19 | 0 | 0 | 0 | 0 | 0 |
| 20 | 0 | 0 | 0 | 0 | 0 |
| 21 | 0 | 0 | 0 | 0 | 0 |
| 22 | 0 | 0 | 0 | 0 | 0 |
| 23 | 0 | 0 | 0 | 0 | 0 |
| 24 | 0 | 0 | 0 | 0 | 0 |
| 25 | 0 | 0 | 0 | 0 | 0 |
| 26 | 0 | 0 | 0 | 0 | 0 |
| 27 | 0 | 0 | 0 | 0 | 0 |
| 28 | 0 | 0 | 0 | 0 | 0 |
| 29 | 0 | 0 | 0 | 0 | 0 |
| 30 | 0 | 0 | 0 | 0 | 0 |
| 31 | 0 | 0 | 0 | 0 | 0 |
| 32 | 0 | 0 | 0 | 0 | 0 |
| 33 | 0 | 0 | 0 | 0 | 0 |
| 34 | 0 | 0 | 0 | 0 | 0 |
Influenza Severe Outcomes Surveillance
Provincial/Territorial Influenza Hospitalizations and Deaths
In week 39, less than five influenza-associated hospitalizations and no ICU admissions were reported by participating provinces and territoriesFootnote 2.
To date this season (August 27, 2023 to September 30, 2023), 21 influenza-associated hospitalizations were reported by participating provinces and territories:
- 95% of the hospitalizations were associated with influenza A.
- Of the cases with subtype information (17), 88% were associated with influenza A(H1N1)
- Adults aged 65 years of age and older accounted for 57% of reported hospitalizations.
To date this season (August 27, 2023 to September 30, 2023), less than five ICU admissions and less than five influenza-associated deaths were reported.
Number of provinces and territories reporting in week 39: 6 out of 9
Pediatric Influenza Hospitalizations and Deaths
In week 39, less than 5 influenza-associated pediatric (≤16 years of age) hospitalizations and no influenza-associated ICU admissions or deaths were reported by the Immunization Monitoring Program Active (IMPACT) network.
To date this season (August 27, 2023 to September 30, 2023):
- 9 pediatric influenza-associated hospitalizations have been reported.
- All of the hospitalizations were associated with influenza A.
- No influenza-associated ICU admissions have been reported and no influenza-associated pediatric deaths have been reported
Influenza Strain Characterization
The National Microbiology Laboratory has not yet reported influenza strain characterization results for influenza viruses collected during the 2023-2024 season.
Antiviral Resistance
The National Microbiology Laboratory has not yet reported antiviral resistance results for influenza viruses collected during the 2023-2024 season.
Influenza Vaccine Monitoring
Vaccine monitoring refers to activities related to the monitoring of influenza vaccination coverage and vaccine effectiveness.
Vaccination Coverage
Influenza vaccine coverage estimates for the 2023-2024 season are anticipated to be available in February or March 2024.
Vaccine Effectiveness
Influenza vaccine effectiveness estimates for the 2023-2024 season are anticipated to be available in February or March 2024.
Provincial and International Surveillance Links
See Influenza surveillance resources
Notes
The data in the FluWatch report represent surveillance data available at the time of writing. All data are preliminary and may change as updates are received.
To learn more about the FluWatch program, see the Overview of influenza monitoring in Canada page.
For more information on the flu, see our Flu (influenza) web page.
We would like to thank all the FluWatch surveillance partners participating in this year's influenza surveillance program.
This report is available on the Government of Canada Influenza webpage.
Ce rapport est disponible dans les deux langues officielles.
- Footnote 1
-
All Provinces and Territories (PTs) participate in the FluWatch outbreak surveillance system. This outbreak system monitors influenza and ILI outbreaks in long-term care facilities (LTCF), acute care facilities, schools and daycares, remote and/or isolated communities, and facilities categorized as 'other'. Not all reporting PTs report outbreaks in all these settings. All PTs report laboratory confirmed outbreaks in LTCF. Four PTs (NB, NL, NS and YK) report ILI outbreaks in schools and/or daycares and other facilities.
- Footnote 2
-
Influenza-associated hospitalizations are reported by Alberta, Manitoba, New Brunswick, Newfoundland and Labrador, Northwest Territories, Nova Scotia, Prince Edward Island and Yukon. Only hospitalizations that require intensive medical care are reported by Saskatchewan.
Page details
- Date modified: