
Report on sexually transmitted infections in Canada, 2018
Download the alternative format
(PDF format, 2.19 MB, 30 pages)
Organization: Public Health Agency of Canada
Published: 24-06-2021
Cat.: HP37-10E-PDF
ISBN: 1923-2977
Pub.: 200329
Table of Contents
- Acknowledgments
- 1.0 Key Messages
- 2.0 Introduction
- 3.0 Methods
- 4.0 Chlamydia
- 5.0 Gonorrhea
- 6.0 Infectious Syphilis
- 7.0 Discussion
- References
- Appendix A
Acknowledgments
The publication of this report would not have been possible without the collaboration of the provincial / territorial public health authorities, whose continuous contribution to national STI surveillance is gratefully appreciated.
1.0 Key messages
- While sexually transmitted infections (STIs) are curable or manageable and prevention can reduce transmission, rates of STIs have been increasing dramatically over the last decade and continue to be a significant and increasing public health concern in Canada.
- In 2018, a total of 117,008 cases of chlamydia were reported as well as 30,874 cases of gonorrhea and 6,281 cases of infectious syphilis, which corresponded to rates of 363.2, 95.8 and 16.9 cases per 100,000 population, respectively.
- In 2018, more than three quarters (76.1%) of reported chlamydia cases were among people less than 30 years of age. This is similar (56.3%) to what is seen in gonorrhea, but in contrast to infectious syphilis, in which the same age groups accounted for only 37.8%.
- Gonorrhea rates have almost doubled in the past 5 years.
- Infectious syphilis rates have more than tripled in the past decade and experienced the highest increase in rates of all STIs with a more than 259.5% increase over this time period. Although the rate of reported syphilis cases among males was more than three times higher than that among females in 2018, in the past 5 years, females rates increased by 691.5%, compared to a 109.1% relative increase among males.
2.0 Introduction
Sexually transmitted infections (STIs) continue to be a significant and ever-increasing public health concern in Canada. STIs are among the most common communicable infections affecting the health and lives of people worldwide. Sexually transmitted pathogens have the ability to compromise the quality of life, as well as sexual and reproductive health, and newborn healthFootnote 1. STIs can also indirectly expedite the sexual transmission of human immunodeficiency virus (HIV) and can cause cellular changes that may precede some cancersFootnote 1,Footnote 2. Rates of notifiable STIs have increased despite numerous public health interventions designed to strengthen awareness and to prevent, diagnose and treat infection. There are various potential factors that may explain these observations such as true rise in incidence, the use of improved diagnostic methods, and more effective contact tracing and case findingFootnote 2.
To address the STI epidemic, the World Health Organization, in 2016, published the Global Health Sector Strategy on Sexually Transmitted Infections, 2016-2021: Towards Ending STIsFootnote 1. Supporting the goals and targets of this global strategy, the Government of Canada, in June 2018, released the Pan-Canadian Sexually Transmitted and Blood-Borne Infection Framework for ActionFootnote 3.
In July 2019, in response to the Framework, the Government of Canada launched its action plan - Accelerating our Response: Government of Canada Five-Year Action Plan on Sexually Transmitted and Blood-Borne InfectionsFootnote 4, which emphasizes the tangible actions to be undertaken over the next five years to move Canada closer to achieving the strategic goals outlined in the Framework. Included is the development of Canadian-made targets and indicators, which will drive our domestic actions and unify us in our commitment to specific results4. Given the importance that monitoring and surveillance data reporting has on measuring the success of our actions, one of the key commitments outlined is the strengthening of Canada's national surveillance systemsFootnote 4.
This report provides an update on the epidemiology of three nationally notifiable STIs in Canada: chlamydia, gonorrhea and infectious syphilis (including congenital syphilis) using data up to 2018, by province/territory, age group and sex. In addition, updated information related to syphilis collected through the Public Health Agency of Canada (PHAC) Syphilis Outbreak Investigation Coordination Committee (SOICC) have been included.
3.0 Methods
3.1 Data sources
In Canada, the surveillance of nationally notifiable diseases is conducted by the PHAC in coordination with provincial and territorial governments via the Canadian Notifiable Disease Surveillance System (CNDSS)Footnote 5. Provincial and territorial health authorities provide non-nominal data on laboratory-confirmed cases. Variables submitted by all reporting jurisdictions are: age at diagnosis, year of diagnosis, province/territory of diagnosis, and sex. As such, national reporting is limited to analyses of these variables. CNDSS staff validate the reported data with the submitting province or territory during data processing to resolve data errors or inconsistencies and maximize accuracy. Chlamydia has been nationally notifiable since 1991 while gonorrhea and syphilis have been notifiable since 1924Footnote 6. Extracts from the CNDSS are used as the basis for national surveillance reports; this report is based on data extracted in April 2020. Historical data for all three nationally notifiable STIs (chlamydia, gonorrhea and infectious syphilis) were available from all provinces and territories from 2009 to 2017. For 2018, data from British Columbia was not available, and as such, not included in the analyses for 2018.
In July 2019, PHAC established a SOICC to support the coordination of the Canadian response in dealing with the rise in the number of syphilis cases and jurisdictionally declared outbreaks. All of the provinces and territories have collected and shared with PHAC preliminary 2018 enhanced syphilis surveillance data.
3.2 Case definitions
Case definitions for all three nationally notifiable STIs are available online.
3.3 Data analysis
A descriptive analysis of reported chlamydia, gonorrhea and infectious syphilis cases by year, age group and sex was conducted using data reported to the CNDSS using SAS, SPSS and Microsoft Excel. All reported cases of chlamydia and gonorrhea are included in national-level analysis. Only data on infectious syphilis cases (including primary, secondary, early latent and infectious neurosyphilis stages) are presented in this report.
National annual rates of reported cases of chlamydia, gonorrhea and infectious syphilis were computed using the number of cases from the CNDSS as numerators and Statistics Canada 2018 yearly population estimates as denominators. Rates, percentages and change in rates were calculated using unrounded numbers; no statistical procedures were used for comparative analyses. Observed trends over time must be interpreted with caution, as rates based on small numbers are prone to fluctuation over time. Previous reports may present different rates for some years due to improved diagnostic capabilities, improved duplicate removal, shortened reporting delay and changes in reporting practices at the jurisdictional level.
Supplementary tables are listed in Appendix A and are available upon request.
4.0 Chlamydia
Chlamydia, an infection caused by Chlamydia trachomatis, has been nationally notifiable since 1991 and remains the most commonly reported bacterial STI in CanadaFootnote 7 and worldwide with an estimated 127 million cases globally in 2018Footnote 8. Rates have been increasing steadily since 1997Footnote 2. Since asymptomatic infections are common in men and women, affected individuals unaware of their statusFootnote 9, in the absence of screening, can contribute to the spread of infection.
The number of rates of reported chlamydia cases continue to increase. In Canada, between 2009 and 2018, the number of reported chlamydia cases increased steadily, from 87,283 to 117,008. The corresponding overall rate in 2018 was 363.2 cases per 100,000 population, an increase of 40.5% from 2009 (Figure 1). On average, over the past decade, nationally reported chlamydia rates have increased by 5.0% per year.

aOverall includes unspecified sex.
*2018 data does not include British Columbia.
Figure 1 - Text equivalent
This graph presents the overall and sex-specific rates of reported chlamydia cases as well as total cases, between 2009 and 2018 in Canada. The horizontal axis shows the calendar years from 2009 to 2018. The left vertical axis shows the rate of reported chlamydia cases per 100,000 population for male, female, and overall. The right vertical axis shows the total number of reported chlamydia cases per each calendar year.
| Year | Reported Rates per 100,000 population | Total Cases | ||
|---|---|---|---|---|
| Male Rate | Female Rate | Overall Rate | ||
| 2009 | 175.4 | 339.7 | 258.6 | 87,283 |
| 2010 | 189.7 | 363.4 | 277.5 | 94,716 |
| 2011 | 203.0 | 383.4 | 294.3 | 101,393 |
| 2012 | 214.5 | 388.0 | 302.2 | 105,281 |
| 2013 | 220.4 | 376.1 | 299.1 | 105,322 |
| 2014 | 230.4 | 382.5 | 307.3 | 109,282 |
| 2015 | 249.0 | 399.0 | 325.1 | 116,444 |
| 2016 | 260.7 | 405.9 | 334.3 | 121,218 |
| 2017 | 275.1 | 410.9 | 344.0 | 126,298 |
| 2018 | 293.9 | 430.4 | 363.2 | 117,008 |
*2018 data does not include British Columbia
4.1 Geographic distribution
Rates of reported chlamydia cases varied by province and territory. In 2018, rates ranged from 183.5 in Newfoundland and Labrador to 3,965.9 cases per 100,000 population in Nunavut. The highest rates were among people from the Northern territories, with rates of 699.8 per 100,000 (Yukon), 1,747.1 cases per 100,000 (Northwest Territories) and 3,965.9 (Nunavut). The three territories have held the highest rates across Canada over the past decade. In addition, Alberta, Manitoba and Saskatchewan reported rates above the Canadian rate of 363.2 (402.0, 546.3 and 552.7 cases per 100,000 population respectively) (Figure 2).

NA: Not available.
Figure 2 - Text Equivalent
This map presents the rates of reported chlamydia cases by province and territory in Canada in 2018. The vertical axis shows the rate of reported chlamydia cases per 100,000 population in grading colors, corresponding to those on the map.
| Province or Territory | Reported Rates per 100,000 population |
|---|---|
| British Columbia | NA |
| Alberta | 402.0 |
| Saskatchewan | 552.7 |
| Manitoba | 546.3 |
| Ontario | 332.5 |
| Quebec | 337.8 |
| New Brunswick | 282.9 |
| Nova Scotia | 340.0 |
| Prince Edward Island | 267.6 |
| Newfoundland and Labrador | 183.5 |
| Yukon | 699.8 |
| Northwest Territories | 1,747.1 |
| Nunavut | 3,965.9 |
| Canada | 363.2 |
*2018 data does not include British Columbia. NA: Not available
Although the highest rates were observed in the three territories, the largest relative increases in rates since 2009 were occurring elsewhere in Canada. Prince Edward Island had the largest relative rate increase in the past decade (86.3%), from 143.7 to 267.6 cases per 100,000 population, and Newfoundland had the second largest increase (78.0%) from 103.1 to 183.5 cases per 100,000 population. Notably, the only province/territory to experience a decrease in rate was the Northwest Territories, decreasing 26.3% from 2,369.3 cases per 100,000 in 2009 to 1,747.1 cases per 100,000 in 2018.
4.2 Age and sex distribution
In 2018, more than three quarters (76.1%) of reported chlamydia cases were among people less than 30 years of age. This is similar to what is seen in gonorrhea, but in contrast to infectious syphilis, in which the same age groups accounted for only 37.8%. People between the ages of 15 to 24 accounted for more than half (55.6%) of the reported chlamydia cases in 2018.
Overwhelmingly, females accounted for the majority of cases in the younger age groups. Females less than 30 years of age accounted for 48.9% of all cases in 2018, whereas males of the same age group accounted for 27.1% of all cases. Nearly one-quarter (22.0%) of all cases occurred in females between the ages of 20 and 24 years. Among cases 30 years of age and older, males accounted for the majority of cases.
The highest rates of reported chlamydia cases were among the 20 to 24 year age group (1,928.8 cases per 100,000 population), followed by the 15 to 19 and 25 to 29 year age groups (1,308.9 and 1,047.9 cases per 100,000, respectively) (Figure 3).

*2018 data does not include British Columbia.
Figure 3 - Text Equivalent
This graph presents the overall rates of reported chlamydia cases by age group, between 2009 and 2018, in Canada. The horizontal axis shows the calendar years from 2009 to 2018. The vertical axis shows the rate of reported chlamydia cases per 100,000 population for age groups from under 15 years old to 60 years old and over.
| Year | Age groups | ||||||
|---|---|---|---|---|---|---|---|
| <15 years | 15-19 years | 20-24 years | 25-29 years | 30-39 years | 40-59 years | 60+ years | |
| 2009 | 11.5 | 1,050.1 | 1,385.3 | 671.9 | 236.0 | 43.6 | 3.4 |
| 2010 | 11.3 | 1,094.6 | 1,491.5 | 728.9 | 262.8 | 48.9 | 4.1 |
| 2011 | 11.7 | 1,146.8 | 1,601.0 | 773.0 | 284.5 | 53.4 | 4.3 |
| 2012 | 10.8 | 1,138.7 | 1,626.6 | 832.3 | 306.6 | 58.8 | 4.6 |
| 2013 | 11.3 | 1,100.3 | 1,609.4 | 846.7 | 315.9 | 60.1 | 4.8 |
| 2014 | 10.5 | 1,088.6 | 1,661.8 | 897.4 | 339.8 | 64.9 | 5.9 |
| 2015 | 11.0 | 1,128.4 | 1,768.9 | 962.0 | 375.5 | 73.5 | 6.3 |
| 2016 | 10.2 | 1,162.5 | 1,811.4 | 989.5 | 393.7 | 81.4 | 7.0 |
| 2017 | 9.7 | 1,195.9 | 1,861.9 | 1,017.3 | 410.7 | 84.5 | 7.8 |
| 2018 | 10.5 | 1,308.9 | 1,928.8 | 1,047.9 | 434.8 | 91.1 | 8.0 |
*2018 data does not include British Columbia.
Since 2009, all age groups experienced an increase in rate except for those under 15 years of age, although the magnitude of this change varied by age group. People in the 20 to 24 year age group had the largest absolute rate difference, increasing by 543.5 cases per 100,000 population (39.2% increase) since 2009.
Older cohorts (those 30 years of age and over) had the lowest rates but experienced the largest relative change in rate in the past ten years. The relative change in rate increased with advancing age. Between 2009 and 2018, people 60 years of age and older had the largest relative increase in rate (133.5%), from 3.4 to 8.0 cases per 100,000 population, followed by those in the 40 to 59 age group (109.0%), going from 43.6 to 91.1 cases per 100,000 population.
In both women and men, the highest reported rates of chlamydia infections were in 20 to 24 year olds, although the rate in women (2,538.1 per 100,000 females) was almost twice as high as that in men (1,363.8 per 100,000 males). The ratio of female to male rates decreased with age. In the 30 years and older age groups, rates were higher in men than in women (Figure 4).

*2018 data does not include British Columbia.
Figure 4 - Text Equivalent
This graph presents the overall rates of reported chlamydia cases by sex and age group for 2018 in Canada. The horizontal axis shows the age groups from under 15 years old to 60 years old and over, with the blue bars representing males and the red bars representing females. The vertical axis shows the rate of reported chlamydia cases per 100,000 population for age groups and sex from under 15 years old to 60 years old and over.
| Age groups | Reported Rates per 100,000 population | |
|---|---|---|
| Male rate | Female rate | |
| <15 years | 1.8 | 19.6 |
| 15-19 years | 623.2 | 2,028.1 |
| 20-24 years | 1,368.8 | 2,538.1 |
| 25-29 years | 923.1 | 1,177.5 |
| 30-39 years | 454.9 | 413.2 |
| 40-59 years | 110.5 | 71.4 |
| 60+ years | 12.9 | 3.6 |
*2018 data does not include British Columbia.
For every year between 2009 and 2018, female rates were higher than male rates among the younger populations (less than 40 years of age), except for 2017 onward when male rates began to be slightly higher than female rates among the 30-39 age group. Accordingly, male rates were consistently higher than female rates among people over 40 years of age.
Over the past decade, among both males and females, the highest rate of reported chlamydia infections was seen in those under 30. Conversely, the greatest relative increase were seen in the age groups over 40 (Figure 5 and Figure 6).

*2018 data does not include British Columbia.
Figure 5 - Text Equivalent
This graph presents the overall rates of reported chlamydia cases in males by age group, between 2009 and 2018, in Canada. The horizontal axis shows the calendar years from 2009 to 2018. The vertical axis shows the rate of reported chlamydia cases per 100,000 population for age groups from under 15 years old to 60 years old and over.
| Year | Age groups | ||||||
|---|---|---|---|---|---|---|---|
| <15 years | 15-19 years | 20-24 years | 25-29 years | 30-39 years | 40-59 years | 60+ years | |
| 2009 | 2.5 | 401.0 | 920.5 | 559.1 | 210.3 | 47.0 | 4.9 |
| 2010 | 2.4 | 420.9 | 987.8 | 607.3 | 238.1 | 50.5 | 6.3 |
| 2011 | 2.2 | 446.4 | 1,072.4 | 650.0 | 251.9 | 56.0 | 5.9 |
| 2012 | 2.4 | 466.5 | 1,084.2 | 712.3 | 276.0 | 62.0 | 6.3 |
| 2013 | 2.3 | 455.1 | 1,091.3 | 740.2 | 298.8 | 66.7 | 7.6 |
| 2014 | 1.4 | 459.4 | 1,134.4 | 773.5 | 323.4 | 72.9 | 9.1 |
| 2015 | 1.9 | 501.3 | 1,208.6 | 835.5 | 361.3 | 83.2 | 10.1 |
| 2016 | 1.9 | 517.9 | 1,246.2 | 860.4 | 391.1 | 94.1 | 10.7 |
| 2017 | 2.2 | 556.9 | 1,281.8 | 910.8 | 417.1 | 102.1 | 12.4 |
| 2018 | 1.8 | 623.2 | 1,363.8 | 923.1 | 454.9 | 110.5 | 12.9 |
*2018 data does not include British Columbia.
Although reported rates in older men remained low compared to other age groups, substantial increases were seen since 2009. Between 2009 and 2018, reported rates in 40 to 59 years olds increased by 135.3% (from 47.0 to 110.5 per 100,000 males) and by 163.2% in those 60 years of age and older (from 4.9 to 12.9 per 100,000 males) (Figure 5).
Among women, the highest rates are consistently seen among the younger age groups: 20-24, followed by 15-19 and 25-29 year olds. While reported rates in older women remained low compared to other age groups, substantial increases were seen since 2009. Between 2009 and 2018, reported rates in 40 to 59 year olds increased by 78.4% (from 40.0 to 71.4 per 100,000 females) and by 68.4% in those 60 years of age and older (from 2.2 to 3.6 per 100,000 females) (Figure 6).

*2018 data does not include British Columbia.
Figure 6 - Text Equivalent
This graph presents the overall rates of reported chlamydia cases in females by age group, between 2009 and 2018, in Canada. The horizontal axis shows the calendar years from 2009 to 2018. The vertical axis shows the rate of reported chlamydia cases per 100,000 population for age groups from under 15 years old to 60 years old and over.
| Year | Age groups | ||||||
|---|---|---|---|---|---|---|---|
| <15 years | 15-19 years | 20-24 years | 25-29 years | 30-39 years | 40-59 years | 60+ years | |
| 2009 | 20.9 | 1726.2 | 1864.3 | 784.2 | 261.2 | 40.0 | 2.2 |
| 2010 | 20.6 | 1799.1 | 2007.4 | 850.8 | 287.2 | 47.3 | 2.3 |
| 2011 | 21.7 | 1883.7 | 2144.8 | 895.8 | 316.7 | 50.5 | 3.0 |
| 2012 | 19.5 | 1852.8 | 2193.3 | 953.3 | 336.7 | 55.4 | 3.1 |
| 2013 | 20.6 | 1788.3 | 2157.2 | 955.3 | 332.5 | 53.4 | 2.4 |
| 2014 | 20.0 | 1759.4 | 2226.3 | 1024.4 | 355.9 | 56.8 | 3.1 |
| 2015 | 20.4 | 1795.8 | 2372.2 | 1092.8 | 388.9 | 63.9 | 3.0 |
| 2016 | 18.8 | 1845.7 | 2422.9 | 1124.1 | 394.9 | 68.6 | 3.9 |
| 2017 | 17.4 | 1869.0 | 2488.2 | 1128.8 | 401.7 | 67.0 | 3.8 |
| 2018 | 19.6 | 2028.1 | 2538.1 | 1177.5 | 413.2 | 71.4 | 3.6 |
*2018 data does not include British Columbia.
In all provinces and territories, rates of reported cases of chlamydia were highest among those aged 20 to 24 years in 2018. With the exception of Prince Edward Island, those aged 15 to 19 years had the second highest rates in 2018. For Prince Edward Island, the second highest rates were among those aged 25 to 29 years.
The majority of cases were female in each jurisdiction, and the proportion of cases by sex in provinces and territories remained fairly close to the national proportions of 60% female cases and 40% male.
5.0 Gonorrhea
Gonorrhea, an infection caused by Neisseria gonorrhoeae, has been nationally notifiable since 1924 and remains the second most commonly reported bacterial STI in CanadaNote de bas de page 10. Untreated gonococcal infections can lead to complications for both sexes, with more severe consequences for womenNote de bas de page 10.
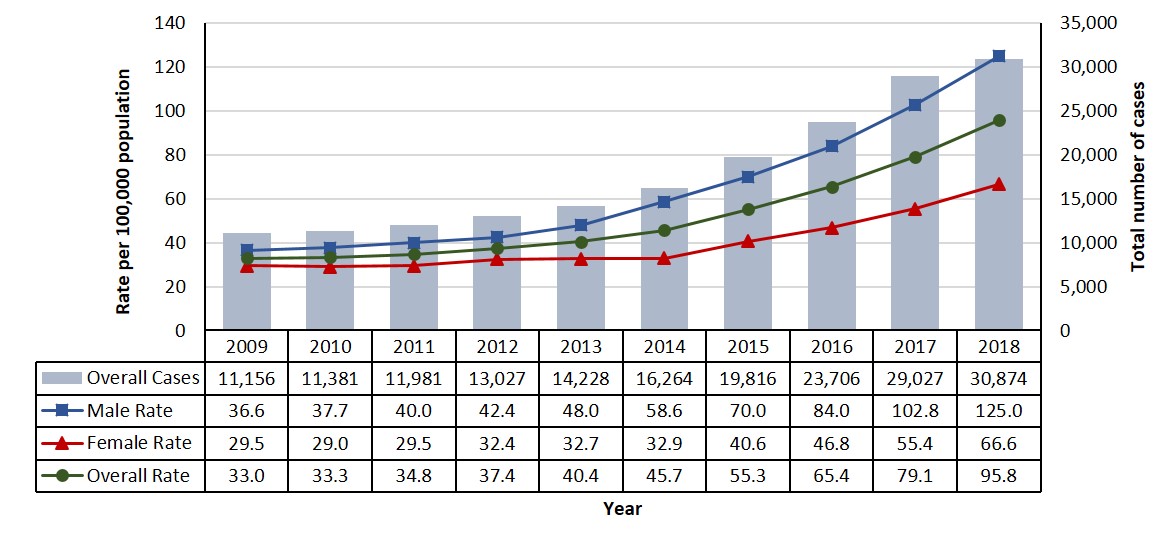
From 2009 to 2012, the number and rate of reported gonorrhea cases remained relatively stable. Following 2012, the number and rate of reported gonorrhea cases began increasing. In 2018, 30,874 cases of gonorrhea were reported nationally, corresponding to a rate of 95.8 cases per 100,000 population. On average, over the past decade, nationally reported gonorrhea rates have increased by 9.4% per year. The increase of reported cases between 2017 and 2018 was sharper than previous years with an increase of 21.2%, from 79.1 to 95.8 per 100,000 (Figure 7).
aOverall includes unspecified sex.
*2018 data does not include British Columbia.
Figure 7 - Text Equivalent
This graph presents the overall and sex-specific rates of reported gonorrhea cases as well as total cases, between 2009 and 2018 in Canada. The horizontal axis shows the calendar years from 2009 to 2018. The left vertical axis shows the rate of reported chlamydia cases per 100,000 population for male, female, and overall. The right vertical axis shows the total number of reported gonorrhea cases per each calendar year.
| Year | Reported Rates per 100,000 population | Total Cases | ||
|---|---|---|---|---|
| Male Rate | Female Rate | Overall Rate | ||
| 2009 | 36.6 | 29.5 | 33.0 | 11,156 |
| 2010 | 37.7 | 29.0 | 33.3 | 11,381 |
| 2011 | 40.0 | 29.5 | 34.8 | 11,981 |
| 2012 | 42.4 | 32.4 | 37.4 | 13,027 |
| 2013 | 48.0 | 32.7 | 40.4 | 14,228 |
| 2014 | 58.6 | 32.9 | 45.7 | 16,264 |
| 2015 | 70.0 | 40.6 | 55.3 | 19,816 |
| 2016 | 84.0 | 46.8 | 65.4 | 23,706 |
| 2017 | 102.8 | 55.4 | 79.1 | 29,027 |
| 2018 | 125.0 | 66.6 | 95.8 | 30,874 |
*2018 data does not include British Columbia
5.1 Geographic distribution
Rates of reported gonorrhea in 2018 varied by province and territory ranging from 8.4 cases per 100,000 population in Prince Edward Island to 1,911.1 cases per 100,000 population in Nunavut. In 2018, the highest number of gonorrhea cases were reported in the most populated provinces - Ontario (33.8%), Quebec (24.4%), and Alberta (16.2%). However, reported rates were highest in two Territories (Figure 8).
Since 2009, the highest rates have been among Nunavut and the Northwest Territories, both with rates above 1,000 cases per 100,000 population in 2018. Manitoba had the third highest rate in 2018 with 265.0 cases per 100,000 population. The Atlantic provinces (New Brunswick, Nova Scotia, Prince Edward Island and Newfoundland) have held the lowest rates of reported gonorrhea cases since 2009.

NA: Not available.
Figure 8 - Text Equivalent
This map presents the rates of reported gonorrhea cases by province and territory in Canada in 2018. The vertical axis shows the rate of reported gonorrhea cases per 100,000 population in grading colors, corresponding to those on the map.
| Province or Territory | Reported Rates per 100,000 population |
|---|---|
| British Columbia | NA |
| Alberta | 115.9 |
| Saskatchewan | 220.8 |
| Manitoba | 265.0 |
| Ontario | 72.4 |
| Quebec | 89.7 |
| New Brunswick | 12.3 |
| Nova Scotia | 32.0 |
| Prince Edward Island | 8.4 |
| Newfoundland and Labrador | 13.9 |
| Yukon | 71.5 |
| Northwest Territories | 1,027.3 |
| Nunavut | 1,911.1 |
| Canada | 363.2 |
*2018 data does not include British Columbia. NA: Not available
Since 2009, the rate of reported cases of gonorrhea increased in all provinces and territories. Between 2009 and 2018, the greatest increase in reported gonorrhea rates occurred in Prince Edward Island, with an increase of 1,078.7% and Newfoundland, with an increase of 621.3%. Despite these large increases, the overall number of cases remain small (13 cases in Prince Edward Island and 73 cases in Newfoundland).
5.2 Age and sex distribution
Since 2009, males comprised the majority of reported gonorrhea cases in Canada, ranging from 54.8% in 2009 to 64.8% in 2018. In 2018, the national male-to-female gonorrhea ratio was 1.9:1.0, reflecting that more men than women were diagnosed with gonorrhea. Between 2009 and 2018, rates in males increased by 241.9% from 36.6 to 125.0 per 100,000 males and rates in females increased by 125.5%, from 29.5 to 66.6 per 100,000 females. The 2018 reported rate among men was nearly twice as high as the female rate, with 125.0 cases per 100,000 males compared to 66.6 cases per 100,000 females. Male rates are also increasing more quickly than female rates, creating a wider gap between male and female rates (Figure 7).
Reported rates of gonococcal infections in 2018 were highest in the 20 to 24 year (333.1 per 100,000 population) and 25 to 29 year (311.9 per 100,000 population) age groups. Since 2009, all age groups experienced an increase in rate. From 2009 to 2011, 15 to 19 year olds experienced the second highest reported rates of gonorrhea. Starting in 2012, the second highest reported rates of gonorrhea were among the 25 to 29 year olds. In 2017 and 2018, the 30 to 39 year age group overtook the 15 to 19 year age group with the third highest rates (Figure 9).
Nearly three-quarters (72.4%) of the reported gonorrhea cases were among 20 to 39 years olds in 2018. This is similar to what is seen in chlamydia (71.5%), but in contrast to infectious syphilis, in which the same age groups accounted for only 62.5%. People under 30 years of age accounted for more than half (56.3%) of the reported gonorrhea cases in 2018.
In 2018, males 20 years of age and older accounted for 60.9% of all cases, whereas females from these same age groups accounted for 28.1% of all cases. More than one-quarter (27.8%) of cases occurred in males between 20 and 29 years of age. Out of all cases, those that were 40 years of age and older, males accounted for 13.8% and females accounted for 2.9%.

*2018 data does not include British Columbia.
Figure 9 - Text Equivalent
This graph presents the overall rates of reported gonorrhea cases by age group, between 2009 and 2018, in Canada. The horizontal axis shows the calendar years from 2009 to 2018. The vertical axis shows the rate of reported gonorrhea cases per 100,000 population for age groups from under 15 years old to 60 years old and over.
| Year | Age groups | ||||||
|---|---|---|---|---|---|---|---|
| <15 years | 15-19 years | 20-24 years | 25-29 years | 30-39 years | 40-59 years | 60+ years | |
| 2009 | 1.7 | 103.1 | 146.3 | 86.9 | 41.2 | 13.4 | 1.7 |
| 2010 | 1.8 | 101.1 | 140.7 | 91.9 | 42.7 | 14.1 | 2.2 |
| 2011 | 1.6 | 100.7 | 146.5 | 96.8 | 45.4 | 15.9 | 2.2 |
| 2012 | 1.7 | 106.1 | 157.3 | 111.2 | 50.6 | 16.1 | 2.1 |
| 2013 | 2.1 | 109.2 | 164.0 | 120.8 | 59.6 | 18.3 | 2.1 |
| 2014 | 1.5 | 102.5 | 184.1 | 141.5 | 72.5 | 23.3 | 2.9 |
| 2015 | 1.7 | 113.0 | 210.8 | 178.6 | 99.1 | 28.1 | 3.3 |
| 2016 | 1.7 | 124.5 | 235.3 | 211.6 | 121.1 | 36.8 | 4.8 |
| 2017 | 2.2 | 148.8 | 270.7 | 261.8 | 151.5 | 45.0 | 5.3 |
| 2018 | 2.6 | 173.3 | 333.1 | 311.9 | 188.3 | 53.3 | 7.0 |
*2018 data does not include British Columbia.
The magnitude of the change in rate over time varied by age group. The 25 to 29 year age group increased the most, up 225.0 cases per 100,000 population since 2009. Notably, compared to 2009, all age groups above 19 years of age more than doubled in rate, with those over the age of 25 more than tripling the rate.
In all provinces and territories, rates of reported cases of gonorrhea were highest among those aged 20 to 24 in 2018, except for Prince Edward Island and Yukon, where rates were higher in those 25 to 29.

*2018 data does not include British Columbia.
Figure 10 - Text Equivalent
This graph presents the overall rates of reported gonorrhea cases by sex and age group for 2018 in Canada. The horizontal axis shows the age groups from under 15 years old to 60 years old and over, with the blue bars representing males and the red bars representing females. The vertical axis shows the rate of reported gonorrhea cases per 100,000 population for age groups and sex from under 15 years old to 60 years old and over.
| Age groups | Reported Rates per 100,000 population | |
|---|---|---|
| Male rate | Female rate | |
| <15 years | 0.8 | 4.5 |
| 15-19 years | 124.9 | 223.5 |
| 20-24 years | 358.9 | 303.8 |
| 25-29 years | 399.1 | 217.5 |
| 30-39 years | 269.8 | 105.6 |
| 40-59 years | 86.9 | 19.7 |
| 60+ years | 13.8 | 1.1 |
*2018 data does not include British Columbia.
In 2018, the highest reported rate of gonorrhea infections in males was in the 25 to 29 year age group (399.1 per 100,000 males), followed by the 20 to 24 year old (358.9 per 100,000 males) age group. Among females, the highest reported rate was in 20 to 24 year age group (303.8 per 100,000 females), followed by 15 to 19 year olds (223.5 per 100,000 females) (Figure 10).
Between 2009 and 2018, male rates were consistently higher than female rates among people older than 20 years of age (Figure 11 and Figure 12). In 2018, male rates for those above 29 years of age were more than double those among their female counterparts. From 2009 to 2014, males between the ages of 20 and 24 years experienced the highest rates of gonorrhea. There was a shift in 2015, with the highest rates among males occurring in those between the ages of 25 to 29 years (Figure 11).
Over the past decade, rates increased in all age groups among males, with the greatest absolute increase in rates of reported gonococcal infections observed in 25 to 29 year olds. The rate increased from 103.4 per 100,000 males in 2009 to 399.1 per 100,000 males, an increase of 295.6 per 100,000 males, or 285.8%. Although reported rates in both youth and older men remained low compared to other age groups, substantial increases were seen since 2009. Between 2009 and 2018, reported rates in males 60 years and older increased by 337.7% (from 3.1 to 13.8 per 100,000 males) and by 302.5% in those less than 15 years old (from 0.4 to 1.7 per 100,000 males) (Figure 11).

*2018 data does not include British Columbia.
Figure 11 - Text Equivalent
This graph presents the overall rates of reported gonorrhea cases in males by age group, between 2009 and 2018, in Canada. The horizontal axis shows the calendar years from 2009 to 2018. The vertical axis shows the rate of reported gonorrhea cases per 100,000 population for age groups from under 15 years old to 60 years old and over.
| Year | Age groups | ||||||
|---|---|---|---|---|---|---|---|
| <15 years | 15-19 years | 20-24 years | 25-29 years | 30-39 years | 40-59 years | 60+ years | |
| 2009 | 0.4 | 61.8 | 143.8 | 103.4 | 55.6 | 22.3 | 3.1 |
| 2010 | 0.8 | 60.7 | 140.0 | 113.2 | 59.1 | 22.9 | 4.2 |
| 2011 | 0.7 | 62.0 | 148.2 | 116.8 | 63.9 | 26.0 | 4.2 |
| 2012 | 0.6 | 62.8 | 153.8 | 136.0 | 69.8 | 25.8 | 3.7 |
| 2013 | 0.5 | 67.8 | 168.6 | 151.8 | 84.6 | 29.8 | 4.2 |
| 2014 | 0.3 | 70.6 | 199.4 | 189.0 | 106.8 | 38.5 | 5.7 |
| 2015 | 0.5 | 74.5 | 221.1 | 227.8 | 144.2 | 45.7 | 6.3 |
| 2016 | 0.4 | 82.4 | 251.0 | 268.0 | 173.8 | 60.3 | 9.2 |
| 2017 | 0.7 | 105.3 | 286.2 | 335.7 | 216.0 | 75.3 | 10.2 |
| 2018 | 0.8 | 124.9 | 358.9 | 399.1 | 269.8 | 86.9 | 13.8 |
*2018 data does not include British Columbia.
Between 2009 and 2018, female rates were consistently higher than male rates in the younger age groups (less than 20 years of age). In 2018, female rates for those 15 to 19 years of age were almost 50% greater among their male counterparts (Figure 11 and Figure 12).
In females, between 2009 and 2018, the greatest absolute increase in reported rates of gonorrhea was seen in 20 to 24 year olds. The rate increased by 155.4, from 148.4 to 303.8 cases per 100,000 females, or 104.7%. The greatest relative increase was seen in 40 to 59 year olds, which increased by 348.5%, from 4.4 to 19.7 cases per 100,000 females. Despite lower reported rates than those reported in males, between 2009 and 2018, reported rates in females 30 to 39 year of age increased by 297.4% (from 26.6 to 105.6 cases per 100,000 females), by 348.5% in 40 to 59 year olds (from 4.4 to 19.7 cases per 100,000 females), and by 155.1% in those 60 years and older (from 0.4 to 1.1 cases per 100,000 females) (Figure 12).

*2018 data does not include British Columbia.
Figure 12 - Text Equivalent
This graph presents the overall rates of reported gonorrhea cases in females by age group, between 2009 and 2018, in Canada. The horizontal axis shows the calendar years from 2009 to 2018. The vertical axis shows the rate of reported gonorrhea cases per 100,000 population for age groups from under 15 years old to 60 years old and over.
| Year | Age groups | ||||||
|---|---|---|---|---|---|---|---|
| <15 years | 15-19 years | 20-24 years | 25-29 years | 30-39 years | 40-59 years | 60+ years | |
| 2009 | 3.0 | 146.0 | 148.4 | 70.1 | 26.6 | 4.4 | 0.4 |
| 2010 | 3.0 | 143.4 | 141.3 | 70.2 | 26.3 | 5.1 | 0.5 |
| 2011 | 2.5 | 141.3 | 144.6 | 76.5 | 27.0 | 5.7 | 0.5 |
| 2012 | 2.8 | 152.2 | 160.5 | 85.8 | 31.5 | 6.2 | 0.7 |
| 2013 | 3.7 | 153.3 | 158.7 | 88.4 | 34.6 | 6.8 | 0.3 |
| 2014 | 2.7 | 136.4 | 167.2 | 91.6 | 38.2 | 8.2 | 0.5 |
| 2015 | 2.9 | 153.9 | 199.2 | 126.8 | 54.2 | 10.5 | 0.7 |
| 2016 | 3.0 | 169.1 | 217.1 | 151.6 | 68.5 | 13.4 | 0.9 |
| 2017 | 3.6 | 193.4 | 253.3 | 183.1 | 86.3 | 14.9 | 1.0 |
| 2018 | 4.5 | 223.5 | 303.8 | 217.5 | 105.6 | 19.7 | 1.1 |
*2018 data does not include British Columbia.
The proportion of male cases ranged from 41.3% to 77.8% across provinces and territories in 2018. Ten provinces and territories reported having a greater proportion of male cases - the provinces with the greatest proportion of male cases were Ontario (72.6%) and Quebec (77.8%). Manitoba (53.9%), Saskatchewan (54.4%) and Nunavut (58.7%) reported having a greater proportion of female cases.
6.0 Infectious syphilis
Syphilis, an infection cause by the bacterium Treponema pallidum, has been nationally notifiable since 1924Note de bas de page 11. Left untreated, it progresses through different stages, with primary, secondary and early latent (less than one year after the point of infection) stages being infectiousNote de bas de page 11. Only these infectious stages are included in this report.
The number and rate of reported infectious syphilis cases are increasing. In 2018, 6,281 cases of infectious syphilis were reported nationally, corresponding to a national rate of 16.9 cases per 100,000 population. Since 2009, the number of infectious syphilis cases has more than tripled (1,584 cases and a rate of 4.7 per 100,000 population in 2009). Infectious syphilis had the highest increase in rates of all STIs with more than 259.5% increase over the past decade. On average, over the past decade, nationally reported infectious syphilis rates have increased by 12.8% per year. (Figure 13).

aOverall includes unspecified sex.
Figure 13 - Text Equivalent
This graph presents the overall and sex-specific rates of reported infectious syphilis cases as well as total cases, between 2009 and 2018 in Canada. The horizontal axis shows the calendar years from 2009 to 2018. The left vertical axis shows the rate of reported chlamydia cases per 100,000 population for male, female, and overall. The right vertical axis shows the total number of reported infectious syphilis cases per each calendar year.
| Year | Reported Rates per 100,000 population | Total Cases | ||
|---|---|---|---|---|
| Male Rate | Female Rate | Overall Rate | ||
| 2009 | 8.5 | 0.9 | 4.7 | 1,584 |
| 2010 | 9.1 | 0.9 | 5.0 | 1,696 |
| 2011 | 9.6 | 0.7 | 5.1 | 1,749 |
| 2012 | 11.2 | 0.6 | 5.9 | 2,053 |
| 2013 | 11.8 | 0.8 | 6.3 | 2,215 |
| 2014 | 12.6 | 0.9 | 6.7 | 2,399 |
| 2015 | 16.9 | 1.0 | 8.9 | 3,199 |
| 2016 | 19.7 | 1.7 | 10.7 | 3,869 |
| 2017 | 19.9 | 2.4 | 11.1 | 4,080 |
| 2018 | 26.8 | 6.9 | 16.9 | 6,281 |
6.1 Geographic distribution
Rates of reported infectious syphilis in 2018 varied by province and territory, ranging from 2.6 in Prince Edward Island to 263.7 per 100,000 population in Nunavut. Nunavut reported the highest rate in Canada every year since 2012, ranging from 83.2 cases per 100,000 population in 2012 to 263.7 cases per 100,000 population in 2018. For the past five years, Manitoba held the next highest rates, from 9.2 cases per 100,000 population in 2014 and increasing to 57.9 cases per 100,000 population in 2018. The Atlantic provinces of New Brunswick, Nova Scotia and Prince Edward Island had the lowest rates in Canada in 2017 and 2018 (Figure 14).

Figure 14 - Text Equivalent
This map presents the rates of reported infectious syphilis cases by province and territory in Canada in 2018. The vertical axis shows the rate of reported infectious syphilis cases per 100,000 population in grading colors, corresponding to those on the map.
| Province or Territory | Reported Rates per 100,000 population |
|---|---|
| British Columbia | 15.2 |
| Alberta | 35.7 |
| Saskatchewan | 12.1 |
| Manitoba | 57.9 |
| Ontario | 13.2 |
| Quebec | 11.1 |
| New Brunswick | 2.7 |
| Nova Scotia | 3.3 |
| Prince Edward Island | 2.6 |
| Newfoundland and Labrador | 7.2 |
| Yukon | 4.9 |
| Northwest Territories | 24.5 |
| Nunavut | 263.7 |
| Canada | 16.9 |
Nunavut reported one of the lowest relative increase in rate since 2014 (up 16.1%, from 227.1 per 100,000 population in 2014 to 263.7 per 100,000 population in 2018). Between 2009 and 2018, the greatest increase in reported infectious syphilis rates occurred in Manitoba, with an increase of 13,943.8%, from 0.4 per 100,000 population in 2009 to 57.9 per 100,000 population in 2018. Conversely, the Northwest Territories experienced a 68.1% decrease. Since 2014, only three provinces (New Brunswick, Nova Scotia and Prince Edward Island) experienced a decrease in rates, while all others experienced an increase in rates. Yukon and Northwest Territories reported between 0 and 5 cases annually in the past five years (2014-2018).
6.2 Age and sex distribution
Over the past decade, males comprised the large majority (greater than 85%) of reported infectious syphilis cases every year. In 2018, the male rate was more than three times higher than the female rate, with 26.8 cases per 100,000 males compared to the female rate of 6.9 cases per 100,000 females (Figure 13). The rate increase in females was quite steep from 2017 to 2018 with a relative rate increase of 184.7% (from 2.4 to 6.9 cases per 100,000 population). Although male rates were higher, the relative increase in rate was higher among females in the past decade (648.3% versus 214.6%).
The male-to-female rate ratio decreased from 9.2:1.0 in 2009 to 3.9:1.0 in 2018, reflecting that more males than females were reported with infectious syphilis, but that this trend decreased over time. Nationally, 78.9% of reported syphilis cases were male and 20.6% of cases female in 2018. The majority of provinces and territories reported a greater proportion of cases being male. New Brunswick reported the greatest proportion of male cases (95%) while Yukon and Nunavut reported the lowest proportion of male cases (50%). Across the country, the male-to-female rate ratio ranged from highest in British Columbia (23.7:1) to lowest in Nunavut (0.9:1).
Compared to 2009, all age groups over 15 years of age increased. The 15 to 19 age group increased more than six-fold from 2009 to 2018, from 2.2 to 13.6 cases per 100,000. Since 2009, only twelve cases were reported among those aged 10 to 14 years old and no cases were reported among those under 10 years of age (Figure 15).
Since 2014, the highest rates of reported infectious syphilis cases were among the 25 to 29 and 30 to 39 year age groups, followed by the 20 to 24 age group. People 15 years of age and younger and those over 60 held the lowest rates in all years sine 2009 (at or under 3 cases per 100,000) (Figure 15).
In 2018, nearly half (49.0%) of reported infectious syphilis cases in Canada were among people aged between 25 and 39 years. Almost one-quarter (21.7%) of all cases occurred in males between 20 and 29 years of age. Out of all cases, males 40 years of age and older accounted for 31.0% and females accounted for 2.4%.

Figure 15 - Text Equivalent
This graph presents the overall rates of reported infectious syphilis cases by age group, between 2009 and 2018, in Canada. The horizontal axis shows the calendar years from 2009 to 2018. The vertical axis shows the rate of reported infectious syphilis cases per 100,000 population for age groups from under 15 years old to 60 years old and over.
| Year | Age groups | ||||||
|---|---|---|---|---|---|---|---|
| <15 years | 15-19 years | 20-24 years | 25-29 years | 30-39 years | 40-59 years | 60+ years | |
| 2009 | 0.0 | 2.2 | 8.1 | 9.9 | 9.0 | 6.5 | 0.8 |
| 2010 | 0.0 | 2.7 | 8.2 | 9.0 | 8.7 | 7.4 | 1.2 |
| 2011 | 0.0 | 3.1 | 9.1 | 10.8 | 9.2 | 7.0 | 1.0 |
| 2012 | 0.0 | 4.0 | 12.2 | 11.7 | 10.7 | 7.8 | 1.4 |
| 2013 | 0.0 | 3.0 | 12.4 | 14.0 | 11.6 | 8.2 | 1.6 |
| 2014 | 0.0 | 3.1 | 12.1 | 14.1 | 13.3 | 9.3 | 1.4 |
| 2015 | 0.0 | 3.5 | 14.0 | 20.6 | 18.0 | 12.3 | 2.1 |
| 2016 | 0.0 | 4.7 | 17.3 | 23.7 | 21.4 | 14.9 | 2.5 |
| 2017 | 0.1 | 5.5 | 19.9 | 26.5 | 24.3 | 13.7 | 2.4 |
| 2018 | 0.1 | 13.6 | 33.4 | 45.0 | 37.2 | 18.0 | 3.2 |
In 2018, the proportion of cases attributed to males increased with increasing age. Males comprised 41.2% of the cases among 15 to 19 year olds and 96.5% of the cases among those 60 years of age and older. In men, the highest reported rates of infectious syphilis was in the 25 to 29 year olds (64.0 per 100,000 males), although in women, the highest reported rate was in the 20 to 24 years olds (26.0 per 100,000 females) (Figure 16).

Figure 16 - Text Equivalent
This graph presents the overall rates of reported infectious syphilis cases by sex and age group for 2018 in Canada. The horizontal axis shows the age groups from under 15 years old to 60 years old and over, with the blue bars representing males and the red bars representing females. The vertical axis shows the rate of reported infectious syphilis cases per 100,000 population for age groups and sex from under 15 years old to 60 years old and over.
| Age groups | Reported Rates per 100,000 population | |
|---|---|---|
| Male rate | Female rate | |
| <15 years | 0.0 | 0.1 |
| 15-19 years | 10.9 | 16.4 |
| 20-24 years | 39.6 | 26.0 |
| 25-29 years | 64.0 | 24.4 |
| 30-39 years | 59.9 | 14.1 |
| 40-59 years | 33.2 | 2.7 |
| 60+ years | 6.7 | 0.2 |
Over the past decade, among males aged 25 to 29 years old, the reported rate increased from 16.9 per 100,000 males in 2009 to 64.0 per 100,000 males in 2018 (Figure 17), an increase of 47.1 cases per 100,000 males, or 279.7% increase. Although reported rates for both youth less than 20 and older men remained low compared to other age groups, substantial increases were seen since 2009. Between 2009 and 2018, reported rates in males 15 to 19 years older increased by 222.7%, from 3.4 to 10.9 per 100,000 males. Rates among males 60 years of age and older increased by 302.2% - the largest relative increase among males in all groups - from 1.7 to 6.7 per 100,000 males (Figure 17).

Figure 17 - Text Equivalent
This graph presents the overall rates of reported infectious syphilis cases in males by age group, between 2009 and 2018, in Canada. The horizontal axis shows the calendar years from 2009 to 2018. The vertical axis shows the rate of reported infectious syphilis cases per 100,000 population for age groups from under 15 years old to 60 years old and over.
| Year | Age groups | ||||||
|---|---|---|---|---|---|---|---|
| <15 years | 15-19 years | 20-24 years | 25-29 years | 30-39 years | 40-59 years | 60+ years | |
| 2009 | 0.0 | 3.4 | 12.7 | 16.9 | 16.3 | 12.2 | 1.7 |
| 2010 | 0.0 | 3.9 | 12.8 | 15.3 | 15.9 | 14.1 | 2.6 |
| 2011 | 0.0 | 4.4 | 16.0 | 19.7 | 17.2 | 13.6 | 2.1 |
| 2012 | 0.0 | 6.3 | 21.5 | 22.1 | 20.4 | 15.0 | 2.9 |
| 2013 | 0.0 | 4.0 | 20.9 | 25.6 | 21.7 | 16.0 | 3.4 |
| 2014 | 0.0 | 4.1 | 19.9 | 25.3 | 24.9 | 18.1 | 2.9 |
| 2015 | 0.0 | 5.3 | 23.9 | 36.3 | 34.1 | 24.0 | 4.4 |
| 2016 | 0.0 | 5.8 | 27.3 | 40.5 | 39.7 | 28.7 | 5.2 |
| 2017 | 0.0 | 5.4 | 30.6 | 43.8 | 43.9 | 26.0 | 5.0 |
| 2018 | 0.0 | 10.9 | 39.6 | 64.0 | 59.9 | 33.2 | 6.7 |
Although reported rates in females remained low from 2009 to 2018, substantial increases in all age groups 15 years and older were seen. Between 2009 and 2018, the greatest absolute increase in reported rates of infectious syphilis was seen in 20 to 24 year olds, increasing by 22.7 cases per 100,000, from 3.3 per 100,000 in 2009 to 26.0 per 100,000 in 2018 (Figure 18), corresponding to an increase of 693.3%.

Figure 18 - Text Equivalent
This graph presents the overall rates of reported infectious syphilis cases in females by age group, between 2009 and 2018, in Canada. The horizontal axis shows the calendar years from 2009 to 2018. The vertical axis shows the rate of reported infectious syphilis cases per 100,000 population for age groups from under 15 years old to 60 years old and over.
| Year | Age groups | ||||||
|---|---|---|---|---|---|---|---|
| <15 years | 15-19 years | 20-24 years | 25-29 years | 30-39 years | 40-59 years | 60+ years | |
| 2009 | 0.0 | 0.9 | 3.3 | 2.9 | 1.6 | 0.7 | 0.1 |
| 2010 | 0.0 | 1.5 | 3.3 | 2.6 | 1.5 | 0.6 | 0.1 |
| 2011 | 0.0 | 1.7 | 2.0 | 1.9 | 1.2 | 0.4 | 0.0 |
| 2012 | 0.0 | 1.5 | 2.2 | 1.1 | 1.0 | 0.5 | 0.0 |
| 2013 | 0.0 | 2.0 | 3.1 | 2.1 | 1.5 | 0.4 | 0.1 |
| 2014 | 0.0 | 1.9 | 3.6 | 2.4 | 1.7 | 0.6 | 0.0 |
| 2015 | 0.0 | 1.7 | 3.4 | 3.9 | 2.0 | 0.6 | 0.0 |
| 2016 | 0.1 | 3.4 | 6.3 | 5.7 | 2.9 | 1.1 | 0.1 |
| 2017 | 0.1 | 5.6 | 8.1 | 8.0 | 4.5 | 1.5 | 0.1 |
| 2018 | 0.1 | 16.4 | 26.0 | 24.4 | 14.1 | 2.7 | 0.2 |
In the majority of provinces and territories, the highest rates of reported cases of infectious syphilis were among those aged 20 to 24 or 25 to 29 in 2018. However, in Nova Scotia and Newfoundland and Labrador, the highest rates were reported in the 30 to 39 year age.
6.3 Congenital syphilis
Congenital syphilis is caused by the vertical transmission of Treponema pallidum from a pregnant individual infected with syphilis to their fetus. Congenital syphilis may not be diagnosed until later in life, as the disease can often be asymptomatic for life or may present with symptoms that are not identified in the first few weeksFootnote 11,Footnote 12. Only early congenital syphilis cases (diagnosed in those under two years of age) are reported nationallyFootnote 6.
The number of confirmed congenital syphilis cases reported in Canada varied from one to 20 cases per year from 2009 to 2018 (Figure 19). Between 2009 and 2014, a downward trend was observed in reported cases (high of 10 cases in 2009 and a low of one case reported in 2014) followed by increase of up to twenty reported cases in 2018. From 2017 to 2018, there was a 188.8% increase in rate of congenital syphilis cases (from 1.9 to 5.4 cases per 100,000 live births). Among females aged 15 to 39 years, a 211.5% increase in rate of infectious syphilis was observed between 2017 and 2018 (from 6.1 to 19.0 cases per 100,000 females). Changes in rate should be interpreted with caution due to low case numbers (Figure 19).

Figure 19 - Text Equivalent
This graph displays the number and rates of congenital syphilis among females of reproductive age in Canada, from 2009 to 2018. The horizontal axis shows the calendar years from 2009 to 2018. The vertical axis shows the number of congenital syphilis cases, the rates of congenital syphilis per 100,000 live births, and the female rate of infectious syphilis among women of reproductive age (15 to 39 years old) per 100,000 females per each calendar year.
| Year | Number of congenital syphilis cases | Rate of congenital syphilis per 100,000 live births | Female rate (age 15 to 39) of infectious syphilis per 100,000 females |
|---|---|---|---|
| 2009 | 10 | 2.6 | 2.1 |
| 2010 | 6 | 1.6 | 2.1 |
| 2011 | 5 | 1.3 | 1.6 |
| 2012 | 3 | 0.8 | 1.4 |
| 2013 | 2 | 0.5 | 2.1 |
| 2014 | 1 | 0.3 | 2.3 |
| 2015 | 5 | 1.3 | 2.6 |
| 2016 | 4 | 1.0 | 4.2 |
| 2017 | 7 | 1.9 | 6.1 |
| 2018 | 20 | 5.4 | 19.0 |
7.0 Discussion
STIs continue to remain a significant public health challenge in Canada, and the epidemic disproportionately affects certain populations. Over the past decade, rates for all STIs have increased dramatically. In addition, it is possible that many cases of chlamydia, gonorrhea and infectious syphilis continue to go undiagnosed and unreported. Strong public health infrastructure is critical to prevent and control STIs, especially among the most vulnerable groups.
Chlamydia continues to be the most commonly reported STI in Canada with 117,008 cases reported across Canada in 2018 (Note: 2018 numbers for chlamydia and gonorrhea do not include British Columbia).
Over the past decade, increases in the rates of reported cases of chlamydia have been observed in Canada despite numerous public health interventions designed to prevent, diagnose and treat infection. The observed increases in rates may be explained by a variety of factors including a true rise in incidence and the implementation of improved detection methods such as more sensitive nucleic acid amplification testing (NAAT) introduced in the mid-1990s. In fact, the introduction of NAAT coincided with the beginning of the historical rise in rates of reported cases of chlamydia. NAAT allows for the use of either urine specimens or swabs, and urine collection is easier and more acceptable to patients. As a result, the number of people, particularly males, being tested has likely increased as well. More screening and more effective contact tracing practices may also have contributed to the observed rise in the rate of reported cases.
Although the rates of reported cases of gonorrhea in Canada are considerably lower than those for chlamydia, rates for both infections appear to be increasing over time. The increase in gonorrhea rates since the late 1990s may be at least partially explained by the factors thought to also affect chlamydia rates, such as the move to more sensitive testing methods and improved case finding2. Additionally, both Canadian and other national treatment guidelines emphasize the importance of screening at other anatomical sites in some populations, which may have impacted the increase in the number of cases detected and reportedFootnote 10,Footnote 13,Footnote 14.
In contrast to chlamydia, observed overall rates of gonorrhea were higher in males. Higher gonorrhea rates among males may be partially explained by the fact that they are more likely than females to have symptomatic infectionsFootnote 15; the presence of symptoms likely influences care-seeking behaviors and could contribute to the greater number of cases detected among males. In addition, increases in certain sex practices among gay, bisexual and other men who have sex with men (gbMSM) have been associated with increases in gonorrhea in this populationFootnote 10. Other high-income countries, including the United States of America, Australia and England have reported similar trendsFootnote 13,Footnote 16,Footnote 17.
Together with improved testing and screening methods, antimicrobial resistance to the first-line antibiotics also play a role in the rising rates of gonorrhea. Over time, an increasing proportion of Neisseria gonorrhoeae isolates has shown resistance to many antibiotics used to treat infectionFootnote 18,Footnote 19,Footnote 20. In 2018, seven extensively drug resistant gonorrhea isolates were identified in Canada, posing a potential threat to successful treatmentFootnote 21. Enhancing surveillance to include linked epidemiological and laboratory data would address the limitation regarding trend interpretation in the current passive surveillance system. The Enhanced Surveillance of Antimicrobial Resistant Gonorrhea (ESAG) program was initiated by PHAC in 2014 to address this gapFootnote 19.
Although the rates of reported infectious syphilis cases are considerably lower than those for chlamydia and gonorrhea, infectious syphilis had the highest increase in rates of all three STIs from 2009 to 2018 (259.5%) and the number of reported cases almost quadrupled in 2018 compared to 2009. Similar to gonorrhea, and in contrast with chlamydia, observed overall rates of infectious syphilis continue to be higher in males. Although rates of infectious syphilis among females are lower than the male rate, rates are increasing faster among females in recent years; infection in women of childbearing age is of concern because of the potential for congenital syphilis in infants exposed to Treponema pallidum prenatally or during childbirth. Screening for syphilis as part of comprehensive prenatal care for all pregnant women, as well as fostering an enabling environment for pregnant individuals to access STBBI careFootnote 3, are both key to preventing congenital syphilis.
Over the past decade, when compared to counties such as the United StatesFootnote 13, EnglandFootnote 16, and AustraliaFootnote 17, Canada continues to have the lowest rates of chlamydia, gonorrhea and infectious syphilis. The pattern of higher rates of chlamydia amongst females seen in Canada is similarly seen across these countries. Canada's gonorrhea rates among males are consistently lower than those in these countries, and among females, Canada has the second-lowest rates. Rates of infectious syphilis are increasing in Canada, in the United StatesFootnote 13, EnglandFootnote 16, and AustraliaFootnote 17. From 2009 to 2018, Canada reported the lowest rates of infectious syphilis compared to these other countries, although there is some variability in reporting. All of these countries show infectious syphilis rates being significantly higher among males compared to females. The observed difference in rates observed among these countries can likely be attributed, in part, to differences in reporting requirements, screening practices, educational programs, and public health interventions.
Lastly, the surveillance data described in this report have data limitations. Low case counts are sometimes reported for particular infections and certain age groups, such as for congenital syphilis. Therefore, variations in rates over time should be interpreted with caution. Also, data presented in this report likely underestimate the incidence rate of STIs from 2009 to 2018 in Canada, as some infections may be asymptomatic, unscreened, undiagnosed or unreported. Screening, laboratory testing and reporting practices varied across provinces and territories. This means that direct comparison between jurisdictions should be made with caution. Finally, information on risk factors in unavailable in the CNDSS, limiting our ability to identify factors associated with higher STI rates.
STIs continue to remain a serious public health concern in Canada. Over the past decade, reported rates for chlamydia, gonorrhea and infectious syphilis continued to increase substantially.
References
- Footnote 1
-
World Health Organization, "Global health sector strategy on sexually transmitted infections, 2016-2021," WHO, 2016.
- Footnote 2
-
Choudhri Y, Miller J, Sandhu J, Leon A, Aho J, "Chlamydia in Canada, 2010-2015," Can Commun Dis Rep, vol. 44, no. 2, pp. 49-54, 2018.
- Footnote 3
-
Public Health Agency of Canada, "Reducing the health impact of sexually transmitted and blood-borne infections in Canada by 2030: A pan-Canadian STBBI framework for action," Ottawa, 2018.
- Footnote 4
-
Public Health Agency of Canada, "Accelerating our response: Government of Canada five-year action plan on sexually transmitted and blood-borne infections," Ottawa, 2019.
- Footnote 5
-
Public Health Agency of Canada, "Notifiable Diseases Online," 2020. [Online]. Available: https://diseases.canada.ca/notifiable/.
- Footnote 6
-
Totten S, Medaglia A, McDermott S, "Updates to the Canadian Notifiable Disease Surveillance System and its interactive website," Can Commun Dis Rep, vol. 45, no. 10, pp. 257-261, 2019.
- Footnote 7
-
Public Health Agency of Canada, "Chlamydia and LGV: Key information and resources," 2020. [Online]. Available: https://www.canada.ca/en/public-health/services/infectious-diseases/sexual-health-sexually-transmitted-infections/canadian-guidelines/chlamydia-lgv.html#a1.
- Footnote 8
-
Tien V, Punjabi C, Holubar MK, "Antimicrobial resistance in sexually transmitted infections," J Travel Med, vol. 27, no. 1, pp. 1-11, 2019.
- Footnote 9
-
Navarro C, Jolly A, Nair R, Chen Y, "Risk factors for general chlamydial infection," Can J Infect Dis, vol. 13, no. 3, pp. 195-207, 2002.
- Footnote 10
-
Choudhri Y, Miller J, Sandhu J, Leon A, Aho J, "Gonorrhea in Canada, 2010-2015," Can Commun Dis Rep, vol. 44, no. 2, pp. 37-42, 2018.
- Footnote 11
-
Public Health Agency of Canada, "Syphilis in Canada, Technical Report on Epidemiological Trends, Determinants and Interventions," Ottawa, ON, 2020.
- Footnote 12
-
Choudhri Y, Miller J, Sandhu J, Leon A, Aho J, "Infectious and congenital syphilis in Canada, 2010-2015," Can Commun Dis Rep, vol. 44, no. 2, pp. 43-48, 2018.
- Footnote 13
-
Centers for Disease Control and Prevention, "Sexually Transmitted Disease Surveillance 2018," U.S. Department of Health and Human Services, Atlanta, GA, 2019.
- Footnote 14
-
Public Health Agency of Canada, "Canadian Guidelines on Sexually Transmitted Infections: Gonococcal Infections Chapter," Government of Canada, Ottawa, 1993.
- Footnote 15
-
Costa-Lourenço APRD, Barros dos Santos KT, Moreira BM, Fracalanzza SEL, Bonelli RR, "Antimicrobial resistance in Neisseria gonorrhoeae : history, molecular mechanisms and epidemiological aspects of an emerging global threat," Brazilian Journal of Microbiology, vol. 48, no. 4, pp. 617-628, Oct 2017.
- Footnote 16
-
Public Health England, National STI surveillance data tables 2018 - Table 1, Public Health England, 2020.
- Footnote 17
-
Kirby Institute, "HIV, viral hepatitis and sexually transmissible infections in Australia: Annual surveillance report 2018," Kirby Institute, Sydney, AU, 2018.
- Footnote 18
-
Bodie M, Gale-Rowe M, Alexandre S, Auguste U, Tomas K, Martin I, "Addressing the rising rates of gonorrhea and drug-resistant gonorrhea: there is no time like the present," Can Commun Dis Rep, vol. 45, no. 2/3, pp. 54-62, 2019.
- Footnote 19
-
Public Health Agency of Canada, "Report on the Enhanced Surveillance of Antimicrobial-Resistant Gonorrhea (ESAG): Results from 2015-2017," Ottawa, 2021.
- Footnote 20
-
Martin I, Sawatzky P, Allen V, Lefebvre B, Hoang LMN, Naidu P, Minion J, Van Caeselle P, Haldane D, Gad RR, Zahariadis G, Corriveau A, German G, Tomas K, Mulvey MR, "Multidrug-resistant and extensively drug-resistant Neisseria gonorrhoeae in Canada, 2012-2016," Can Commun Dis Rep, vol. 45, no. 2/3, pp. 45-53, 2019.
- Footnote 21
-
Public Health Agency of Canada, "National Surveillance of Antimicrobial Susceptibilities of Neisseria gonorrhoeae Annual Summary 2018," Ottawa, ON, 2020.
Appendix A
These tables and figures are available upon request at: phac.sti-hep-its.aspc@canada.ca
Tables
Reported cases and rates (per 100,000 population) of chlamydia, gonorrhea and infectious syphilis, 2009 and 2018
Rates of reported chlamydia cases in Canada, per 100,000 males, by age group, 2009-2018
Rates of reported chlamydia cases in Canada, per 100,000 females, by age group, 2009-2018
Rates of reported chlamydia cases in Canada, per 100,000 overall, bye age group, 2009-2018
Rates of reported gonorrhea cases in Canada, per 100,000 males, by age group, 2009-2018
Rates of reported gonorrhea cases in Canada, per 100,000 females, by age group, 2009-2018
Rates of reported gonorrhea cases in Canada, per 100,000 overall, by age group, 2009-2018
Rates of reported infectious syphilis cases in Canada, per 100,000 males, by age group, 2009-2018
Rates of reported infectious syphilis cases in Canada, per 100,000 females, by age group, 2009-2018
Rates of reported infectious syphilis cases in Canada per 100,000 overall, by age group, 2009-2018
Surveillance data by province and territory, year, infection and sex, 2009-2018
Rates of reported chlamydia cases, by age group and province/territory, 2018
Rates of reported gonorrhea cases, by age group and province/territory, 2018
Rates of reported infectious syphilis cases, by age group and province/territory, 2018
Overall population estimates of provinces and territories in Canada, by year, 2009-2018
Male population estimates of provinces and territories in Canada, by year, 2009-2018
Female population estimates of provinces and territories in Canada, by year, 2009-2018
Number of cases and rates of congenital syphilis, rates of infectious syphilis among women aged 15-39 years, and rates of infectious syphilis among females, 2009-2018
Reported cases of confirmed congenital syphilis cases by province/territory, 2009-2018
Figures
Percent change in overall rates of reported cases of STIs in Canada, relative to reference year 2009, 2009-2018
Percent change in male rates of reported cases of STIs in Canada, relative to reference year 2009, 2009-2018
Percent change in female rates of reported cases of STIs in Canada, relative to reference year 2009, 2009-2018
Proportion of total reported chlamydia cases in Canada, by sex and age group, 2018
Proportion of total reported chlamydia cases in Canada, by sex and province/territory, 2018
Overall reported rates of chlamydia in Canada and other countries from 2009 to 2018
Reported rates of chlamydia among males in Canada and other countries from 2009 to 2018
Reported rates of chlamydia among females in Canada and other countries from 2009 to 2018
Proportion of total reported gonorrhea cases in Canada, by sex and age group, 2018
Proportion of total reported gonorrhea cases in Canada, by sex and province/territory, 2018
Overall reported rates of gonorrhea in Canada and other countries from 2009 to 2018
Male reported rates of gonorrhea in Canada and other countries from 2009 to 2018
Female reported rates of gonorrhea in Canada and other countries from 2009 to 2018
Proportion of total reported infectious syphilis cases in Canada, by sex and age group, 2018
Number of cases of infectious syphilis in Canada, by province/territory, 2018
Proportion of total reported infectious syphilis cases in Canada, by sex and province/territory, 2018
Overall reported rates of infectious syphilis in Canada and other countries from 2009 to 2018
Male reported rates of infectious syphilis in Canada and other countries from 2009 to 2018
Female reported rates of infectious syphilis in Canada and other countries from 2009 to 2018
Page details
- Date modified: