
National laboratory surveillance of invasive streptococcal disease in Canada - Annual summary 2019
Executive summary
- Streptococcus pneumoniae: 3,673 isolates causing invasive pneumococcal disease (IPD) were characterized in 2019.
- Incidence rate of IPD for 2019 for children under <1 year of age is 13.2 cases per 100,000 population and for seniors ≥60 years to 21.2 cases per 100,000 population. The overall crude incidence rate has remained stable averaging 10.0 cases per 100,000 population since 2009.
- PCV7 serotypes increased slightly from 2018 to 2019 in most age groups accounting for 11.5% of the total IPD.
- PCV13 (not including PCV7) serotypes accounted for 19% of overall IPD, showing a slight decrease from 2018 levels. Trends for all PCV13 serotypes have remained relatively constant, around 30%, for the last five years.
- Overall proportions of PPV23 have increased slightly, by 2.8%, in the last five years and non-vaccine serotypes (NVT) have decreased by 4.6% in the same time frame.
- Predominant serotypes in 2019 were 3 (12%), 22F (10%), 4 (7%), 9N (7%) and 8 (6%). Rates of serotype 3 deceased slightly from 12% in 2018 to 11.5% in 2019, with increases in the <2 and ≥65 years age groups.
- Antimicrobial susceptibility: Testing of 1,815 isolates indicated resistance rates were again relatively stable during 2019 with the following resistance rates: clarithromycin (25%), penicillin (11%), doxycycline (11%), trimethoprim/sulfamethoxazole (10%), clindamycin (7%) and chloramphenicol (3%). Of the isolates tested serotypes 33F (89%), 7C (73%) and 19A (62%) generally had the highest rates of antimicrobial resistance. Multi-drug resistance increased from 6.4% in 2018 to 7.6% in 2019, with the highest rates seen in serotypes 15A (45%) and 23A (24%).
- S. pyogenes (Group A Streptococcus): 3,253 isolates causing invasive disease were characterized for emm type.
- Overall, the annual incidence rate of invasive disease has increased from 4.0 to 8.1 cases per 100,000 population from 2009 to 2019.
- Emm76 (12.2%) surpassed emm1 (12.1%) as the most predominant type among all combined age groups and regions in 2019 (Figure C). The greatest increases in emm76 were seen in Manitoba and Ontario.
- Emm49 was the third most common type in 2019, increasing from 3% in 2018 to 9% in 2019, driven by increases in the central region.
- Antimicrobial susceptibility: Antimicrobial resistance of S. pyogenes is relatively low, decreases were seen in 2019 with chloramphenicol non-susceptibility at 1.6%, clindamycin resistance at 3.0% and erythromycin resistance at 8.5%.
- S. agalactiae (Group B Streptococcus): There were 295 invasive Group B Streptococcus submitted to NML during 2019, of which 9 isolates were from early onset cases (infants ≤7 days old) and 12 were from late onset cases (infants 8 - 31 days old). Annual incidence of invasive disease in newborns has fluctuated from a low of 25.0 per 100,000 live births in 2009 to a high of 38.1 in 2016; the incidence rate in 2019 was 21.2 (per 100,000 population).
- Serotypes III (18%), V (18%) and Ia and Ib (17% each) were most predominant during 2019.
- Antimicrobial susceptibility: Resistance of S.agalactiae to erythromycin increased to 53% while clindamycin resistance increased to 34%. Chloramphenicol nonsusceptibility remains low at 1%.
Figure A. Invasive S. pneumoniae serotypes in all ages, 2015-2019
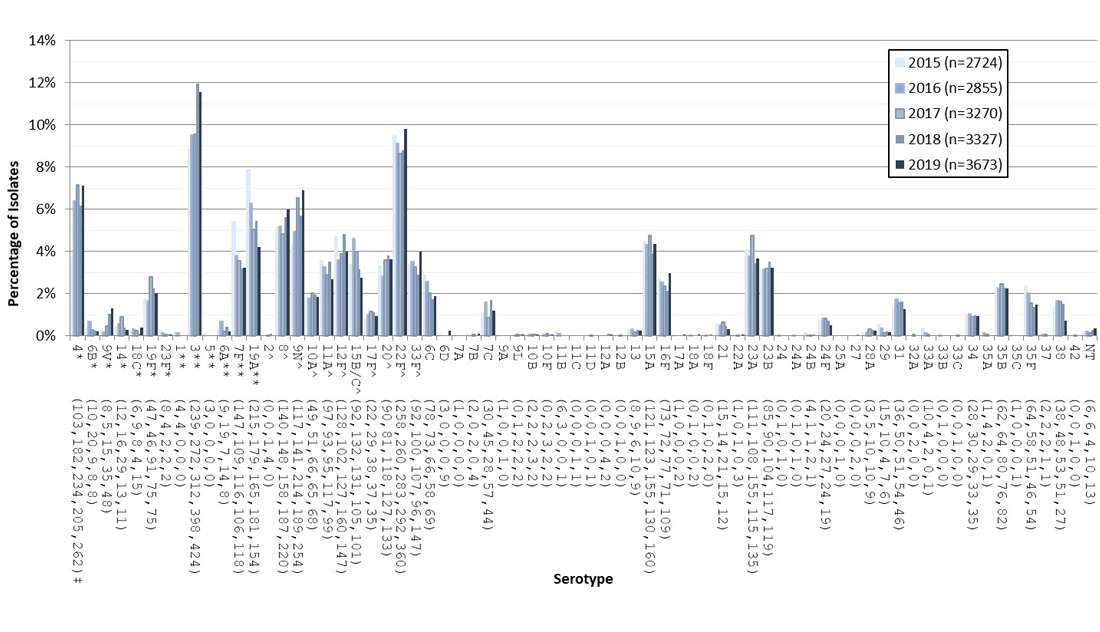
* Component of PCV7; ** Component of PCV13; ^ Component of PPV23; ‡ Number of isolates for 2015, 2016, 2017, 2018 and 2019 respectively
Figure A - Text description
Bar graph displaying the percentage of Streptococcus pneumonia serotypes from 2015 to 2019 based on the total number of isolates tested annually.
| 2015 (n=2724) | 2016 (n=2855) | 2017 (n=3270) | 2018 (n=3327) | 2019 (n=3673) | |
|---|---|---|---|---|---|
| 4* (103,182,234,205,262)‡ | 3.8% | 6.4% | 7.2% | 6.2% | 7.1% |
| 6B* (10,20,9,8,8) | 0.4% | 0.7% | 0.3% | 0.2% | 0.2% |
| 9V* (8,5,15,35,48) | 0.3% | 0.2% | 0.5% | 1.1% | 1.3% |
| 14* (12,16,29,13,11) | 0.4% | 0.6% | 0.9% | 0.4% | 0.3% |
| 18C* (6,9,8,4,15) | 0.2% | 0.3% | 0.2% | 0.1% | 0.4% |
| 19F* (47,46,91,75,75) | 1.7% | 1.6% | 2.8% | 2.3% | 2.0% |
| 23F* (8,4,2,2,2) | 0.3% | 0.1% | 0.1% | 0.1% | 0.1% |
| 1** (4,4,0,0,0) | 0.1% | 0.1% | 0.0% | 0.0% | 0.0% |
| 3** (239,272,312,398,424) | 8.8% | 9.5% | 9.5% | 12.0% | 11.5% |
| 5** (3,0,0,0,0) | 0.1% | 0.0% | 0.0% | 0.0% | 0.0% |
| 6A** (9,19,7,14,8) | 0.3% | 0.7% | 0.2% | 0.4% | 0.2% |
| 7F** (147,109,116,106,118) | 5.4% | 3.8% | 3.5% | 3.2% | 3.2% |
| 19A** (215,179,165,181,154) | 7.9% | 6.3% | 5.0% | 5.4% | 4.2% |
| 2^ (0,0,1,4,0) | 0.0% | 0.0% | 0.0% | 0.1% | 0.0% |
| 8^ (140,148,158,187,220) | 5.1% | 5.2% | 4.8% | 5.6% | 6.0% |
| 9N^ (117,141,214,189,254) | 4.3% | 4.9% | 6.5% | 5.7% | 6.9% |
| 10A^ (49,51,66,65,68) | 1.8% | 1.8% | 2.0% | 2.0% | 1.9% |
| 11A^ (97,93,95,117,99) | 3.6% | 3.3% | 2.9% | 3.5% | 2.7% |
| 12F^ (128,102,127,160,147) | 4.7% | 3.6% | 3.9% | 4.8% | 4.0% |
| 15B/C^(92,132,131,105,101) | 3.4% | 4.6% | 4.0% | 3.2% | 2.7% |
| 17F^ (22,29,38,37,35) | 0.8% | 1.0% | 1.2% | 1.1% | 1.0% |
| 20^ (90,81,118,127,133) | 3.3% | 2.8% | 3.6% | 3.8% | 3.6% |
| 22F^ (258,260,283,292,360) | 9.5% | 9.1% | 8.7% | 8.8% | 9.8% |
| 33F^ (92,100,107,96,147) | 3.4% | 3.5% | 3.3% | 2.9% | 4.0% |
| 6C (78,73,66,58,69) | 2.9% | 2.6% | 2.0% | 1.7% | 1.9% |
| 6D (3,0,0,0,9) | 0.1% | 0.0% | 0.0% | 0.0% | 0.2% |
| 7A (1,0,0,0,0) | 0.0% | 0.0% | 0.0% | 0.0% | 0.0% |
| 7B (2,0,2,0,4) | 0.1% | 0.0% | 0.1% | 0.0% | 0.1% |
| 7C (30,45,28,57,44) | 1.1% | 1.6% | 0.9% | 1.7% | 1.2% |
| 9A (1,0,0,1,0) | 0.0% | 0.0% | 0.0% | 0.0% | 0.0% |
| 9L (0,1,2,2,2) | 0.0% | 0.0% | 0.1% | 0.1% | 0.1% |
| 10B (2,2,2,3,2) | 0.1% | 0.1% | 0.1% | 0.1% | 0.1% |
| 10F (0,2,3,2,2) | 0.0% | 0.1% | 0.1% | 0.1% | 0.1% |
| 11B (6,3,0,0,1) | 0.2% | 0.1% | 0.0% | 0.0% | 0.0% |
| 11C (0,0,0,1,1) | 0.0% | 0.0% | 0.0% | 0.0% | 0.0% |
| 11D (0,0,1,0,1) | 0.0% | 0.0% | 0.0% | 0.0% | 0.0% |
| 12A (0,0,0,4,2) | 0.0% | 0.0% | 0.0% | 0.1% | 0.1% |
| 12B (0,0,1,0,0) | 0.0% | 0.0% | 0.0% | 0.0% | 0.0% |
| 13 (8,9,6,10,9) | 0.3% | 0.3% | 0.2% | 0.3% | 0.2% |
| 15A (121,123,155,130,160) | 4.4% | 4.3% | 4.7% | 3.9% | 4.4% |
| 16F (73,72,77,71,109) | 2.7% | 2.5% | 2.4% | 2.1% | 3.0% |
| 17A (1,0,0,0,2) | 0.0% | 0.0% | 0.0% | 0.0% | 0.1% |
| 18A (0,1,0,0,2) | 0.0% | 0.0% | 0.0% | 0.0% | 0.1% |
| 18F (0,1,0,2,0) | 0.0% | 0.0% | 0.0% | 0.1% | 0.0% |
| 21 (15,14,21,15,12) | 0.6% | 0.5% | 0.6% | 0.5% | 0.3% |
| 22A (1,0,1,0,3) | 0.0% | 0.0% | 0.0% | 0.0% | 0.1% |
| 23A (111,108,155,115,135) | 4.1% | 3.8% | 4.7% | 3.5% | 3.7% |
| 23B (85,90,104,117,119) | 3.1% | 3.2% | 3.2% | 3.5% | 3.2% |
| 24 (0,1,0,1,0) | 0.0% | 0.0% | 0.0% | 0.0% | 0.0% |
| 24A (0,1,0,1,0) | 0.0% | 0.0% | 0.0% | 0.0% | 0.0% |
| 24B (4,1,1,2,1) | 0.1% | 0.0% | 0.0% | 0.1% | 0.0% |
| 24F (20,24,27,24,19) | 0.7% | 0.8% | 0.8% | 0.7% | 0.5% |
| 25A (0,0,0,1,0) | 0.0% | 0.0% | 0.0% | 0.0% | 0.0% |
| 27 (0,0,0,2,0) | 0.0% | 0.0% | 0.0% | 0.1% | 0.0% |
| 28A (3,5,10,10,9) | 0.1% | 0.2% | 0.3% | 0.3% | 0.2% |
| 29 (15,10,4,7,6) | 0.6% | 0.4% | 0.1% | 0.2% | 0.2% |
| 31 (36,50,51,54,46) | 1.3% | 1.8% | 1.6% | 1.6% | 1.3% |
| 32A (0,0,2,0,0) | 0.0% | 0.0% | 0.1% | 0.0% | 0.0% |
| 33A (10,4,2,0,1) | 0.4% | 0.1% | 0.1% | 0.0% | 0.0% |
| 33B (0,1,0,0,0) | 0.0% | 0.0% | 0.0% | 0.0% | 0.0% |
| 33C (0,0,1,0,0) | 0.0% | 0.0% | 0.0% | 0.0% | 0.0% |
| 34 (28,30,29,33,35) | 1.0% | 1.1% | 0.9% | 1.0% | 1.0% |
| 35A (1,4,2,0,1) | 0.0% | 0.1% | 0.1% | 0.0% | 0.0% |
| 35B (62,64,80,76,82) | 2.3% | 2.2% | 2.4% | 2.3% | 2.2% |
| 35C (1,0,0,0,1) | 0.0% | 0.0% | 0.0% | 0.0% | 0.0% |
| 35F (64,58,51,46,54) | 2.3% | 2.0% | 1.6% | 1.4% | 1.5% |
| 37 (2,2,2,1,1) | 0.1% | 0.1% | 0.1% | 0.0% | 0.0% |
| 38 (38,48,53,51,27) | 1.4% | 1.7% | 1.6% | 1.5% | 0.7% |
| 42 (0,0,1,0,0) | 0.0% | 0.0% | 0.0% | 0.0% | 0.0% |
| NT (6,6,4,10,13) | 0.2% | 0.2% | 0.1% | 0.3% | 0.4% |
Figure B. Annual trend of multi-drug resistance of S. pneumoniae
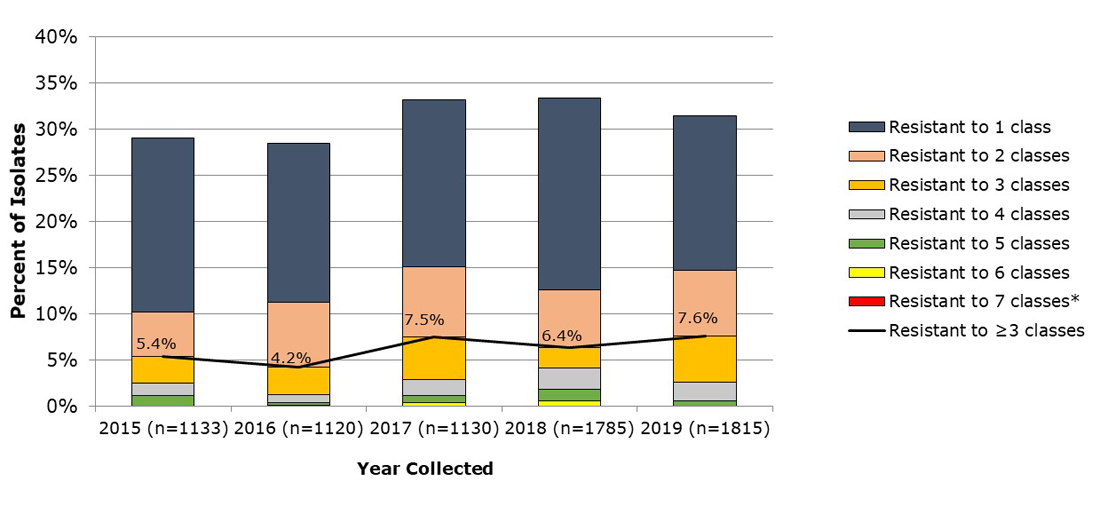
*Antimicrobial classes include: β-lactams (amoxicillin/clavulanic acid, penicillin using meningitis breakpoints, ceftriaxone using meningitis breakpoints, cefuroxime using parenteral breakpoint, ertapenem, imipenem and meropenem); macrolides (clarithromycin); fluoroquinolones (levofloxacin and moxifloxacin); tetracyclines (doxycycline); folate pathway inhibitors (trimethoprim-sulfamethoxazole); phenicols (chloramphenicol); lincosamides (clindamycin); oxazolidinones (linezolid).
Figure B - Text description
A combination line and stacked bar graph displaying multidrug resistance trends from 2015 to 2019 for Streptococcus pneumoniae
| Resistant to 7 classes* | Resistant to 6 classes | Resistant to 5 classes | Resistant to 4 classes | Resistant to 3 classes | Resistant to 2 classes | Resistant to 1 class | Resistant to ≥3 classes | |
|---|---|---|---|---|---|---|---|---|
| 2015 (n=1133) | 0.0% | 0.0% | 1.1% | 1.3% | 2.9% | 4.9% | 18.8% | 5.4% |
| 2016 (n=1120) | 0.0% | 0.1% | 0.3% | 0.9% | 2.9% | 7.1% | 17.2% | 4.2% |
| 2017 (n=1130) | 0.0% | 0.4% | 0.8% | 1.8% | 4.6% | 7.6% | 18.1% | 7.5% |
| 2018 (n=1785) | 0.0% | 0.6% | 1.3% | 2.3% | 2.2% | 6.2% | 20.8% | 6.4% |
| 2019 (n=1815) | 0.0% | 0.0% | 0.6% | 2.0% | 5.0% | 7.1% | 16.7% | 7.6% |
Figure C. Invasive S. pyogenes emm types
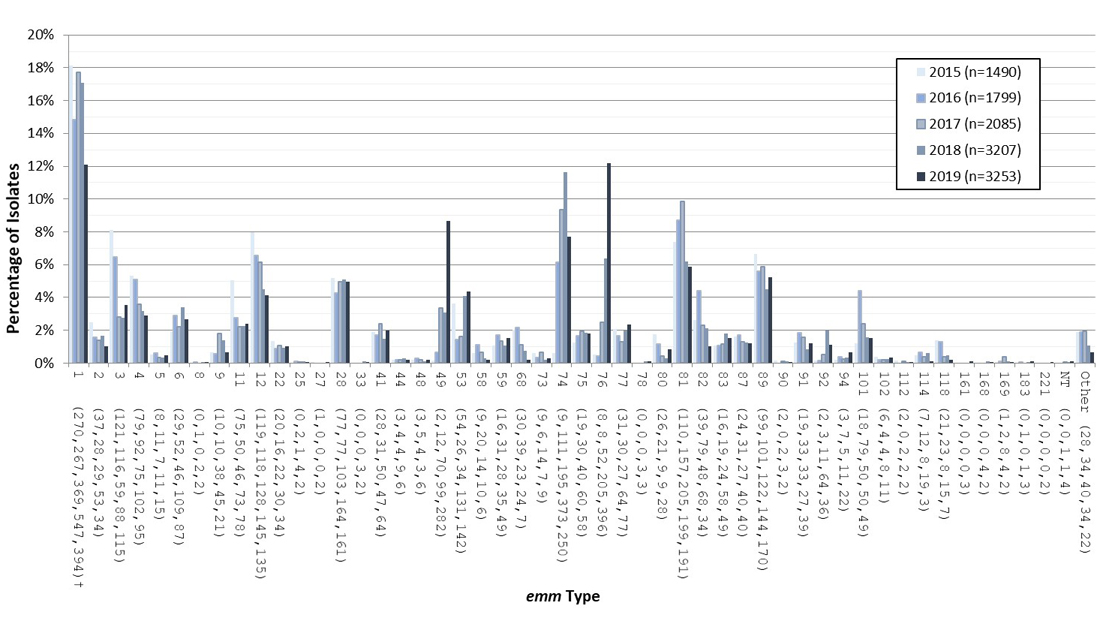
† Number of isolates from 2015, 2016, 2016, 2018 and 2019, respectively.
Figure C - Text description
Bar graph displaying emm types of Streptococcus pyogenes from 2015 to 2019 by percentage based on the total number of isolates tested annually.
| 2015 (n=1490) | 2016 (n=1799) | 2017 (n=2085) | 2018 (n=3207) | 2019 (n=3253) | |
|---|---|---|---|---|---|
| 1 (270,267,369,547,394)† | 18.1% | 14.8% | 17.7% | 17.1% | 12.1% |
| 2 (37,28,29,53,34) | 2.5% | 1.6% | 1.4% | 1.7% | 1.0% |
| 3 (121,116,59,88,115) | 8.1% | 6.4% | 2.8% | 2.7% | 3.5% |
| 4 (79,92,75,102,95) | 5.3% | 5.1% | 3.6% | 3.2% | 2.9% |
| 5 (8,11,7,11,15) | 0.5% | 0.6% | 0.3% | 0.3% | 0.5% |
| 6 (29,52,46,109,87) | 1.9% | 2.9% | 2.2% | 3.4% | 2.7% |
| 8 (0,1,0,2,2) | 0.0% | 0.1% | 0.0% | 0.1% | 0.1% |
| 9 (10,10,38,45,21) | 0.7% | 0.6% | 1.8% | 1.4% | 0.6% |
| 11 (75,50,46,73,78) | 5.0% | 2.8% | 2.2% | 2.3% | 2.4% |
| 12 (119,118,128,145,135) | 8.0% | 6.6% | 6.1% | 4.5% | 4.2% |
| 22 (20,16,22,30,34) | 1.3% | 0.9% | 1.1% | 0.9% | 1.0% |
| 25 (0,2,1,4,2) | 0.0% | 0.1% | 0.0% | 0.1% | 0.1% |
| 27 (1,0,0,0,2) | 0.1% | 0.0% | 0.0% | 0.0% | 0.1% |
| 28 (77,77,103,164,161) | 5.2% | 4.3% | 4.9% | 5.1% | 4.9% |
| 33 (0,0,0,3,2) | 0.0% | 0.0% | 0.0% | 0.1% | 0.1% |
| 41 (28,31,50,47,64) | 1.9% | 1.7% | 2.4% | 1.5% | 2.0% |
| 44 (3,4,4,9,6) | 0.2% | 0.2% | 0.2% | 0.3% | 0.2% |
| 48 (3,5,4,3,6) | 0.2% | 0.3% | 0.2% | 0.1% | 0.2% |
| 49 (2,12,70,99,282) | 0.1% | 0.7% | 3.4% | 3.1% | 8.7% |
| 53 (54,26,34,131,142) | 3.6% | 1.4% | 1.6% | 4.1% | 4.4% |
| 58 (9,20,14,10,6) | 0.6% | 1.1% | 0.7% | 0.3% | 0.2% |
| 59 (16,31,28,35,49) | 1.1% | 1.7% | 1.3% | 1.1% | 1.5% |
| 68 (30,39,23,24,7) | 2.0% | 2.2% | 1.1% | 0.7% | 0.2% |
| 73 (9,6,14,7,9) | 0.6% | 0.3% | 0.7% | 0.2% | 0.3% |
| 74 (9,111,195,373,250) | 0.6% | 6.2% | 9.4% | 11.6% | 7.7% |
| 75 (19,30,40,60,58) | 1.3% | 1.7% | 1.9% | 1.9% | 1.8% |
| 76 (8,8,52,205,396) | 0.5% | 0.4% | 2.5% | 6.4% | 12.2% |
| 77 (31,30,27,64,77) | 2.1% | 1.7% | 1.3% | 2.0% | 2.4% |
| 78 (0,0,0,3,3) | 0.0% | 0.0% | 0.0% | 0.1% | 0.1% |
| 80 (26,21,9,9,28) | 1.7% | 1.2% | 0.4% | 0.3% | 0.9% |
| 81 (110,157,205,199,191) | 7.4% | 8.7% | 9.8% | 6.2% | 5.9% |
| 82 (39,79,48,68,34) | 2.6% | 4.4% | 2.3% | 2.1% | 1.0% |
| 83 (16,19,24,58,49) | 1.1% | 1.1% | 1.2% | 1.8% | 1.5% |
| 87 (24,31,27,40,40) | 1.6% | 1.7% | 1.3% | 1.2% | 1.2% |
| 89 (99,101,122,144,170) | 6.6% | 5.6% | 5.9% | 4.5% | 5.2% |
| 90 (2,0,2,3,2) | 0.1% | 0.0% | 0.1% | 0.1% | 0.1% |
| 91 (19,33,33,27,39) | 1.3% | 1.8% | 1.6% | 0.8% | 1.2% |
| 92 (2,3,11,64,36) | 0.1% | 0.2% | 0.5% | 2.0% | 1.1% |
| 94 (3,7,5,11,22) | 0.2% | 0.4% | 0.2% | 0.3% | 0.7% |
| 101 (18,79,50,50,49) | 1.2% | 4.4% | 2.4% | 1.6% | 1.5% |
| 102 (6,4,4,8,11) | 0.4% | 0.2% | 0.2% | 0.2% | 0.3% |
| 112 (2,0,2,2,2) | 0.1% | 0.0% | 0.1% | 0.1% | 0.1% |
| 114 (7,12,8,19,3) | 0.5% | 0.7% | 0.4% | 0.6% | 0.1% |
| 118 (21,23,8,15,7) | 1.4% | 1.3% | 0.4% | 0.5% | 0.2% |
| 161 (0,0,0,0,3) | 0.0% | 0.0% | 0.0% | 0.0% | 0.1% |
| 168 (0,0,0,4,2) | 0.0% | 0.0% | 0.0% | 0.1% | 0.1% |
| 169 (1,2,8,4,2) | 0.1% | 0.1% | 0.4% | 0.1% | 0.1% |
| 183 (0,1,0,1,3) | 0.0% | 0.1% | 0.0% | 0.0% | 0.1% |
| 221 (0,0,0,0,2) | 0.0% | 0.0% | 0.0% | 0.0% | 0.1% |
| NT (0,0,1,1,4) | 0.0% | 0.0% | 0.0% | 0.0% | 0.1% |
| Other (28,34,40,34,22) | 1.9% | 1.9% | 1.9% | 1.1% | 0.7% |
Page details
- Date modified: