
Epidemiologic trends of seasonal influenza A and B during imposed COVID-19 shutdowns

 Download this article as a PDF
Published by: The Public Health Agency of Canada
Issue: Volume 47-3: Influenza and Other Respiratory Viruses
Date published: March 2021
ISSN: 1481-8531
Submit a manuscript
About CCDR
Browse
Volume 47-3: Influenza and Other Respiratory Viruses
Surveillance
Impact of nonpharmaceutical interventions on laboratory detections of influenza A and B in Canada
Philippe Lagacé-Wiens1,2, Claire Sevenhuysen3, Liza Lee3, Andrea Nwosu3, Tiffany Smith3
Affiliations
1 Shared Health, Winnipeg, MB
2 University of Manitoba, Winnipeg, MB
3 Public Health Agency of Canada, Ottawa, ON
Correspondence
Suggested citation
Lagacé-Wiens P, Sevenhuysen C, Lee L, Nwosu A, Smith T. Impact of nonpharmaceutical interventions on laboratory detections of influenza A and B in Canada. Can Commun Dis Rep 2021;47(3):142–8. https://doi.org/10.14745/ccdr.v47i03a04
Keywords: social distancing, physical distancing, influenza, COVID-19, SARS-CoV-2, public health, nonpharmaceutical interventions, NPI
Abstract
Background: The first coronavirus disease 2019 (COVID-19) case was reported in Canada on January 25, 2020. In response to the imminent outbreak, many provincial and territorial health authorities implemented nonpharmaceutical public health measures to curb the spread of disease. "Social distancing" measures included restrictions on group gatherings; cancellation of sports, cultural and religious events and gatherings; recommended physical distancing between people; school and daycare closures; reductions in non-essential services; and closures of businesses.
Objectives: To evaluate the impact of the combined nonpharmaceutical interventions imposed in March 2020 on influenza A and B epidemiology by comparing national laboratory surveillance data from the intervention period with 9-year historical influenza season control data.
Methods: We obtained epidemiologic data on laboratory influenza A and B detections and test volumes from the Canadian national influenza surveillance system for the epidemiologic period December 29, 2019 (epidemiologic week 1) through May 2, 2020 (epidemiologic week 18). COVID-19-related social distancing measures were implemented in Canada from epidemiologic week 10 of this period. We compared influenza A and B laboratory detections and test volumes and trends in detection during the 2019–20 influenza season with those of the previous nine influenza seasons for evidence of changes in epidemiologic trends.
Results: While influenza detections the week prior to the implementation of social distancing measures did not differ statistically from the previous nine seasons, a steep decline in positivity occurred between epidemiologic weeks 10 and 14 (March 8–April 4, 2020). Both the percent positive on week 14 (p≤0.001) and rate of decline between weeks 10 and 14 (p=0.003) were significantly different from mean historical data.
Conclusion: The data show a dramatic decrease in influenza A and B laboratory detections concurrent with social distancing measures and nonpharmaceutical interventions in Canada. The impact of these measures on influenza transmission may be generalizable to other respiratory viral illnesses during the study period, including COVID-19.
Introduction
The coronavirus disease 2019 (COVID-19) pandemic has been recognized as a public health crisis. As the number of cases has increased in Canada and abroad, governments have imposed measures to reduce transmission of severe acute respiratory coronavirus 2 (SARS-CoV-2). Among these have been massive public health campaigns, invocation of public health emergencies and the enactment of laws under emergency measures legislation to reduce person-to-person transmission.
Such broad nonpharmaceutical interventions have not been applied on a universal scale since the advent of modern laboratory surveillance, and while these actions are supported by epidemiologic theory, approaches combining multiple nonpharmaceutical control measures have not been rigorously attempted beyond a relatively limited scale.
Evidence from similar smaller-scale or regional interventions (e.g. school closures, travel restrictions, business closures) has shown only slight effects on interrupting respiratory virus epidemics (e.g. influenza)Footnote 1Footnote 2. In addition, recent meta-analyses suggest a modest benefit of physical measures like hand washing on community transmission of influenzaFootnote 3 . Since these physical measures have been strongly encouraged along with restrictions on social interactions and gatherings, there may be an additive effect on community transmission. A number of studies have shown that similar interventions have been effective for control of COVID-19Footnote 4Footnote 5. To demonstrate the benefit gained versus the enormous social and financial cost of universal social distancing measures, it is critical that we confirm the effectiveness of these measures on the transmission of respiratory viral infections. Because of the short incubation period of influenza viruses (mean 0.6–1.4 days)Footnote 6 compared to SARS-CoV-2 (mean 5.2 days, 95% confidence intervals [CI]: 4.1–7.0 days)Footnote 7, the impact of such measures should be evident within two to three weeks of their implementation. The effect of the measures could be detected using existing surveillance systems for influenza.
We analyzed laboratory surveillance data for evidence of changes in influenza transmission with voluntary "social distancing" measures that began in Canada along with public health messaging in early March 2020. These voluntary measures were followed by more aggressive public health measures as of March 12, 2020 (i.e. school closures, closure of non-essential businesses and strict border controls).
Background
Provincial and territorial health authorities implemented social distancing measures gradually, starting in early March (epidemiologic week 10). The measures included physical distancing between individuals, restrictions on group gatherings, cancellation of sporting and arts events, closures of businesses and recreational areas where people congregate, country-wide school and daycare closures, cancellation of religious events, and efforts to dramatically reduce the active "on-site" workforce by encouraging employees to work from home. In general, these interventions were in keeping with recommendations outlined in Canada's pandemic plans, Canadian Pandemic Influenza Preparedness: Planning Guidance for the Health SectorFootnote 8.
In the first days of March, media announcements and public health messaging recommended physical distancing between individuals, avoiding gatherings and reinforcing cough etiquette. Within two weeks, these recommendations were legally reinforced. Québec was the first province to declare a public health emergency through their Public Health Act on March 13, 2020Footnote 9. By March 18, 2020, over 90% of the Canadian population was legally directed under various emergency acts to engage in strict measures to prevent the spread of COVID-19. By March 22, 2020, all Canadian provinces and territories were under various forms of public health emergency legislationFootnote 9.
Across Canada, by the third week of March, all personal, community and travel restrictions were in place to varying degrees of enforcement under public health regulations recommended by the Public Health Agency of Canada (PHAC, or the Agency). This was the first time in the history of modern influenza surveillance that all the recommended social distancing measures in pandemic preparedness planning guidance were implemented simultaneously across the entire country. In addition, health authorities dramatically increased messaging to do with physical interventions (hand washing and use of personal protective equipment), resulting in increased utilization of these interventions during this period. The use of face masks was neither recommended nor imposed during this period.
We hypothesized that these collective interventions would have an impact on laboratory detections of influenza, heralding a potential effect on other respiratory viral infections including COVID-19.
Methods
National influenza surveillance is coordinated by PHAC. The Agency's influenza surveillance program receives data on several indicators of influenza activity from a network of labs, hospitals, doctor's offices, members of the public, and provincial and territorial ministries of health on a weekly basisFootnote 10. Sentinel public health and hospital laboratories provide PHAC with weekly summaries of influenza test results and test volumes, and the Agency collates the data and provides the public with updates. Data have been continuously collected since 1993, and long-term analysis of seasonal trends is made possible both by the continuity of laboratory data and absence of any influenza pandemics since 2009.
We analyzed the post-2009 trends using national data to determine if any changes in trends in influenza A and B epidemiology during the 2020 season could be attributed to social distancing. Only one sentinel laboratory has been added to those providing surveillance data over the previous 10 seasons: St. Joseph's Healthcare in Hamilton, Ontario, during the 2019–20 influenza season. While this laboratory contributed 7.8% of the 2019–20 surveillance sample numbers in this study, analysis excluding the data from St. Joseph's did not appreciably change the results.
The sentinel laboratories provide limited information on testing modality or demographics. While most laboratories perform nucleic acid amplification testing (NAAT) for influenza viruses, data from both cell culture and NAAT are accepted.
Laboratories provide limited demographic information and no clinical information on positive cases and no information on negative cases. The limited demographic information was not accessed as part of this study.
The study population included all influenza tests conducted at sentinel laboratories in Canada during the study period of 2011–20. During the control period of 2011–19, there were no universal control interventions for respiratory viral infections based on social distancing.
For the purpose of this analysis, we defined a case as any laboratory-confirmed positive test for either influenza A or B reported to the Agency. Weekly influenza-positive percentage was defined as the number of cases reported over the total number of tests performed for the epidemiologic week under surveillance, expressed as a percentage.
The control period included the 2011 through 2019 influenza seasons. To account for seasonal variations in influenza season onset and duration, we aligned the peak epidemic activity weeks for each control season, defined as the week with the highest proportion of influenza-positive laboratory detections. Our analysis included the portion of the 2019–20 influenza season from December 29, 2019 (epidemiologic week 1) through May 2, 2020 (epidemiologic week 18). The intervention period is defined as weeks 10 through 18 of 2020.
We retrieved data on laboratory detections of influenza A and B and test volumes for the past 10 years from the Canadian Open Data websiteFootnote 10, maintained by the Government of Canada Open Data website, and FluWatch reportsFootnote 11 for the study period. These datasets come from open-access sources of ongoing public health surveillance and are exempt from research ethics board approval. Data were complete for the entire study period. Data from 2011 through 2019 have been finalized by FluWatch for their year-end report, but data from 2020 were collected in real-time and minor reporting delays from provinces could have occurred. Data from the most current three weeks is occasionally adjusted as updated information is received in the subsequent weeks. At the time of this publication, all data up to epidemiologic week 18 were considered final.
Data from the control period were expressed as weekly influenza-positive percentage by week pre or post-peak activity. We determined mean influenza-positive percentage and standard deviations for each week, and the z score and p value for each of the weekly influenza-positive percentages during the 2020 surveillance period compared to the peak-aligned control season means. Using least squares linear regression analysis, we compared the slope of influenza-positive percentage by epidemiologic week from the first 4 weeks of the 2020 intervention period (epidemiologic weeks 10–13, post-peak weeks 5–8) to the slope in the equivalent portion of the control seasons using a Student t test with pooled variance. We determined descriptive statistics and z scores and corresponding p values using Microsoft Excel 2010 (Redmond, Washington, United States) and performed linear regression analysis using JMP statistical analysis software (SAS Institute Inc., Cary, North Carolina, United States).
Results
Positive influenza tests were reported by week of the laboratory report. Data were complete for all epidemiologic weeks between 2011 and 2019, with no omissions. Figure 1 shows the mean influenza-positive percentage and 95% CI by week, pre and post-peak. Observed values for the corresponding weeks in 2020 are overlaid on the control period values. Table 1 shows the p values for the percent positive influenza tests for weeks 10 through 18 of the 2019–20 influenza season compared to historical values. The data demonstrate an unexpected decline in influenza-positive percentage starting in epidemiologic week 10, corresponding to March 1 through March 7, compared to the control period. By early April (week 14, post-peak week 9), there was a marked difference between 2020 percent positive (0.75%) and control period mean percent positive (13.97%, p≤0.001). Between epidemiologic weeks 10 and 13 of the 2020 season, the mean absolute rate of decline in percent positive was 4.41% per week, compared to 1.58% per week for the peak-aligned control period. Linear regression analysis of the slopes during this period showed the downward slope of the 2020 season to differ statistically significantly compared to the linear regression slope of the 2011–19 seasons (p≤0.001).
Figure 1: Mean influenza-positive percent for peak-aligned control period (2011–19) and influenza-positive percent for the 2020 study period by pre and post-peak week and 2020 epidemiologic week
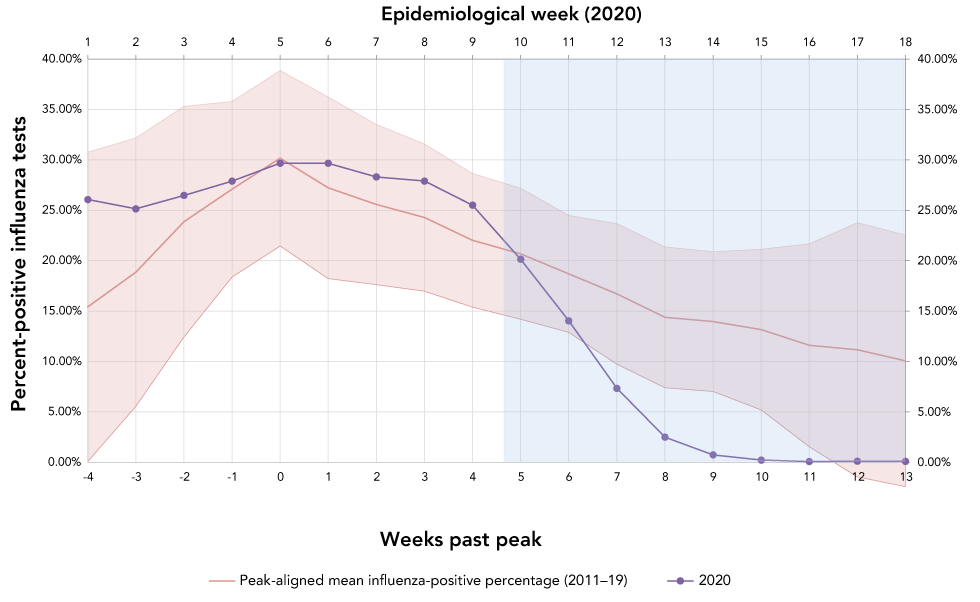
Text description: Figure 1
| Epidemiological week | Week passed peak | Peak-aligned mean influenza positive percentage (2011–2019) | Upper 95th percentile | Lower 95th percentile | 2020 percent positive influenza tests |
|---|---|---|---|---|---|
| 1 | -4 | 15.43% | 30.76% | 0.09% | 26.08% |
| 2 | -3 | 18.87% | 32.19% | 5.55% | 25.15% |
| 3 | -2 | 23.88% | 35.31% | 12.44% | 26.48% |
| 4 | -1 | 27.10% | 35.81% | 18.38% | 27.90% |
| 5 | 0 | 30.17% | 38.87% | 21.47% | 29.68% |
| 6 | 1 | 27.23% | 36.23% | 18.23% | 29.67% |
| 7 | 2 | 25.58% | 33.53% | 17.63% | 28.32% |
| 8 | 3 | 24.29% | 31.58% | 16.99% | 27.91% |
| 9 | 4 | 22.03% | 28.66% | 15.40% | 25.51% |
| 10 | 5 | 20.69% | 27.19% | 14.19% | 20.16% |
| 11 | 6 | 18.70% | 24.50% | 12.90% | 14.05% |
| 12 | 7 | 16.72% | 23.68% | 9.75% | 7.35% |
| 13 | 8 | 14.39% | 21.38% | 7.41% | 2.51% |
| 14 | 9 | 13.97% | 20.90% | 7.05% | 0.75% |
| 15 | 10 | 13.17% | 21.14% | 5.20% | 0.23% |
| 16 | 11 | 11.61% | 21.68% | 1.55% | 0.09% |
| 17 | 12 | 11.18% | 23.78% | 0.00% | 0.13% |
| 18 | 13 | 10.08% | 22.56% | 0.00% | 0.11% |
| Week number | Week dates | Influenza A positive | Influenza B positive | Total influenza positive | Total influenza tests (2020) | Mean influenza tests (control period) | % influenza positiveTable 1 footnote a | Relative decline from prior week | p value (versus peak-aligned control period)Table 1 footnote b |
|---|---|---|---|---|---|---|---|---|---|
| 10 | March 1–7 | 2,412 | 1,151 | 3,563 | 17,686 | 7,709 | 20.16 | N/A | 0.436 |
| 11 | March 8–14 | 2,326 | 1,016 | 3,342 | 23,787 | 7,242 | 14.05 | 30.3 | 0.058 |
| 12 | March 15–21 | 1,141 | 594 | 1,735 | 23,566 | 6,658 | 7.35 | 47.7 | 0.004 |
| 13 | March 22–28 | 273 | 266 | 539 | 21,299 | 6,043 | 2.51 | 65.9 | ≤0.001 |
| 14 | March 29–April 4 | 68 | 88 | 156 | 20,760 | 5,857 | 0.75 | 70.1 | ≤0.001 |
| 15 | April 5–11 | 21 | 18 | 39 | 16,699 | 5,460 | 0.23 | 69.4 | ≤0.001 |
| 16 | April 12–18 | 4 | 11 | 15 | 16,758 | 4,793 | 0.09 | 60.9 | 0.012 |
| 17 | April 19–25 | 6 | 14 | 20 | 15,967 | 4,489 | 0.13 | N/ATable 1 footnote c | 0.043 |
| 18 | April 26–May 2 | 4 | 9 | 13 | 11,514 | 4,016 | 0.11 | N/ATable 1 footnote c | 0.058 |
Discussion
The national epidemic curve of influenza in Canada, as described by influenza-positive percent, follows a predictable pattern of increasing percentage of positive tests into the winter months, peaking around the end of December or early January, and a subsequent slow decline into the inter-epidemic period. At the beginning of the intervention period, the mean influenza-positive percentage for the 2011–19 seasons was 20.69%. By week 14, this mean influenza-positive percentage had declined to 15.61%.
The 2020 influenza epidemic shows comparable values in week 1 through 10 (see Figure 1), with a steep decline in influenza-positive percentage by week 14. Linear regression also indicates that the rate of decline during the intervention period was statistically unlikely to occur at this point of an influenza epidemic based on nine years of historical data. This decline was evident by week 11, shortly after increasing federal and provincial/territorial and local messaging around social distancing. The weekly relative rate of decline incrementally increased between weeks 11 and 14, suggesting that the escalation in social distancing measures was having a sustained or increasing impact on influenza transmission. Because the incubation periods of influenza A (1.4 days; 95% CI: 1.3–1.5) and B (0.6 days; 95% CI: 0.5–0.6) are relatively shortFootnote 6, such rapid rates of decline would be predicted if these interventions were effective at reducing the apparent reproductive number of these illnesses.
While it is not possible to identify precisely when modifications in behaviours leading to reduced transmission occurred, this decline in transmission appears to have occurred prior to declarations of public health emergencies and shortly after the increased public health messaging around social distancing and barrier interventions. While legislation of social/physical distancing through the public health or emergency measures acts in mid-March likely reinforced these behaviours, the decline in influenza transmission prior to these would suggest that the voluntary social/physical distancing practices recommended in early March may have affected influenza transmission.
Several other studies, primarily from Asian countries, have reported an effect of nonpharmaceutical public health measures, including a broad range of interventions and behavioural changes, on influenza epidemiologyFootnote 12Footnote 13Footnote 14Footnote 15Footnote 16Footnote 17. In previous reviews of nonpharmaceutical interventions for influenza control, reactive school closures (as those in Canada in response to the COVID-19 pandemic) reportedly decreased influenza transmission by 7% to 15% Footnote 2Footnote 18. Broad working-from-home approaches have been shown to reduce transmission by 20%–30%, while travel restrictions (>50%) may delay influenza peak transmissionFootnote 2.
Limitations
The most significant limitation of this observational study is that we cannot definitively confirm that the decline in proportion of influenza-positive samples was caused by the intervention. Nevertheless, several observations support an element of causality based on Bradford–Hill criteriaFootnote 19: the observed effect of the social distancing period is very strongly associated with declining influenza positivity; the effect was consistent across all provinces and territories (data not shown); the effect is temporarily associated with the intervention, which started with voluntary distancing in early March; there is a plausible mechanism for causality (interruption of person-to-person transmission); and there are analogous observations of such dramatic declines in infectious diseases with other effective population-level interventions, for example, vaccination, as well as reports of smaller-scale social distancing interventions resulting in less dramatic reductions in influenza transmission in the studied populationFootnote 2.
Although we recognize that the complexities of public health interventions do not lend themselves to use of the Bradford–Hill criteria as effectively as specific exposuresFootnote 19, the evidence is strong that the interventions had an effect on the proportion of influenza-positive samples. It is also impossible to ascertain the relative effect of each intervention. While our data reveal the net impact of the period in which nonpharmaceutical interventions were imposed, they cannot identify whether social distancing was exclusively responsible or if co-occurring interventions such as enhanced physical methods (hand washing and masking) or concurrent pharmaceutical interventions (e.g. oseltamivir use, vaccination) played a role in the decline. Nevertheless, the collective impact of these measures was significant.
Alternative explanations for the decline in influenza test positivity are possible if unlikely. One example is change in surveillance input, such as testing individuals with a wider variety of clinical presentations, as well as a testing a more diverse patient population than usually represented in influenza surveillance data, including those for whom testing for influenza was directly or indirectly influenced by clinical suspicion of COVID-19. In addition, population behaviours such as healthcare avoidance as COVID-19 circulation in Canada increased might produce similar effects. However, all of these effects are unlikely to have resulted in the abrupt decline in influenza detections. An increase in testing volume due to over-testing individuals with mild clinical symptoms or those not typically represented in influenza data should have resulted in a similar or slightly increased absolute number of influenza cases with a decline in the percent positive due to over-representation of samples from asymptomatic individuals. However, the data during the intervention period clearly show a steep decline in the absolute number of influenza cases as well as percent-positive samples (Table 1). Likewise, reduced healthcare-seeking behaviours during the intervention period cannot explain the findings as the volume of influenza testing sharply increased from baseline (Table 1) during the intervention period, likely in response to population and public health concerns to do with the COVID-19 pandemic.
Lastly, a reduction in absolute influenza detections might have been expected if testing was restricted to more severely ill patients during the intervention period. However, this should have resulted in an increase in the percent positive, not a decrease, adding further support to the likelihood that the control measures did result in decreased transmission.
We conclude, based on the observed trend in the percentage of influenza-positive samples, that the dramatic decline was a result of the population-level interventions collectively referred to as social distancing. However, our data does not allow us to conclude that co-occurring pharmaceutical interventions (e.g. increased usage oseltamivir and vaccination) and physical, nonpharmaceutical interventions (hand washing, use of personal protective equipment and masks) may have added to this effect.
Conclusion
This study contributes to the global evidence by showing that, through a combination of multiple voluntary and legislated nonpharmaceutical measures, a relative decline of 96.6% in influenza transmission (as measured by percent-positive samples) was achieved over four weeks. Given the dramatic effect of the national-level interventions on influenza positivity, it is clear that universal application of multiple social distancing measures results in considerable reduction in influenza transmission, far greater than those reported for localized and limited interventions. Achieving reductions on a national scale is also feasible, albeit at great economic and personal cost.
While this observation does not necessarily mean that the intervention effects are generalizable to COVID-19, given the similar modes of transmission of the influenza and SARS-CoV-2 viruses, we could expect a similar effect. These findings are also consistent with other reports of reduction in transmission of both influenza and COVID-19Footnote 12. However, because the incubation of SARS-CoV-2 is longer than that of influenza, any impact on the epidemic curve of COVID-19 would likely occur over a considerably longer period than that observed with influenza. In addition, differences in basic reproductive number of seasonal influenza (1.19–1.37)Footnote 20 and SARS-CoV-2 (2.24–3.58 to 3.8–8.9)Footnote 21Footnote 22 likely mean that a greater intensity of interventions in a susceptible population are required to reduce the apparent reproduction number to below one.
Authors’ statement
- PLW — Co-conceived the study idea, analyzed and interpreted the data and drafted the manuscript
- CS — Co-conceived the study idea, participated in data acquisition, analysis and interpretation and edited the manuscript
- LL, AN, TS — Participated in data acquisition and edited the manuscript
Competing interests
None.
Acknowledgements
The authors acknowledge the contribution of the provincial health and clinical laboratory partners that provide surveillance data to FluWatch.
Funding
This work was supported by the Public Health Agency of Canada.
References
- Footnote 1
-
Markel H, Lipman HB, Navarro JA, Sloan A, Michalsen JR, Stern AM, Cetron MS. Nonpharmaceutical interventions implemented by US cities during the 1918-1919 influenza pandemic. JAMA 2007;298(6):644–54. https://doi.org/10.1001/jama.298.6.644
- Footnote 2
-
Rashid H, Ridda I, King C, Begun M, Tekin H, Wood JG, Booy R. Evidence compendium and advice on social distancing and other related measures for response to an influenza pandemic. Paediatr Respir Rev 2015;16(2):119–26. https://doi.org/10.1016/j.prrv.2014.01.003
- Footnote 3
-
Jefferson T, Del Mar CB, Dooley L, Ferroni E, Al-Ansary LA, Bawazeer GA, van Driel ML, Jones MA, Thorning S, Beller EM, Clark J, Hoffmann TC, Glasziou PP, Conly JM. Physical interventions to interrupt or reduce the spread of respiratory viruses. Cochrane Database Syst Rev 2020;11:CD006207. https://doi.org/10.1002/14651858.CD006207.pub5
- Footnote 4
-
Ferguson N, Laydon D, Nedjati Gilani G, Imai N, Ainslie K, Baguelin M, Bhatia S, Boonyasiri A, Cucunubá Z, Cuomo-Dannenburg G, Dighe A, Dorigatti I, Fu H, Gaythorpe K, Green W, Hamlet A, Hinsley W, Okell LC, van Elsland S, Thompson H, Verity R, Volz E, Wang H, Wang Y, Walker PG, Walters C. Peter Winskill, Charles Whittaker, Christl A Donnelly, Steven Riley, Azra C Ghani; Imperial College COVID-19 Response Team. Report 9: impact of non-pharmaceutical interventions (NPIs) to reduce COVID19 mortality and healthcare demand. London (UK): MRC Centre for Global Infectious Disease Analysis; 2020. https://www.imperial.ac.uk/media/imperial-college/medicine/sph/ide/gida-fellowships/Imperial-College-COVID19-NPI-modelling-16-03-2020.pdf
- Footnote 5
-
Koo JR, Cook AR, Park M, Sun Y, Sun H, Lim JT, Tam C, Dickens BL. Interventions to mitigate early spread of SARS-CoV-2 in Singapore: a modelling study. Lancet Infect Dis 2020;20(6):678–88. https://doi.org/10.1016/S1473-3099(20)30162-6
- Footnote 6
-
Lessler J, Reich NG, Brookmeyer R, Perl TM, Nelson KE, Cummings DA. Incubation periods of acute respiratory viral infections: a systematic review. Lancet Infect Dis 2009;9(5):291–300. https://doi.org/10.1016/S1473-3099(09)70069-6
- Footnote 7
-
Li Q, Guan X, Wu P, Wang X, Zhou L, Tong Y, Ren R, Leung KS, Lau EH, Wong JY, Xing X, Xiang N, Wu Y, Li C, Chen Q, Li D, Liu T, Zhao J, Liu M, Tu W, Chen C, Jin L, Yang R, Wang Q, Zhou S, Wang R, Liu H, Luo Y, Liu Y, Shao G, Li H, Tao Z, Yang Y, Deng Z, Liu B, Ma Z, Zhang Y, Shi G, Lam TT, Wu JT, Gao GF, Cowling BJ, Yang B, Leung GM, Feng Z. Early transmission dynamics in Wuhan, China, of novel coronavirus-infected pneumonia. N Engl J Med 2020;382(13):1199–207. https://doi.org/10.1056/NEJMoa2001316
- Footnote 8
-
Public Health Agency of Canada. Public health measures: Canadian pandemic influenza preparedness: planning guidance for the health sector. Ottawa (ON): PHAC; 2018 (updated 2018-12-18). https://www.canada.ca/en/public-health/services/flu-influenza/canadian-pandemic-influenza-preparedness-planning-guidance-health-sector.html
- Footnote 9
-
Dawson T. As the COVID-19 pandemic hit, provinces declared states of emergency. Now many are up for renewal. National Post; 2020-04-15 (updated 2020-06-15). https://nationalpost.com/news/provincial-states-of-emergencies-were-issued-a-month-ago-most-are-coming-up-for-renewal
- Footnote 10
-
Open Government. Open data. Ottawa (ON): Government of Canada; (accessed 2020-04-21). https://open.canada.ca/en/open-data
- Footnote 11
-
Public Health Agency of Canada. Flu (influenza): FluWatch surveillance. Ottawa (ON): PHAC; (accessed 2020-06-25). https://www.canada.ca/en/public-health/services/diseases/flu-influenza/influenza-surveillance.html
- Footnote 12
-
Cowling BJ, Ali ST, Ng TW, Tsang TK, Li JC, Fong MW, Liao Q, Kwan MY, Lee SL, Chiu SS, Wu JT, Wu P, Leung GM. Impact assessment of non-pharmaceutical interventions against coronavirus disease 2019 and influenza in Hong Kong: an observational study. Lancet Public Health 2020;5(5):e279–88. https://doi.org/10.1016/S2468-2667(20)30090-6
- Footnote 13
-
Kuo SC, Shih SM, Chien LH, Hsiung CA. Collateral benefit of COVID-19 Control measures on influenza activity, Taiwan. Emerg Infect Dis 2020;26(8):1928–30. https://doi.org/10.3201/eid2608.201192
- Footnote 14
-
Soo RJ, Chiew CJ, Ma S, Pung R, Lee V. Decreased influenza incidence under COVID-19 control measures, Singapore. Emerg Infect Dis 2020;26(8):1933–5. https://doi.org/10.3201/eid2608.201229
- Footnote 15
-
Sun J, Shi Z, Xu H. Non-pharmaceutical interventions used for COVID-19 had a major impact on reducing influenza in China in 2020. J Travel Med 2020;taaa064. https://doi.org/10.1093/jtm/taaa064
- Footnote 16
-
Wu D, Lu J, Liu Y, Zhang Z, Luo L. Positive effects of COVID-19 control measures on influenza prevention. Int J Infect Dis 2020;95:345–6. https://doi.org/10.1016/j.ijid.2020.04.009
- Footnote 17
-
Sakamoto H, Ishikane M, Ueda P. Seasonal influenza activity during the SARS-CoV-2 outbreak in Japan. JAMA 2020;323(19):1969–71. https://doi.org/10.1001/jama.2020.6173
- Footnote 18
-
Cauchemez S, Ferguson NM, Wachtel C, Tegnell A, Saour G, Duncan B, Nicoll A. Closure of schools during an influenza pandemic. Lancet Infect Dis 2009;9(8):473–81. https://doi.org/10.1016/S1473-3099(09)70176-8
- Footnote 19
-
Rothman KJ, Greenland S. Causation and causal inference in epidemiology. Am J Public Health 2005;95(S1 Suppl 1):S144–50. https://doi.org/10.2105/AJPH.2004.059204
- Footnote 20
-
Biggerstaff M, Cauchemez S, Reed C, Gambhir M, Finelli L. Estimates of the reproduction number for seasonal, pandemic, and zoonotic influenza: a systematic review of the literature. BMC Infect Dis 2014;14(1):480. https://doi.org/10.1186/1471-2334-14-480
- Footnote 21
-
Zhao S, Lin Q, Ran J, Musa SS, Yang G, Wang W, Lou Y, Gao D, Yang L, He D, Wang MH. Preliminary estimation of the basic reproduction number of novel coronavirus (2019-nCoV) in China, from 2019 to 2020: A data-driven analysis in the early phase of the outbreak. Int J Infect Dis 2020;92:214–7. https://doi.org/10.1016/j.ijid.2020.01.050
- Footnote 22
-
Sanche S, Lin YT, Xu C, Romero-Severson E, Hengartner N, Ke R. High contagiousness and rapid spread of severe acute respiratory syndrome coronavirus 2. Emerg Infect Dis 2020;26(7):1470–7. https://doi.org/10.3201/eid2607.200282

Page details
- Date modified: