
Respiratory Virus Report, week 36 ending September 7, 2019
Download the alternative format
(PDF format, 1.1 MB, 11 pages)
Organization: Public Health Agency of Canada
On this page
- List of abbreviations
- Respiratory Virus Detections and Isolations
- Number of positive laboratory tests for other respiratory viruses
- Positive Influenza tests
- Positive Respiratory synctial virus tests
- Positive Parainfluenza tests
- Positive Adenovirus tests
- Positive Human metapneumovirus tests
- Positive Enterovirus/Rhinovirus tests
- Positive Coronovirus tests
List of abbreviations
- A(H1N1)pdm09
- Influenza A(H1N1)pdm09
- A(H3)
- Influenza A(H3N2)
- A (UnS)
- Influenza A (Unsubtyped)
- Adeno
- Adenovirus
- CHEO
- Children's Hospital of Eastern Ontario
- Coron
- Coronavirus
- Entero
- Enterovirus
- hMPV
- human metapneumovirus
- HSC
- Health Sciences Centre
- N.A
- Not Applicable
- P.H.L.
- Public Health Laboratory
- P.H.O.L.
- Public Health Ontario Laboratory
- PIV
- Parainfluenza
- Rhino
- Rhinovirus
- RSV
- Respiratory syncytial virus
- UHN
- University Health Network
Respiratory Virus Detections and Isolations
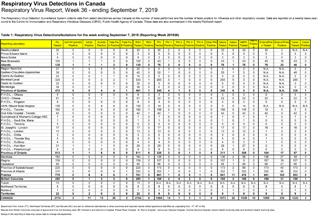
Table 1: Respiratory Virus Detections/Isolations for the week ending September 7, 2019 (Reporting Week 201936)
| Reporting Laboratory | Flu Tested | A(H1N1)pdm09 Positive | A(H3) Positive | A(UnS) Positive | Total Flu A Positive | Total Flu B Positive | RSV Tested | RSV Positive | PIV Tested | PIV 1 Positive | PIV 2 Positive | PIV 3 Positive | PIV 4 Positive | Other PIV Positive | Adeno Tested | Adeno Positive | hMPV Tested | hMPV Positive | Entero/Rhino Tested | Entero/Rhino Positive | Coron Tested | Coron Positive |
|---|---|---|---|---|---|---|---|---|---|---|---|---|---|---|---|---|---|---|---|---|---|---|
| Newfoundland | 30 | 0 | 0 | 0 | 0 | 0 | 30 | 0 | 30 | 2 | 0 | 0 | 0 | 0 | 30 | 0 | 30 | 0 | 30 | 2 | N.A. | N.A. |
| Prince Edward Island | 0 | 0 | 0 | 0 | 0 | 0 | 0 | 0 | 0 | 0 | 0 | 0 | 0 | 0 | 0 | 0 | 0 | 0 | 0 | 0 | 0 | 0 |
| Nova Scotia | 8 | 0 | 0 | 0 | 0 | 0 | 9 | 0 | 3 | 0 | 0 | 0 | 0 | 0 | 3 | 0 | 3 | 0 | 3 | 0 | 3 | 0 |
| New Brunswick | 100 | 1 | 1 | 1 | 3 | 0 | 100 | 0 | 43 | 1 | 0 | 0 | 0 | 0 | 43 | 1 | 43 | 0 | 43 | 18 | 43 | 0 |
| Atlantic | 138 | 1 | 1 | 1 | 3 | 0 | 139 | 0 | 76 | 3 | 0 | 0 | 0 | 0 | 76 | 1 | 76 | 0 | 76 | 20 | 46 | 0 |
| Région Nord-Est | 21 | 0 | 0 | 0 | 0 | 0 | 20 | 0 | 0 | 0 | 0 | 0 | 0 | 0 | 0 | 0 | 0 | 0 | N.A. | N.A. | 0 | 0 |
| Québec-Chaudière-Appalaches | 36 | 0 | 0 | 0 | 0 | 0 | 42 | 0 | 52 | 1 | 0 | 0 | 0 | 0 | 55 | 1 | 0 | 0 | N.A. | N.A. | 48 | 0 |
| Centre-du-Québec | 20 | 0 | 0 | 1 | 1 | 0 | 16 | 0 | 0 | 0 | 0 | 0 | 0 | 0 | 0 | 0 | 0 | 0 | N.A. | N.A. | 0 | 0 |
| Montréal-Laval | 325 | 0 | 0 | 2 | 2 | 1 | 333 | 1 | 293 | 3 | 1 | 0 | 0 | 0 | 293 | 5 | 0 | 0 | N.A. | N.A. | 290 | 1 |
| Ouest du Québec | 32 | 0 | 0 | 0 | 0 | 0 | 32 | 0 | 0 | 0 | 0 | 0 | 0 | 0 | 0 | 0 | 0 | 0 | N.A. | N.A. | 0 | 0 |
| Montérégie | 38 | 0 | 0 | 1 | 1 | 0 | 38 | 0 | 0 | 0 | 0 | 0 | 0 | 0 | 0 | 0 | 0 | 0 | N.A. | N.A. | 0 | 0 |
| Province of Québec | 472 | 0 | 0 | 4 | 4 | 1 | 481 | 1 | 345 | 4 | 1 | 0 | 0 | 0 | 348 | 6 | 0 | 0 | N.A. | N.A. | 338 | 1 |
| Ottawa P.H.L. | 9 | 0 | 0 | 0 | 0 | 0 | 9 | 0 | 3 | 0 | 0 | 0 | 0 | 0 | 3 | 0 | 3 | 0 | 0 | 0 | 0 | 0 |
| CHEO - Ottawa | 67 | 0 | 0 | 1 | 1 | 0 | 67 | 2 | 22 | 0 | 0 | 0 | 0 | 0 | 22 | 0 | 22 | 0 | 22 | 4 | 22 | 0 |
| Kingston P.H.L. | 8 | 0 | 0 | 0 | 0 | 0 | 8 | 0 | 4 | 0 | 0 | 0 | 0 | 0 | 4 | 0 | 4 | 0 | 0 | 0 | 0 | 0 |
| UHN / Mount Sinai Hospital | 136 | 0 | 0 | 4 | 4 | 0 | 136 | 2 | 14 | 0 | 0 | 0 | 0 | 0 | 0 | 0 | 14 | 0 | N.A. | N.A. | N.A. | N.A. |
| P.H.O.L. - Toronto | 162 | 0 | 0 | 0 | 0 | 0 | 162 | 1 | 156 | 2 | 0 | 1 | 0 | 0 | 156 | 0 | 145 | 0 | 12 | 0 | 0 | 0 |
| Sick Kids Hospital - Toronto | 42 | 0 | 0 | 0 | 0 | 0 | 42 | 1 | 42 | 1 | 0 | 0 | 0 | 0 | 42 | 0 | 42 | 0 | 42 | 9 | 42 | 0 |
| Sunnybrook & Women's College HSC | 7 | 0 | 0 | 0 | 0 | 0 | 7 | 0 | 7 | 0 | 0 | 0 | 0 | 0 | 7 | 0 | 7 | 0 | 7 | 0 | 7 | 0 |
| Sault Ste. Marie P.H.L. | 1 | 0 | 0 | 0 | 0 | 0 | 1 | 0 | 1 | 0 | 0 | 0 | 0 | 0 | 1 | 0 | 1 | 0 | 0 | 0 | 0 | 0 |
| Timmins P.H.L. | 0 | 0 | 0 | 0 | 0 | 0 | 0 | 0 | 0 | 0 | 0 | 0 | 0 | 0 | 0 | 0 | 0 | 0 | 0 | 0 | 0 | 0 |
| St. Joseph's - London | 17 | 0 | 0 | 0 | 0 | 0 | 17 | 0 | 17 | 0 | 0 | 0 | 0 | 0 | 17 | 0 | 17 | 0 | 16 | 4 | 16 | 0 |
| London P.H.L. | 13 | 0 | 0 | 0 | 0 | 0 | 13 | 0 | 13 | 0 | 0 | 0 | 0 | 0 | 13 | 0 | 12 | 0 | 1 | 0 | 0 | 0 |
| Orillia P.H.L. | 3 | 0 | 0 | 0 | 0 | 0 | 3 | 0 | 0 | 0 | 0 | 0 | 0 | 0 | 0 | 0 | 0 | 0 | 0 | 0 | 0 | 0 |
| Thunder Bay P.H.L. | 5 | 0 | 0 | 0 | 0 | 0 | 5 | 0 | 5 | 0 | 0 | 0 | 0 | 0 | 5 | 0 | 4 | 0 | 1 | 0 | 0 | 0 |
| Sudbury P.H.L. | 4 | 0 | 0 | 0 | 0 | 0 | 4 | 0 | 4 | 0 | 0 | 0 | 0 | 0 | 4 | 0 | 3 | 0 | 1 | 0 | 0 | 0 |
| Hamilton P.H.L. | 31 | 1 | 1 | 1 | 3 | 0 | 29 | 0 | 29 | 0 | 0 | 0 | 0 | 0 | 29 | 1 | 27 | 0 | 2 | 0 | 0 | 0 |
| Peterborough P.H.L. | 8 | 0 | 0 | 0 | 0 | 0 | 8 | 0 | 8 | 0 | 0 | 0 | 0 | 0 | 8 | 0 | 8 | 0 | 0 | 0 | 0 | 0 |
| Province of Ontario | 513 | 1 | 1 | 6 | 8 | 0 | 511 | 6 | 325 | 3 | 0 | 1 | 0 | 0 | 311 | 1 | 309 | 0 | 104 | 17 | 87 | 0 |
| Manitoba | 184 | 0 | 0 | 0 | 0 | 0 | 184 | 0 | 136 | 0 | 0 | 0 | 0 | 0 | 136 | 2 | 58 | 0 | 136 | 27 | 58 | 0 |
| Regina | 159 | 0 | 0 | 0 | 0 | 0 | 159 | 0 | 107 | 0 | 0 | 0 | 0 | 0 | 107 | 1 | 0 | 0 | 107 | 19 | 107 | 0 |
| Saskatoon | 66 | 0 | 0 | 0 | 0 | 0 | 66 | 0 | 66 | 0 | 0 | 0 | 0 | 0 | 66 | 1 | 66 | 0 | 66 | 21 | 66 | 0 |
| Province of Saskatchewan | 225 | 0 | 0 | 0 | 0 | 0 | 225 | 0 | 173 | 0 | 0 | 0 | 0 | 0 | 173 | 2 | 66 | 0 | 173 | 40 | 173 | 0 |
| Province of Alberta | 370 | 0 | 6 | 0 | 6 | 1 | 352 | 0 | 352 | 1 | 0 | 0 | 1 | 0 | 352 | 7 | 352 | 1 | 352 | 96 | 352 | 0 |
| Prairies | 779 | 0 | 6 | 0 | 6 | 1 | 761 | 0 | 661 | 1 | 0 | 0 | 1 | 0 | 661 | 11 | 476 | 1 | 661 | 163 | 583 | 0 |
| British Columbia | 250 | 0 | 1 | 2 | 3 | 0 | 250 | 1 | 168 | 3 | 0 | 2 | 0 | 0 | 168 | 2 | 168 | 9 | 159 | 31 | 159 | 1 |
| Yukon | 13 | 0 | 2 | 0 | 2 | 0 | 13 | 0 | N.A. | N.A. | N.A. | N.A. | N.A. | N.A. | N.A. | N.A. | N.A. | N.A. | N.A. | N.A. | N.A. | N.A. |
| Northwest Territories | 8 | 0 | 0 | 0 | 0 | 0 | 8 | 0 | 8 | 0 | 0 | 0 | 0 | 0 | 8 | 0 | 8 | 0 | 8 | 5 | 8 | 1 |
| Nunavut | 1 | 0 | 0 | 0 | 0 | 0 | 1 | 0 | 1 | 0 | 0 | 0 | 0 | 0 | 1 | 1 | 1 | 0 | 1 | 0 | 1 | 0 |
| Territories | 22 | 0 | 2 | 0 | 2 | 0 | 22 | 0 | 9 | 0 | 0 | 0 | 0 | 0 | 9 | 1 | 9 | 0 | 9 | 5 | 9 | 1 |
| CANADA | 2174 | 2 | 11 | 13 | 26 | 2 | 2164 | 8 | 1584 | 14 | 1 | 3 | 1 | 0 | 1573 | 22 | 1038 | 10 | 1009 | 236 | 1222 | 3 |
Table 1 notes
|
||||||||||||||||||||||
Table 2: Respiratory Virus Detections/Isolations for the period August 31, 2019 - September 7, 2019 (Reporting Weeks 201935-201936)
| Reporting Laboratory | Flu Tested | A(H1N1)pdm09 Positive | A(H3) Positive | A(UnS) Positive | Total Flu A Positive | Total Flu B Positive | RSV Tested | RSV Positive | PIV Tested | PIV 1 Positive | PIV 2 Positive | PIV 3 Positive | PIV 4 Positive | Other PIV Positive | Adeno Tested | Adeno Positive | hMPV Tested | hMPV Positive | Entero/Rhino Tested | Entero/Rhino Positive | Coron Tested | Coron Positive |
|---|---|---|---|---|---|---|---|---|---|---|---|---|---|---|---|---|---|---|---|---|---|---|
| Newfoundland | 66 | 0 | 0 | 0 | 0 | 0 | 66 | 0 | 66 | 2 | 0 | 0 | 0 | 0 | 66 | 0 | 66 | 0 | 66 | 10 | N.A. | N.A. |
| Prince Edward Island | 1 | 0 | 0 | 0 | 0 | 0 | 1 | 0 | 1 | 0 | 0 | 0 | 0 | 0 | 1 | 0 | 1 | 0 | 1 | 0 | 1 | 0 |
| Nova Scotia | 19 | 0 | 0 | 0 | 0 | 0 | 20 | 0 | 9 | 0 | 0 | 0 | 0 | 0 | 9 | 0 | 9 | 0 | 9 | 0 | 9 | 0 |
| New Brunswick | 147 | 1 | 1 | 2 | 4 | 0 | 147 | 0 | 74 | 1 | 0 | 0 | 0 | 0 | 74 | 2 | 74 | 0 | 74 | 22 | 74 | 0 |
| Atlantic | 233 | 1 | 1 | 2 | 4 | 0 | 234 | 0 | 150 | 3 | 0 | 0 | 0 | 0 | 150 | 2 | 150 | 0 | 150 | 32 | 84 | 0 |
| Région Nord-Est | 35 | 0 | 0 | 0 | 0 | 0 | 35 | 0 | 0 | 0 | 0 | 0 | 0 | 0 | 0 | 0 | 0 | 0 | N.A. | N.A. | 0 | 0 |
| Québec-Chaudière-Appalaches | 76 | 0 | 0 | 0 | 0 | 0 | 108 | 0 | 118 | 1 | 0 | 0 | 0 | 0 | 124 | 3 | 0 | 0 | N.A. | N.A. | 113 | 0 |
| Centre-du-Québec | 30 | 0 | 0 | 1 | 1 | 0 | 26 | 0 | 0 | 0 | 0 | 0 | 0 | 0 | 0 | 0 | 0 | 0 | N.A. | N.A. | 0 | 0 |
| Montréal-Laval | 581 | 0 | 0 | 6 | 6 | 2 | 588 | 2 | 479 | 5 | 1 | 0 | 0 | 0 | 479 | 9 | 0 | 0 | N.A. | N.A. | 471 | 3 |
| Ouest du Québec | 67 | 0 | 0 | 2 | 2 | 0 | 67 | 1 | 0 | 0 | 0 | 0 | 0 | 0 | 0 | 0 | 0 | 0 | N.A. | N.A. | 0 | 0 |
| Montérégie | 58 | 0 | 0 | 3 | 3 | 0 | 56 | 0 | 0 | 0 | 0 | 0 | 0 | 0 | 0 | 0 | 0 | 0 | N.A. | N.A. | 0 | 0 |
| Province of Québec | 847 | 0 | 0 | 12 | 12 | 2 | 880 | 3 | 597 | 6 | 1 | 0 | 0 | 0 | 603 | 12 | 0 | 0 | N.A. | N.A. | 584 | 3 |
| Ottawa P.H.L. | 21 | 0 | 0 | 0 | 0 | 0 | 19 | 0 | 13 | 0 | 0 | 0 | 0 | 0 | 13 | 0 | 12 | 0 | 1 | 0 | 0 | 0 |
| CHEO - Ottawa | 134 | 0 | 0 | 1 | 1 | 0 | 134 | 3 | 39 | 0 | 0 | 0 | 0 | 0 | 39 | 0 | 39 | 0 | 39 | 10 | 39 | 0 |
| Kingston P.H.L. | 10 | 0 | 0 | 0 | 0 | 0 | 10 | 0 | 6 | 0 | 0 | 0 | 0 | 0 | 6 | 0 | 6 | 0 | 0 | 0 | 0 | 0 |
| UHN / Mount Sinai Hospital | 285 | 0 | 0 | 5 | 5 | 0 | 285 | 3 | 29 | 0 | 0 | 0 | 0 | 0 | 0 | 0 | 29 | 1 | N.A. | N.A. | N.A. | N.A. |
| P.H.O.L. - Toronto | 309 | 0 | 5 | 0 | 5 | 0 | 309 | 1 | 298 | 4 | 0 | 1 | 0 | 0 | 298 | 3 | 281 | 0 | 21 | 0 | 0 | 0 |
| Sick Kids Hospital - Toronto | 42 | 0 | 0 | 0 | 0 | 0 | 42 | 1 | 42 | 1 | 0 | 0 | 0 | 0 | 42 | 0 | 42 | 0 | 42 | 9 | 42 | 0 |
| Sunnybrook & Women's College HSC | 11 | 0 | 0 | 0 | 0 | 0 | 11 | 0 | 11 | 0 | 0 | 0 | 0 | 0 | 11 | 0 | 11 | 0 | 11 | 1 | 11 | 0 |
| Sault Ste. Marie P.H.L. | 2 | 0 | 0 | 0 | 0 | 0 | 2 | 0 | 2 | 0 | 0 | 0 | 0 | 0 | 2 | 0 | 2 | 0 | 0 | 0 | 0 | 0 |
| Timmins P.H.L. | 0 | 0 | 0 | 0 | 0 | 0 | 0 | 0 | 0 | 0 | 0 | 0 | 0 | 0 | 0 | 0 | 0 | 0 | 0 | 0 | 0 | 0 |
| St. Joseph's - London | 33 | 0 | 0 | 0 | 0 | 0 | 33 | 1 | 33 | 0 | 0 | 0 | 0 | 0 | 33 | 0 | 33 | 0 | 31 | 6 | 31 | 0 |
| London P.H.L. | 33 | 0 | 0 | 0 | 0 | 0 | 33 | 0 | 33 | 0 | 0 | 0 | 0 | 0 | 33 | 0 | 29 | 0 | 4 | 0 | 0 | 0 |
| Orillia P.H.L. | 5 | 0 | 0 | 0 | 0 | 0 | 5 | 0 | 2 | 0 | 0 | 0 | 0 | 0 | 2 | 0 | 2 | 0 | 0 | 0 | 0 | 0 |
| Thunder Bay P.H.L. | 7 | 0 | 0 | 0 | 0 | 0 | 7 | 0 | 7 | 0 | 0 | 1 | 0 | 0 | 7 | 0 | 6 | 0 | 1 | 0 | 0 | 0 |
| Sudbury P.H.L. | 8 | 0 | 0 | 0 | 0 | 0 | 8 | 0 | 8 | 0 | 0 | 0 | 0 | 0 | 8 | 0 | 5 | 0 | 3 | 0 | 0 | 0 |
| Hamilton P.H.L. | 63 | 1 | 1 | 1 | 3 | 0 | 57 | 0 | 56 | 0 | 0 | 0 | 0 | 0 | 56 | 1 | 54 | 0 | 2 | 0 | 0 | 0 |
| Peterborough P.H.L. | 25 | 0 | 0 | 0 | 0 | 0 | 22 | 0 | 22 | 0 | 0 | 0 | 0 | 0 | 22 | 0 | 22 | 0 | 1 | 0 | 0 | 0 |
| Province of Ontario | 988 | 1 | 6 | 7 | 14 | 0 | 977 | 9 | 601 | 5 | 0 | 2 | 0 | 0 | 572 | 4 | 573 | 1 | 156 | 26 | 123 | 0 |
| Manitoba | 319 | 0 | 0 | 0 | 0 | 0 | 319 | 2 | 234 | 0 | 0 | 1 | 0 | 0 | 234 | 2 | 100 | 0 | 234 | 41 | 100 | 1 |
| Regina | 320 | 0 | 0 | 0 | 0 | 0 | 320 | 0 | 182 | 0 | 0 | 0 | 0 | 0 | 182 | 2 | 75 | 0 | 182 | 44 | 182 | 0 |
| Saskatoon | 144 | 0 | 0 | 0 | 0 | 0 | 144 | 1 | 144 | 1 | 0 | 0 | 1 | 0 | 144 | 4 | 144 | 0 | 144 | 38 | 144 | 0 |
| Province of Saskatchewan | 464 | 0 | 0 | 0 | 0 | 0 | 464 | 1 | 326 | 1 | 0 | 0 | 1 | 0 | 326 | 6 | 219 | 0 | 326 | 82 | 326 | 0 |
| Province of Alberta | 798 | 0 | 10 | 0 | 10 | 2 | 734 | 0 | 734 | 1 | 0 | 3 | 3 | 0 | 734 | 17 | 734 | 2 | 734 | 199 | 734 | 2 |
| Prairies | 1581 | 0 | 10 | 0 | 10 | 2 | 1517 | 3 | 1294 | 2 | 0 | 4 | 4 | 0 | 1294 | 25 | 1053 | 2 | 1294 | 322 | 1160 | 3 |
| British Columbia | 452 | 0 | 7 | 5 | 12 | 0 | 452 | 1 | 319 | 4 | 0 | 3 | 0 | 0 | 319 | 2 | 196 | 9 | 302 | 65 | 302 | 1 |
| Yukon | 31 | 0 | 2 | 0 | 2 | 0 | 31 | 0 | N.A. | N.A. | N.A. | N.A. | N.A. | N.A. | N.A. | N.A. | N.A. | N.A. | N.A. | N.A. | N.A. | N.A. |
| Northwest Territories | 16 | 0 | 0 | 0 | 0 | 0 | 16 | 0 | 16 | 0 | 0 | 0 | 0 | 0 | 16 | 0 | 16 | 0 | 16 | 11 | 16 | 1 |
| Nunavut | 5 | 0 | 0 | 0 | 0 | 0 | 5 | 0 | 5 | 0 | 1 | 0 | 0 | 0 | 5 | 1 | 5 | 0 | 5 | 2 | 5 | 0 |
| Territories | 52 | 0 | 2 | 0 | 2 | 0 | 52 | 0 | 21 | 0 | 1 | 0 | 0 | 0 | 21 | 1 | 21 | 0 | 21 | 13 | 21 | 1 |
| CANADA | 4153 | 2 | 26 | 26 | 54 | 4 | 4112 | 16 | 2982 | 20 | 2 | 9 | 4 | 0 | 2959 | 46 | 1993 | 12 | 1923 | 458 | 2274 | 8 |
Table 2 notes
|
||||||||||||||||||||||
Number of positive laboratory tests for other respiratory viruses
Figure 1: Number positive laboratory tests for other respiratory viruses by report week, Canada. 2019-20
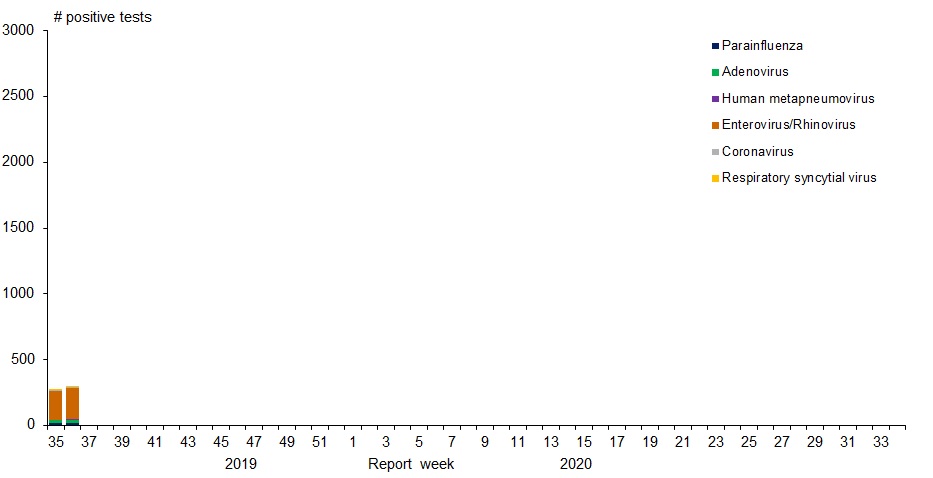
Figure 1: Number positive laboratory tests for other respiratory viruses by report week, Canada. 2019-20 - Text description
| Week | ParaInfluenza | Adenovirus | Human metapneumovirus | Enterovirus/Rhinovirus | Coronavirus | Respiratory syncytial virus |
|---|---|---|---|---|---|---|
| 35 | 16 | 24 | 2 | 222 | 5 | 8 |
| 36 | 19 | 22 | 10 | 236 | 3 | 8 |
Positive Influenza tests
Figure 2: Positive Influenza Tests (%) in Canada by Region by Week of Report
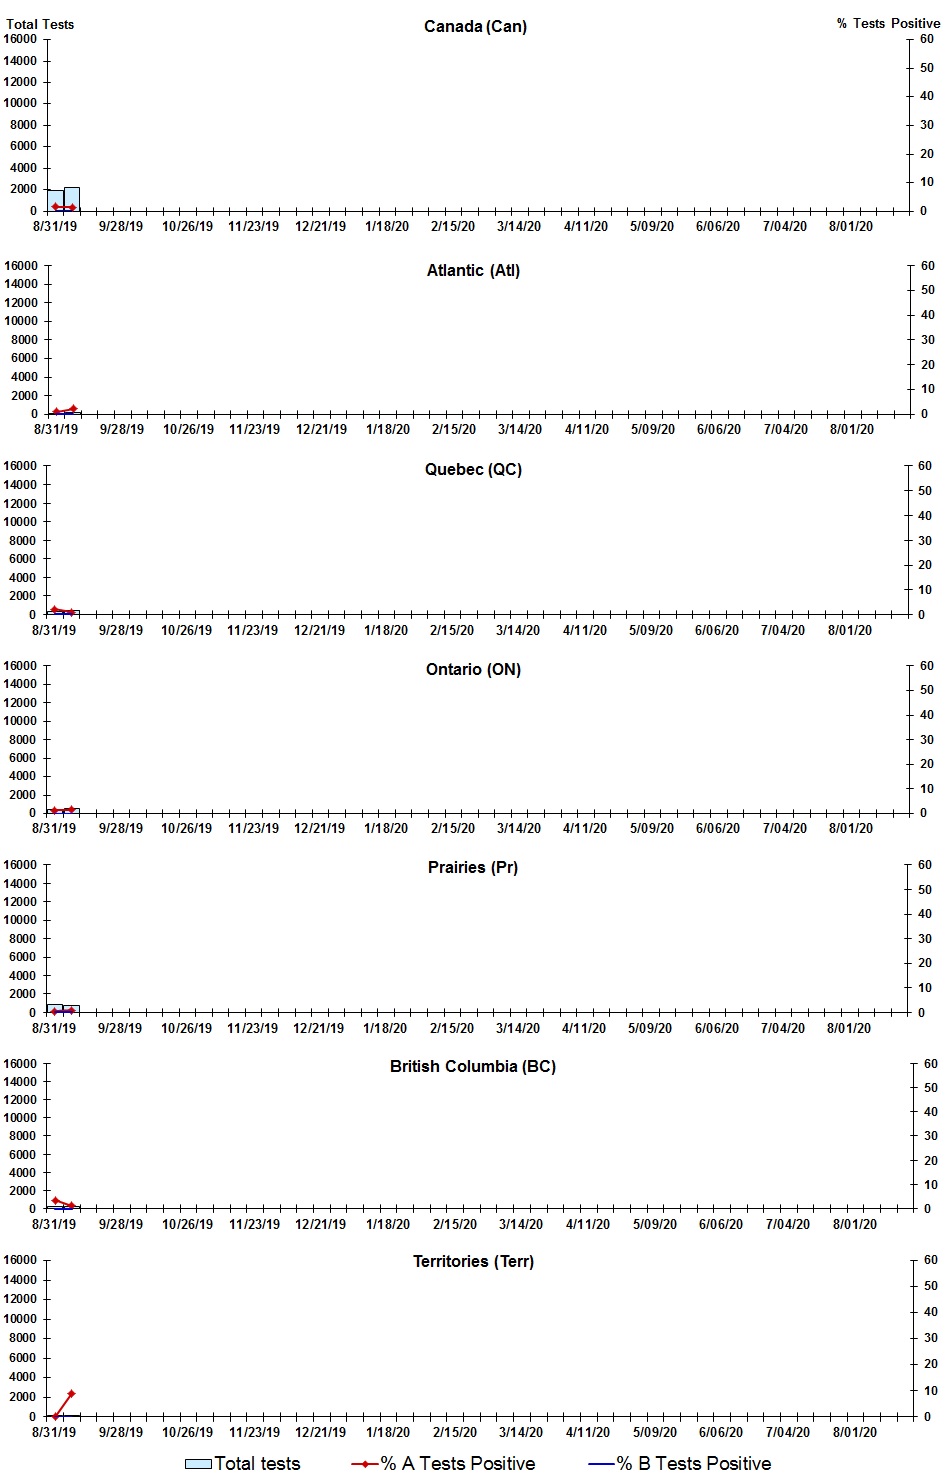
Figure 2: Positive Influenza Tests (%) in Canada by Region by Week of Report - Text description
| Week | Week end | Can Tests | Can A % |
Can B % |
Atl Tests | Atl A % |
Atl B % |
QC Tests | QC A % |
QC B % |
ON Tests | ON A % |
ON B % |
Pr Tests | Pr A % |
Pr B % |
BC Tests | BC A % |
BC B % |
Terr Tests | Terr A % |
Terr B % |
|---|---|---|---|---|---|---|---|---|---|---|---|---|---|---|---|---|---|---|---|---|---|---|
| 35 | 2019-08-31 | 1979 | 1.52 | 0.10 | 95 | 1.05 | 0.00 | 375 | 2.13 | 0.27 | 475 | 1.26 | 0.00 | 802 | 0.50 | 0.12 | 202 | 3.47 | 0.00 | 30 | 0 | 0 |
| 36 | 2019-09-07 | 2174 | 1.33 | 0.09 | 138 | 2.17 | 0.00 | 472 | 0.85 | 0.21 | 513 | 1.56 | 0.00 | 779 | 0.77 | 0.13 | 250 | 1.20 | 0.00 | 22 | 9.09 | 0 |
Positive Respiratory synctial virus tests
Figure 3: Positive Respiratory syncytial virus (RSV) Tests (%) in Canada by Region by Week of Report
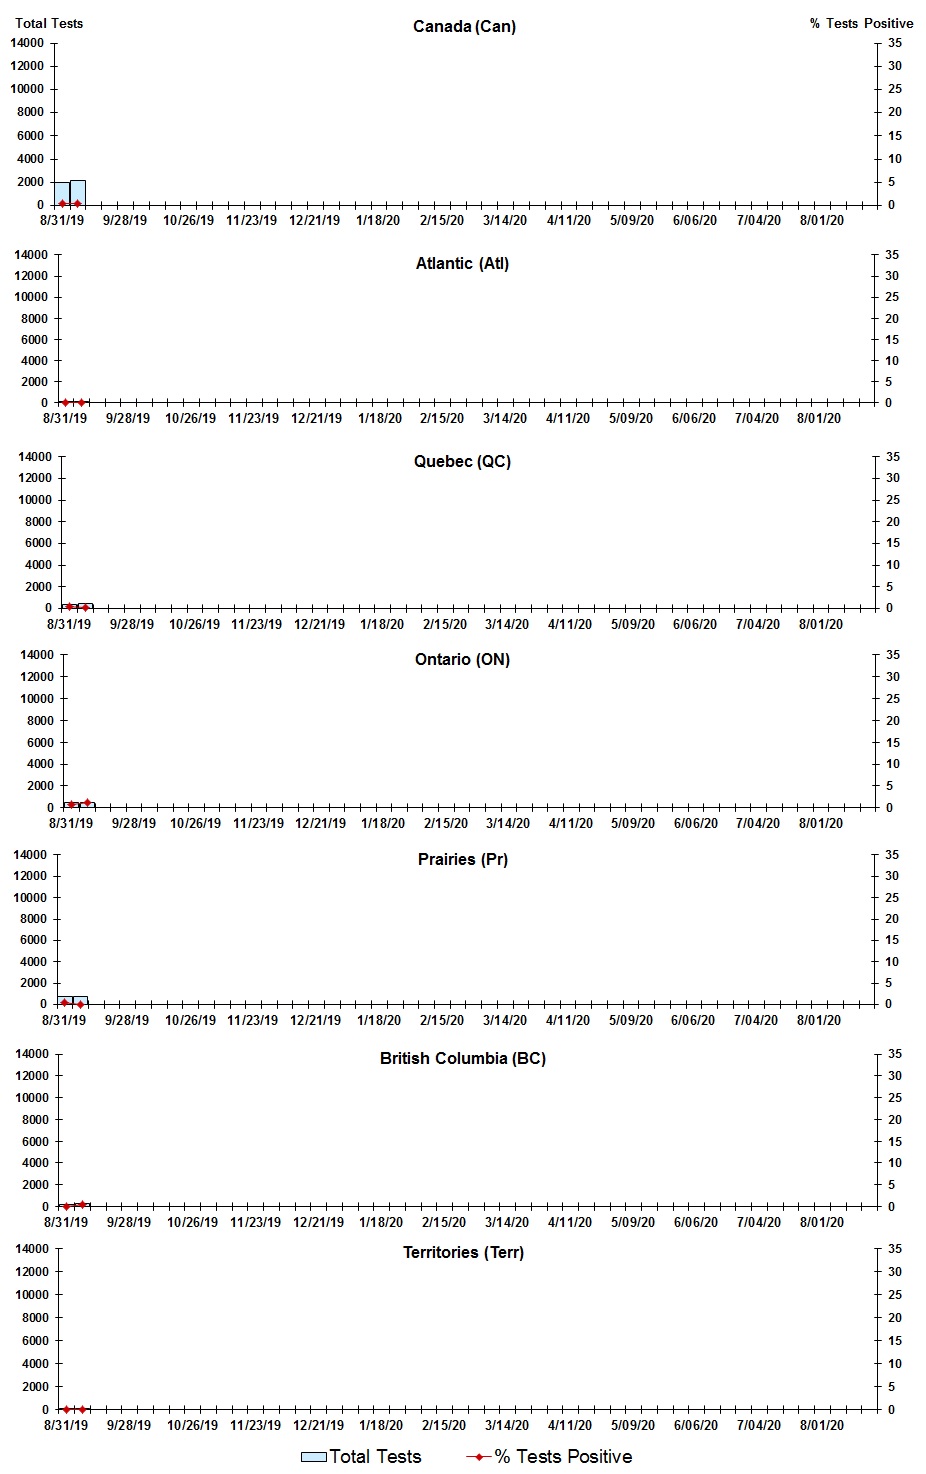
Figure 3: Positive Respiratory syncytial virus (RSV) Tests (%) in Canada by Region by Week of Report - Text description
| Week | Week end | Can Tests | RSV % |
Atl Tests | RSV % |
QC Tests | RSV % |
ON Tests | RSV % |
Pr Tests | RSV % |
BC Tests | RSV % |
Terr Tests | RSV % |
|---|---|---|---|---|---|---|---|---|---|---|---|---|---|---|---|
| 35 | 2019-08-31 | 1948 | 0.41 | 95 | 0 | 399 | 0.5 | 466 | 0.64 | 756 | 0.4 | 202 | 0 | 30 | 0 |
| 36 | 2019-09-07 | 2164 | 0.37 | 139 | 0 | 481 | 0.21 | 511 | 1.17 | 761 | 0 | 250 | 0.4 | 22 | 0 |
Positive Parainfluenza tests
Figure 4: Positive Parainfluenza (PIV) Tests (%) in Canada by Region by Week of Report
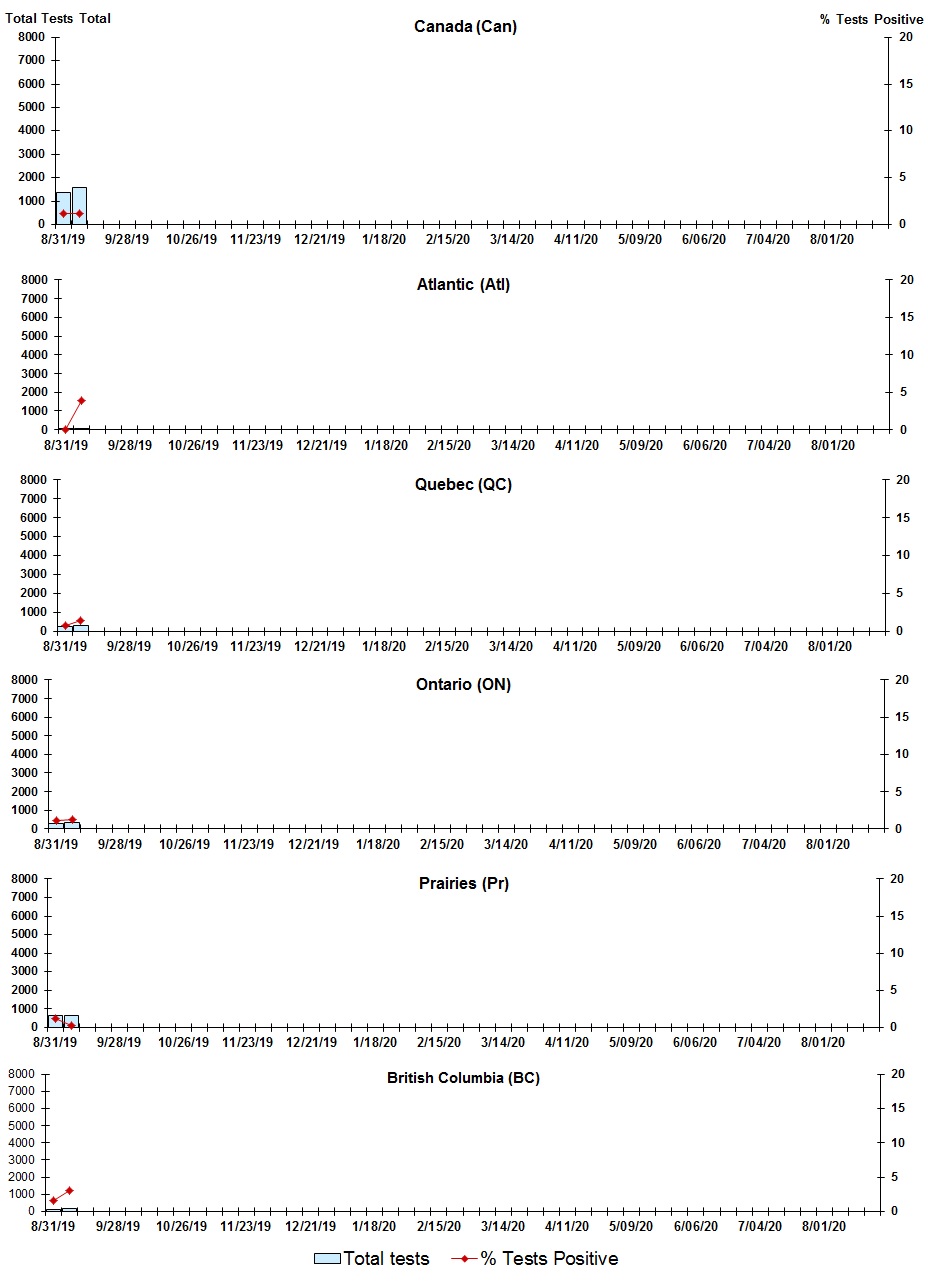
Figure 4: Positive Parainfluenza (PIV) Tests (%) in Canada by Region by Week of Report - Text description
| Week | Week End | Canada Tests | PIV % |
Atl Tests | PIV % |
QC Tests | PIV % |
ON Tests | PIV % |
Pr Tests | PIV % |
BC Tests | PIV % |
|---|---|---|---|---|---|---|---|---|---|---|---|---|---|
| 35 | 2019-08-31 | 1389 | 1.15 | 74 | 0 | 252 | 0.79 | 276 | 1.09 | 633 | 1.26 | 124 | 1.61 |
| 36 | 2019-09-07 | 1593 | 1.19 | 76 | 3.95 | 345 | 1.45 | 325 | 1.23 | 661 | 0.3 | 164 | 3.05 |
Positive Adenovirus tests
Figure 5: Positive Adenovirus (adeno) Tests (%) in Canada by Region by Week of Report
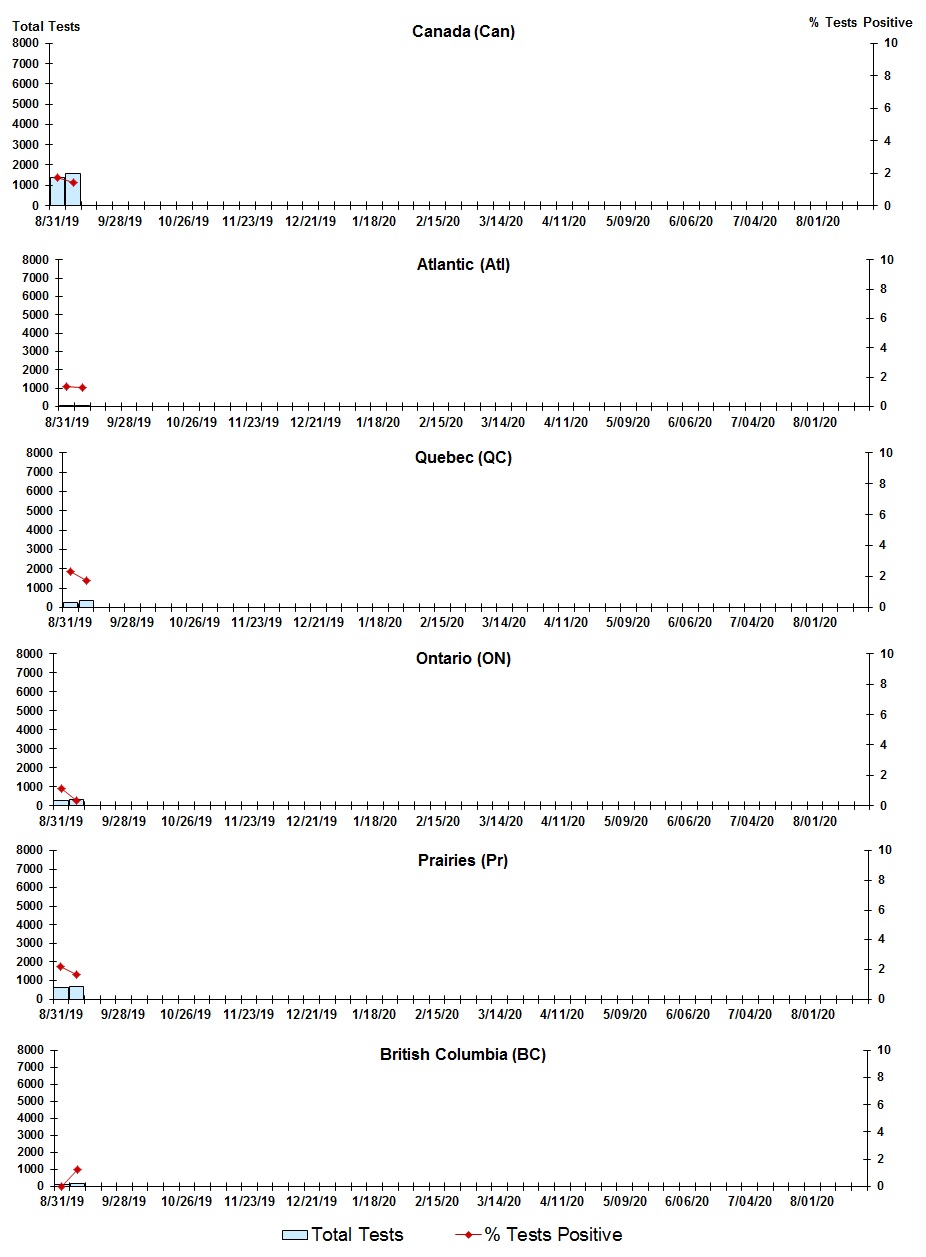
Figure 5: Positive Adenovirus (adeno) Tests (%) in Canada by Region by Week of Report - Text description
| Week | Week End | Can Tests | Adeno % |
Atl Tests | Adeno % |
QC Tests | Adeno % |
ON Tests | Adeno % |
Pr Tests | Adeno % |
BC Tests | Adeno % |
|---|---|---|---|---|---|---|---|---|---|---|---|---|---|
| 35 | 2019-08-31 | 1377 | 1.74 | 74 | 1.35 | 255 | 2.35 | 261 | 1.15 | 633 | 2.21 | 124 | 0 |
| 36 | 2019-09-07 | 1582 | 1.39 | 76 | 1.32 | 348 | 1.72 | 311 | 0.32 | 661 | 1.66 | 164 | 1.22 |
Positive Human metapneumovirus tests
Figure 6: Positive human metapneumovirus (hMPV) Tests (%) in Canada by Region by Week of Report
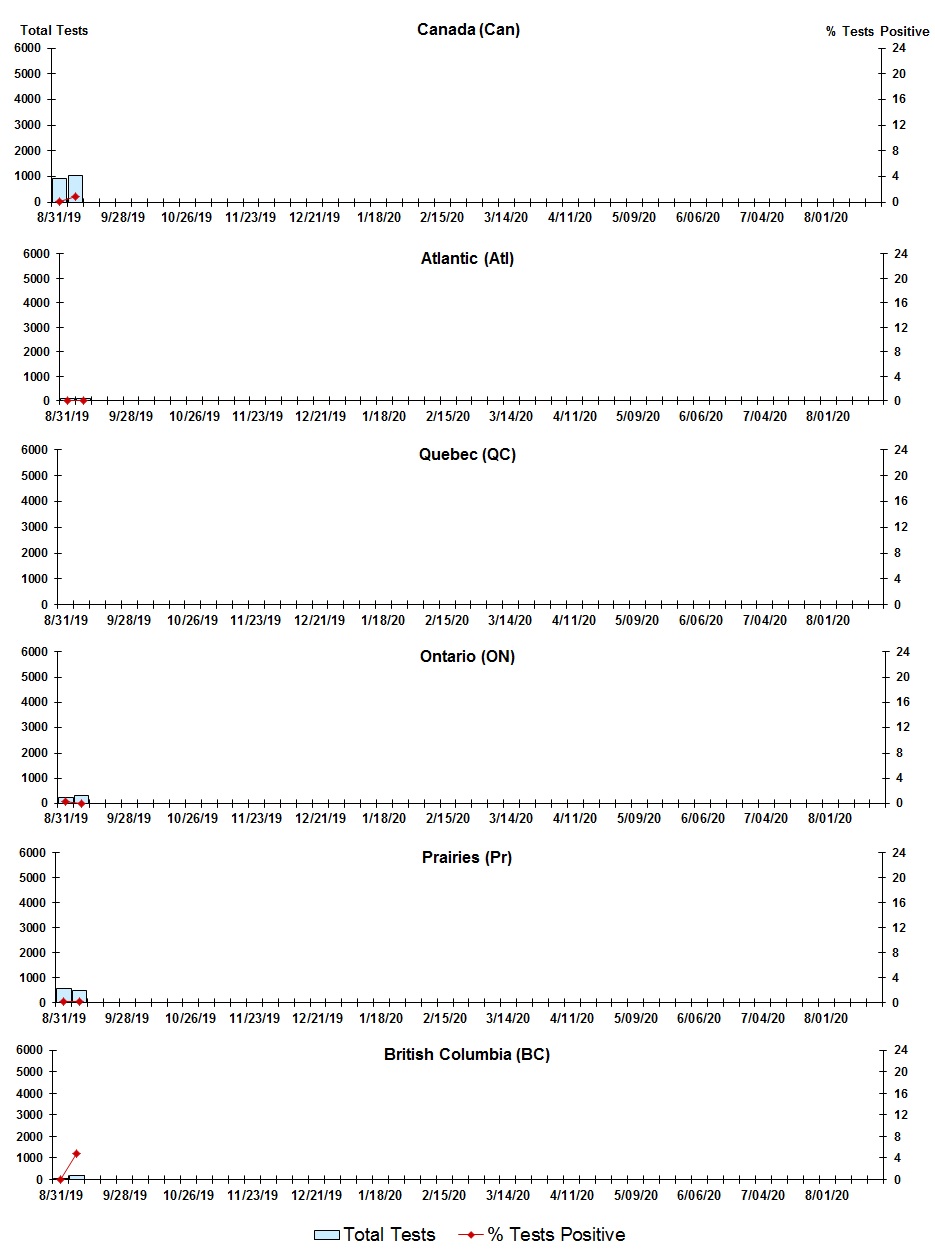
Figure 6: Positive human metapneumovirus (hMPV) Tests (%) in Canada by Region by Week of Report - Text description
| Week | Week End | Can Tests | hMPV % |
Atl Tests | hMPV % |
QC Tests | hMPV % |
ON Tests | hMPV % |
Pr Tests | hMPV % |
BC Tests | hMPV % |
|---|---|---|---|---|---|---|---|---|---|---|---|---|---|
| 35 | 2019-08-31 | 946 | 0.21 | 74 | 0.00 | N.A. | N.A. | 264 | 0.38 | 577 | 0.17 | 19 | 0 |
| 36 | 2019-09-07 | 1047 | 0.96 | 76 | 0.00 | N.A. | N.A. | 309 | 0 | 476 | 0.21 | 164 | 4.88 |
Positive Enterovirus/Rhinovirus tests
Figure 7: Positive Enterovirus/Rhinovirus (entero/rhino) Tests (%) in Canada by Region by Week of Report
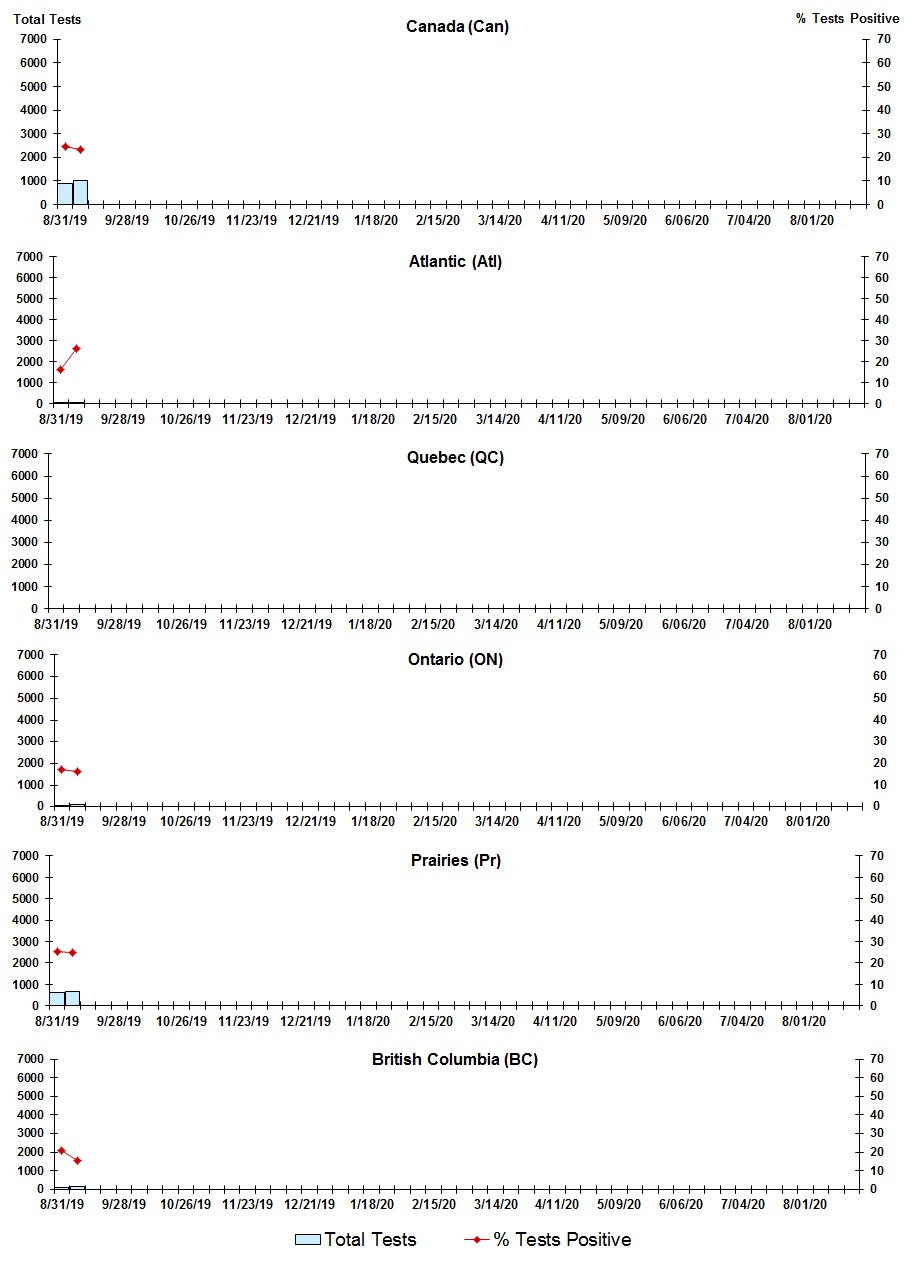
Figure 7: Positive Enterovirus/Rhinovirus (entero/rhino) Tests (%) in Canada by Region by Week of Report - Text description
| Week | Week End | Canada Tests | Entero/rhino % |
Atl Tests | Entero/rhino % |
QC Tests | Entero/rhino % |
ON Tests | Entero/rhino % |
Pr Tests | Entero/rhino % |
BC Tests | Entero/rhino % |
|---|---|---|---|---|---|---|---|---|---|---|---|---|---|
| 35 | 2019-08-31 | 905 | 24.53 | 74 | 16.22 | N.A. | N.A. | 52 | 17.31 | 633 | 25.12 | 116 | 20.69 |
| 36 | 2019-09-07 | 1018 | 23.18 | 76 | 26.32 | N.A. | N.A. | 104 | 16.35 | 661 | 24.66 | 155 | 15.48 |
Positive Coronovirus tests
Figure 8: Positive Coronavirus (coron) Tests (%) in Canada by Region by Week of Report
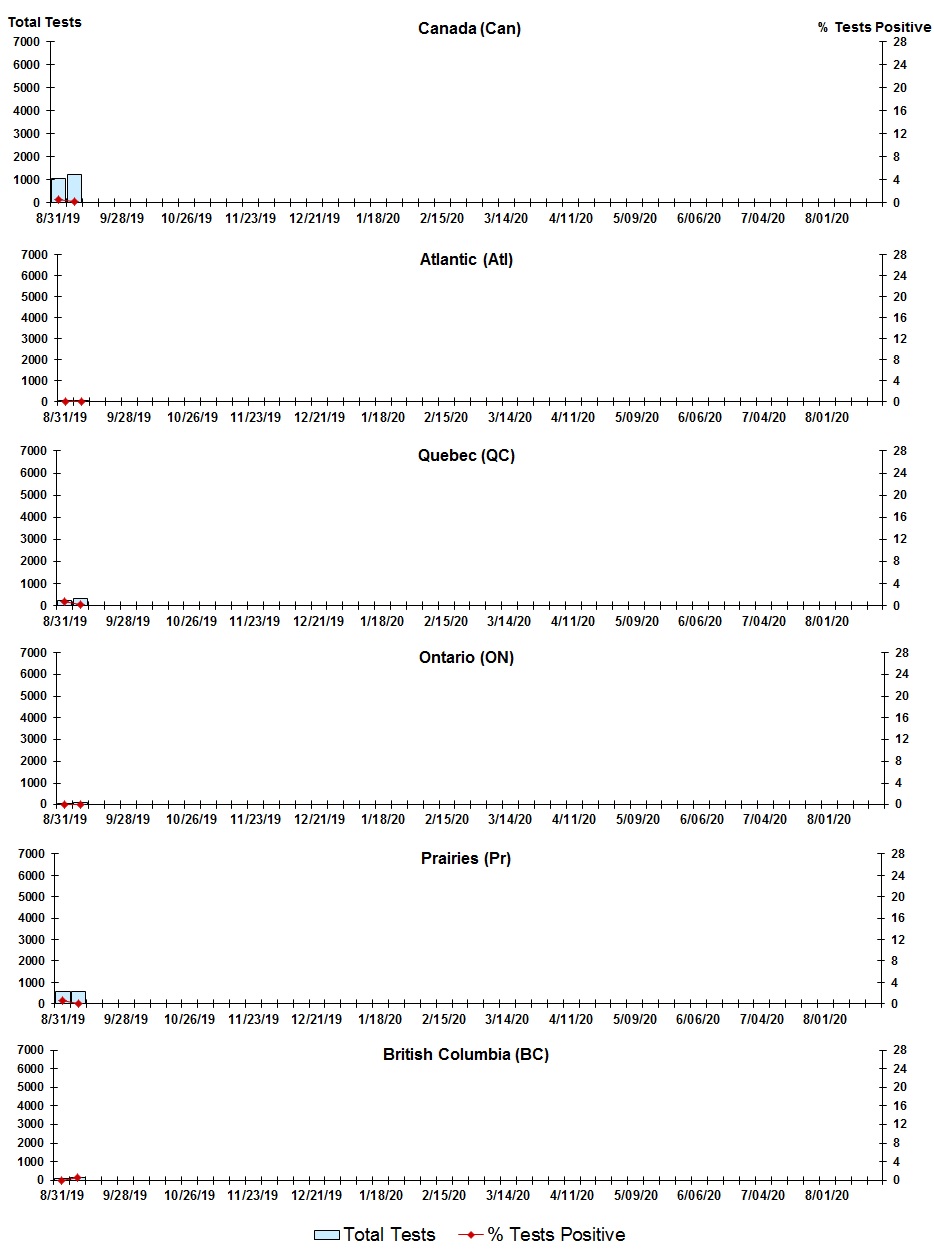
Figure 8: Positive Coronavirus (coron) Tests (%) in Canada by Region by Week of Report - Text description
| Week | Week End | Canada Tests | Coron % |
Atl Tests | Coron % |
QC Tests | Coron % |
ON Tests | Coron % |
Pr Tests | Coron % |
BC Tests | Coron % |
|---|---|---|---|---|---|---|---|---|---|---|---|---|---|
| 35 | 2019-08-31 | 1043 | 0.48 | 38 | 0 | 246 | 0.81 | 36 | 0 | 577 | 0.52 | 116 | 0 |
| 36 | 2019-09-07 | 1231 | 0.24 | 46 | 0 | 338 | 0.3 | 87 | 0 | 583 | 0 | 155 | 0.65 |
Page details
- Date modified: