
Respiratory Virus Report, week 37 ending September 14, 2019
Download the alternative format
(PDF format, 1.1 MB, 11 pages)
Organization: Public Health Agency of Canada
On this page
- List of abbreviations
- Respiratory Virus Detections and Isolations
- Number of positive laboratory tests for other respiratory viruses
- Positive Influenza tests
- Positive Respiratory synctial virus tests
- Positive Parainfluenza tests
- Positive Adenovirus tests
- Positive Human metapneumovirus tests
- Positive Enterovirus/Rhinovirus tests
- Positive Coronovirus tests
List of abbreviations
- A(H1N1)pdm09
- Influenza A(H1N1)pdm09
- A(H3)
- Influenza A(H3N2)
- A (UnS)
- Influenza A (Unsubtyped)
- Adeno
- Adenovirus
- CHEO
- Children's Hospital of Eastern Ontario
- Coron
- Coronavirus
- Entero
- Enterovirus
- hMPV
- human metapneumovirus
- HSC
- Health Sciences Centre
- N.A
- Not Applicable
- P.H.L.
- Public Health Laboratory
- P.H.O.L.
- Public Health Ontario Laboratory
- PIV
- Parainfluenza
- Rhino
- Rhinovirus
- RSV
- Respiratory syncytial virus
- UHN
- University Health Network
Respiratory Virus Detections and Isolations
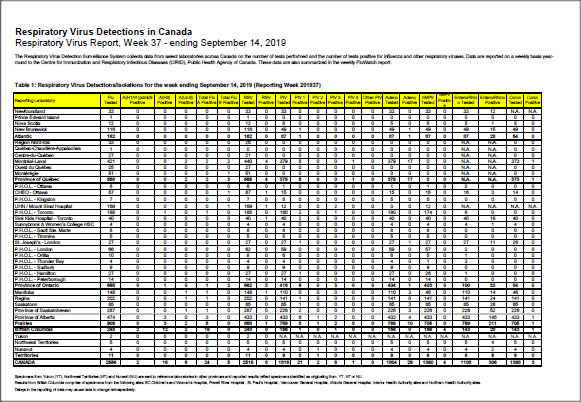
Table 1: Respiratory Virus Detections/Isolations for the week ending September 14, 2019 (Reporting Week 201937)
| Reporting Laboratory | Flu Tested | A(H1N1)pdm09 Positive | A(H3) Positive | A(UnS) Positive | Total Flu A Positive | Total Flu B Positive | RSV Tested | RSV Positive | PIV Tested | PIV 1 Positive | PIV 2 Positive | PIV 3 Positive | PIV 4 Positive | Other PIV Positive | Adeno Tested | Adeno Positive | hMPV Tested | hMPV Positive | Entero/Rhino Tested | Entero/Rhino Positive | Coron Tested | Coron Positive |
|---|---|---|---|---|---|---|---|---|---|---|---|---|---|---|---|---|---|---|---|---|---|---|
| Newfoundland | 33 | 0 | 0 | 0 | 0 | 0 | 33 | 0 | 33 | 0 | 0 | 0 | 0 | 0 | 33 | 0 | 33 | 0 | 33 | 12 | N.A. | N.A. |
| Prince Edward Island | 1 | 0 | 0 | 0 | 0 | 0 | 1 | 0 | 0 | 0 | 0 | 0 | 0 | 0 | 0 | 0 | 0 | 0 | 0 | 0 | 0 | 0 |
| Nova Scotia | 12 | 0 | 0 | 0 | 0 | 0 | 12 | 0 | 5 | 0 | 0 | 0 | 0 | 0 | 5 | 0 | 5 | 0 | 5 | 1 | 5 | 0 |
| New Brunswick | 116 | 0 | 0 | 0 | 0 | 0 | 116 | 0 | 49 | 1 | 0 | 0 | 0 | 0 | 49 | 1 | 49 | 0 | 49 | 15 | 49 | 0 |
| Atlantic | 162 | 0 | 0 | 0 | 0 | 0 | 162 | 0 | 87 | 1 | 0 | 0 | 0 | 0 | 87 | 1 | 87 | 0 | 87 | 28 | 54 | 0 |
| Région Nord-Est | 33 | 0 | 0 | 0 | 0 | 0 | 26 | 0 | 0 | 0 | 0 | 0 | 0 | 0 | 0 | 0 | 0 | 0 | N.A. | N.A. | 0 | 0 |
| Québec-Chaudière-Appalaches | 1 | 0 | 0 | 0 | 0 | 0 | 0 | 0 | 0 | 0 | 0 | 0 | 0 | 0 | 0 | 0 | 0 | 0 | N.A. | N.A. | 0 | 0 |
| Centre-du-Québec | 27 | 0 | 0 | 0 | 0 | 0 | 21 | 0 | 0 | 0 | 0 | 0 | 0 | 0 | 0 | 0 | 0 | 0 | N.A. | N.A. | 0 | 0 |
| Montréal-Laval | 421 | 0 | 0 | 2 | 2 | 2 | 440 | 4 | 379 | 5 | 0 | 0 | 1 | 0 | 379 | 17 | 0 | 0 | N.A. | N.A. | 373 | 1 |
| Ouest du Québec | 25 | 0 | 0 | 0 | 0 | 0 | 27 | 0 | 0 | 0 | 0 | 0 | 0 | 0 | 0 | 0 | 0 | 0 | N.A. | N.A. | 0 | 0 |
| Montérégie | 51 | 0 | 0 | 0 | 0 | 1 | 51 | 0 | 0 | 0 | 0 | 0 | 0 | 0 | 0 | 0 | 0 | 0 | N.A. | N.A. | 0 | 0 |
| Province of Québec | 558 | 0 | 0 | 2 | 2 | 3 | 565 | 4 | 379 | 5 | 0 | 0 | 1 | 0 | 379 | 17 | 0 | 0 | N.A. | N.A. | 373 | 1 |
| Ottawa P.H.L. | 6 | 0 | 0 | 0 | 0 | 0 | 6 | 0 | 1 | 0 | 0 | 0 | 0 | 0 | 1 | 0 | 1 | 0 | 0 | 0 | 0 | 0 |
| CHEO - Ottawa | 87 | 0 | 0 | 0 | 0 | 1 | 87 | 1 | 15 | 0 | 0 | 0 | 0 | 0 | 15 | 0 | 15 | 0 | 16 | 3 | 14 | 0 |
| Kingston P.H.L. | 7 | 0 | 0 | 0 | 0 | 0 | 7 | 0 | 5 | 0 | 0 | 0 | 0 | 0 | 5 | 0 | 5 | 0 | 0 | 0 | 0 | 0 |
| UHN / Mount Sinai Hospital | 169 | 0 | 0 | 0 | 0 | 1 | 169 | 1 | 12 | 0 | 0 | 2 | 0 | 0 | 0 | 0 | 12 | 0 | N.A. | N.A. | N.A. | N.A. |
| P.H.O.L. - Toronto | 185 | 0 | 1 | 0 | 1 | 0 | 185 | 0 | 180 | 2 | 0 | 1 | 0 | 0 | 180 | 0 | 174 | 0 | 6 | 0 | 0 | 0 |
| Sick Kids Hospital - Toronto | 40 | 0 | 0 | 0 | 0 | 0 | 40 | 1 | 40 | 2 | 0 | 0 | 0 | 0 | 40 | 0 | 40 | 0 | 40 | 18 | 40 | 0 |
| Sunnybrook & Women's College HSC | 4 | 0 | 0 | 0 | 0 | 0 | 4 | 0 | 4 | 0 | 0 | 0 | 0 | 0 | 4 | 0 | 4 | 0 | 4 | 1 | 4 | 0 |
| Sault Ste. Marie P.H.L. | 8 | 0 | 0 | 0 | 0 | 0 | 8 | 0 | 8 | 0 | 0 | 0 | 0 | 0 | 8 | 0 | 8 | 0 | 0 | 0 | 0 | 0 |
| Timmins P.H.L. | 5 | 0 | 0 | 0 | 0 | 0 | 5 | 0 | 5 | 0 | 0 | 0 | 0 | 0 | 5 | 0 | 5 | 0 | 0 | 0 | 0 | 0 |
| St. Joseph's - London | 27 | 0 | 0 | 0 | 0 | 0 | 27 | 0 | 27 | 1 | 0 | 0 | 0 | 0 | 27 | 1 | 27 | 0 | 27 | 11 | 26 | 0 |
| London P.H.L. | 66 | 0 | 0 | 0 | 0 | 0 | 62 | 0 | 59 | 0 | 0 | 0 | 0 | 0 | 59 | 0 | 57 | 0 | 2 | 0 | 0 | 0 |
| Orillia P.H.L. | 10 | 0 | 0 | 0 | 0 | 0 | 8 | 0 | 6 | 0 | 0 | 0 | 0 | 0 | 6 | 0 | 5 | 0 | 1 | 0 | 0 | 0 |
| Thunder Bay P.H.L. | 4 | 0 | 0 | 0 | 0 | 0 | 4 | 0 | 4 | 0 | 0 | 0 | 0 | 0 | 4 | 0 | 1 | 0 | 3 | 0 | 0 | 0 |
| Sudbury P.H.L. | 9 | 0 | 0 | 0 | 0 | 0 | 9 | 0 | 9 | 0 | 0 | 0 | 0 | 0 | 9 | 0 | 9 | 0 | 0 | 0 | 0 | 0 |
| Hamilton P.H.L. | 27 | 0 | 0 | 0 | 0 | 0 | 27 | 0 | 27 | 1 | 0 | 0 | 0 | 0 | 27 | 0 | 26 | 0 | 1 | 0 | 0 | 0 |
| Peterborough P.H.L. | 14 | 0 | 0 | 0 | 0 | 0 | 14 | 0 | 14 | 0 | 0 | 0 | 0 | 0 | 14 | 0 | 14 | 0 | 0 | 0 | 0 | 0 |
| Province of Ontario | 668 | 0 | 1 | 0 | 1 | 2 | 662 | 3 | 416 | 6 | 0 | 3 | 0 | 0 | 404 | 1 | 403 | 0 | 100 | 33 | 84 | 0 |
| Manitoba | 148 | 0 | 0 | 1 | 1 | 0 | 148 | 1 | 110 | 0 | 0 | 0 | 0 | 0 | 110 | 3 | 46 | 0 | 110 | 14 | 46 | 0 |
| Regina | 202 | 0 | 0 | 1 | 1 | 0 | 202 | 0 | 141 | 1 | 0 | 0 | 0 | 0 | 141 | 0 | 141 | 0 | 141 | 24 | 141 | 0 |
| Saskatoon | 85 | 0 | 0 | 0 | 0 | 0 | 85 | 0 | 85 | 1 | 0 | 0 | 0 | 0 | 85 | 3 | 85 | 0 | 85 | 28 | 85 | 0 |
| Province of Saskatchewan | 287 | 0 | 0 | 1 | 1 | 0 | 287 | 0 | 226 | 2 | 0 | 0 | 0 | 0 | 226 | 3 | 226 | 0 | 226 | 52 | 226 | 0 |
| Province of Alberta | 474 | 0 | 3 | 0 | 3 | 0 | 433 | 0 | 433 | 6 | 1 | 2 | 0 | 0 | 433 | 4 | 433 | 0 | 433 | 145 | 433 | 1 |
| Prairies | 909 | 0 | 3 | 2 | 5 | 0 | 868 | 1 | 769 | 8 | 1 | 2 | 0 | 0 | 769 | 10 | 705 | 0 | 769 | 211 | 705 | 1 |
| British Columbia | 248 | 2 | 12 | 2 | 16 | 0 | 248 | 0 | 156 | 1 | 0 | 1 | 0 | 0 | 156 | 0 | 156 | 4 | 143 | 28 | 143 | 1 |
| Yukon | 2 | 0 | 0 | 0 | 0 | 0 | 2 | 0 | N.A. | N.A. | N.A. | N.A. | N.A. | N.A. | N.A. | N.A. | N.A. | N.A. | N.A. | N.A. | N.A. | N.A. |
| Northwest Territories | 5 | 0 | 0 | 0 | 0 | 0 | 5 | 0 | 5 | 0 | 0 | 0 | 0 | 0 | 5 | 0 | 5 | 0 | 5 | 4 | 5 | 0 |
| Nunavut | 4 | 0 | 0 | 0 | 0 | 0 | 4 | 0 | 4 | 0 | 1 | 0 | 0 | 0 | 4 | 0 | 4 | 0 | 4 | 2 | 4 | 0 |
| Territories | 11 | 0 | 0 | 0 | 0 | 0 | 11 | 0 | 9 | 0 | 1 | 0 | 0 | 0 | 9 | 0 | 9 | 0 | 9 | 6 | 9 | 0 |
| CANADA | 2556 | 2 | 16 | 6 | 24 | 5 | 2516 | 8 | 1816 | 21 | 2 | 6 | 1 | 0 | 1804 | 29 | 1360 | 4 | 1108 | 306 | 1368 | 3 |
Table 1 notes
|
||||||||||||||||||||||
Table 2: Respiratory Virus Detections/Isolations for the period August 31, 2019 - September 14, 2019 (Reporting Weeks 201935-201937)
| Reporting Laboratory | Flu Tested | A(H1N1)pdm09 Positive | A(H3) Positive | A(UnS) Positive | Total Flu A Positive | Total Flu B Positive | RSV Tested | RSV Positive | PIV Tested | PIV 1 Positive | PIV 2 Positive | PIV 3 Positive | PIV 4 Positive | Other PIV Positive | Adeno Tested | Adeno Positive | hMPV Tested | hMPV Positive | Entero/Rhino Tested | Entero/Rhino Positive | Coron Tested | Coron Positive |
|---|---|---|---|---|---|---|---|---|---|---|---|---|---|---|---|---|---|---|---|---|---|---|
| Newfoundland | 99 | 0 | 0 | 0 | 0 | 0 | 99 | 0 | 99 | 2 | 0 | 0 | 0 | 0 | 99 | 0 | 99 | 0 | 99 | 22 | N.A. | N.A. |
| Prince Edward Island | 2 | 0 | 0 | 0 | 0 | 0 | 2 | 0 | 1 | 0 | 0 | 0 | 0 | 0 | 1 | 0 | 1 | 0 | 1 | 0 | 1 | 0 |
| Nova Scotia | 31 | 0 | 0 | 0 | 0 | 0 | 32 | 0 | 14 | 0 | 0 | 0 | 0 | 0 | 14 | 0 | 14 | 0 | 14 | 1 | 14 | 0 |
| New Brunswick | 263 | 1 | 1 | 2 | 4 | 0 | 263 | 0 | 123 | 2 | 0 | 0 | 0 | 0 | 123 | 3 | 123 | 0 | 123 | 37 | 123 | 0 |
| Atlantic | 395 | 1 | 1 | 2 | 4 | 0 | 396 | 0 | 237 | 4 | 0 | 0 | 0 | 0 | 237 | 3 | 237 | 0 | 237 | 60 | 138 | 0 |
| Région Nord-Est | 68 | 0 | 0 | 0 | 0 | 0 | 61 | 0 | 0 | 0 | 0 | 0 | 0 | 0 | 0 | 0 | 0 | 0 | N.A. | N.A. | 0 | 0 |
| Québec-Chaudière-Appalaches | 77 | 0 | 0 | 0 | 0 | 0 | 108 | 0 | 118 | 1 | 0 | 0 | 0 | 0 | 124 | 3 | 0 | 0 | N.A. | N.A. | 113 | 0 |
| Centre-du-Québec | 57 | 0 | 0 | 1 | 1 | 0 | 47 | 0 | 0 | 0 | 0 | 0 | 0 | 0 | 0 | 0 | 0 | 0 | N.A. | N.A. | 0 | 0 |
| Montréal-Laval | 1002 | 0 | 0 | 8 | 8 | 4 | 1028 | 6 | 858 | 10 | 1 | 0 | 1 | 0 | 858 | 26 | 0 | 0 | N.A. | N.A. | 844 | 4 |
| Ouest du Québec | 92 | 0 | 0 | 2 | 2 | 0 | 94 | 1 | 0 | 0 | 0 | 0 | 0 | 0 | 0 | 0 | 0 | 0 | N.A. | N.A. | 0 | 0 |
| Montérégie | 109 | 0 | 0 | 3 | 3 | 1 | 107 | 0 | 0 | 0 | 0 | 0 | 0 | 0 | 0 | 0 | 0 | 0 | N.A. | N.A. | 0 | 0 |
| Province of Québec | 1405 | 0 | 0 | 14 | 14 | 5 | 1445 | 7 | 976 | 11 | 1 | 0 | 1 | 0 | 982 | 29 | 0 | 0 | N.A. | N.A. | 957 | 4 |
| Ottawa P.H.L. | 27 | 0 | 0 | 0 | 0 | 0 | 25 | 0 | 20 | 0 | 0 | 0 | 0 | 0 | 20 | 0 | 19 | 0 | 1 | 0 | 0 | 0 |
| CHEO - Ottawa | 221 | 0 | 0 | 1 | 1 | 1 | 221 | 4 | 54 | 0 | 0 | 0 | 0 | 0 | 54 | 0 | 54 | 0 | 55 | 13 | 53 | 0 |
| Kingston P.H.L. | 17 | 0 | 0 | 0 | 0 | 0 | 17 | 0 | 15 | 0 | 0 | 0 | 0 | 0 | 15 | 0 | 15 | 0 | 0 | 0 | 0 | 0 |
| UHN / Mount Sinai Hospital | 454 | 0 | 0 | 5 | 5 | 1 | 454 | 4 | 41 | 0 | 0 | 2 | 0 | 0 | 0 | 0 | 41 | 1 | N.A. | N.A. | N.A. | N.A. |
| P.H.O.L. - Toronto | 494 | 0 | 6 | 0 | 6 | 0 | 494 | 1 | 478 | 7 | 0 | 2 | 0 | 0 | 478 | 3 | 455 | 0 | 29 | 0 | 0 | 0 |
| Sick Kids Hospital - Toronto | 82 | 0 | 0 | 0 | 0 | 0 | 82 | 2 | 82 | 3 | 0 | 0 | 0 | 0 | 82 | 0 | 82 | 0 | 82 | 27 | 82 | 0 |
| Sunnybrook & Women's College HSC | 15 | 0 | 0 | 0 | 0 | 0 | 15 | 0 | 15 | 0 | 0 | 0 | 0 | 0 | 15 | 0 | 15 | 0 | 15 | 1 | 15 | 0 |
| Sault Ste. Marie P.H.L. | 10 | 0 | 0 | 0 | 0 | 0 | 10 | 0 | 10 | 0 | 0 | 0 | 0 | 0 | 10 | 0 | 10 | 0 | 0 | 0 | 0 | 0 |
| Timmins P.H.L. | 5 | 0 | 0 | 0 | 0 | 0 | 5 | 0 | 5 | 0 | 0 | 0 | 0 | 0 | 5 | 0 | 5 | 0 | 0 | 0 | 0 | 0 |
| St. Joseph's - London | 60 | 0 | 0 | 0 | 0 | 0 | 60 | 1 | 60 | 1 | 0 | 0 | 0 | 0 | 60 | 1 | 60 | 0 | 58 | 17 | 57 | 0 |
| London P.H.L. | 99 | 0 | 0 | 0 | 0 | 0 | 95 | 0 | 92 | 0 | 0 | 0 | 0 | 0 | 92 | 0 | 86 | 0 | 6 | 0 | 0 | 0 |
| Orillia P.H.L. | 15 | 0 | 0 | 0 | 0 | 0 | 13 | 0 | 11 | 0 | 0 | 0 | 0 | 0 | 11 | 0 | 10 | 0 | 1 | 0 | 0 | 0 |
| Thunder Bay P.H.L. | 11 | 0 | 0 | 0 | 0 | 0 | 11 | 0 | 11 | 0 | 0 | 1 | 0 | 0 | 11 | 0 | 7 | 0 | 4 | 0 | 0 | 0 |
| Sudbury P.H.L. | 18 | 0 | 0 | 0 | 0 | 0 | 18 | 0 | 18 | 0 | 0 | 0 | 0 | 0 | 18 | 0 | 14 | 0 | 4 | 0 | 0 | 0 |
| Hamilton P.H.L. | 90 | 1 | 2 | 0 | 3 | 0 | 84 | 0 | 83 | 1 | 0 | 0 | 0 | 0 | 83 | 1 | 80 | 0 | 3 | 0 | 0 | 0 |
| Peterborough P.H.L. | 39 | 0 | 0 | 0 | 0 | 0 | 36 | 0 | 36 | 0 | 0 | 0 | 0 | 0 | 36 | 0 | 36 | 0 | 3 | 0 | 0 | 0 |
| Province of Ontario | 1657 | 1 | 8 | 6 | 15 | 2 | 1640 | 12 | 1031 | 12 | 0 | 5 | 0 | 0 | 990 | 5 | 989 | 1 | 261 | 58 | 207 | 0 |
| Manitoba | 467 | 0 | 0 | 1 | 1 | 0 | 467 | 3 | 344 | 0 | 0 | 1 | 0 | 0 | 344 | 5 | 146 | 0 | 344 | 55 | 146 | 1 |
| Regina | 522 | 0 | 0 | 1 | 1 | 0 | 522 | 0 | 323 | 1 | 0 | 0 | 0 | 0 | 323 | 2 | 216 | 0 | 323 | 68 | 323 | 0 |
| Saskatoon | 229 | 0 | 0 | 0 | 0 | 0 | 229 | 1 | 229 | 2 | 0 | 0 | 1 | 0 | 229 | 7 | 229 | 0 | 229 | 66 | 229 | 0 |
| Province of Saskatchewan | 751 | 0 | 0 | 1 | 1 | 0 | 751 | 1 | 552 | 3 | 0 | 0 | 1 | 0 | 552 | 9 | 445 | 0 | 552 | 134 | 552 | 0 |
| Province of Alberta | 1301 | 0 | 13 | 0 | 13 | 2 | 1189 | 0 | 1189 | 7 | 1 | 5 | 5 | 0 | 1189 | 22 | 1189 | 3 | 1189 | 349 | 1189 | 3 |
| Prairies | 2519 | 0 | 13 | 2 | 15 | 2 | 2407 | 4 | 2085 | 10 | 1 | 6 | 6 | 0 | 2085 | 36 | 1780 | 3 | 2085 | 538 | 1887 | 4 |
| British Columbia | 700 | 2 | 21 | 5 | 26 | 0 | 700 | 1 | 481 | 5 | 0 | 4 | 0 | 0 | 481 | 2 | 481 | 13 | 451 | 93 | 451 | 2 |
| Yukon | 33 | 0 | 2 | 0 | 2 | 0 | 33 | 0 | N.A. | N.A. | N.A. | N.A. | N.A. | N.A. | N.A. | N.A. | N.A. | N.A. | N.A. | N.A. | N.A. | N.A. |
| Northwest Territories | 25 | 0 | 0 | 0 | 0 | 0 | 25 | 0 | 25 | 0 | 0 | 0 | 0 | 0 | 25 | 0 | 25 | 0 | 25 | 18 | 25 | 1 |
| Nunavut | 9 | 0 | 0 | 0 | 0 | 0 | 9 | 0 | 9 | 0 | 2 | 0 | 0 | 0 | 9 | 1 | 9 | 0 | 9 | 4 | 9 | 0 |
| Territories | 67 | 0 | 2 | 0 | 2 | 0 | 67 | 0 | 34 | 0 | 2 | 0 | 0 | 0 | 34 | 1 | 34 | 0 | 34 | 22 | 34 | 1 |
| CANADA | 6743 | 4 | 45 | 29 | 76 | 9 | 6655 | 24 | 4844 | 42 | 4 | 15 | 7 | 0 | 4809 | 76 | 3521 | 17 | 3068 | 771 | 3674 | 11 |
Table 2 notes
|
||||||||||||||||||||||
Number of positive laboratory tests for other respiratory viruses
Figure 1: Number positive laboratory tests for other respiratory viruses by report week, Canada. 2019-20
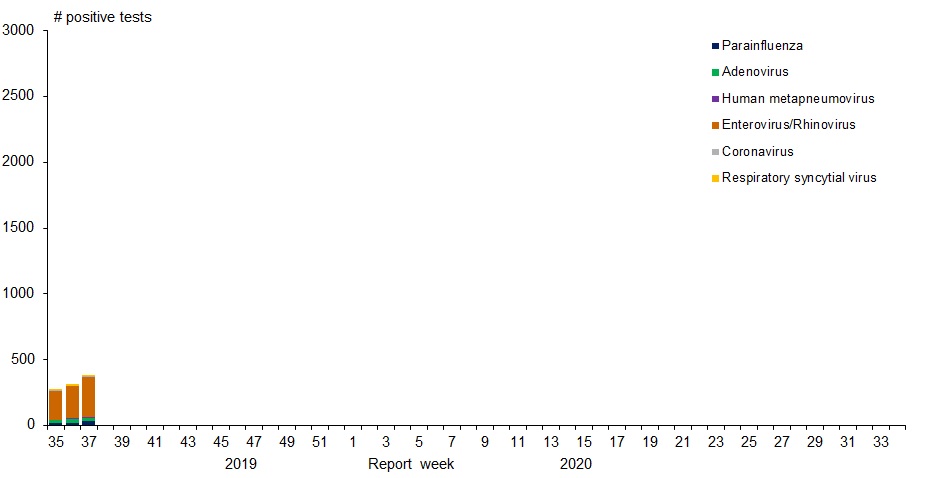
Figure 1: Number positive laboratory tests for other respiratory viruses by report week, Canada. 2019-20 - Text description
| Week | ParaInfluenza | Adenovirus | Human metapneumovirus | Enterovirus/Rhinovirus | Coronavirus | Respiratory syncytial virus |
|---|---|---|---|---|---|---|
| 35 | 16 | 24 | 2 | 221 | 5 | 8 |
| 36 | 22 | 23 | 11 | 244 | 3 | 8 |
| 37 | 30 | 29 | 4 | 306 | 3 | 8 |
Positive Influenza tests
Figure 2: Positive Influenza Tests (%) in Canada by Region by Week of Report
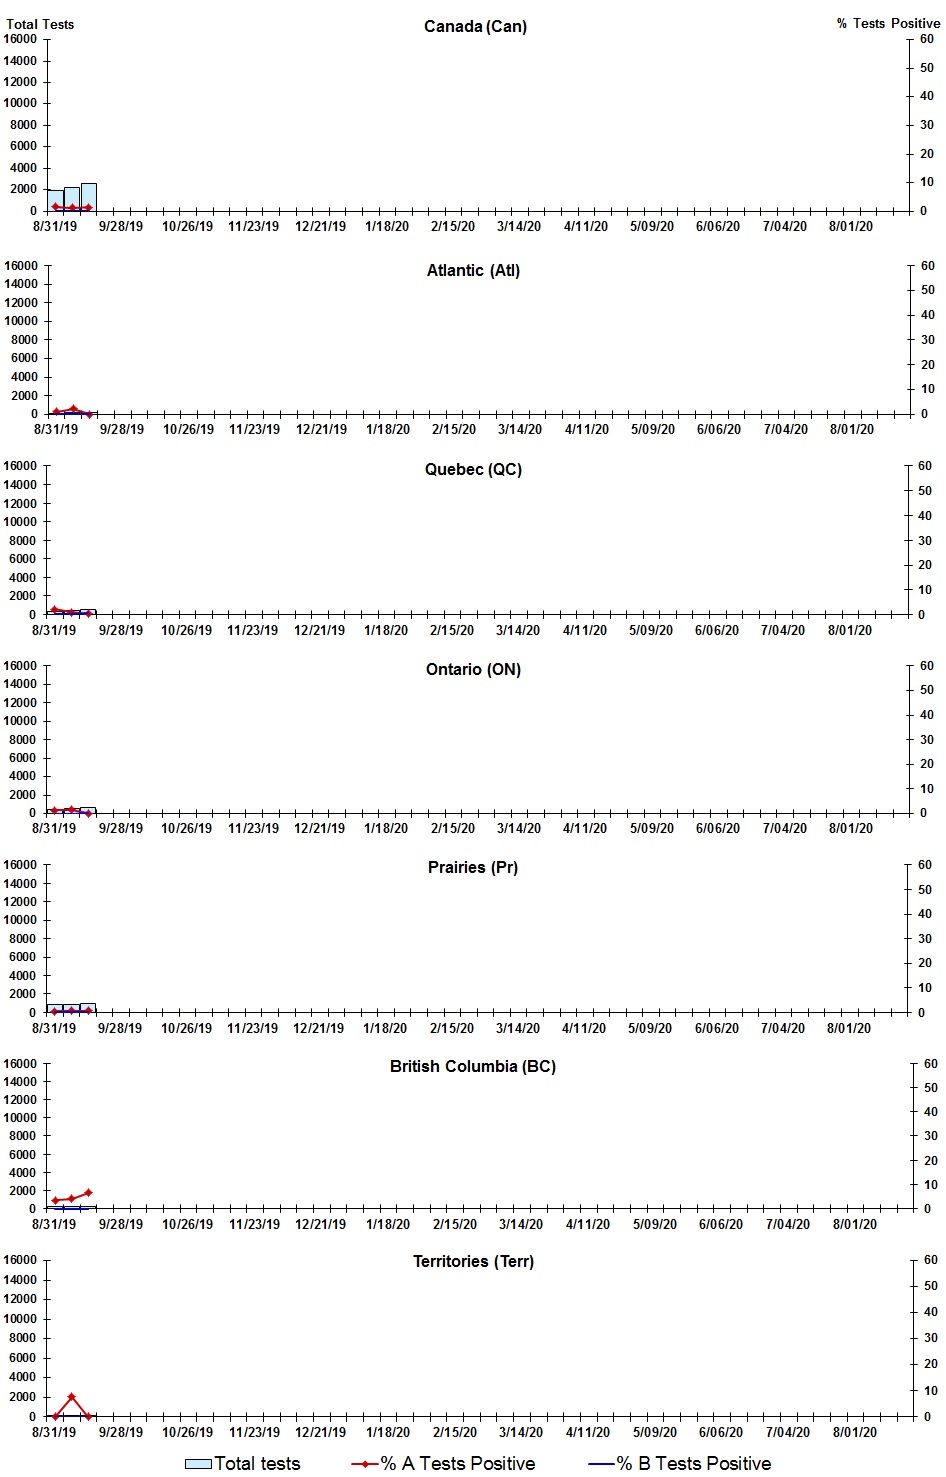
Figure 2: Positive Influenza Tests (%) in Canada by Region by Week of Report - Text description
| Week | Week end | Can Tests | Can A % |
Can B % |
Atl Tests | Atl A % |
Atl B % |
QC Tests | QC A % |
QC B % |
ON Tests | ON A % |
ON B % |
Pr Tests | Pr A % |
Pr B % |
BC Tests | BC A % |
BC B % |
Terr Tests | Terr A % |
Terr B % |
|---|---|---|---|---|---|---|---|---|---|---|---|---|---|---|---|---|---|---|---|---|---|---|
| 35 | 2019-08-31 | 1979 | 1.52 | 0.10 | 95 | 1.05 | 0.00 | 375 | 2.13 | 0.27 | 475 | 1.26 | 0.00 | 802 | 0.50 | 0.12 | 202 | 3.47 | 0.00 | 30 | 0 | 0 |
| 36 | 2019-09-07 | 2208 | 1.31 | 0.09 | 138 | 2.17 | 0.00 | 472 | 0.85 | 0.21 | 514 | 1.56 | 0.00 | 808 | 0.74 | 0.12 | 250 | 4.00 | 0.00 | 26 | 7.69 | 0 |
| 37 | 2019-09-14 | 2556 | 1.49 | 0.20 | 162 | 0.00 | 0.00 | 558 | 0.36 | 0.54 | 668 | 0.15 | 0.30 | 909 | 0.55 | 0.00 | 248 | 6.45 | 0.00 | 11 | 0 | 0 |
Positive Respiratory synctial virus tests
Figure 3: Positive Respiratory syncytial virus (RSV) Tests (%) in Canada by Region by Week of Report
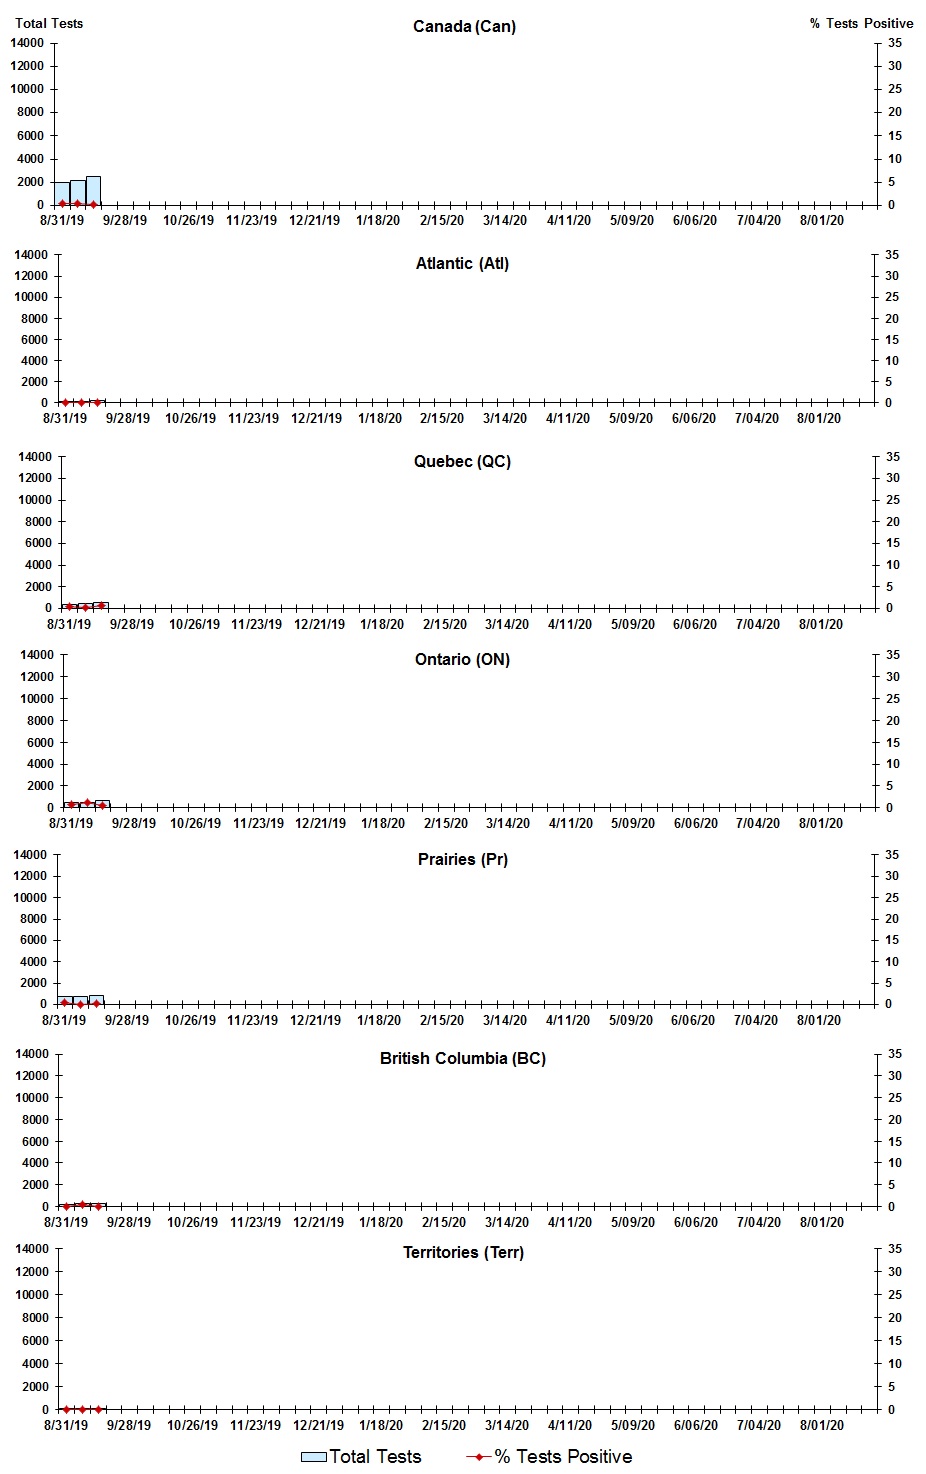
Figure 3: Positive Respiratory syncytial virus (RSV) Tests (%) in Canada by Region by Week of Report - Text description
| Week | Week end | Can Tests | RSV % |
Atl Tests | RSV % |
QC Tests | RSV % |
ON Tests | RSV % |
Pr Tests | RSV % |
BC Tests | RSV % |
Terr Tests | RSV % |
|---|---|---|---|---|---|---|---|---|---|---|---|---|---|---|---|
| 35 | 2019-08-31 | 1948 | 0.41 | 95 | 0 | 399 | 0.5 | 466 | 0.64 | 756 | 0.4 | 202 | 0 | 30 | 0 |
| 36 | 2019-09-07 | 2191 | 0.37 | 139 | 0 | 481 | 0.21 | 512 | 1.17 | 783 | 0 | 250 | 0.4 | 26 | 0 |
| 37 | 2019-09-14 | 2516 | 0.32 | 162 | 0 | 565 | 0.71 | 662 | 0.45 | 868 | 0.12 | 248 | 0 | 11 | 0 |
Positive Parainfluenza tests
Figure 4: Positive Parainfluenza (PIV) Tests (%) in Canada by Region by Week of Report
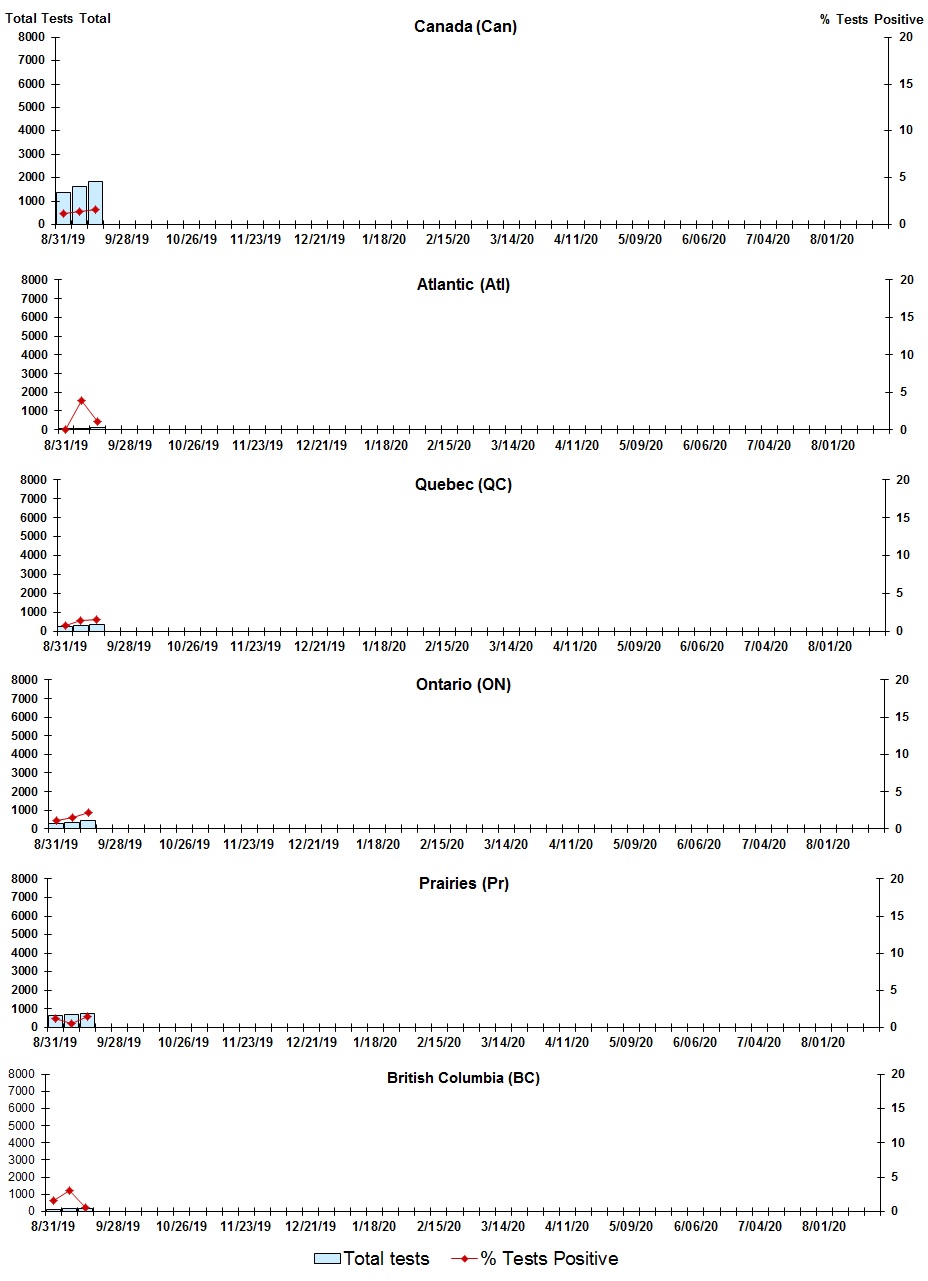
Figure 4: Positive Parainfluenza (PIV) Tests (%) in Canada by Region by Week of Report - Text description
| Week | Week End | Canada Tests | PIV % |
Atl Tests | PIV % |
QC Tests | PIV % |
ON Tests | PIV % |
Pr Tests | PIV % |
BC Tests | PIV % |
|---|---|---|---|---|---|---|---|---|---|---|---|---|---|
| 35 | 2019-08-31 | 1389 | 1.15 | 74 | 0 | 252 | 0.79 | 276 | 1.09 | 633 | 1.26 | 124 | 1.61 |
| 36 | 2019-09-07 | 1633 | 1.35 | 76 | 3.95 | 345 | 1.45 | 339 | 1.47 | 683 | 0.59 | 164 | 3.05 |
| 37 | 2019-09-14 | 1822 | 1.65 | 87 | 1.15 | 379 | 1.58 | 416 | 2.16 | 769 | 1.43 | 160 | 0.63 |
Positive Adenovirus tests
Figure 5: Positive Adenovirus (adeno) Tests (%) in Canada by Region by Week of Report
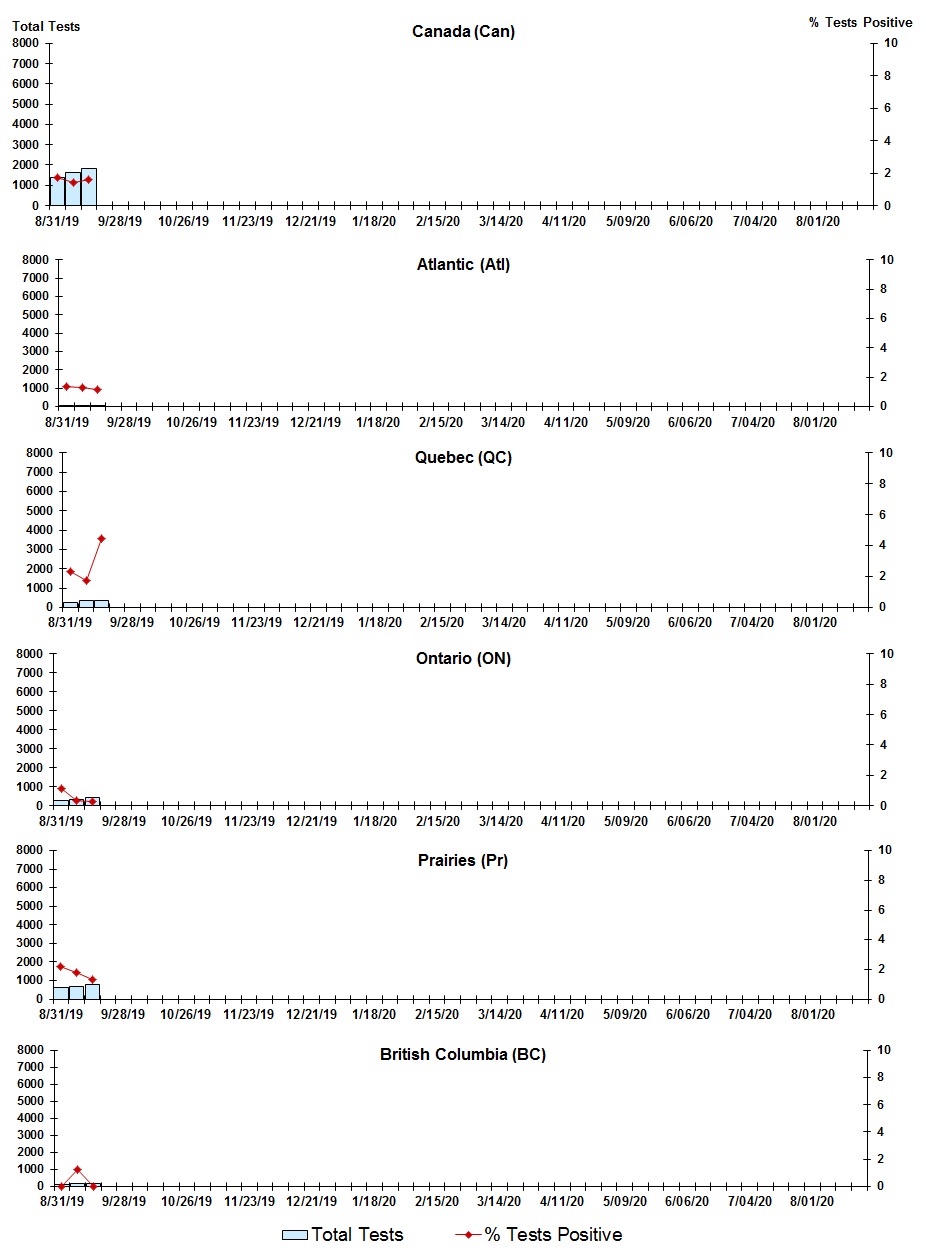
Figure 5: Positive Adenovirus (adeno) Tests (%) in Canada by Region by Week of Report - Text description
| Week | Week End | Can Tests | Adeno % |
Atl Tests | Adeno % |
QC Tests | Adeno % |
ON Tests | Adeno % |
Pr Tests | Adeno % |
BC Tests | Adeno % |
|---|---|---|---|---|---|---|---|---|---|---|---|---|---|
| 35 | 2019-08-31 | 1377 | 1.74 | 74 | 1.35 | 255 | 2.35 | 261 | 1.15 | 633 | 2.21 | 124 | 0 |
| 36 | 2019-09-07 | 1047 | 23.3 | 76 | 26.32 | N.A. | N.A. | 107 | 15.89 | 683 | 24.6 | 155 | 15.48 |
| 37 | 2019-09-14 | 1114 | 27.47 | 87 | 32.18 | N.A. | N.A. | 100 | 33 | 769 | 27.44 | 147 | 18.37 |
Positive Human metapneumovirus tests
Figure 6: Positive human metapneumovirus (hMPV) Tests (%) in Canada by Region by Week of Report
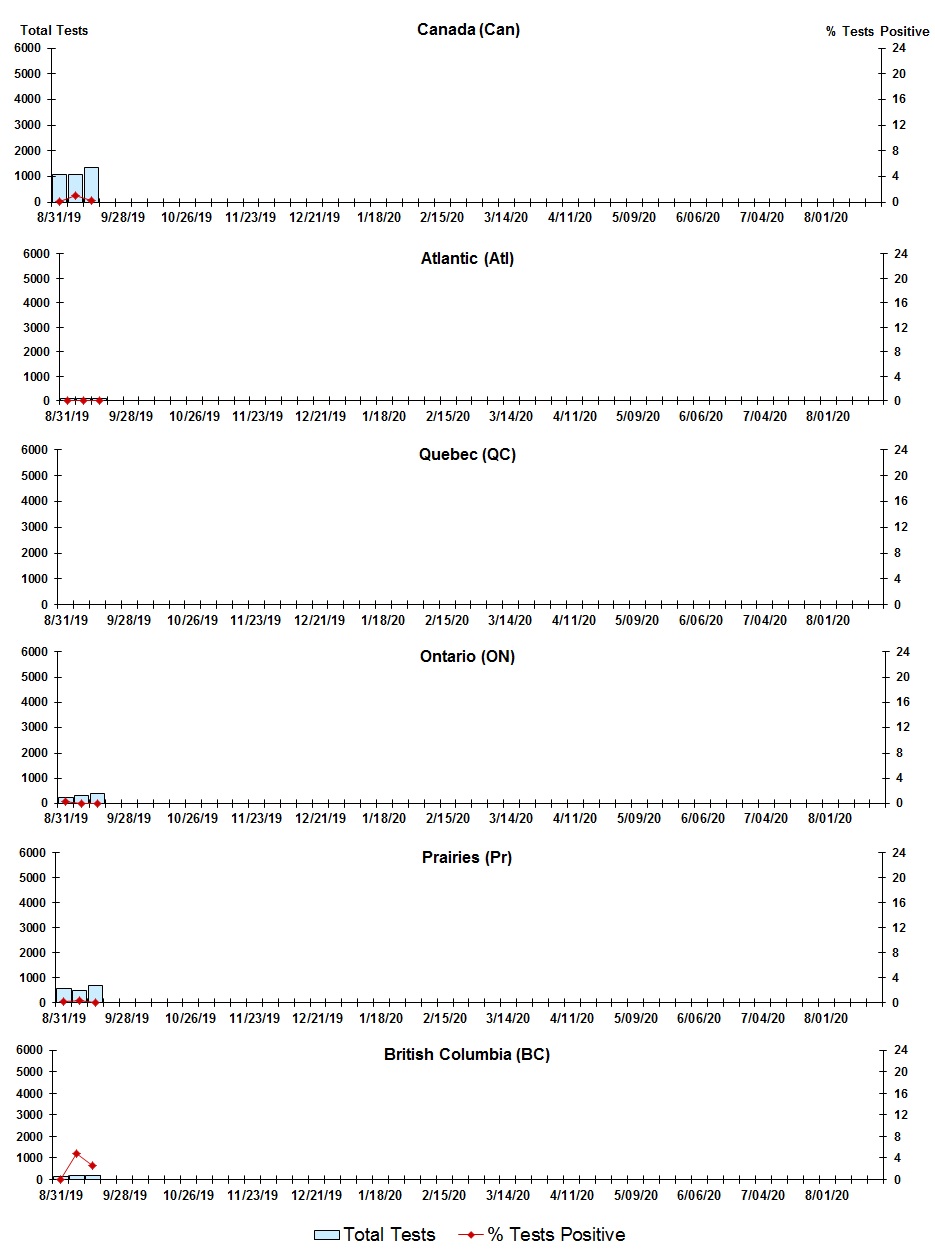
Figure 6: Positive human metapneumovirus (hMPV) Tests (%) in Canada by Region by Week of Report - Text description
| Week | Week End | Can Tests | hMPV % |
Atl Tests | hMPV % |
QC Tests | hMPV % |
ON Tests | hMPV % |
Pr Tests | hMPV % |
BC Tests | hMPV % |
|---|---|---|---|---|---|---|---|---|---|---|---|---|---|
| 35 | 2019-08-31 | 1069 | 0.19 | 74 | 0.00 | #N/A | #N/A | 264 | 0.38 | 577 | 0.17 | 124 | 0 |
| 36 | 2019-09-07 | 1086 | 1.01 | 76 | 0.00 | #N/A | #N/A | 322 | 0 | 498 | 0.4 | 164 | 4.88 |
| 37 | 2019-09-14 | 1366 | 0.29 | 87 | 0.00 | #N/A | #N/A | 403 | 0 | 705 | 0 | 160 | 2.5 |
Positive Enterovirus/Rhinovirus tests
Figure 7: Positive Enterovirus/Rhinovirus (entero/rhino) Tests (%) in Canada by Region by Week of Report
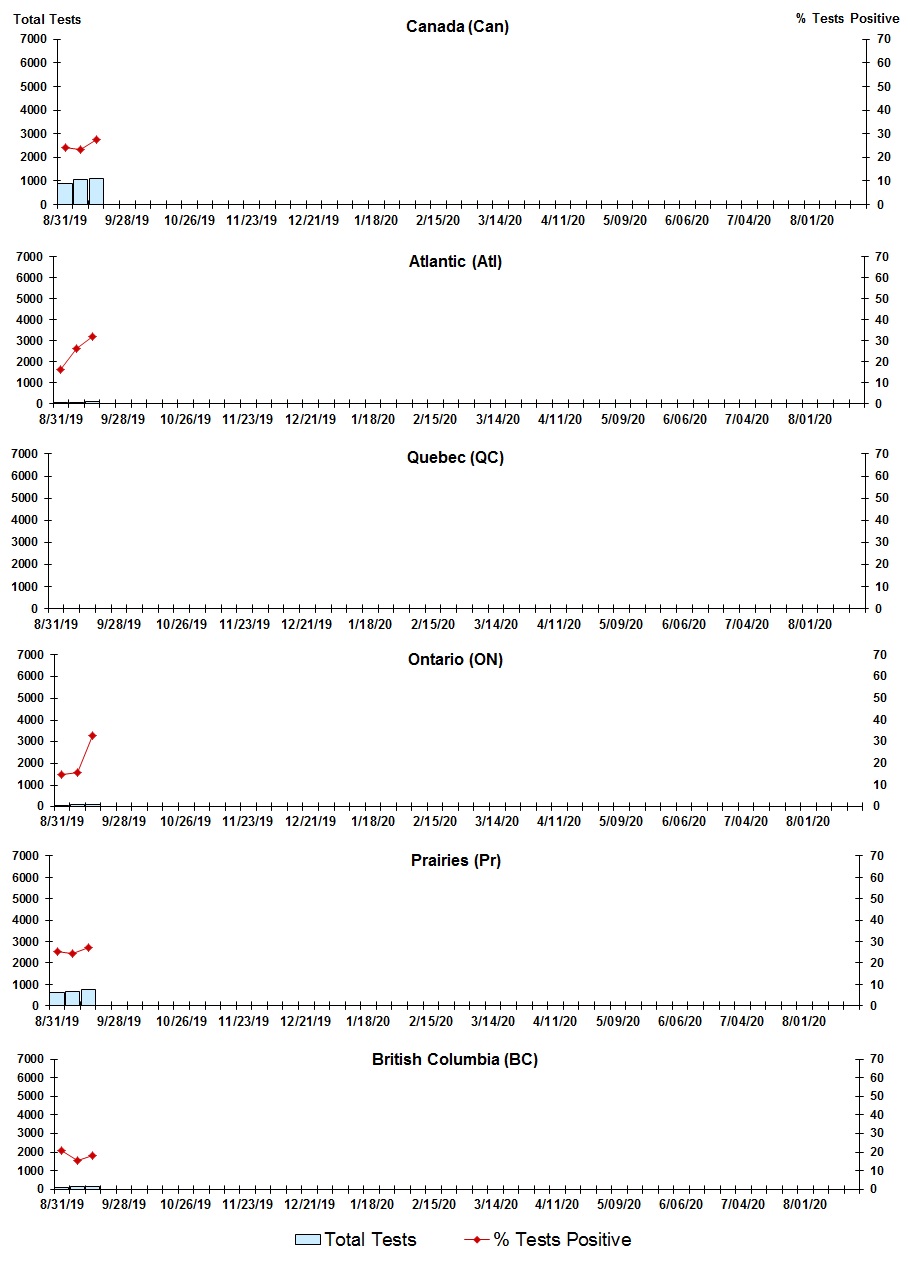
Figure 7: Positive Enterovirus/Rhinovirus (entero/rhino) Tests (%) in Canada by Region by Week of Report - Text description
| Week | Week End | Canada Tests | Entero/rhino % |
Atl Tests | Entero/rhino % |
QC Tests | Entero/rhino % |
ON Tests | Entero/rhino % |
Pr Tests | Entero/rhino % |
BC Tests | Entero/rhino % |
|---|---|---|---|---|---|---|---|---|---|---|---|---|---|
| 35 | 2019-08-31 | 907 | 24.37 | 74 | 16.22 | N.A. | N.A. | 54 | 14.81 | 633 | 25.12 | 116 | 20.69 |
| 36 | 2019-09-07 | 1047 | 23.3 | 76 | 26.32 | N.A. | N.A. | 107 | 15.89 | 683 | 24.6 | 155 | 15.48 |
| 37 | 2019-09-14 | 1114 | 27.47 | 87 | 32.18 | N.A. | N.A. | 100 | 33 | 769 | 27.44 | 147 | 18.37 |
Positive Coronovirus tests
Figure 8: Positive Coronavirus (coron) Tests (%) in Canada by Region by Week of Report
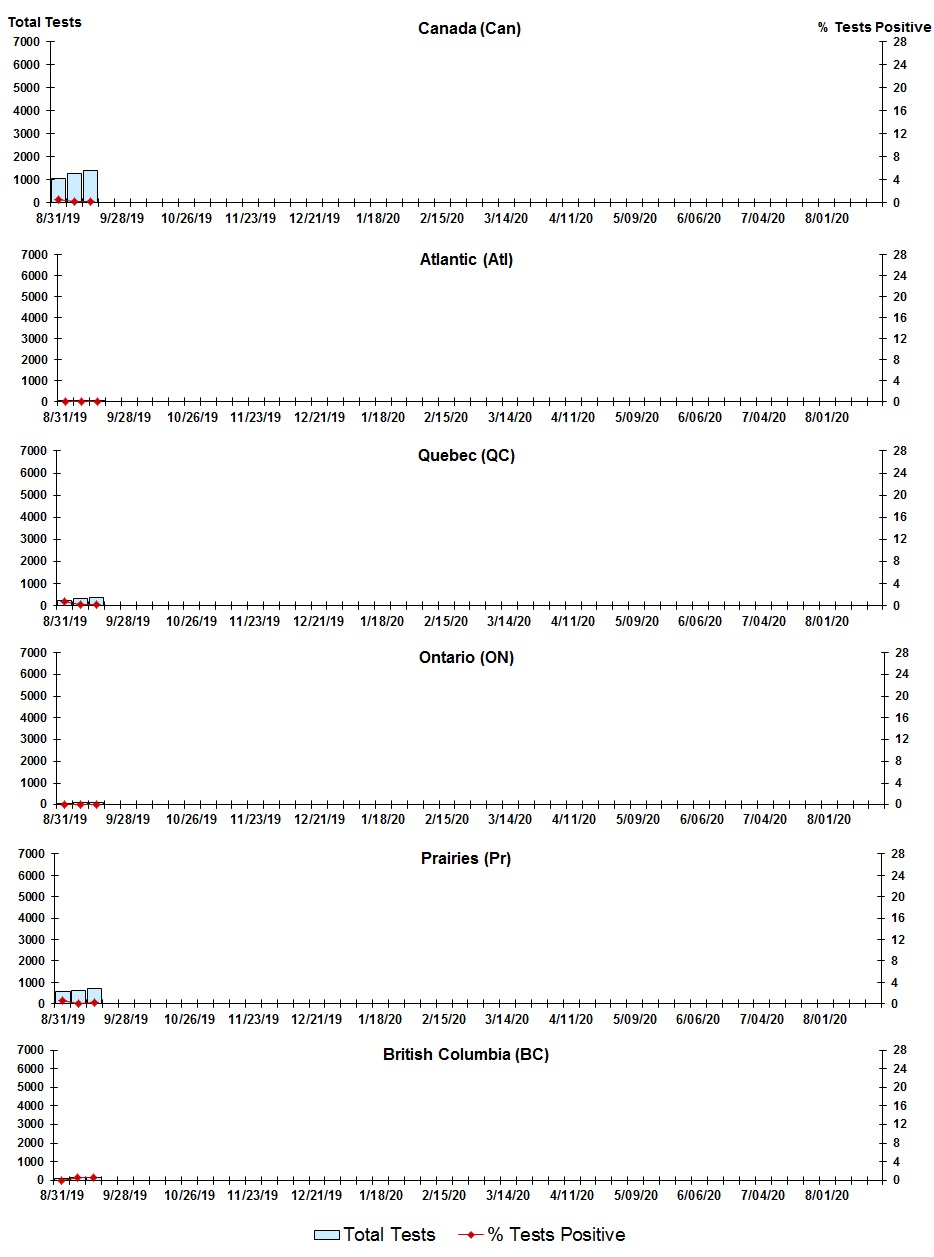
Figure 8: Positive Coronavirus (coron) Tests (%) in Canada by Region by Week of Report - Text description
| Week | Week End | Canada Tests | Coron % |
Atl Tests | Coron % |
QC Tests | Coron % |
ON Tests | Coron % |
Pr Tests | Coron % |
BC Tests | Coron % |
|---|---|---|---|---|---|---|---|---|---|---|---|---|---|
| 35 | 2019-08-31 | 1043 | 0.48 | 38 | 0 | 246 | 0.81 | 36 | 0 | 577 | 0.52 | 116 | 0 |
| 36 | 2019-09-07 | 1257 | 0.24 | 46 | 0 | 338 | 0.3 | 87 | 0 | 605 | 0 | 155 | 0.65 |
| 37 | 2019-09-14 | 1374 | 0.22 | 54 | 0 | 373 | 0.27 | 84 | 0 | 705 | 0.14 | 147 | 0.68 |
Page details
- Date modified: