
Respiratory Virus Report, week 40 ending October 5, 2019
Download the alternative format
(PDF format, 1.2 MB, 11 pages)
Organization: Public Health Agency of Canada
On this page
- List of abbreviations
- Respiratory Virus Detections and Isolations
- Number of positive laboratory tests for other respiratory viruses
- Positive Influenza tests
- Positive Respiratory synctial virus tests
- Positive Parainfluenza tests
- Positive Adenovirus tests
- Positive Human metapneumovirus tests
- Positive Enterovirus/Rhinovirus tests
- Positive Coronovirus tests
List of abbreviations
- A(H1N1)pdm09
- Influenza A(H1N1)pdm09
- A(H3)
- Influenza A(H3N2)
- A (UnS)
- Influenza A (Unsubtyped)
- Adeno
- Adenovirus
- CHEO
- Children's Hospital of Eastern Ontario
- Coron
- Coronavirus
- Entero
- Enterovirus
- hMPV
- human metapneumovirus
- HSC
- Health Sciences Centre
- N.A
- Not Applicable
- P.H.L.
- Public Health Laboratory
- P.H.O.L.
- Public Health Ontario Laboratory
- PIV
- Parainfluenza
- Rhino
- Rhinovirus
- RSV
- Respiratory syncytial virus
- UHN
- University Health Network
Respiratory Virus Detections and Isolations
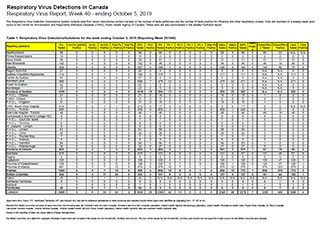
Table 1: Respiratory Virus Detections/Isolations for the week ending October 5, 2019 (Reporting Week 201940)
| Reporting Laboratory | Flu Tested | A(H1N1)pdm09 Positive | A(H3) Positive | A(UnS) Positive | Total Flu A Positive | Total Flu B Positive | RSV Tested | RSV Positive | PIV Tested | PIV 1 Positive | PIV 2 Positive | PIV 3 Positive | PIV 4 Positive | Other PIV Positive | Adeno Tested | Adeno Positive | hMPV Tested | hMPV Positive | Entero/Rhino Tested | Entero/Rhino Positive | Coron Tested | Coron Positive |
|---|---|---|---|---|---|---|---|---|---|---|---|---|---|---|---|---|---|---|---|---|---|---|
| Newfoundland | 66 | 0 | 0 | 0 | 0 | 0 | 66 | 0 | 66 | 0 | 0 | 0 | 0 | 0 | 66 | 0 | 66 | 0 | 66 | 23 | N.A. | N.A. |
| Prince Edward Island | 10 | 0 | 0 | 0 | 0 | 0 | 10 | 0 | 2 | 0 | 0 | 0 | 0 | 0 | 2 | 0 | 2 | 0 | 2 | 2 | 2 | 0 |
| Nova Scotia | 36 | 0 | 0 | 0 | 0 | 0 | 39 | 0 | 31 | 1 | 0 | 0 | 0 | 0 | 31 | 1 | 31 | 0 | 31 | 11 | 31 | 0 |
| New Brunswick | 142 | 0 | 0 | 0 | 0 | 0 | 142 | 0 | 46 | 0 | 0 | 0 | 0 | 0 | 46 | 5 | 46 | 0 | 46 | 14 | 46 | 0 |
| Atlantic | 254 | 0 | 0 | 0 | 0 | 0 | 257 | 0 | 145 | 1 | 0 | 0 | 0 | 0 | 145 | 6 | 145 | 0 | 145 | 50 | 79 | 0 |
| Région Nord-Est | 27 | 0 | 0 | 0 | 0 | 0 | 26 | 0 | 0 | 0 | 0 | 0 | 0 | 0 | 0 | 0 | 0 | 0 | N.A. | N.A. | 0 | 0 |
| Québec-Chaudière-Appalaches | 114 | 0 | 0 | 1 | 1 | 0 | 120 | 0 | 116 | 1 | 0 | 0 | 0 | 0 | 117 | 3 | 111 | 0 | N.A. | N.A. | 111 | 0 |
| Centre-du-Québec | 63 | 0 | 0 | 0 | 0 | 0 | 57 | 0 | 0 | 0 | 0 | 0 | 0 | 0 | 0 | 0 | 0 | 0 | N.A. | N.A. | 0 | 0 |
| Montréal-Laval | 680 | 0 | 0 | 3 | 3 | 0 | 690 | 7 | 478 | 12 | 0 | 0 | 0 | 0 | 478 | 22 | 471 | 0 | N.A. | N.A. | 471 | 0 |
| Ouest du Québec | 82 | 0 | 0 | 0 | 0 | 0 | 82 | 1 | 0 | 0 | 0 | 0 | 0 | 0 | 0 | 0 | 0 | 0 | N.A. | N.A. | 0 | 0 |
| Montérégie | 43 | 0 | 0 | 0 | 0 | 0 | 43 | 2 | 0 | 0 | 0 | 0 | 0 | 0 | 0 | 0 | 0 | 0 | N.A. | N.A. | 0 | 0 |
| Province of Québec | 1009 | 0 | 0 | 4 | 4 | 0 | 1018 | 10 | 594 | 13 | 0 | 0 | 0 | 0 | 595 | 25 | 582 | 0 | N.A. | N.A. | 582 | 0 |
| P.H.O.L. - Ottawa | 21 | 0 | 0 | 0 | 0 | 0 | 21 | 0 | 16 | 0 | 0 | 0 | 0 | 0 | 16 | 0 | 15 | 0 | 1 | 0 | 0 | 0 |
| CHEO - Ottawa | 0 | 0 | 0 | 0 | 0 | 0 | 0 | 0 | 0 | 0 | 0 | 0 | 0 | 0 | 0 | 0 | 0 | 0 | 0 | 0 | 0 | 0 |
| P.H.O.L. - Kingston | 31 | 0 | 0 | 0 | 0 | 0 | 31 | 0 | 19 | 0 | 0 | 0 | 0 | 0 | 19 | 0 | 18 | 0 | 1 | 0 | 0 | 0 |
| UHN / Mount Sinai Hospital | 214 | 0 | 0 | 1 | 1 | 2 | 214 | 0 | 17 | 0 | 0 | 0 | 0 | 0 | 0 | 0 | 17 | 1 | 0 | 0 | N.A. | N.A. |
| P.H.O.L. - Toronto | 258 | 0 | 2 | 0 | 2 | 0 | 258 | 0 | 255 | 3 | 0 | 0 | 0 | 0 | 255 | 1 | 249 | 0 | 6 | 0 | 0 | 0 |
| Sick Kids Hospital - Toronto | 48 | 0 | 0 | 0 | 0 | 0 | 48 | 1 | 48 | 2 | 0 | 0 | 1 | 0 | 48 | 1 | 48 | 0 | 48 | 19 | 48 | 0 |
| Sunnybrook & Women's College HSC | 8 | 0 | 0 | 0 | 0 | 0 | 8 | 0 | 8 | 0 | 0 | 0 | 0 | 0 | 8 | 0 | 8 | 0 | 8 | 0 | 8 | 0 |
| P.H.O.L. - Sault Ste. Marie | 7 | 0 | 0 | 0 | 0 | 0 | 7 | 0 | 7 | 0 | 0 | 0 | 0 | 0 | 7 | 0 | 7 | 0 | 0 | 0 | 0 | 0 |
| P.H.O.L. - Timmins | 6 | 0 | 0 | 0 | 0 | 0 | 6 | 0 | 6 | 0 | 0 | 0 | 0 | 0 | 6 | 0 | 6 | 0 | 0 | 0 | 0 | 0 |
| St. Joseph's - London | 0 | 0 | 0 | 0 | 0 | 0 | 0 | 0 | 0 | 0 | 0 | 0 | 0 | 0 | 0 | 0 | 0 | 0 | 0 | 0 | 0 | 0 |
| P.H.O.L. - London | 61 | 0 | 0 | 0 | 0 | 0 | 61 | 1 | 58 | 0 | 0 | 0 | 0 | 0 | 58 | 0 | 56 | 0 | 2 | 0 | 0 | 0 |
| P.H.O.L. - Orillia | 40 | 0 | 0 | 0 | 0 | 0 | 40 | 0 | 26 | 0 | 0 | 0 | 0 | 0 | 26 | 0 | 26 | 0 | 0 | 0 | 0 | 0 |
| P.H.O.L. - Thunder Bay | 7 | 0 | 0 | 0 | 0 | 0 | 7 | 0 | 7 | 0 | 0 | 0 | 0 | 0 | 7 | 0 | 7 | 0 | 0 | 0 | 0 | 0 |
| P.H.O.L. - Sudbury | 6 | 0 | 0 | 0 | 0 | 0 | 6 | 0 | 6 | 0 | 0 | 1 | 0 | 0 | 6 | 0 | 6 | 0 | 0 | 0 | 0 | 0 |
| P.H.O.L. - Hamilton | 84 | 0 | 0 | 0 | 0 | 0 | 84 | 1 | 84 | 0 | 1 | 0 | 0 | 0 | 84 | 0 | 83 | 0 | 1 | 0 | 0 | 0 |
| P.H.O.L. - Peterborough | 32 | 0 | 0 | 0 | 0 | 0 | 32 | 0 | 27 | 0 | 0 | 0 | 0 | 0 | 27 | 0 | 27 | 0 | 0 | 0 | 0 | 0 |
| Province of Ontario | 823 | 0 | 2 | 1 | 3 | 2 | 823 | 3 | 584 | 5 | 1 | 1 | 1 | 0 | 567 | 2 | 573 | 1 | 67 | 19 | 56 | 0 |
| Manitoba | 215 | 0 | 0 | 0 | 0 | 0 | 215 | 1 | 131 | 0 | 0 | 0 | 0 | 0 | 131 | 2 | 67 | 0 | 131 | 40 | 67 | 0 |
| Regina | 0 | 0 | 0 | 0 | 0 | 0 | 0 | 0 | 0 | 0 | 0 | 0 | 0 | 0 | 0 | 0 | 0 | 0 | 0 | 0 | 0 | 0 |
| Saskatoon | 126 | 0 | 0 | 0 | 0 | 0 | 126 | 3 | 126 | 5 | 1 | 0 | 0 | 0 | 126 | 1 | 126 | 0 | 126 | 47 | 126 | 1 |
| Province of Saskatchewan | 126 | 0 | 0 | 0 | 0 | 0 | 126 | 3 | 126 | 5 | 1 | 0 | 0 | 0 | 126 | 1 | 126 | 0 | 126 | 47 | 126 | 1 |
| Province of Alberta | 661 | 0 | 3 | 7 | 10 | 0 | 579 | 0 | 579 | 10 | 7 | 0 | 1 | 0 | 579 | 12 | 579 | 1 | 579 | 223 | 579 | 2 |
| Prairies | 1002 | 0 | 3 | 7 | 10 | 0 | 920 | 4 | 836 | 15 | 8 | 0 | 1 | 0 | 836 | 15 | 772 | 1 | 836 | 310 | 772 | 3 |
| British Columbia | 546 | 0 | 4 | 17 | 25 | 0 | 530 | 3 | 197 | 8 | 3 | 2 | 0 | 0 | 197 | 0 | 197 | 5 | 181 | 64 | 182 | 1 |
| Yukon | 45 | 0 | 0 | 1 | 1 | 0 | 45 | 0 | N.A. | N.A. | N.A. | N.A. | N.A. | N.A. | N.A. | N.A. | N.A. | N.A. | N.A. | N.A. | N.A. | N.A. |
| Northwest Territories | 8 | 0 | 0 | 0 | 0 | 0 | 8 | 0 | 8 | 0 | 0 | 0 | 0 | 0 | 8 | 0 | 8 | 0 | 8 | 7 | 8 | 0 |
| Nunavut | 1 | 0 | 0 | 0 | 0 | 0 | 1 | 0 | 1 | 0 | 0 | 0 | 0 | 0 | 1 | 0 | 1 | 0 | 1 | 0 | 1 | 0 |
| Territories | 54 | 0 | 0 | 1 | 1 | 0 | 54 | 0 | 9 | 0 | 0 | 0 | 0 | 0 | 9 | 0 | 9 | 0 | 9 | 7 | 9 | 0 |
| CANADA | 3688 | 0 | 9 | 30 | 43 | 2 | 3602 | 20 | 2365 | 42 | 12 | 3 | 2 | 0 | 2349 | 48 | 2278 | 7 | 1238 | 450 | 1680 | 4 |
Table 1 notes
|
||||||||||||||||||||||
Table 2: Respiratory Virus Detections/Isolations for the period August 25, 2019 - October 5, 2019 (Reporting Weeks 201935-201940)
| Reporting Laboratory | Flu Tested | A(H1N1)pdm09 Positive | A(H3) Positive | A(UnS) Positive | Total Flu A Positive | Total Flu B Positive | RSV Tested | RSV Positive | PIV Tested | PIV 1 Positive | PIV 2 Positive | PIV 3 Positive | PIV 4 Positive | Other PIV Positive | Adeno Tested | Adeno Positive | hMPV Tested | hMPV Positive | Entero/Rhino Tested | Entero/Rhino Positive | Coron Tested | Coron Positive |
|---|---|---|---|---|---|---|---|---|---|---|---|---|---|---|---|---|---|---|---|---|---|---|
| Newfoundland | 259 | 0 | 0 | 0 | 0 | 0 | 259 | 0 | 259 | 3 | 0 | 0 | 0 | 0 | 259 | 0 | 259 | 0 | 259 | 85 | N.A. | 1N.A. |
| Prince Edward Island | 17 | 0 | 0 | 0 | 0 | 0 | 17 | 0 | 7 | 0 | 0 | 0 | 0 | 0 | 7 | 0 | 7 | 0 | 7 | 5 | 7 | 0 |
| Nova Scotia | 117 | 0 | 0 | 0 | 0 | 0 | 121 | 0 | 71 | 3 | 0 | 1 | 0 | 0 | 71 | 1 | 71 | 0 | 71 | 18 | 71 | 0 |
| New Brunswick | 624 | 1 | 1 | 2 | 4 | 1 | 624 | 1 | 255 | 5 | 0 | 0 | 0 | 0 | 255 | 12 | 255 | 0 | 255 | 88 | 255 | 0 |
| Atlantic | 1017 | 1 | 1 | 2 | 4 | 1 | 1021 | 1 | 592 | 11 | 0 | 1 | 0 | 0 | 592 | 13 | 592 | 0 | 592 | 196 | 333 | 0 |
| Région Nord-Est | 139 | 0 | 0 | 0 | 0 | 0 | 121 | 0 | 0 | 0 | 0 | 0 | 0 | 0 | 0 | 0 | 0 | 0 | N.A. | N.A. | 0 | 0 |
| Québec-Chaudière-Appalaches | 353 | 0 | 0 | 1 | 1 | 0 | 424 | 0 | 447 | 3 | 0 | 1 | 0 | 0 | 459 | 9 | 359 | 0 | N.A. | N.A. | 423 | 0 |
| Centre-du-Québec | 185 | 0 | 0 | 1 | 1 | 0 | 170 | 1 | 0 | 0 | 0 | 0 | 0 | 0 | 0 | 0 | 0 | 0 | N.A. | N.A. | 0 | 0 |
| Montréal-Laval | 2781 | 0 | 0 | 16 | 16 | 5 | 2841 | 23 | 2221 | 30 | 1 | 1 | 1 | 0 | 2221 | 90 | 2006 | 6 | N.A. | N.A. | 2187 | 5 |
| Ouest du Québec | 313 | 0 | 0 | 3 | 3 | 0 | 316 | 4 | 0 | 0 | 0 | 0 | 0 | 0 | 0 | 0 | 0 | 0 | N.A. | N.A. | 0 | 0 |
| Montérégie | 297 | 0 | 0 | 3 | 3 | 1 | 295 | 3 | 0 | 0 | 0 | 0 | 0 | 0 | 0 | 0 | 0 | 0 | N.A. | N.A. | 0 | 0 |
| Province of Québec | 4068 | 0 | 0 | 24 | 24 | 6 | 4167 | 31 | 2668 | 33 | 1 | 2 | 1 | 0 | 2680 | 99 | 2365 | 6 | N.A. | N.A. | 2610 | 5 |
| P.H.O.L. - Ottawa | 82 | 0 | 0 | 0 | 0 | 0 | 80 | 0 | 75 | 1 | 0 | 0 | 0 | 0 | 75 | 0 | 72 | 0 | 3 | 0 | 0 | 0 |
| CHEO - Ottawa | 428 | 0 | 0 | 1 | 1 | 1 | 428 | 5 | 101 | 0 | 0 | 0 | 1 | 0 | 101 | 1 | 101 | 0 | 104 | 33 | 99 | 0 |
| P.H.O.L. - Kingston | 79 | 0 | 0 | 0 | 0 | 0 | 79 | 1 | 67 | 0 | 0 | 0 | 0 | 0 | 67 | 0 | 65 | 0 | 3 | 0 | 0 | 0 |
| UHN / Mount Sinai Hospital | 1056 | 0 | 0 | 9 | 9 | 4 | 1056 | 6 | 95 | 0 | 0 | 3 | 2 | 0 | 0 | 0 | 95 | 2 | 0 | 0 | N.A. | N.A. |
| P.H.O.L. - Toronto | 1178 | 0 | 10 | 0 | 10 | 1 | 1178 | 2 | 1161 | 14 | 0 | 2 | 0 | 0 | 1161 | 4 | 1117 | 0 | 57 | 0 | 0 | 0 |
| Sick Kids Hospital - Toronto | 216 | 0 | 0 | 0 | 0 | 0 | 216 | 6 | 216 | 7 | 0 | 0 | 3 | 0 | 216 | 1 | 216 | 4 | 216 | 88 | 216 | 0 |
| Sunnybrook & Women's College HSC | 39 | 0 | 0 | 0 | 0 | 0 | 39 | 0 | 39 | 0 | 0 | 0 | 0 | 0 | 39 | 0 | 39 | 0 | 39 | 5 | 39 | 0 |
| P.H.O.L. - Sault Ste. Marie | 26 | 0 | 0 | 0 | 0 | 0 | 26 | 0 | 26 | 0 | 0 | 0 | 0 | 0 | 26 | 0 | 25 | 0 | 1 | 0 | 0 | 0 |
| P.H.O.L. - Timmins | 15 | 0 | 0 | 0 | 0 | 0 | 15 | 0 | 15 | 0 | 0 | 0 | 0 | 0 | 15 | 0 | 15 | 0 | 1 | 0 | 0 | 0 |
| St. Joseph's - London | 117 | 0 | 0 | 0 | 0 | 0 | 117 | 1 | 117 | 2 | 1 | 0 | 0 | 0 | 117 | 3 | 117 | 0 | 116 | 37 | 115 | 0 |
| P.H.O.L. - London | 229 | 0 | 0 | 0 | 0 | 0 | 229 | 1 | 225 | 2 | 0 | 0 | 0 | 0 | 225 | 1 | 215 | 0 | 18 | 0 | 0 | 0 |
| P.H.O.L. - Orillia | 89 | 0 | 1 | 0 | 1 | 0 | 89 | 0 | 74 | 0 | 0 | 0 | 0 | 0 | 74 | 0 | 73 | 0 | 1 | 0 | 0 | 0 |
| P.H.O.L. - Thunder Bay | 29 | 0 | 0 | 0 | 0 | 0 | 29 | 0 | 29 | 0 | 0 | 1 | 0 | 0 | 29 | 0 | 24 | 0 | 5 | 0 | 0 | 0 |
| P.H.O.L. - Sudbury | 37 | 0 | 0 | 0 | 0 | 0 | 37 | 0 | 36 | 0 | 0 | 1 | 0 | 0 | 36 | 1 | 31 | 0 | 6 | 0 | 0 | 0 |
| P.H.O.L. - Hamilton | 272 | 1 | 2 | 0 | 3 | 1 | 266 | 3 | 265 | 2 | 1 | 0 | 0 | 0 | 265 | 2 | 261 | 0 | 6 | 0 | 0 | 0 |
| P.H.O.L. - Peterborough | 106 | 0 | 0 | 0 | 0 | 0 | 103 | 0 | 98 | 0 | 0 | 0 | 0 | 0 | 98 | 0 | 98 | 0 | 3 | 0 | 0 | 0 |
| Province of Ontario | 3998 | 1 | 13 | 10 | 24 | 7 | 3987 | 25 | 2639 | 28 | 2 | 7 | 6 | 0 | 2544 | 13 | 2564 | 6 | 579 | 163 | 469 | 0 |
| Manitoba | 1146 | 0 | 0 | 1 | 1 | 1 | 1146 | 4 | 815 | 1 | 1 | 1 | 0 | 0 | 815 | 11 | 351 | 2 | 815 | 149 | 351 | 1 |
| Regina | 833 | 0 | 0 | 5 | 5 | 0 | 833 | 0 | 470 | 3 | 0 | 0 | 0 | 0 | 470 | 6 | 363 | 0 | 470 | 137 | 470 | 0 |
| Saskatoon | 581 | 0 | 0 | 1 | 1 | 0 | 581 | 5 | 581 | 11 | 1 | 0 | 1 | 0 | 581 | 15 | 584 | 0 | 581 | 200 | 581 | 1 |
| Province of Saskatchewan | 1414 | 0 | 0 | 6 | 6 | 0 | 1414 | 5 | 1051 | 14 | 1 | 0 | 1 | 0 | 1051 | 21 | 947 | 0 | 1051 | 337 | 1051 | 1 |
| Province of Alberta | 3212 | 3 | 26 | 11 | 40 | 5 | 2891 | 0 | 2891 | 31 | 10 | 8 | 7 | 0 | 2891 | 52 | 2891 | 7 | 2891 | 1046 | 2891 | 7 |
| Prairies | 5772 | 3 | 26 | 18 | 47 | 6 | 5451 | 9 | 4757 | 46 | 12 | 9 | 8 | 0 | 4757 | 84 | 4189 | 9 | 4757 | 1532 | 4293 | 9 |
| British Columbia | 1879 | 4 | 44 | 23 | 75 | 0 | 1811 | 7 | 1031 | 23 | 6 | 8 | 3 | 0 | 1031 | 6 | 1031 | 38 | 796 | 161 | 972 | 4 |
| Yukon | 96 | 0 | 7 | 1 | 6 | 0 | 96 | 0 | N.A. | N.A. | N.A. | N.A. | N.A. | N.A. | N.A. | N.A. | N.A. | N.A. | N.A. | N.A. | N.A. | N.A. |
| Northwest Territories | 55 | 0 | 0 | 0 | 0 | 0 | 54 | 0 | 54 | 0 | 0 | 0 | 0 | 0 | 54 | 0 | 54 | 1 | 54 | 37 | 54 | 1 |
| Nunavut | 15 | 0 | 0 | 0 | 0 | 0 | 15 | 0 | 15 | 0 | 2 | 0 | 0 | 0 | 15 | 2 | 15 | 0 | 15 | 7 | 15 | 0 |
| Territories | 166 | 0 | 7 | 1 | 6 | 0 | 165 | 0 | 69 | 0 | 2 | 0 | 0 | 0 | 69 | 2 | 69 | 1 | 69 | 44 | 69 | 1 |
| CANADA | 16900 | 9 | 91 | 78 | 180 | 20 | 16602 | 73 | 11756 | 141 | 23 | 27 | 18 | 0 | 11673 | 217 | 10810 | 60 | 6793 | 2096 | 8746 | 19 |
Table 2 notes
|
||||||||||||||||||||||
Number of positive laboratory tests for other respiratory viruses
Figure 1: Number positive laboratory tests for other respiratory viruses by report week, Canada. 2019-20
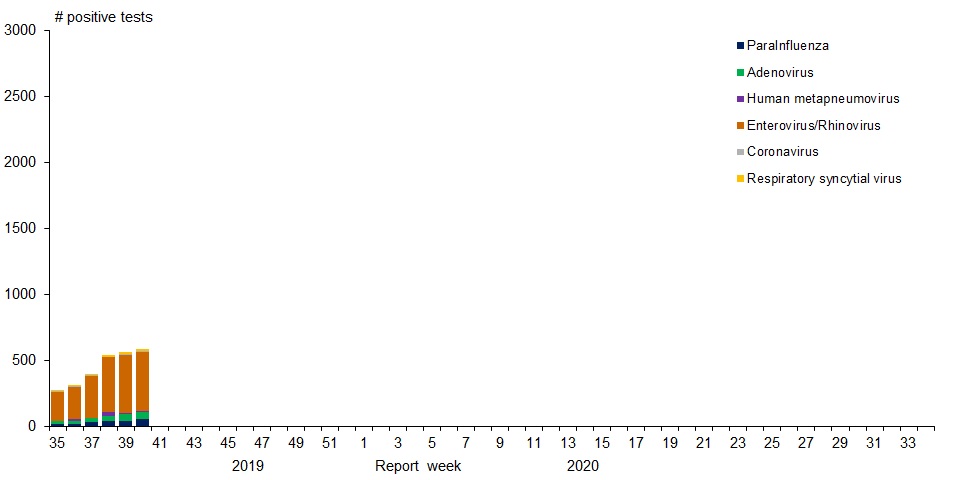
Figure 1: Number positive laboratory tests for other respiratory viruses by report week, Canada. 2019-20 - Text description
| Week | ParaInfluenza | Adenovirus | Human metapneumovirus | Enterovirus/Rhinovirus | Coronavirus | Respiratory syncytial virus |
|---|---|---|---|---|---|---|
| 35 | 16 | 24 | 2 | 221 | 5 | 8 |
| 36 | 22 | 23 | 12 | 244 | 3 | 8 |
| 37 | 32 | 30 | 5 | 316 | 3 | 8 |
| 38 | 40 | 39 | 28 | 421 | 1 | 11 |
| 39 | 40 | 53 | 6 | 444 | 3 | 18 |
| 40 | 59 | 48 | 7 | 450 | 4 | 20 |
Positive Influenza tests
Figure 2: Positive Influenza Tests (%) in Canada by Region by Week of Report
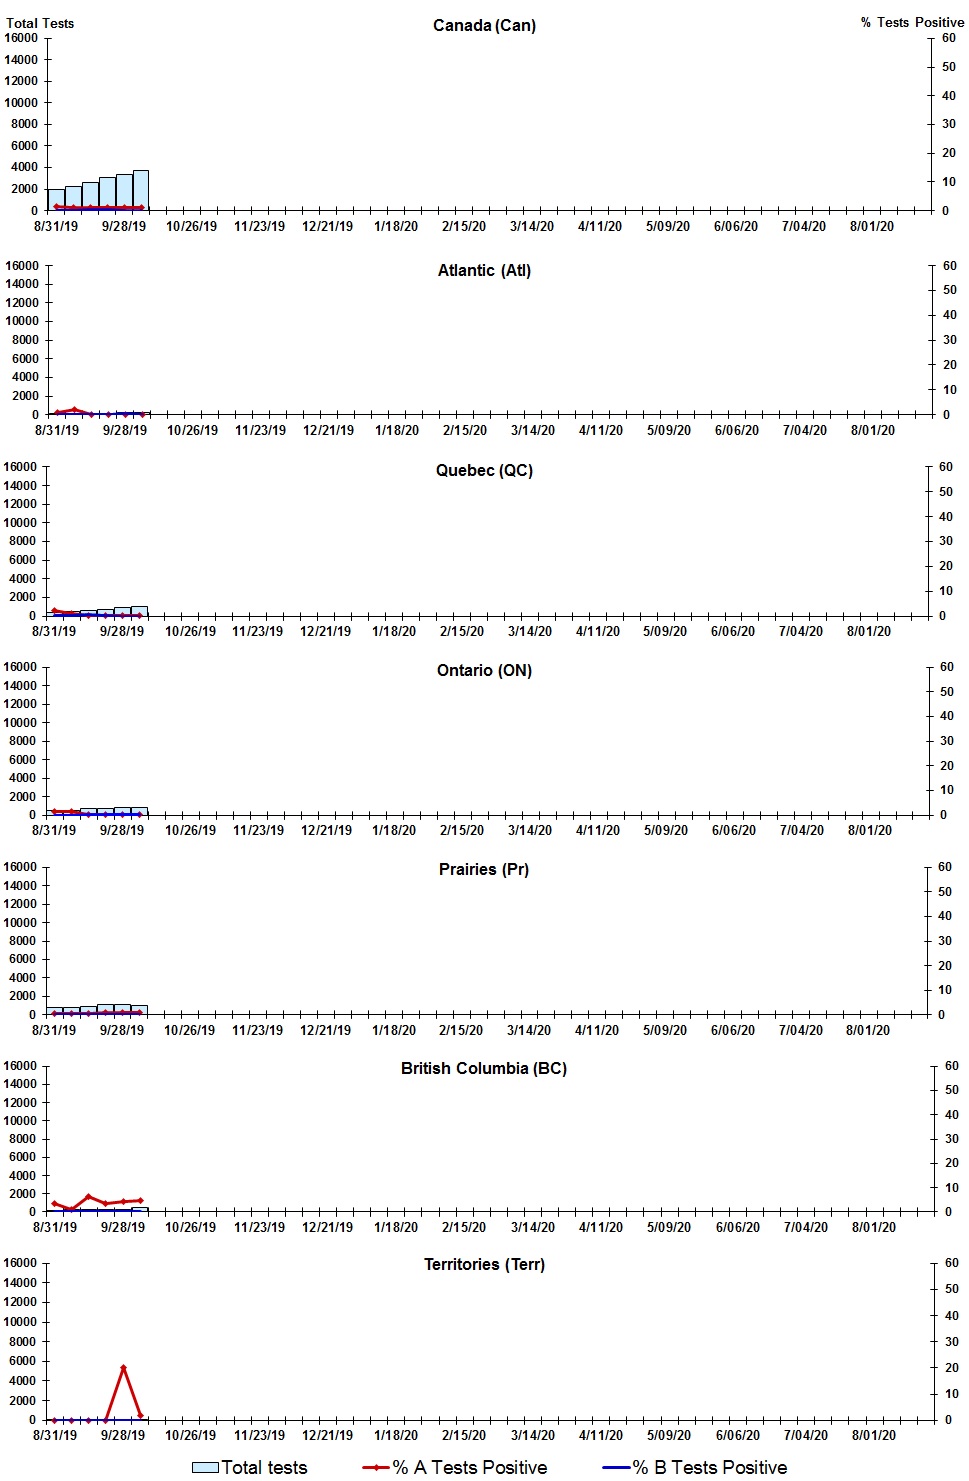
Figure 2: Positive Influenza Tests (%) in Canada by Region by Week of Report - Text description
| Week | Week end | Can Tests | Can A % |
Can B % |
Atl Tests | Atl A % |
Atl B % |
QC Tests | QC A % |
QC B % |
ON Tests | ON A % |
ON B % |
Pr Tests | Pr A % |
Pr B % |
BC Tests | BC A % |
BC B % |
Terr Tests | Terr A % |
Terr B % |
|---|---|---|---|---|---|---|---|---|---|---|---|---|---|---|---|---|---|---|---|---|---|---|
| 35 | 2019-08-31 | 1979 | 1.3 | 0.1 | 95 | 1.1 | 0.0 | 375 | 2.1 | 0.3 | 475 | 1.3 | 0.0 | 802 | 0.5 | 0.1 | 202 | 3.5 | 0.0 | 30 | 0.0 | 0.0 |
| 36 | 2019-09-07 | 2208 | 1.1 | 0.1 | 138 | 2.2 | 0.0 | 472 | 0.9 | 0.2 | 514 | 1.6 | 0.0 | 808 | 0.7 | 0.1 | 250 | 1.2 | 0.0 | 26 | 0.0 | 0.0 |
| 37 | 2019-09-14 | 2631 | 0.9 | 0.2 | 162 | 0.0 | 0.0 | 612 | 0.3 | 0.5 | 668 | 0.2 | 0.3 | 929 | 0.5 | 0.0 | 248 | 6.5 | 0.0 | 12 | 0.0 | 0.0 |
| 38 | 2019-09-21 | 3039 | 1.0 | 0.2 | 149 | 0.0 | 0.0 | 730 | 0.4 | 0.1 | 726 | 0.4 | 0.3 | 1090 | 1.1 | 0.3 | 325 | 3.4 | 0.0 | 19 | 0.0 | 0.0 |
| 39 | 2019-09-28 | 3355 | 1.0 | 0.1 | 219 | 0.0 | 0.5 | 870 | 0.3 | 0.0 | 792 | 0.4 | 0.1 | 1141 | 0.9 | 0.1 | 308 | 4.2 | 0.0 | 25 | 20.0 | 0.0 |
| 40 | 2019-10-05 | 3688 | 1.2 | 0.1 | 254 | 0.0 | 0.0 | 1009 | 0.4 | 0.0 | 823 | 0.4 | 0.2 | 1002 | 1.0 | 0.0 | 546 | 4.6 | 0.0 | 54 | 1.9 | 0.0 |
Positive Respiratory synctial virus tests
Figure 3: Positive Respiratory syncytial virus (RSV) Tests (%) in Canada by Region by Week of Report
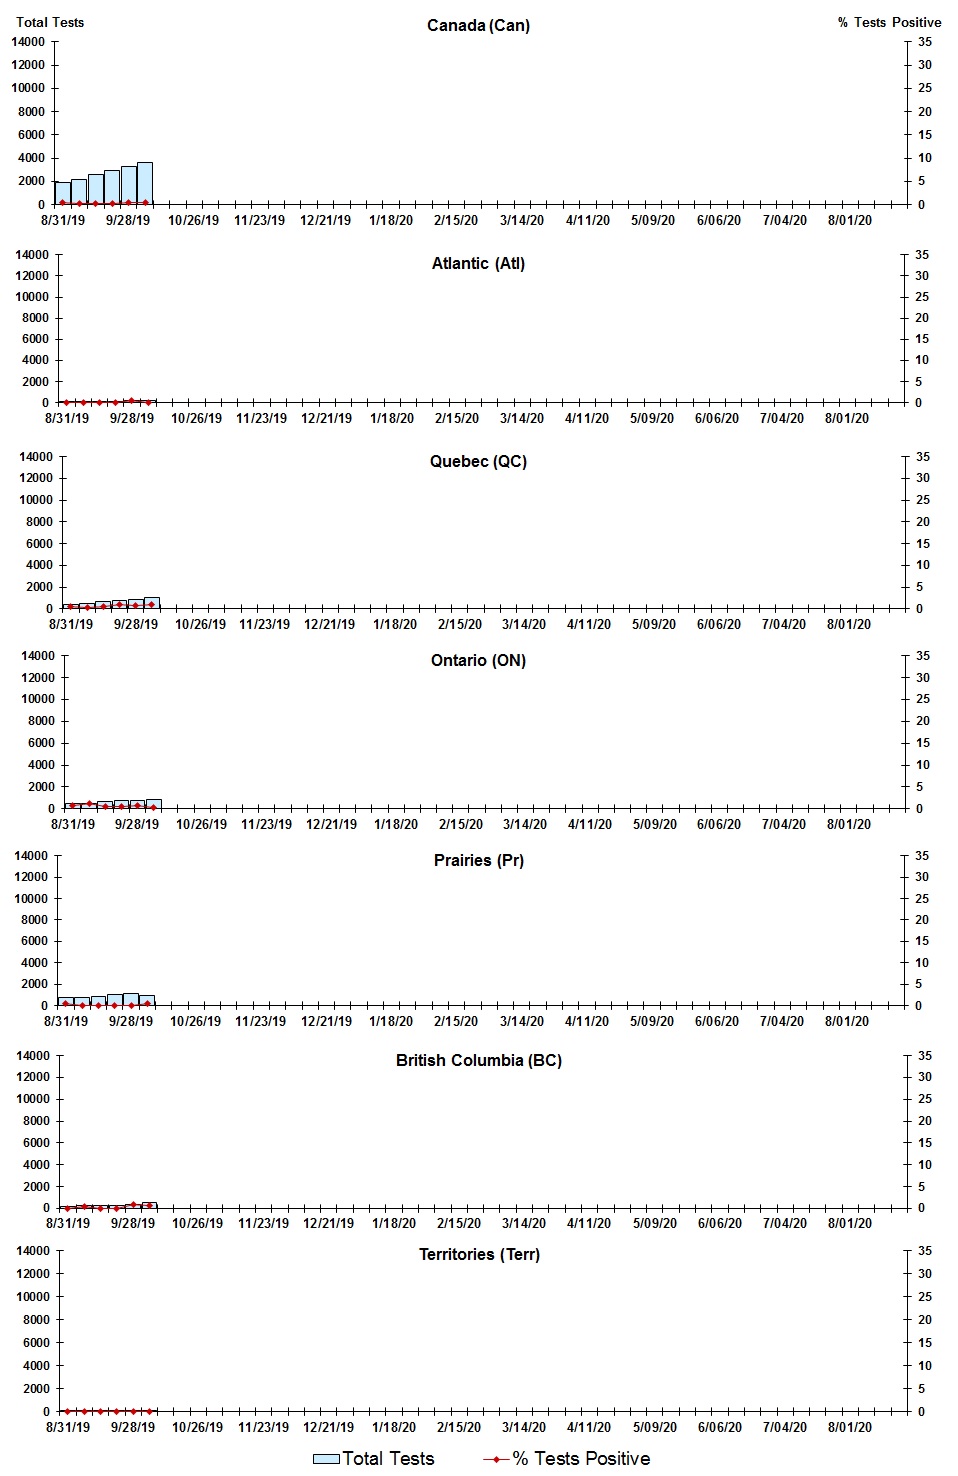
Figure 3: Positive Respiratory syncytial virus (RSV) Tests (%) in Canada by Region by Week of Report - Text description
| Week | Week end | Can Tests | RSV % |
Atl Tests | RSV % |
QC Tests | RSV % |
ON Tests | RSV % |
Pr Tests | RSV % |
BC Tests | RSV % |
Terr Tests | RSV % |
|---|---|---|---|---|---|---|---|---|---|---|---|---|---|---|---|
| 35 | 2019-08-31 | 1948 | 0.4 | 95 | 0.0 | 399 | 0.5 | 466 | 0.6 | 756 | 0.4 | 202 | 0.0 | 30 | 0.0 |
| 36 | 2019-09-07 | 2191 | 0.4 | 139 | 0.0 | 481 | 0.2 | 512 | 1.2 | 783 | 0.0 | 250 | 0.4 | 26 | 0.0 |
| 37 | 2019-09-14 | 2619 | 0.3 | 162 | 0.0 | 643 | 0.6 | 668 | 0.5 | 886 | 0.1 | 248 | 0.0 | 12 | 0.0 |
| 38 | 2019-09-21 | 2936 | 0.4 | 149 | 0.0 | 744 | 0.9 | 726 | 0.6 | 1025 | 0.0 | 273 | 0.0 | 19 | 0.0 |
| 39 | 2019-09-28 | 3306 | 0.5 | 219 | 0.5 | 882 | 0.8 | 792 | 0.8 | 1081 | 0.1 | 308 | 1.0 | 24 | 0.0 |
| 40 | 2019-10-05 | 3602 | 0.6 | 257 | 0.0 | 1018 | 1.0 | 823 | 0.4 | 920 | 0.4 | 530 | 0.6 | 54 | 0.0 |
Positive Parainfluenza tests
Figure 4: Positive Parainfluenza (PIV) Tests (%) in Canada by Region by Week of Report
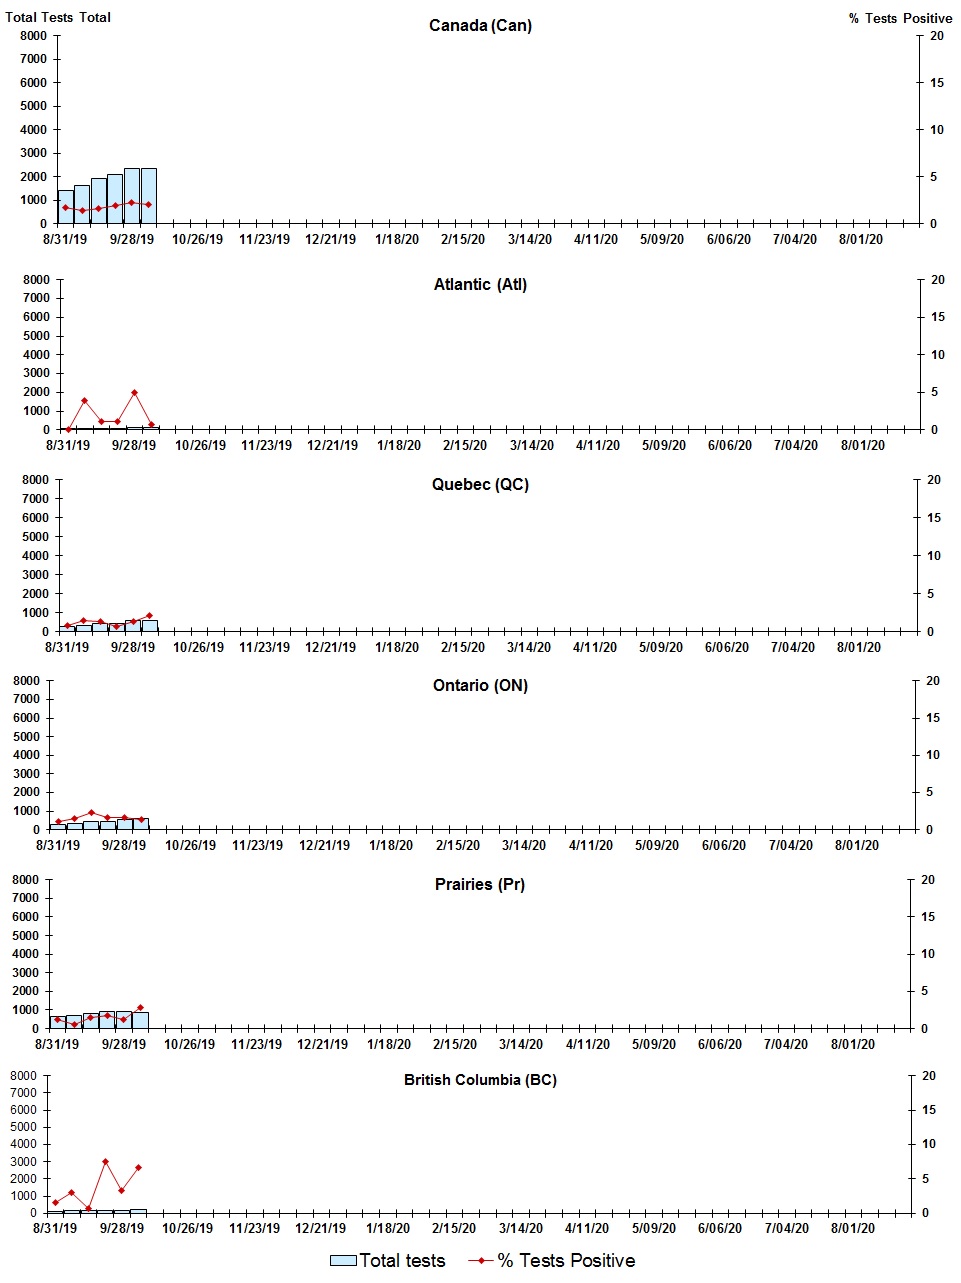
Figure 4: Positive Parainfluenza (PIV) Tests (%) in Canada by Region by Week of Report - Text description
| Week | Week End | Canada Tests | PIV % |
Atl Tests | PIV % |
QC Tests | PIV % |
ON Tests | PIV % |
Pr Tests | PIV % |
BC Tests | PIV % |
|---|---|---|---|---|---|---|---|---|---|---|---|---|---|
| 35 | 2019-08-31 | 1389 | 1.7 | 74 | 0.0 | 252 | 0.8 | 276 | 1.1 | 633 | 1.3 | 124 | 1.6 |
| 36 | 2019-09-07 | 1633 | 1.4 | 76 | 4.0 | 345 | 1.5 | 339 | 1.5 | 683 | 0.6 | 164 | 3.1 |
| 37 | 2019-09-14 | 1936 | 1.6 | 87 | 1.2 | 453 | 1.3 | 437 | 2.3 | 787 | 1.5 | 160 | 0.6 |
| 38 | 2019-09-21 | 2085 | 1.9 | 89 | 1.1 | 458 | 0.7 | 468 | 1.7 | 894 | 1.8 | 160 | 7.5 |
| 39 | 2019-09-28 | 2348 | 2.3 | 121 | 5.0 | 566 | 1.4 | 535 | 1.7 | 924 | 1.2 | 178 | 3.4 |
| 40 | 2019-10-05 | 2365 | 2.0 | 145 | 0.7 | 594 | 2.2 | 584 | 1.4 | 836 | 2.9 | 197 | 6.6 |
Positive Adenovirus tests
Figure 5: Positive Adenovirus (adeno) Tests (%) in Canada by Region by Week of Report
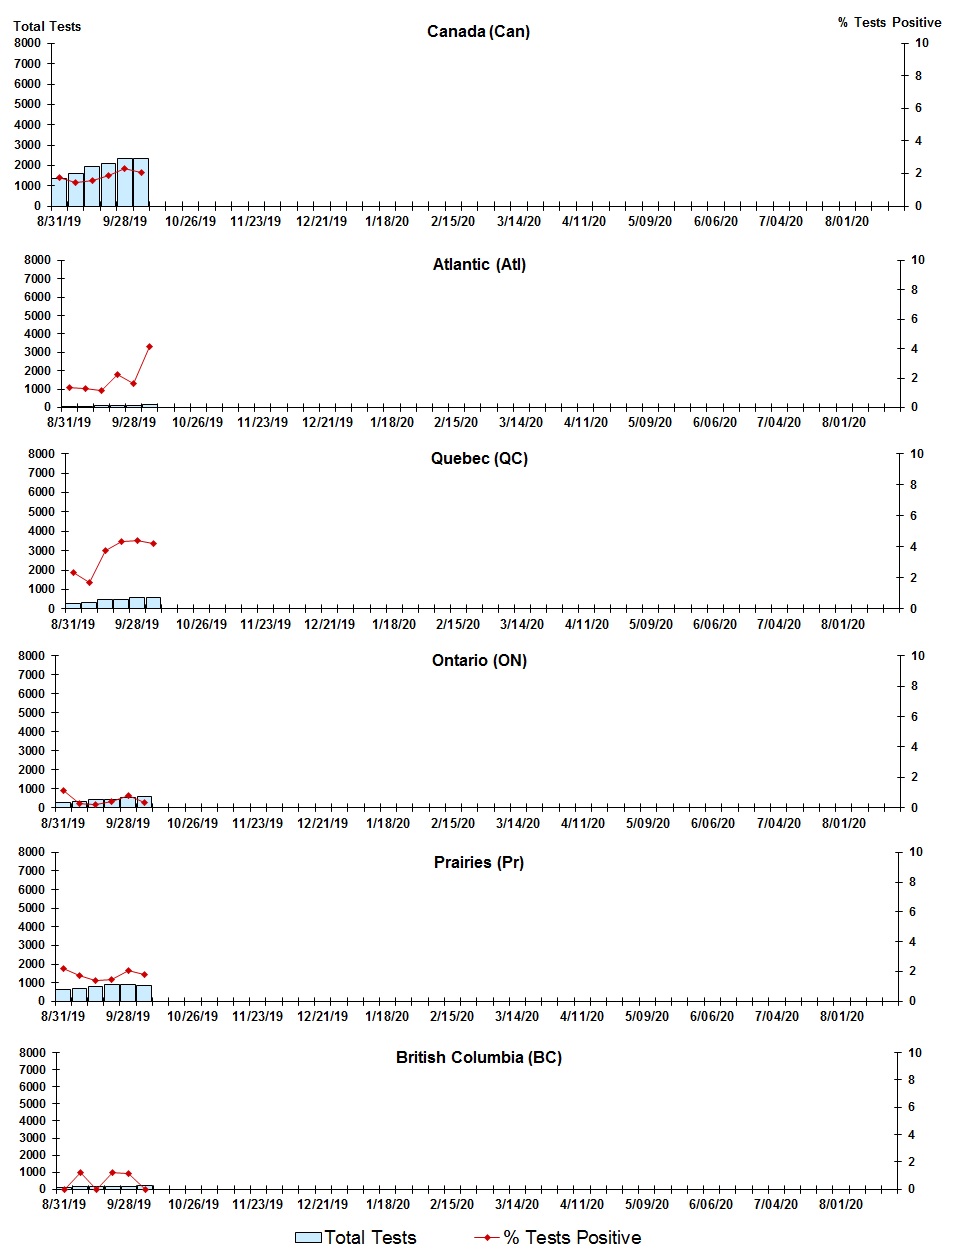
Figure 5: Positive Adenovirus (adeno) Tests (%) in Canada by Region by Week of Report - Text description
| Week | Week End | Can Tests | Adeno % |
Atl Tests | Adeno % |
QC Tests | Adeno % |
ON Tests | Adeno % |
Pr Tests | Adeno % |
BC Tests | Adeno % |
|---|---|---|---|---|---|---|---|---|---|---|---|---|---|
| 35 | 2019-08-31 | 1377 | 1.7 | 74 | 1.4 | 255 | 2.4 | 261 | 1.2 | 633 | 2.2 | 124 | 0.0 |
| 36 | 2019-09-07 | 1622 | 1.4 | 76 | 1.3 | 348 | 1.7 | 325 | 0.3 | 683 | 1.8 | 164 | 1.2 |
| 37 | 2019-09-14 | 1924 | 1.6 | 87 | 1.2 | 453 | 3.8 | 425 | 0.2 | 787 | 1.4 | 160 | 0.0 |
| 38 | 2019-09-21 | 2072 | 1.9 | 89 | 2.3 | 463 | 4.3 | 450 | 0.4 | 894 | 1.5 | 160 | 1.3 |
| 39 | 2019-09-28 | 2329 | 2.3 | 121 | 1.7 | 566 | 4.4 | 516 | 0.8 | 924 | 2.1 | 178 | 1.1 |
| 40 | 2019-10-05 | 2349 | 2.0 | 145 | 4.1 | 595 | 4.2 | 567 | 0.4 | 836 | 1.8 | 197 | 0.0 |
Positive Human metapneumovirus tests
Figure 6: Positive human metapneumovirus (hMPV) Tests (%) in Canada by Region by Week of Report
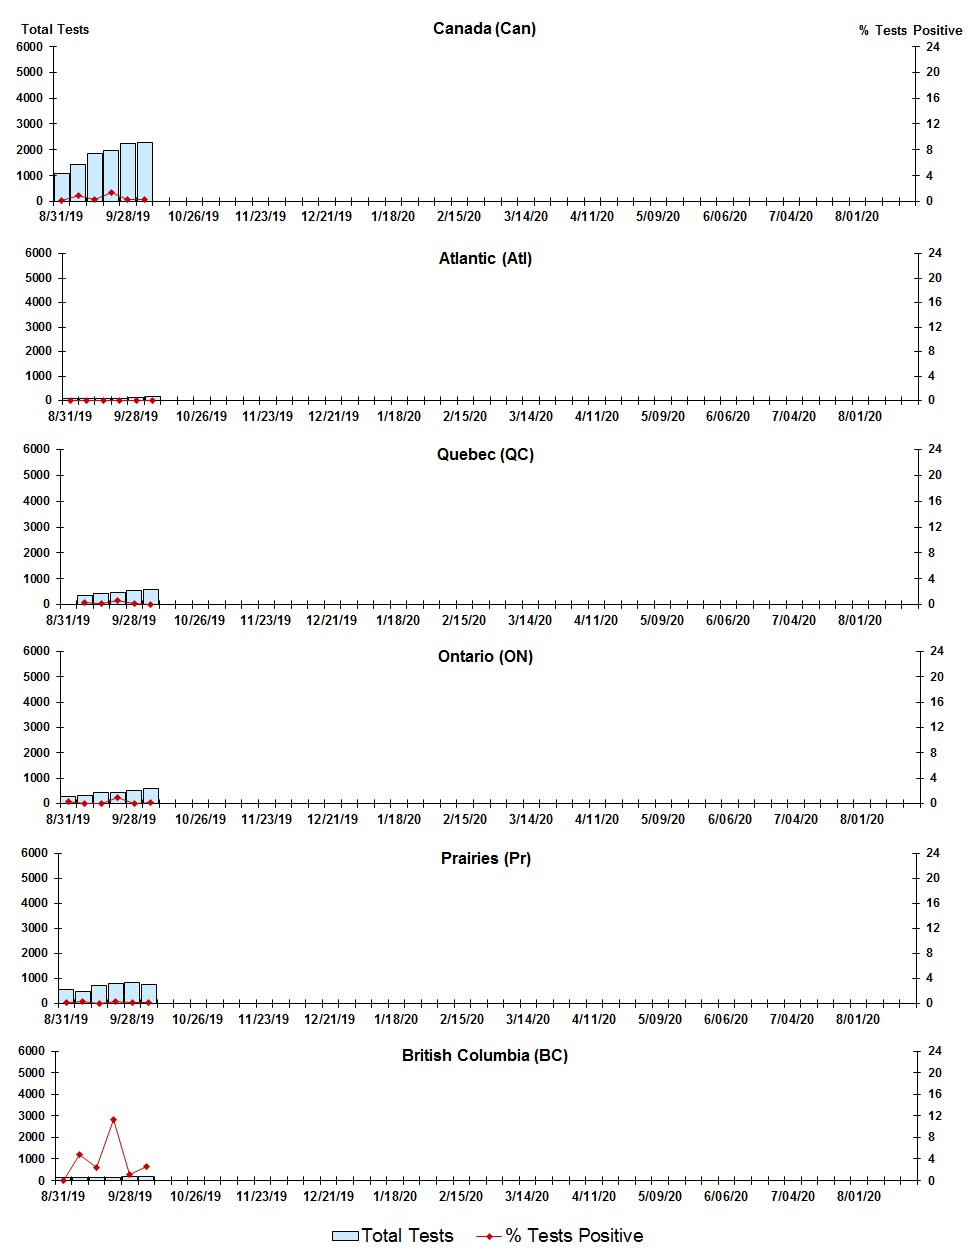
Figure 6: Positive human metapneumovirus (hMPV) Tests (%) in Canada by Region by Week of Report - Text description
| Week | Week End | Can Tests | hMPV % |
Atl Tests | hMPV % |
QC Tests | hMPV % |
ON Tests | hMPV % |
Pr Tests | hMPV % |
BC Tests | hMPV % |
|---|---|---|---|---|---|---|---|---|---|---|---|---|---|
| 35 | 2019-08-31 | 1069 | 0.2 | 74 | 0.0 | #N/A | #N/A | 264 | 0.4 | 577 | 0.2 | 124 | 0.0 |
| 36 | 2019-09-07 | 1424 | 0.8 | 76 | 0.0 | 338 | 0.3 | 322 | 0.0 | 498 | 0.4 | 164 | 4.9 |
| 37 | 2019-09-14 | 1851 | 0.3 | 87 | 0.0 | 445 | 0.2 | 424 | 0.0 | 723 | 0.0 | 160 | 2.5 |
| 38 | 2019-09-21 | 1960 | 1.4 | 89 | 0.0 | 452 | 0.7 | 450 | 0.9 | 793 | 0.4 | 160 | 11.3 |
| 39 | 2019-09-28 | 2228 | 0.3 | 121 | 0.0 | 548 | 0.2 | 531 | 0.0 | 826 | 0.2 | 178 | 1.1 |
| 40 | 2019-10-05 | 2278 | 0.3 | 145 | 0.0 | 582 | 0.0 | 573 | 0.2 | 772 | 0.1 | 197 | 2.5 |
Positive Enterovirus/Rhinovirus tests
Figure 7: Positive Enterovirus/Rhinovirus (entero/rhino) Tests (%) in Canada by Region by Week of Report
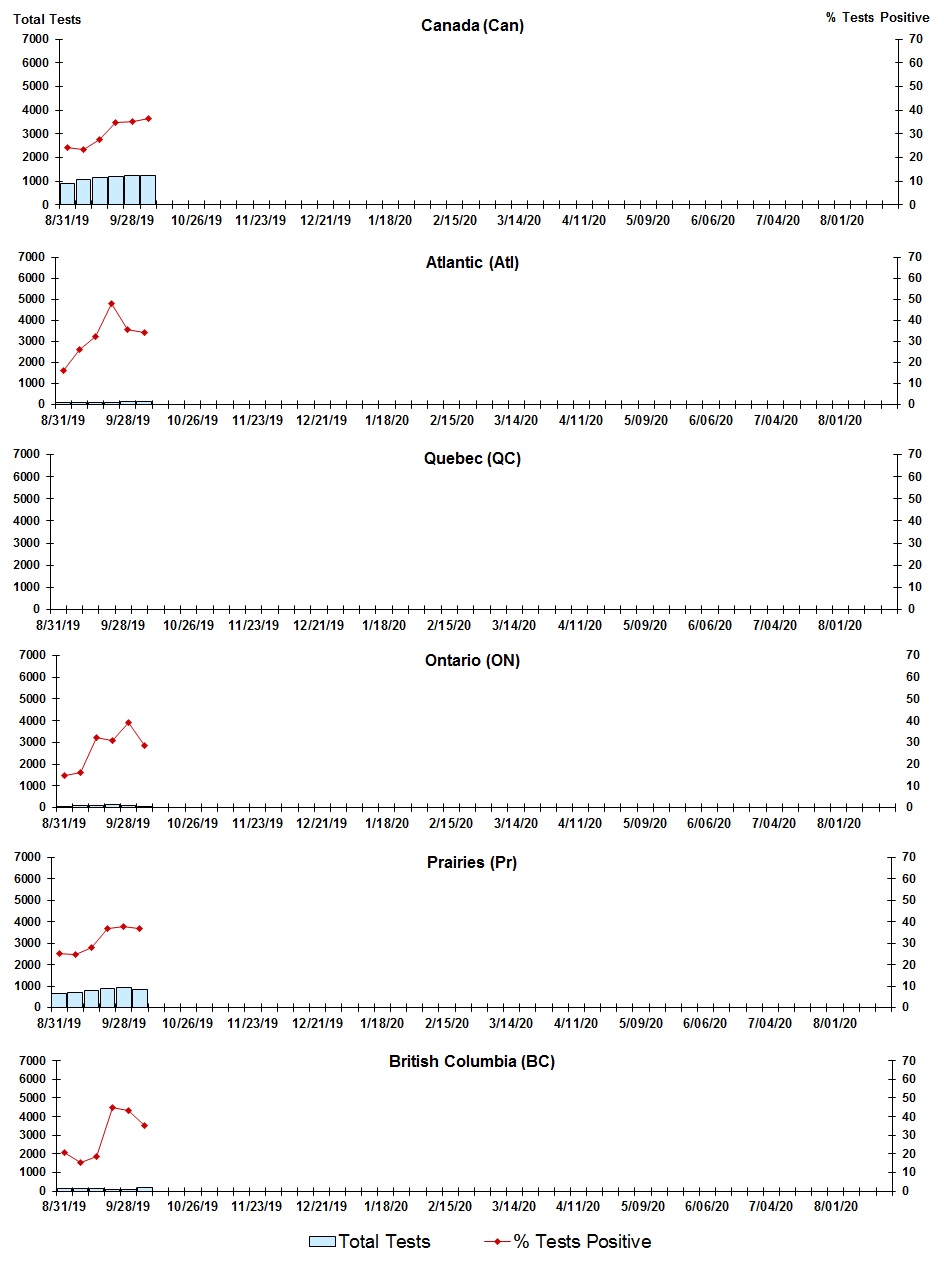
Figure 7: Positive Enterovirus/Rhinovirus (entero/rhino) Tests (%) in Canada by Region by Week of Report - Text description
| Week | Week End | Canada Tests | Entero/rhino % |
Atl Tests | Entero/rhino % |
QC Tests | Entero/rhino % |
ON Tests | Entero/rhino % |
Pr Tests | Entero/rhino % |
BC Tests | Entero/rhino % |
|---|---|---|---|---|---|---|---|---|---|---|---|---|---|
| 35 | 2019-08-31 | 907 | 24.4 | 74 | 16.2 | #N/A | #N/A | 54 | 14.8 | 633 | 25.1 | 116 | 20.7 |
| 36 | 2019-09-07 | 1047 | 23.3 | 76 | 26.3 | #N/A | #N/A | 107 | 15.9 | 683 | 24.6 | 155 | 15.5 |
| 37 | 2019-09-14 | 1139 | 27.7 | 87 | 32.2 | #N/A | #N/A | 106 | 32.1 | 787 | 27.8 | 147 | 18.4 |
| 38 | 2019-09-21 | 1207 | 34.9 | 89 | 48.3 | #N/A | #N/A | 130 | 30.8 | 894 | 36.7 | 78 | 44.7 |
| 39 | 2019-09-28 | 1255 | 35.4 | 121 | 35.5 | #N/A | #N/A | 115 | 39.1 | 924 | 37.7 | 71 | 43.0 |
| 40 | 2019-10-05 | 1238 | 36.4 | 145 | 34.5 | #N/A | #N/A | 67 | 28.4 | 836 | 37.1 | 181 | 35.4 |
Positive Coronovirus tests
Figure 8: Positive Coronavirus (coron) Tests (%) in Canada by Region by Week of Report
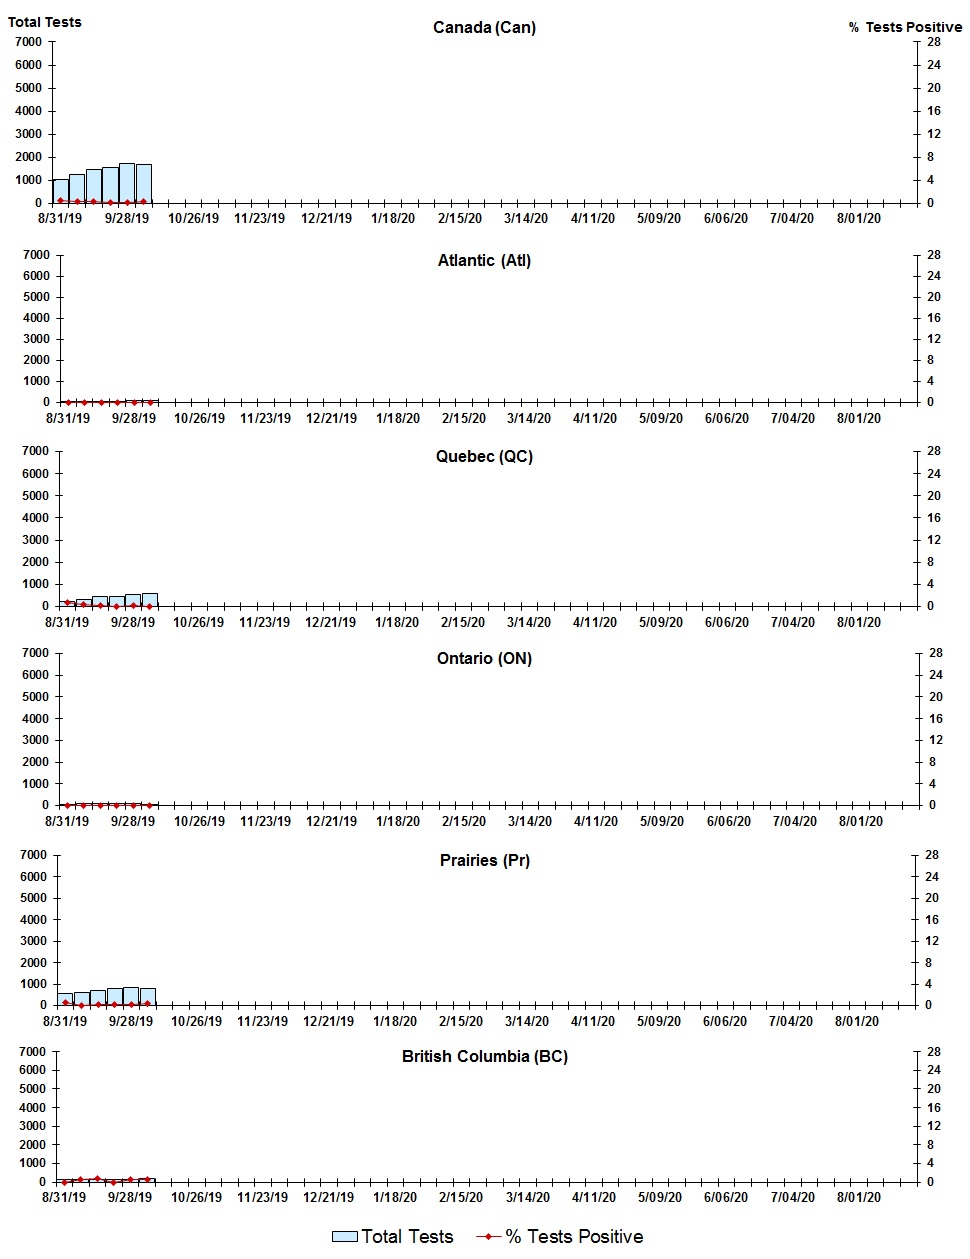
Figure 8: Positive Coronavirus (coron) Tests (%) in Canada by Region by Week of Report - Text description
| Week | Week End | Canada Tests | Coron % |
Atl Tests | Coron % |
QC Tests | Coron % |
ON Tests | Coron % |
Pr Tests | Coron % |
BC Tests | Coron % |
|---|---|---|---|---|---|---|---|---|---|---|---|---|---|
| 35 | 2019-08-31 | 1043 | 0.5 | 38 | 0.0 | 246 | 0.8 | 36 | 0.0 | 577 | 0.5 | 116 | 0.0 |
| 36 | 2019-09-07 | 1257 | 0.2 | 46 | 0.0 | 338 | 0.3 | 87 | 0.0 | 605 | 0.0 | 155 | 0.7 |
| 37 | 2019-09-14 | 1464 | 0.2 | 54 | 0.0 | 444 | 0.2 | 84 | 0.0 | 723 | 0.1 | 147 | 0.7 |
| 38 | 2019-09-21 | 1567 | 0.1 | 42 | 0.0 | 452 | 0.0 | 105 | 0.0 | 793 | 0.1 | 159 | 0.0 |
| 39 | 2019-09-28 | 1735 | 0.2 | 74 | 0.0 | 548 | 0.2 | 101 | 0.0 | 823 | 0.1 | 165 | 0.6 |
| 40 | 2019-10-05 | 1680 | 0.2 | 79 | 0.0 | 582 | 0.0 | 56 | 0.0 | 772 | 0.4 | 182 | 0.6 |
Page details
- Date modified: