
Respiratory Virus Report, week 4 ending January 25, 2020
Download the alternative format
(PDF format, 1.3 MB, 11 pages)
Organization: Public Health Agency of Canada
On this page
- List of abbreviations
- Respiratory Virus Detections and Isolations
- Number of positive laboratory tests for other respiratory viruses
- Positive Influenza tests
- Positive Respiratory synctial virus tests
- Positive Parainfluenza tests
- Positive Adenovirus tests
- Positive Human metapneumovirus tests
- Positive Enterovirus/Rhinovirus tests
- Positive Coronovirus tests
List of abbreviations
- A(H1N1)pdm09
- Influenza A(H1N1)pdm09
- A(H3)
- Influenza A(H3N2)
- A (UnS)
- Influenza A (Unsubtyped)
- Adeno
- Adenovirus
- CHEO
- Children's Hospital of Eastern Ontario
- Coron
- Coronavirus
- Entero
- Enterovirus
- hMPV
- human metapneumovirus
- HSC
- Health Sciences Centre
- N.A
- Not Applicable
- P.H.L.
- Public Health Laboratory
- P.H.O.L.
- Public Health Ontario Laboratory
- PIV
- Parainfluenza
- Rhino
- Rhinovirus
- RSV
- Respiratory syncytial virus
- UHN
- University Health Network
Respiratory Virus Detections and Isolations
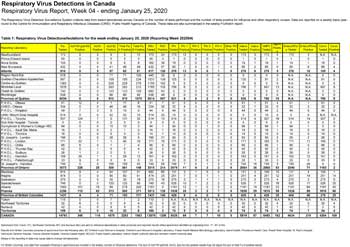
Table 1: Respiratory Virus Detections/Isolations for the week ending January 25, 2020 (Reporting Week 202004)
| Reporting Laboratory | Flu Tested | A(H1N1)pdm09 Positive | A(H3) Positive | A(UnS) Positive | Total Flu A Positive | Total Flu B Positive | RSV Tested | RSV Positive | PIV Tested | PIV 1 Positive | PIV 2 Positive | PIV 3 Positive | PIV 4 Positive | Other PIV Positive | Adeno Tested | Adeno Positive | hMPV Tested | hMPV Positive | Entero/Rhino Tested | Entero/Rhino Positive | Coron Tested | Coron Positive |
|---|---|---|---|---|---|---|---|---|---|---|---|---|---|---|---|---|---|---|---|---|---|---|
| Newfoundland | 173 | 0 | 0 | 5 | 5 | 12 | 173 | 24 | 173 | 12 | 0 | 0 | 0 | 0 | 173 | 3 | 173 | 4 | 173 | 3 | N.A. | N.A. |
| Prince Edward Island | 50 | 0 | 0 | 5 | 5 | 3 | 50 | 3 | 1 | 0 | 0 | 0 | 0 | 0 | 1 | 0 | 1 | 0 | 1 | 0 | 1 | 0 |
| Nova Scotia | 155 | 0 | 0 | 6 | 6 | 8 | 162 | 36 | 19 | 0 | 0 | 0 | 0 | 0 | 19 | 1 | 19 | 1 | 19 | 1 | 19 | 0 |
| New Brunswick | 432 | 0 | 5 | 41 | 46 | 58 | 432 | 57 | 85 | 1 | 0 | 0 | 1 | 0 | 85 | 2 | 85 | 0 | 85 | 6 | 85 | 4 |
| Atlantic | 810 | 0 | 5 | 57 | 62 | 81 | 817 | 120 | 278 | 13 | 0 | 0 | 1 | 0 | 278 | 6 | 278 | 5 | 278 | 10 | 105 | 4 |
| Région Nord-Est | 518 | 0 | 0 | 71 | 71 | 130 | 445 | 30 | 0 | 0 | 0 | 0 | 0 | 0 | 0 | 0 | 0 | 0 | N.A. | N.A. | 0 | 0 |
| Québec-Chaudière-Appalaches | 997 | 0 | 0 | 109 | 109 | 234 | 1031 | 159 | 125 | 0 | 0 | 0 | 0 | 0 | 130 | 1 | 91 | 2 | N.A. | N.A. | 91 | 0 |
| Centre-du-Québec | 1363 | 0 | 0 | 228 | 228 | 279 | 1155 | 162 | 0 | 0 | 0 | 0 | 0 | 0 | 0 | 0 | 0 | 0 | N.A. | N.A. | 0 | 0 |
| Montréal-Laval | 1876 | 0 | 0 | 293 | 293 | 212 | 1765 | 105 | 706 | 6 | 0 | 2 | 0 | 0 | 706 | 7 | 697 | 13 | N.A. | N.A. | 697 | 8 |
| Ouest du Québec | 742 | 0 | 0 | 123 | 123 | 129 | 680 | 93 | 0 | 0 | 0 | 0 | 0 | 0 | 0 | 0 | 0 | 0 | N.A. | N.A. | 0 | 0 |
| Montérégie | 538 | 0 | 0 | 86 | 86 | 95 | 538 | 48 | 0 | 0 | 0 | 0 | 0 | 0 | 0 | 0 | 0 | 0 | N.A. | N.A. | 0 | 0 |
| Province of Québec | 6034 | 0 | 0 | 910 | 910 | 1079 | 5614 | 597 | 831 | 6 | 0 | 2 | 0 | 0 | 836 | 8 | 788 | 15 | N.A. | N.A. | 788 | 8 |
| P.H.O.L. - Ottawa | 51 | 12 | 4 | 1 | 17 | 6 | 51 | 7 | 51 | 0 | 0 | 0 | 0 | 0 | 51 | 1 | 51 | 4 | 51 | 1 | 51 | 0 |
| CHEO - Ottawa | 334 | 0 | 0 | 46 | 46 | 16 | 334 | 30 | 32 | 4 | 0 | 0 | 0 | 0 | 32 | 1 | 32 | 0 | 32 | 3 | 32 | 2 |
| P.H.O.L. - Kingston | 49 | 7 | 3 | 0 | 10 | 0 | 44 | 9 | 44 | 0 | 0 | 0 | 0 | 0 | 44 | 0 | 44 | 2 | 44 | 0 | 44 | 0 |
| UHN / Mount Sinai Hospital | 514 | 0 | 0 | 52 | 52 | 10 | 514 | 20 | 15 | 0 | 0 | 0 | 0 | 0 | 0 | 0 | 15 | 0 | 0 | 0 | N.A. | N.A. |
| P.H.O.L. - Toronto | 557 | 124 | 7 | 0 | 131 | 35 | 514 | 13 | 514 | 0 | 0 | 0 | 0 | 0 | 514 | 4 | 507 | 18 | 514 | 14 | 507 | 0 |
| Sick Kids Hospital - Toronto | 0 | 0 | 0 | 0 | 0 | 0 | 0 | 0 | 0 | 0 | 0 | 0 | 0 | 0 | 0 | 0 | 0 | 0 | 0 | 0 | 0 | 0 |
| Sunnybrook & Women's College HSC | 94 | 0 | 0 | 10 | 10 | 3 | 94 | 1 | 94 | 0 | 0 | 1 | 0 | 0 | 94 | 1 | 94 | 1 | 94 | 1 | 0 | 0 |
| P.H.O.L. - Sault Ste. Marie | 16 | 1 | 0 | 0 | 1 | 0 | 16 | 1 | 16 | 0 | 0 | 0 | 0 | 0 | 16 | 2 | 16 | 1 | 16 | 0 | 16 | 0 |
| P.H.O.L. - Timmins | 16 | 5 | 0 | 0 | 5 | 0 | 14 | 1 | 14 | 0 | 0 | 0 | 0 | 0 | 14 | 0 | 14 | 0 | 14 | 0 | 14 | 0 |
| St. Joseph's - London | 186 | 0 | 0 | 38 | 38 | 5 | 186 | 31 | 50 | 0 | 0 | 1 | 2 | 0 | 50 | 0 | 50 | 2 | 26 | 2 | 26 | 0 |
| P.H.O.L. - London | 171 | 32 | 7 | 1 | 40 | 10 | 171 | 15 | 171 | 0 | 0 | 0 | 0 | 0 | 171 | 3 | 165 | 5 | 171 | 11 | 165 | 0 |
| P.H.O.L. - Orillia | 66 | 6 | 0 | 1 | 7 | 4 | 66 | 6 | 66 | 0 | 0 | 0 | 0 | 0 | 66 | 2 | 66 | 1 | 66 | 0 | 66 | 0 |
| P.H.O.L. - Thunder Bay | 42 | 5 | 1 | 0 | 6 | 4 | 42 | 0 | 42 | 0 | 0 | 0 | 0 | 0 | 42 | 0 | 42 | 2 | 42 | 2 | 42 | 0 |
| P.H.O.L. - Sudbury | 26 | 1 | 2 | 0 | 3 | 1 | 26 | 5 | 26 | 0 | 0 | 0 | 0 | 0 | 26 | 0 | 26 | 0 | 26 | 0 | 26 | 0 |
| P.H.O.L. - Hamilton | 169 | 26 | 1 | 1 | 28 | 12 | 161 | 6 | 162 | 0 | 0 | 0 | 0 | 0 | 162 | 5 | 161 | 5 | 162 | 12 | 161 | 0 |
| P.H.O.L. - Peterborough | 33 | 9 | 0 | 0 | 9 | 0 | 33 | 0 | 33 | 0 | 0 | 0 | 0 | 0 | 33 | 1 | 33 | 3 | 33 | 0 | 33 | 0 |
| St. Joseph's - Hamilton | 749 | 0 | 0 | 158 | 158 | 43 | 749 | 69 | 749 | 7 | 0 | 1 | 0 | 0 | 749 | 16 | 749 | 9 | 749 | 25 | 0 | 0 |
| Province of Ontario | 3073 | 228 | 25 | 308 | 561 | 149 | 3015 | 214 | 2079 | 11 | 0 | 3 | 2 | 0 | 2064 | 36 | 2065 | 53 | 2040 | 71 | 1183 | 2 |
| Manitoba | 914 | 9 | 4 | 94 | 107 | 91 | 882 | 85 | 131 | 3 | 1 | 0 | 0 | 0 | 131 | 3 | 109 | 10 | 131 | 4 | 109 | 1 |
| Regina | 474 | 0 | 0 | 90 | 90 | 61 | 474 | 25 | 251 | 7 | 0 | 1 | 1 | 0 | 251 | 4 | 251 | 12 | 251 | 14 | 251 | 14 |
| Saskatoon | 275 | 0 | 0 | 30 | 30 | 19 | 275 | 18 | 275 | 3 | 1 | 1 | 1 | 0 | 275 | 3 | 275 | 4 | 275 | 3 | 275 | 6 |
| Saskatchewan | 749 | 0 | 0 | 120 | 120 | 80 | 749 | 43 | 526 | 10 | 1 | 2 | 2 | 0 | 526 | 7 | 526 | 16 | 526 | 17 | 526 | 20 |
| Alberta | 1593 | 101 | 78 | 99 | 278 | 200 | 1181 | 0 | 1181 | 12 | 1 | 0 | 5 | 0 | 1181 | 19 | 1181 | 33 | 1181 | 64 | 1181 | 45 |
| Prairies | 3256 | 110 | 82 | 313 | 505 | 371 | 2812 | 128 | 1838 | 25 | 3 | 2 | 7 | 0 | 1838 | 29 | 1816 | 59 | 1838 | 85 | 1816 | 66 |
| Province of British Columbia | 1431 | 4 | 4 | 71 | 193 | 177 | 1431 | 145 | 429 | 9 | 4 | 0 | 0 | 5 | 429 | 8 | 429 | 25 | 404 | 45 | 278 | 25 |
| Yukon | 115 | 0 | 0 | 7 | 7 | 2 | 115 | 0 | N.A. | N.A. | N.A. | N.A. | N.A. | N.A. | N.A. | N.A. | N.A. | N.A. | N.A. | N.A. | N.A. | N.A. |
| Northwest Territories | 32 | 6 | 0 | 0 | 6 | 4 | 32 | 0 | 32 | 0 | 0 | 0 | 0 | 0 | 32 | 0 | 32 | 4 | 32 | 0 | 32 | 4 |
| Nunavut | 42 | 0 | 0 | 9 | 9 | 0 | 42 | 2 | 42 | 5 | 0 | 0 | 0 | 0 | 42 | 0 | 42 | 1 | 42 | 7 | 2 | 0 |
| Territories | 189 | 6 | 0 | 16 | 22 | 6 | 189 | 2 | 74 | 5 | 0 | 0 | 0 | 0 | 74 | 0 | 74 | 5 | 74 | 7 | 34 | 4 |
| CANADA | 14793 | 348 | 116 | 1675 | 2253 | 1863 | 13878 | 1206 | 5529 | 69 | 7 | 7 | 10 | 5 | 5519 | 87 | 5450 | 162 | 4634 | 218 | 4204 | 109 |
|
Specimens from Yukon (YT), Northwest Territories (NT) and Nunavit (NU) are sent to reference laboratories in other provinces and reported results reflect specimens identified as originating from YT, NT or NU. Results from British Columbia comprise of specimens from the following sites: BC Children's and Women's Hospital, Children's and Women's Hospital Laboratory, Fraser Health Medical Microbiology Laboratory, Island Health, Providence Health Care, Powell River Hospital, St. Paul's Hospital, Vancouver General Hospital, Victoria General Hospital, Victoria Coastal Health, BCCDC Public Health Laboratory, Interior Health Authority sites and Northern Health Authority sites. Delays in the reporting of data may cause data to change retrospectively. For British Columbia, only data from subtyped influenza A specimens are included in the weekly number of influenza detections. The sum of A(H1N1)pdm09, A(H3), and A(UnS) positive results may not equal the sum of total Flu A positive results. |
||||||||||||||||||||||
Table 2: Respiratory Virus Detections/Isolations for the period August 25, 2019 - January 25, 2020 (Reporting Weeks 201935-202004)
| Reporting Laboratory | Flu Tested | A(H1N1)pdm09 Positive | A(H3) Positive | A(UnS) Positive | Total Flu A Positive | Total Flu B Positive | RSV Tested | RSV Positive | PIV Tested | PIV 1 Positive | PIV 2 Positive | PIV 3 Positive | PIV 4 Positive | Other PIV Positive | Adeno Tested | Adeno Positive | hMPV Tested | hMPV Positive | Entero/Rhino Tested | Entero/Rhino Positive | Coron Tested | Coron Positive |
|---|---|---|---|---|---|---|---|---|---|---|---|---|---|---|---|---|---|---|---|---|---|---|
| Newfoundland | 2002 | 4 | 24 | 28 | 56 | 45 | 2002 | 147 | 2002 | 95 | 0 | 3 | 0 | 0 | 2002 | 71 | 2002 | 17 | 2002 | 278 | N.A. | N.A. |
| Prince Edward Island | 466 | 0 | 0 | 15 | 15 | 15 | 466 | 15 | 29 | 1 | 0 | 0 | 0 | 0 | 29 | 0 | 27 | 0 | 29 | 15 | 29 | 0 |
| Nova Scotia | 1521 | 0 | 0 | 38 | 38 | 31 | 1546 | 109 | 366 | 13 | 1 | 2 | 5 | 0 | 371 | 7 | 371 | 3 | 371 | 70 | 381 | 4 |
| New Brunswick | 4753 | 23 | 14 | 160 | 197 | 269 | 4694 | 526 | 1385 | 42 | 3 | 0 | 9 | 0 | 1385 | 48 | 1385 | 3 | 1385 | 234 | 1385 | 13 |
| Atlantic | 8742 | 27 | 38 | 241 | 306 | 360 | 8708 | 797 | 3782 | 151 | 4 | 5 | 14 | 0 | 3787 | 126 | 3785 | 23 | 3787 | 597 | 1795 | 17 |
| Région Nord-Est | 3126 | 0 | 0 | 227 | 227 | 307 | 2610 | 102 | 0 | 0 | 0 | 0 | 0 | 0 | 0 | 0 | 0 | 0 | N.A. | N.A. | 0 | 0 |
| Québec-Chaudière-Appalaches | 6379 | 0 | 0 | 518 | 518 | 533 | 6757 | 546 | 1877 | 24 | 4 | 2 | 12 | 0 | 1915 | 69 | 1554 | 5 | N.A. | N.A. | 1552 | 23 |
| Centre-du-Québec | 9457 | 0 | 0 | 1393 | 1393 | 1123 | 7904 | 623 | 0 | 0 | 0 | 0 | 0 | 0 | 0 | 0 | 0 | 0 | N.A. | N.A. | 0 | 0 |
| Montréal-Laval | 23619 | 0 | 0 | 2174 | 2174 | 1662 | 22932 | 1406 | 11772 | 125 | 4 | 12 | 12 | 0 | 11772 | 404 | 11321 | 70 | N.A. | N.A. | 11631 | 176 |
| Ouest du Québec | 6988 | 0 | 0 | 762 | 762 | 863 | 6525 | 582 | 0 | 0 | 0 | 0 | 0 | 0 | 0 | 0 | 0 | 0 | N.A. | N.A. | 0 | 0 |
| Montérégie | 5245 | 0 | 0 | 600 | 600 | 440 | 5150 | 398 | 0 | 0 | 0 | 0 | 0 | 0 | 0 | 0 | 0 | 0 | N.A. | N.A. | 0 | 0 |
| Province of Québec | 54814 | 0 | 0 | 5674 | 5674 | 4928 | 51878 | 3657 | 13649 | 149 | 8 | 14 | 24 | 0 | 13687 | 473 | 12875 | 75 | N.A. | N.A. | 13183 | 199 |
| P.H.O.L. - Ottawa | 749 | 42 | 49 | 1 | 92 | 36 | 740 | 45 | 715 | 2 | 0 | 0 | 0 | 0 | 715 | 8 | 704 | 16 | 559 | 51 | 547 | 0 |
| CHEO - Ottawa | 4496 | 1 | 0 | 339 | 340 | 171 | 4496 | 437 | 566 | 5 | 0 | 4 | 7 | 5 | 566 | 11 | 566 | 6 | 569 | 125 | 557 | 18 |
| P.H.O.L. - Kingston | 528 | 27 | 16 | 0 | 43 | 7 | 513 | 36 | 509 | 1 | 0 | 0 | 0 | 0 | 509 | 14 | 501 | 18 | 340 | 39 | 328 | 0 |
| UHN / Mount Sinai Hospital | 6737 | 7 | 0 | 522 | 529 | 93 | 6737 | 229 | 380 | 6 | 2 | 10 | 2 | 0 | 0 | 0 | 378 | 9 | 0 | 0 | N.A. | N.A. |
| P.H.O.L. - Toronto | 8109 | 942 | 94 | 23 | 1059 | 123 | 7744 | 245 | 7665 | 34 | 0 | 3 | 0 | 0 | 7665 | 82 | 7510 | 133 | 5121 | 313 | 4946 | 0 |
| Sick Kids Hospital - Toronto | 1340 | 75 | 9 | 31 | 115 | 54 | 1254 | 181 | 1254 | 23 | 5 | 1 | 25 | 0 | 1254 | 33 | 1254 | 28 | 1254 | 265 | 1254 | 45 |
| Sunnybrook & Women's College HSC | 901 | 0 | 0 | 94 | 94 | 8 | 901 | 18 | 901 | 8 | 0 | 4 | 0 | 0 | 901 | 4 | 901 | 10 | 901 | 28 | 120 | 0 |
| P.H.O.L. - Sault Ste. Marie | 223 | 7 | 0 | 0 | 7 | 4 | 223 | 4 | 223 | 1 | 0 | 0 | 0 | 0 | 223 | 3 | 221 | 4 | 172 | 9 | 170 | 0 |
| P.H.O.L. - Timmins | 158 | 30 | 1 | 0 | 31 | 0 | 143 | 4 | 143 | 0 | 0 | 0 | 0 | 0 | 143 | 0 | 142 | 10 | 115 | 1 | 112 | 0 |
| St. Joseph's - London | 1966 | 0 | 0 | 142 | 142 | 37 | 1966 | 215 | 731 | 17 | 2 | 2 | 13 | 0 | 731 | 14 | 731 | 19 | 412 | 77 | 391 | 5 |
| P.H.O.L. - London | 2165 | 134 | 62 | 2 | 198 | 41 | 2144 | 151 | 2129 | 8 | 0 | 0 | 0 | 0 | 2129 | 27 | 2103 | 54 | 1673 | 174 | 1635 | 0 |
| P.H.O.L. - Orillia | 858 | 46 | 24 | 2 | 72 | 26 | 858 | 48 | 855 | 4 | 0 | 0 | 0 | 0 | 855 | 5 | 854 | 15 | 664 | 54 | 661 | 0 |
| P.H.O.L. - Thunder Bay | 280 | 22 | 3 | 3 | 28 | 24 | 278 | 4 | 278 | 0 | 0 | 1 | 0 | 0 | 278 | 4 | 269 | 7 | 230 | 22 | 220 | 0 |
| P.H.O.L. - Sudbury | 315 | 9 | 11 | 2 | 22 | 6 | 310 | 15 | 310 | 0 | 0 | 1 | 0 | 0 | 310 | 6 | 301 | 6 | 238 | 14 | 228 | 0 |
| P.H.O.L. - Hamilton | 2329 | 164 | 26 | 3 | 193 | 49 | 2256 | 101 | 2236 | 10 | 1 | 0 | 0 | 0 | 2236 | 41 | 2221 | 44 | 1641 | 166 | 1622 | 0 |
| P.H.O.L. - Peterborough | 626 | 30 | 2 | 0 | 32 | 2 | 623 | 19 | 622 | 3 | 0 | 0 | 0 | 0 | 621 | 6 | 618 | 19 | 367 | 40 | 361 | 0 |
| St. Joseph's - Hamilton | 6294 | 0 | 0 | 939 | 939 | 235 | 6294 | 881 | 6294 | 103 | 5 | 4 | 0 | 0 | 6294 | 141 | 6294 | 78 | 6294 | 507 | 0 | 0 |
| Province of Ontario | 38074 | 1536 | 297 | 2103 | 3936 | 916 | 37480 | 2633 | 25811 | 225 | 15 | 30 | 47 | 5 | 25430 | 399 | 25568 | 476 | 20550 | 1885 | 13152 | 68 |
| Manitoba | 7707 | 78 | 68 | 423 | 569 | 638 | 7454 | 512 | 2632 | 36 | 5 | 3 | 3 | 0 | 2632 | 47 | 1698 | 31 | 2632 | 421 | 1698 | 16 |
| Regina | 4767 | 0 | 0 | 504 | 504 | 199 | 4767 | 90 | 2735 | 108 | 7 | 3 | 15 | 0 | 2735 | 52 | 2658 | 41 | 2735 | 611 | 2735 | 37 |
| Saskatoon | 3779 | 0 | 0 | 250 | 250 | 200 | 3779 | 119 | 3779 | 95 | 8 | 5 | 4 | 0 | 3779 | 59 | 3782 | 12 | 3779 | 496 | 3779 | 30 |
| Saskatchewan | 8546 | 0 | 0 | 754 | 754 | 399 | 8546 | 209 | 6514 | 203 | 15 | 8 | 19 | 0 | 6514 | 111 | 6440 | 53 | 6514 | 1107 | 6514 | 67 |
| Alberta | 21687 | 494 | 991 | 599 | 2084 | 2291 | 17328 | 0 | 17328 | 399 | 37 | 24 | 141 | 0 | 17328 | 297 | 17328 | 409 | 17328 | 2797 | 17328 | 415 |
| Prairies | 37940 | 572 | 1059 | 1776 | 3407 | 3328 | 33328 | 721 | 26474 | 638 | 57 | 35 | 163 | 0 | 26474 | 455 | 25466 | 493 | 26474 | 4325 | 25540 | 498 |
| Province of British Columbia | 17135 | 150 | 231 | 249 | 1079 | 770 | 16906 | 1026 | 5629 | 164 | 48 | 24 | 37 | 33 | 5626 | 68 | 5600 | 283 | 5216 | 1138 | 4445 | 97 |
| Yukon | 1016 | 4 | 8 | 17 | 29 | 4 | 1016 | 1 | N.A. | N.A. | N.A. | N.A. | N.A. | N.A. | N.A. | N.A. | N.A. | N.A. | N.A. | N.A. | N.A. | N.A. |
| Northwest Territories | 435 | 27 | 8 | 1 | 36 | 15 | 428 | 0 | 428 | 7 | 0 | 2 | 3 | 0 | 428 | 11 | 428 | 37 | 428 | 103 | 428 | 28 |
| Nunavut | 212 | 0 | 0 | 13 | 13 | 3 | 209 | 4 | 209 | 12 | 3 | 0 | 3 | 0 | 209 | 10 | 209 | 2 | 209 | 70 | 50 | 1 |
| Territories | 1663 | 31 | 16 | 31 | 78 | 22 | 1653 | 5 | 637 | 19 | 3 | 2 | 6 | 0 | 637 | 21 | 637 | 39 | 637 | 173 | 478 | 29 |
| CANADA | 158368 | 2316 | 1641 | 10074 | 14480 | 10324 | 149953 | 8839 | 75982 | 1346 | 135 | 110 | 291 | 38 | 75641 | 1542 | 73931 | 1389 | 56664 | 8118 | 58593 | 908 |
|
Specimens from YT, NT and NU are sent to reference laboratories in other provinces and reported results reflect specimens identified as originating from YT, NT or NU. Results from British Columbia comprise of specimens from the following sites: BC Children's and Women's Hospital, Children's and Women's Hospital Laboratory, Fraser Health Medical Microbiology Laboratory, Island Health, Providence Health Care, Powell River Hospital, St. Paul's Hospital, Vancouver General Hospital, Victoria General Hospital, Victoria Coastal Health, BCCDC Public Health Laboratory, Interior Health Authority sites and Northern Health Authority sites. Delays in the reporting of data may cause data to change retrospectively. Due to reporting delays, the sum of weekly report totals do not add up to cumulative totals. For BC, only data from subtyped influenza A specimens are included in the weekly number of influenza detections. The sum of A(H1N1)pdm09, A(H3), and A(UnS) positive results may not equal the sum of total Flu A positive results. |
||||||||||||||||||||||
Number of positive laboratory tests for other respiratory viruses
Figure 1: Number of positive laboratory tests for other respiratory viruses by report week, Canada. 2019-20
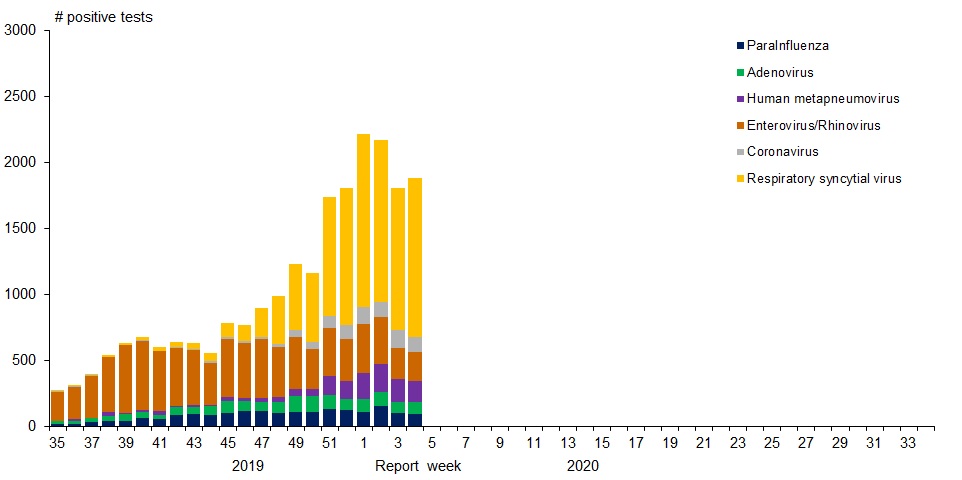
Figure 1: Number of positive laboratory tests for other respiratory viruses by report week, Canada. 2019-20 - Text description
| Week | ParaInfluenza | Adenovirus | Human metapneumovirus | Enterovirus/Rhinovirus | Coronavirus | Respiratory syncytial virus |
|---|---|---|---|---|---|---|
| 35 | 16 | 24 | 2 | 221 | 5 | 8 |
| 36 | 22 | 23 | 12 | 244 | 3 | 8 |
| 37 | 32 | 30 | 5 | 316 | 3 | 8 |
| 38 | 40 | 39 | 28 | 421 | 1 | 11 |
| 39 | 40 | 53 | 6 | 516 | 3 | 18 |
| 40 | 63 | 50 | 9 | 528 | 4 | 23 |
| 41 | 55 | 35 | 25 | 455 | 4 | 30 |
| 42 | 84 | 63 | 10 | 440 | 6 | 35 |
| 43 | 91 | 57 | 15 | 416 | 8 | 42 |
| 44 | 86 | 70 | 9 | 318 | 11 | 64 |
| 45 | 105 | 84 | 31 | 439 | 16 | 105 |
| 46 | 118 | 73 | 25 | 414 | 18 | 121 |
| 47 | 115 | 69 | 35 | 444 | 17 | 221 |
| 48 | 102 | 81 | 41 | 379 | 22 | 361 |
| 49 | 112 | 116 | 59 | 393 | 49 | 501 |
| 50 | 111 | 116 | 56 | 305 | 55 | 519 |
| 51 | 120 | 90 | 128 | 266 | 84 | 722 |
| 52 | 120 | 85 | 135 | 334 | 108 | 1,039 |
| 1 | 113 | 94 | 201 | 367 | 128 | 1,313 |
| 2 | 156 | 106 | 208 | 357 | 116 | 1,230 |
| 3 | 102 | 85 | 172 | 239 | 135 | 1,073 |
| 4 | 98 | 87 | 162 | 218 | 109 | 1,206 |
Positive Influenza tests
Figure 2: Positive Influenza Tests (%) in Canada by Region by Week of Report
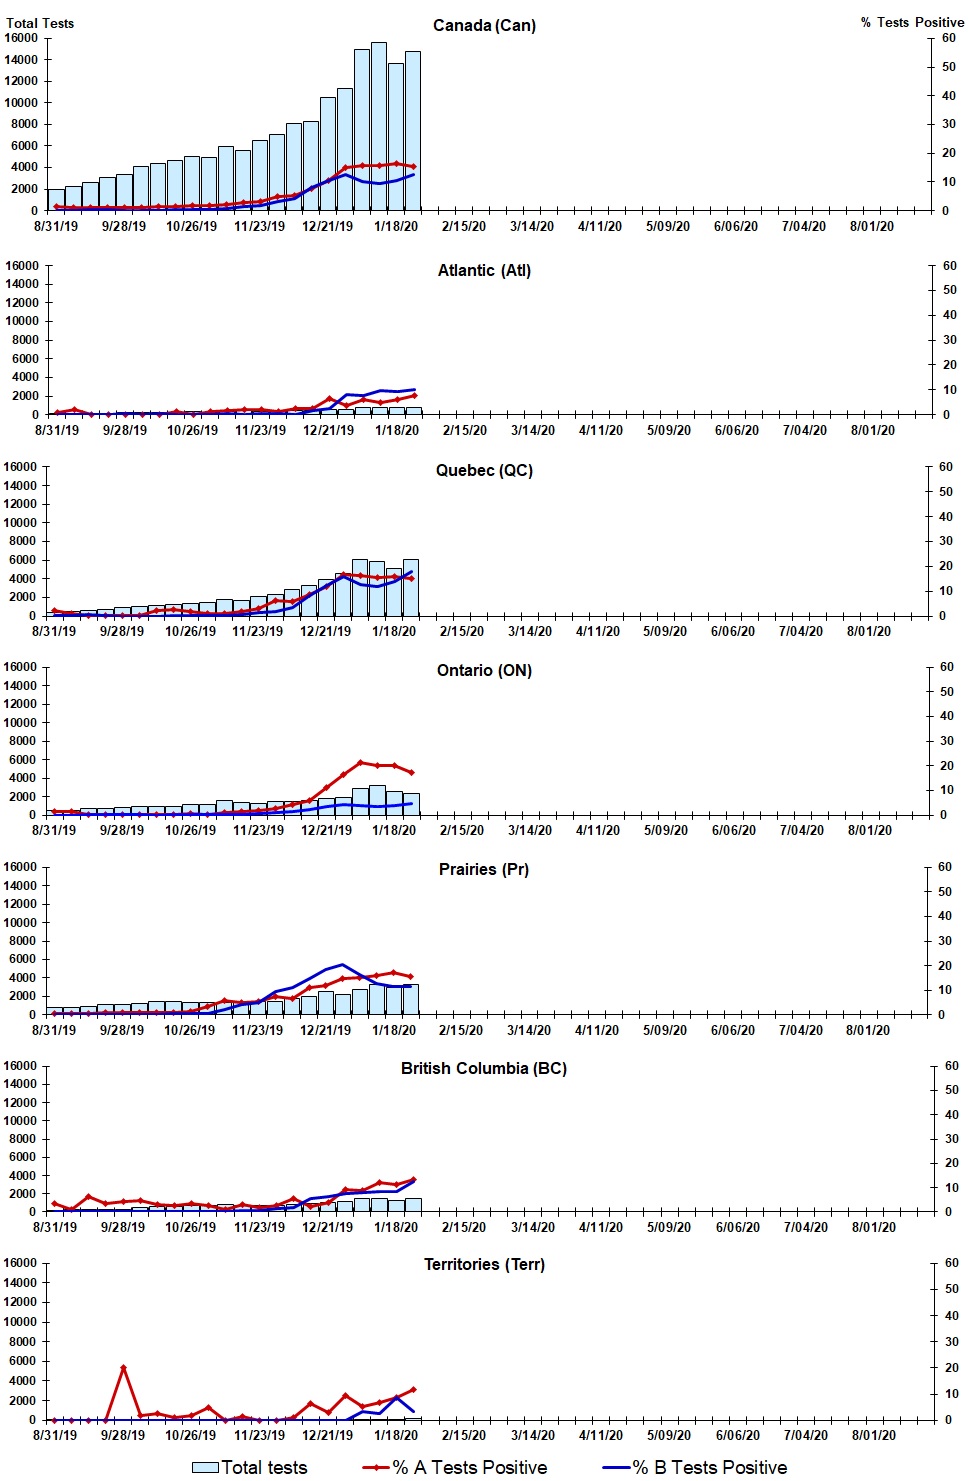
Figure 2: Positive Influenza Tests (%) in Canada by Region by Week of Report - Text description
| Week | Week end | Can Tests | Can A % |
Can B % |
Atl Tests | Atl A % |
Atl B % |
QC Tests | QC A % |
QC B % |
ON Tests | ON A % |
ON B % |
Pr Tests | Pr A % |
Pr B % |
BC Tests | BC A % |
BC B % |
Terr Tests | Terr A % |
Terr B % |
|---|---|---|---|---|---|---|---|---|---|---|---|---|---|---|---|---|---|---|---|---|---|---|
| 35 | 2019-08-31 | 1979 | 1.3 | 0.1 | 95 | 1.1 | 0.0 | 375 | 2.1 | 0.3 | 475 | 1.3 | 0.0 | 802 | 0.5 | 0.1 | 202 | 3.5 | 0.0 | 30 | 0.0 | 0.0 |
| 36 | 2019-09-07 | 2208 | 1.1 | 0.1 | 138 | 2.2 | 0.0 | 472 | 0.9 | 0.2 | 514 | 1.6 | 0.0 | 808 | 0.7 | 0.1 | 250 | 1.2 | 0.0 | 26 | 0.0 | 0.0 |
| 37 | 2019-09-14 | 2631 | 0.9 | 0.2 | 162 | 0.0 | 0.0 | 612 | 0.3 | 0.5 | 668 | 0.2 | 0.3 | 929 | 0.5 | 0.0 | 248 | 6.5 | 0.0 | 12 | 0.0 | 0.0 |
| 38 | 2019-09-21 | 3039 | 1.0 | 0.2 | 149 | 0.0 | 0.0 | 730 | 0.4 | 0.1 | 726 | 0.4 | 0.3 | 1090 | 1.1 | 0.3 | 325 | 3.4 | 0.0 | 19 | 0.0 | 0.0 |
| 39 | 2019-09-28 | 3356 | 1.0 | 0.1 | 219 | 0.0 | 0.5 | 870 | 0.3 | 0.0 | 792 | 0.4 | 0.1 | 1142 | 0.9 | 0.1 | 308 | 4.2 | 0.0 | 25 | 20.0 | 0.0 |
| 40 | 2019-10-05 | 4078 | 1.2 | 0.1 | 254 | 0.0 | 0.0 | 1009 | 0.4 | 0.0 | 936 | 0.4 | 0.2 | 1277 | 1.1 | 0.0 | 546 | 4.6 | 0.0 | 56 | 1.8 | 0.0 |
| 41 | 2019-10-12 | 4339 | 1.4 | 0.1 | 208 | 0.0 | 0.5 | 1112 | 2.1 | 0.0 | 902 | 0.2 | 0.0 | 1412 | 1.1 | 0.1 | 624 | 3.0 | 0.3 | 81 | 2.5 | 0.0 |
| 42 | 2019-10-19 | 4649 | 1.57 | 0.30 | 279 | 1.08 | 0.00 | 1251 | 2.72 | 0.08 | 945 | 0.21 | 0.11 | 1459 | 1.17 | 0.75 | 620 | 2.58 | 0.16 | 95 | 1.05 | 0 |
| 43 | 2019-10-26 | 4996 | 1.60 | 0.34 | 284 | 0.00 | 0.00 | 1338 | 1.79 | 0.22 | 1189 | 0.50 | 0.34 | 1339 | 1.57 | 0.75 | 737 | 3.66 | 0.00 | 109 | 1.83 | 0 |
| 44 | 2019-11-02 | 4966 | 1.83 | 0.34 | 280 | 1.07 | 0.00 | 1405 | 1.00 | 0.36 | 1167 | 0.43 | 0.34 | 1352 | 3.48 | 0.59 | 681 | 2.64 | 0.00 | 81 | 4.94 | 0 |
| 45 | 2019-11-09 | 5912 | 2.20 | 0.66 | 328 | 1.52 | 0.61 | 1793 | 1.12 | 0.22 | 1584 | 1.14 | 0.06 | 1369 | 5.84 | 2.26 | 768 | 0.91 | 0.13 | 70 | 0 | 0 |
| 46 | 2019-11-16 | 5589 | 2.68 | 1.38 | 414 | 2.17 | 0.24 | 1691 | 1.83 | 0.53 | 1355 | 1.40 | 0.37 | 1300 | 5.15 | 4.38 | 763 | 3.01 | 0.66 | 66 | 1.52 | 0 |
| 47 | 2019-11-23 | 6541 | 3.09 | 1.90 | 365 | 1.92 | 0.27 | 2128 | 2.87 | 1.41 | 1291 | 2.01 | 0.62 | 1493 | 5.29 | 5.22 | 741 | 1.89 | 0.67 | 72 | 0 | 0 |
| 48 | 2019-11-30 | 7019 | 4.87 | 3.18 | 439 | 1.14 | 0.46 | 2347 | 6.18 | 2.00 | 1446 | 2.70 | 1.11 | 1473 | 7.47 | 9.57 | 735 | 2.72 | 1.63 | 46 | 0 | 0 |
| 49 | 2019-12-07 | 8108 | 5.25 | 4.14 | 474 | 2.53 | 0.21 | 2843 | 5.66 | 3.52 | 1502 | 4.26 | 1.26 | 1772 | 6.60 | 11.00 | 860 | 5.35 | 1.74 | 83 | 1.2 | 0 |
| 50 | 2019-12-14 | 8229 | 7.69 | 7.95 | 453 | 2.65 | 1.55 | 3251 | 8.71 | 8.09 | 1562 | 5.76 | 2.30 | 1984 | 11.14 | 14.97 | 901 | 2.44 | 5.66 | 78 | 6.41 | 0 |
| 51 | 2019-12-21 | 9210 | 10.91 | 10.50 | 527 | 6.45 | 2.47 | 3912 | 12.07 | 12.35 | 1781 | 11.34 | 3.31 | 1900 | 13.53 | 18.26 | 1021 | 3.82 | 6.37 | 69 | 1.45 | 0 |
| 52 | 2019-12-28 | 11505 | 15.53 | 12.62 | 531 | 3.77 | 7.91 | 4615 | 16.66 | 15.88 | 1897 | 16.61 | 4.32 | 2484 | 16.91 | 19.08 | 1102 | 9.26 | 7.53 | 79 | 10.13 | 0 |
| 1 | 2020-01-04 | 14932 | 15.81 | 10.27 | 721 | 5.96 | 7.63 | 6016 | 16.12 | 12.67 | 2892 | 21.16 | 3.98 | 2712 | 15.34 | 16.26 | 1519 | 8.82 | 7.90 | 117 | 5.13 | 3.42 |
| 2 | 2020-01-11 | 15580 | 15.76 | 9.39 | 815 | 4.79 | 9.69 | 5871 | 15.59 | 11.72 | 3230 | 20.09 | 3.53 | 3292 | 15.95 | 12.73 | 1458 | 12.21 | 8.30 | 115 | 6.96 | 2.61 |
| 3 | 2020-01-18 | 13640 | 16.30 | 10.31 | 797 | 6.02 | 9.28 | 5139 | 15.92 | 13.91 | 2602 | 19.98 | 4.00 | 2954 | 17.06 | 11.65 | 1258 | 11.37 | 8.51 | 104 | 8.65 | 8.65 |
| 4 | 2020-01-25 | 14793 | 15.23 | 12.59 | 810 | 7.65 | 10.00 | 6034 | 15.08 | 17.88 | 2324 | 17.34 | 4.56 | 3256 | 15.51 | 11.39 | 1431 | 13.49 | 12.37 | 189 | 11.64 | 3.17 |
Positive Respiratory synctial virus tests
Figure 3: Positive Respiratory syncytial virus (RSV) Tests (%) in Canada by Region by Week of Report
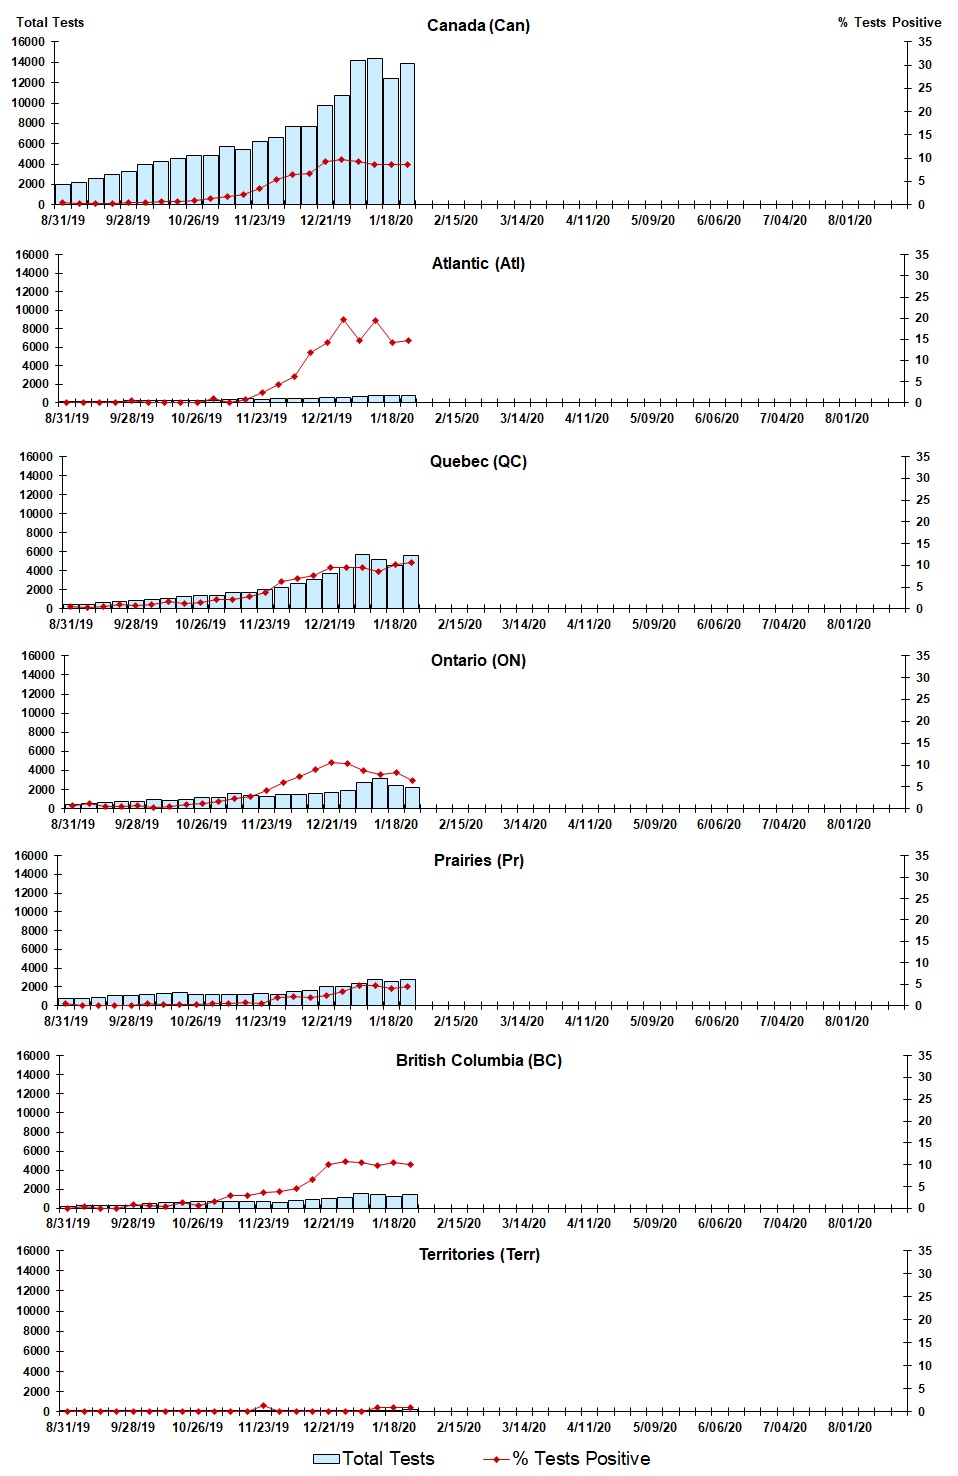
Figure 3: Positive Respiratory syncytial virus (RSV) Tests (%) in Canada by Region by Week of Report - Text description
| Week | Week end | Can Tests | RSV % |
Atl Tests | RSV % |
QC Tests | RSV % |
ON Tests | RSV % |
Pr Tests | RSV % |
BC Tests | RSV % |
Terr Tests | RSV % |
|---|---|---|---|---|---|---|---|---|---|---|---|---|---|---|---|
| 35 | 2019-08-31 | 1948 | 0.4 | 95 | 0.0 | 399 | 0.5 | 466 | 0.6 | 756 | 0.4 | 202 | 0.0 | 30 | 0.0 |
| 36 | 2019-09-07 | 2191 | 0.4 | 139 | 0.0 | 481 | 0.2 | 512 | 1.2 | 783 | 0.0 | 250 | 0.4 | 26 | 0.0 |
| 37 | 2019-09-14 | 2619 | 0.3 | 162 | 0.0 | 643 | 0.6 | 668 | 0.5 | 886 | 0.1 | 248 | 0.0 | 12 | 0.0 |
| 38 | 2019-09-21 | 2936 | 0.4 | 149 | 0.0 | 744 | 0.9 | 726 | 0.6 | 1025 | 0.0 | 273 | 0.0 | 19 | 0.0 |
| 39 | 2019-09-28 | 3307 | 0.5 | 219 | 0.5 | 882 | 0.8 | 792 | 0.8 | 1082 | 0.1 | 308 | 1.0 | 24 | 0.0 |
| 40 | 2019-10-05 | 3976 | 0.6 | 257 | 0.0 | 1018 | 1.0 | 936 | 0.3 | 1179 | 0.6 | 530 | 0.6 | 56 | 0.0 |
| 41 | 2019-10-12 | 4259 | 0.7 | 209 | 0.0 | 1113 | 1.6 | 901 | 0.6 | 1318 | 0.3 | 637 | 0.5 | 81 | 0.0 |
| 42 | 2019-10-19 | 4571 | 0.77 | 279 | 0 | 1263 | 1.19 | 945 | 1.06 | 1370 | 0.15 | 620 | 1.29 | 94 | 0 |
| 43 | 2019-10-26 | 4834 | 0.87 | 225 | 0 | 1345 | 1.49 | 1189 | 1.18 | 1232 | 0.24 | 737 | 0.68 | 106 | 0 |
| 44 | 2019-11-02 | 4819 | 1.33 | 280 | 1.07 | 1388 | 2.02 | 1164 | 1.55 | 1229 | 0.41 | 677 | 1.48 | 81 | 0 |
| 45 | 2019-11-09 | 5680 | 1.85 | 329 | 0 | 1747 | 2.18 | 1583 | 2.4 | 1189 | 0.5 | 763 | 3.01 | 69 | 0 |
| 46 | 2019-11-16 | 5390 | 2.24 | 414 | 0.72 | 1658 | 2.9 | 1351 | 2.89 | 1139 | 0.79 | 762 | 2.89 | 66 | 0 |
| 47 | 2019-11-23 | 6192 | 3.57 | 366 | 2.46 | 2004 | 3.64 | 1287 | 4.27 | 1274 | 0.55 | 738 | 3.52 | 72 | 1.39 |
| 48 | 2019-11-30 | 6580 | 5.49 | 439 | 4.33 | 2258 | 6.33 | 1446 | 6.02 | 1220 | 1.97 | 638 | 3.76 | 46 | 0 |
| 49 | 2019-12-07 | 7669 | 6.53 | 475 | 6.32 | 2699 | 6.89 | 1490 | 7.45 | 1488 | 2.22 | 860 | 4.53 | 83 | 0 |
| 50 | 2019-12-14 | 7654 | 6.78 | 456 | 11.84 | 3079 | 7.63 | 1543 | 9.07 | 1601 | 1.87 | 899 | 6.67 | 76 | 0 |
| 51 | 2019-12-21 | 8555 | 8.44 | 528 | 14.2 | 3660 | 9.59 | 1747 | 10.53 | 1531 | 0.59 | 1021 | 10.09 | 68 | 0 |
| 52 | 2019-12-28 | 10957 | 9.48 | 531 | 19.59 | 4359 | 9.5 | 1860 | 10.27 | 2229 | 3.23 | 1102 | 10.8 | 79 | 0 |
| 1 | 2020-01-04 | 14163 | 9.27 | 723 | 14.8 | 5701 | 9.56 | 2789 | 8.78 | 2374 | 4.68 | 1505 | 10.43 | 116 | 0 |
| 2 | 2020-01-11 | 14329 | 8.58 | 817 | 19.34 | 5225 | 8.61 | 3128 | 7.83 | 2821 | 4.71 | 1424 | 9.9 | 115 | 0.87 |
| 3 | 2020-01-18 | 12448 | 8.62 | 799 | 14.27 | 4598 | 10.11 | 2397 | 8.34 | 2516 | 3.9 | 1248 | 10.5 | 104 | 0.96 |
| 4 | 2020-01-25 | 13878 | 8.69 | 817 | 14.69 | 5614 | 10.63 | 2266 | 6.4 | 2812 | 4.55 | 1431 | 10.13 | 189 | 1.06 |
Positive Parainfluenza tests
Figure 4: Positive Parainfluenza (PIV) Tests (%) in Canada by Region by Week of Report
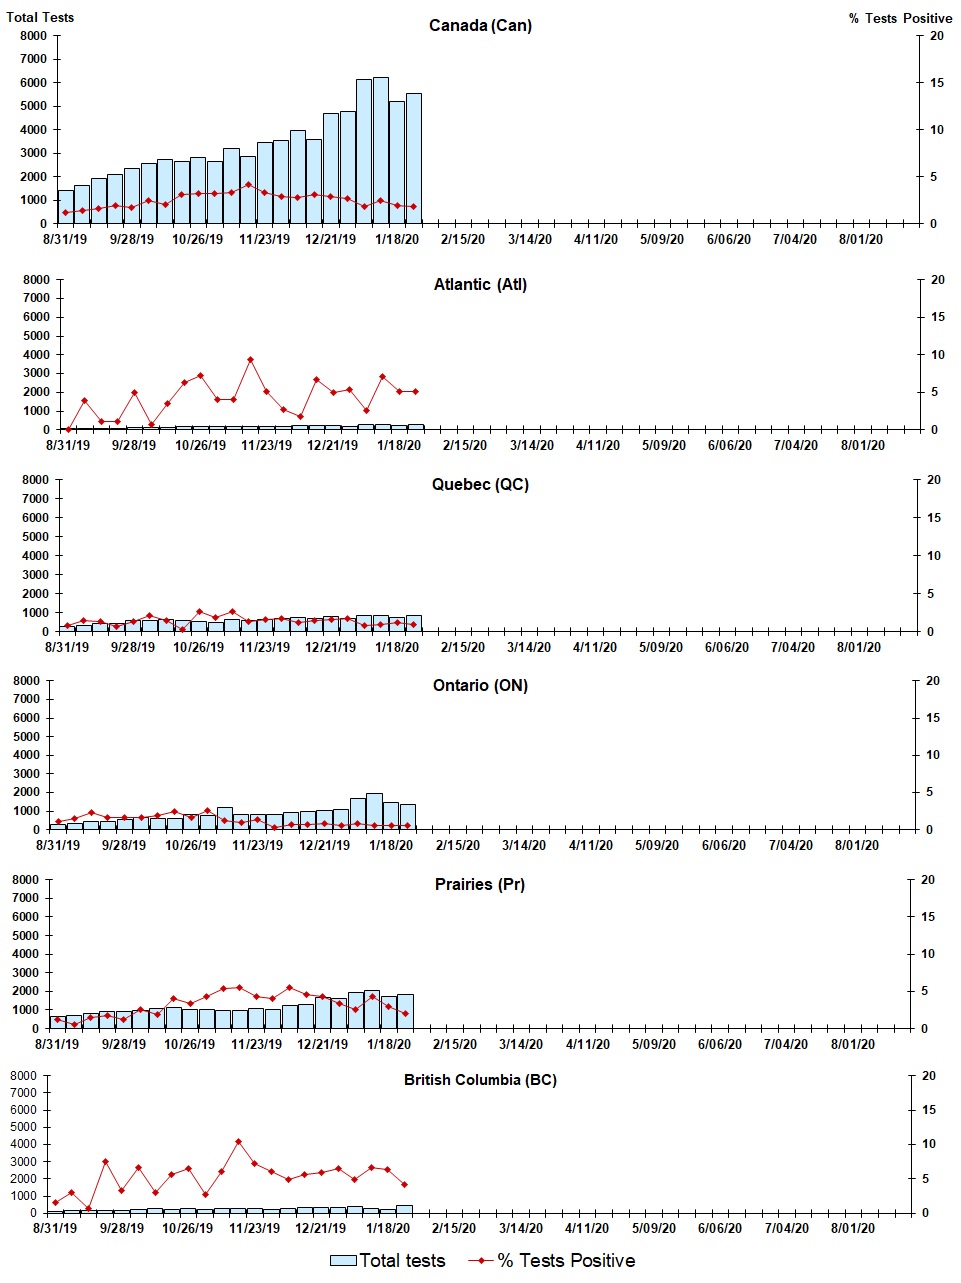
Figure 4: Positive Parainfluenza (PIV) Tests (%) in Canada by Region by Week of Report - Text description
| Week | Week End | Canada Tests | PIV % |
Atl Tests | PIV % |
QC Tests | PIV % |
ON Tests | PIV % |
Pr Tests | PIV % |
BC Tests | PIV % |
|---|---|---|---|---|---|---|---|---|---|---|---|---|---|
| 35 | 2019-08-31 | 1389 | 1.7 | 74 | 0.0 | 252 | 0.8 | 276 | 1.1 | 633 | 1.3 | 124 | 1.6 |
| 36 | 2019-09-07 | 1633 | 1.4 | 76 | 4.0 | 345 | 1.5 | 339 | 1.5 | 683 | 0.6 | 164 | 3.1 |
| 37 | 2019-09-14 | 1936 | 1.6 | 87 | 1.2 | 453 | 1.3 | 437 | 2.3 | 787 | 1.5 | 160 | 0.6 |
| 38 | 2019-09-21 | 2085 | 1.9 | 89 | 1.1 | 458 | 0.7 | 468 | 1.7 | 894 | 1.8 | 160 | 7.5 |
| 39 | 2019-09-28 | 2350 | 2.3 | 121 | 5.0 | 566 | 1.4 | 536 | 1.7 | 925 | 1.2 | 178 | 3.4 |
| 40 | 2019-10-05 | 2579 | 2.0 | 145 | 0.7 | 594 | 2.2 | 653 | 1.7 | 979 | 2.6 | 197 | 6.6 |
| 41 | 2019-10-12 | 2740 | 1.3 | 141 | 3.6 | 621 | 1.5 | 595 | 1.9 | 1095 | 1.9 | 271 | 3.0 |
| 42 | 2019-10-19 | 2663 | 3.15 | 173 | 6.36 | 575 | 0.35 | 599 | 2.5 | 1108 | 4.06 | 194 | 5.67 |
| 43 | 2019-10-26 | 2809 | 3.24 | 166 | 7.23 | 533 | 2.63 | 805 | 1.61 | 1025 | 3.41 | 264 | 6.44 |
| 44 | 2019-11-02 | 2644 | 3.25 | 147 | 4.08 | 483 | 1.86 | 771 | 2.59 | 1016 | 4.33 | 216 | 2.78 |
| 45 | 2019-11-09 | 3196 | 3.29 | 147 | 4.08 | 643 | 2.64 | 1175 | 1.28 | 944 | 5.4 | 263 | 6.08 |
| 46 | 2019-11-16 | 2866 | 4.12 | 191 | 9.42 | 573 | 1.4 | 839 | 0.95 | 954 | 5.56 | 288 | 10.42 |
| 47 | 2019-11-23 | 3466 | 3.32 | 177 | 5.08 | 657 | 1.67 | 796 | 1.38 | 1069 | 4.3 | 279 | 7.17 |
| 48 | 2019-11-30 | 3525 | 2.89 | 185 | 2.7 | 709 | 1.69 | 827 | 0.36 | 1007 | 4.07 | 232 | 6.03 |
| 49 | 2019-12-07 | 3979 | 2.81 | 221 | 1.81 | 740 | 1.22 | 923 | 0.76 | 1246 | 5.46 | 247 | 4.86 |
| 50 | 2019-12-14 | 3567 | 3.11 | 223 | 6.73 | 697 | 1.43 | 985 | 0.71 | 1313 | 4.57 | 317 | 5.68 |
| 51 | 2019-12-21 | 3805 | 3.15 | 202 | 4.95 | 787 | 1.65 | 1015 | 0.79 | 1455 | 4.47 | 318 | 5.97 |
| 52 | 2019-12-28 | 4851 | 2.47 | 185 | 5.41 | 683 | 1.76 | 1066 | 0.56 | 1782 | 3.42 | 294 | 4.42 |
| 1 | 2020-01-04 | 6128 | 1.84 | 270 | 2.59 | 850 | 0.82 | 1672 | 0.78 | 1925 | 2.6 | 410 | 4.88 |
| 2 | 2020-01-11 | 6235 | 2.5 | 267 | 7.12 | 838 | 0.95 | 1942 | 0.51 | 2041 | 4.36 | 283 | 6.71 |
| 3 | 2020-01-18 | 5225 | 1.95 | 217 | 5.07 | 761 | 1.18 | 1468 | 0.61 | 1715 | 2.92 | 234 | 6.41 |
| 4 | 2020-01-25 | 5529 | 1.77 | 278 | 5.04 | 831 | 0.96 | 1330 | 0.6 | 1838 | 2.01 | 429 | 4.2 |
Positive Adenovirus tests
Figure 5: Positive Adenovirus (adeno) Tests (%) in Canada by Region by Week of Report
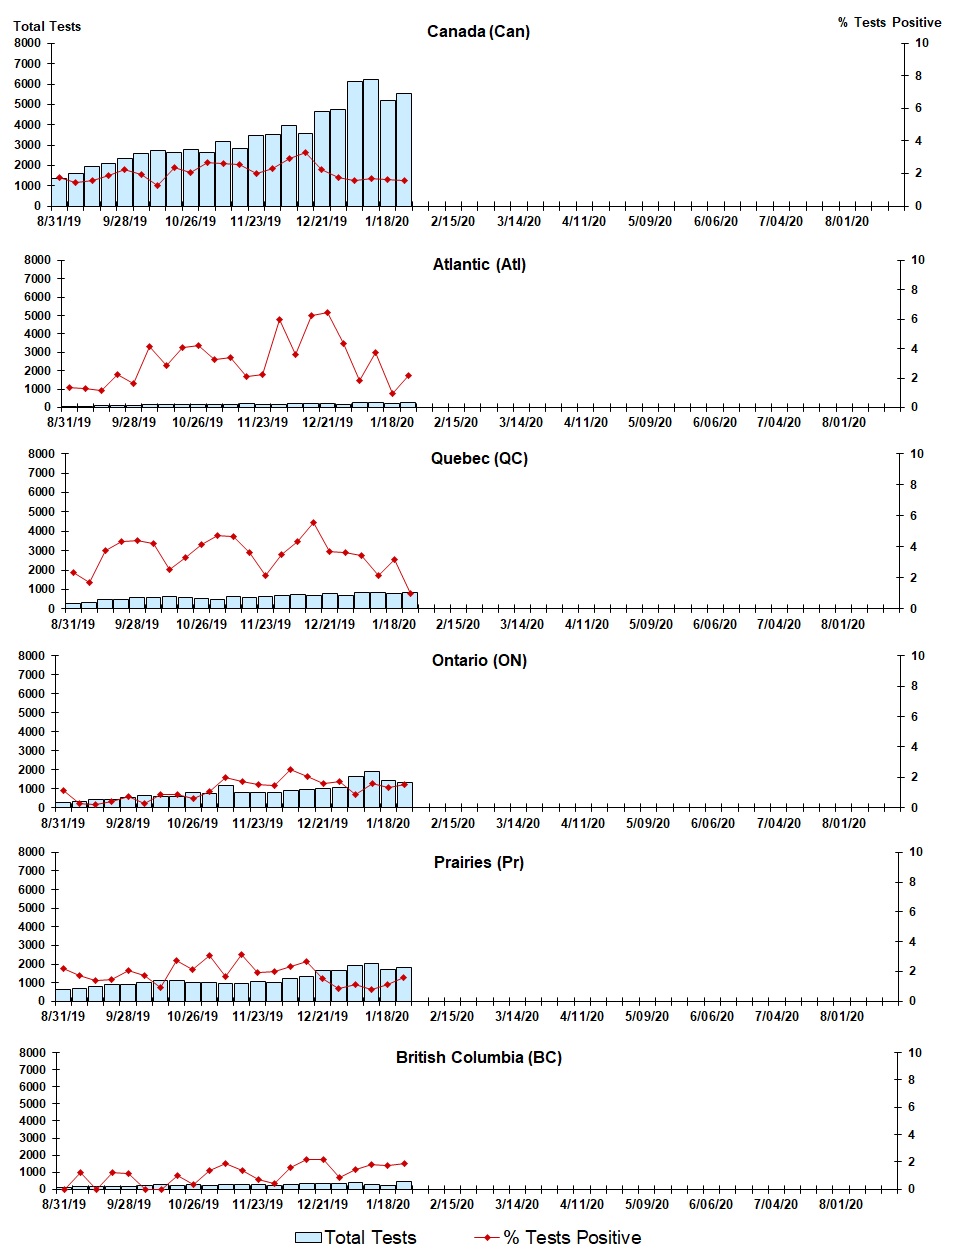
Figure 5: Positive Adenovirus (adeno) Tests (%) in Canada by Region by Week of Report - Text description
| Week | Week End | Can Tests | Adeno % |
Atl Tests | Adeno % |
QC Tests | Adeno % |
ON Tests | Adeno % |
Pr Tests | Adeno % |
BC Tests | Adeno % |
|---|---|---|---|---|---|---|---|---|---|---|---|---|---|
| 35 | 2019-08-31 | 1377 | 1.7 | 74 | 1.4 | 255 | 2.4 | 261 | 1.2 | 633 | 2.2 | 124 | 0.0 |
| 36 | 2019-09-07 | 1622 | 1.4 | 76 | 1.3 | 348 | 1.7 | 325 | 0.3 | 683 | 1.8 | 164 | 1.2 |
| 37 | 2019-09-14 | 1924 | 1.6 | 87 | 1.2 | 453 | 3.8 | 425 | 0.2 | 787 | 1.4 | 160 | 0.0 |
| 38 | 2019-09-21 | 2072 | 1.9 | 89 | 2.3 | 463 | 4.3 | 450 | 0.4 | 894 | 1.5 | 160 | 1.3 |
| 39 | 2019-09-28 | 2331 | 2.3 | 121 | 1.7 | 566 | 4.4 | 517 | 0.8 | 925 | 2.1 | 178 | 1.1 |
| 40 | 2019-10-05 | 2563 | 2.0 | 145 | 4.1 | 595 | 4.2 | 636 | 0.3 | 979 | 1.7 | 197 | 0.0 |
| 41 | 2019-10-12 | 2724 | 1.3 | 141 | 2.8 | 625 | 2.6 | 575 | 0.9 | 1095 | 0.9 | 271 | 0.0 |
| 42 | 2019-10-19 | 2651 | 2.38 | 173 | 4.05 | 578 | 3.29 | 584 | 0.86 | 1108 | 2.71 | 194 | 1.03 |
| 43 | 2019-10-26 | 2796 | 2.04 | 166 | 4.22 | 533 | 4.13 | 792 | 0.63 | 1025 | 2.15 | 264 | 0.38 |
| 44 | 2019-11-02 | 2633 | 2.66 | 152 | 3.29 | 487 | 4.72 | 751 | 1.07 | 1016 | 3.05 | 216 | 1.39 |
| 45 | 2019-11-09 | 3182 | 2.64 | 147 | 3.4 | 643 | 4.67 | 1161 | 1.98 | 944 | 1.69 | 263 | 1.9 |
| 46 | 2019-11-16 | 2847 | 2.56 | 191 | 2.09 | 576 | 3.65 | 817 | 1.71 | 954 | 3.14 | 288 | 1.39 |
| 47 | 2019-11-23 | 3450 | 2 | 177 | 2.26 | 658 | 2.13 | 779 | 1.54 | 1069 | 1.96 | 279 | 0.72 |
| 48 | 2019-11-30 | 3507 | 2.31 | 185 | 5.95 | 708 | 3.53 | 810 | 1.48 | 1007 | 1.99 | 232 | 0.43 |
| 49 | 2019-12-07 | 3964 | 2.93 | 221 | 3.62 | 741 | 4.32 | 907 | 2.54 | 1246 | 2.33 | 247 | 1.62 |
| 50 | 2019-12-14 | 3550 | 3.27 | 223 | 6.28 | 699 | 5.58 | 966 | 2.07 | 1313 | 2.67 | 317 | 2.21 |
| 51 | 2019-12-21 | 3790 | 2.37 | 202 | 6.44 | 790 | 3.67 | 997 | 1.6 | 1455 | 1.65 | 318 | 2.2 |
| 52 | 2019-12-28 | 4832 | 1.76 | 185 | 4.32 | 684 | 3.65 | 1046 | 1.72 | 1782 | 1.01 | 294 | 0.68 |
| 1 | 2020-01-04 | 6115 | 1.54 | 270 | 1.85 | 849 | 3.42 | 1660 | 0.84 | 1925 | 1.14 | 410 | 1.46 |
| 2 | 2020-01-11 | 6201 | 1.71 | 267 | 3.75 | 837 | 2.15 | 1912 | 1.62 | 2041 | 0.78 | 280 | 1.79 |
| 3 | 2020-01-18 | 5209 | 1.63 | 217 | 0.92 | 763 | 3.15 | 1450 | 1.31 | 1715 | 1.11 | 234 | 1.71 |
| 4 | 2020-01-25 | 5519 | 1.58 | 278 | 2.16 | 836 | 0.96 | 1315 | 1.52 | 1838 | 1.58 | 429 | 1.86 |
Positive Human metapneumovirus tests
Figure 6: Positive human metapneumovirus (hMPV) Tests (%) in Canada by Region by Week of Report
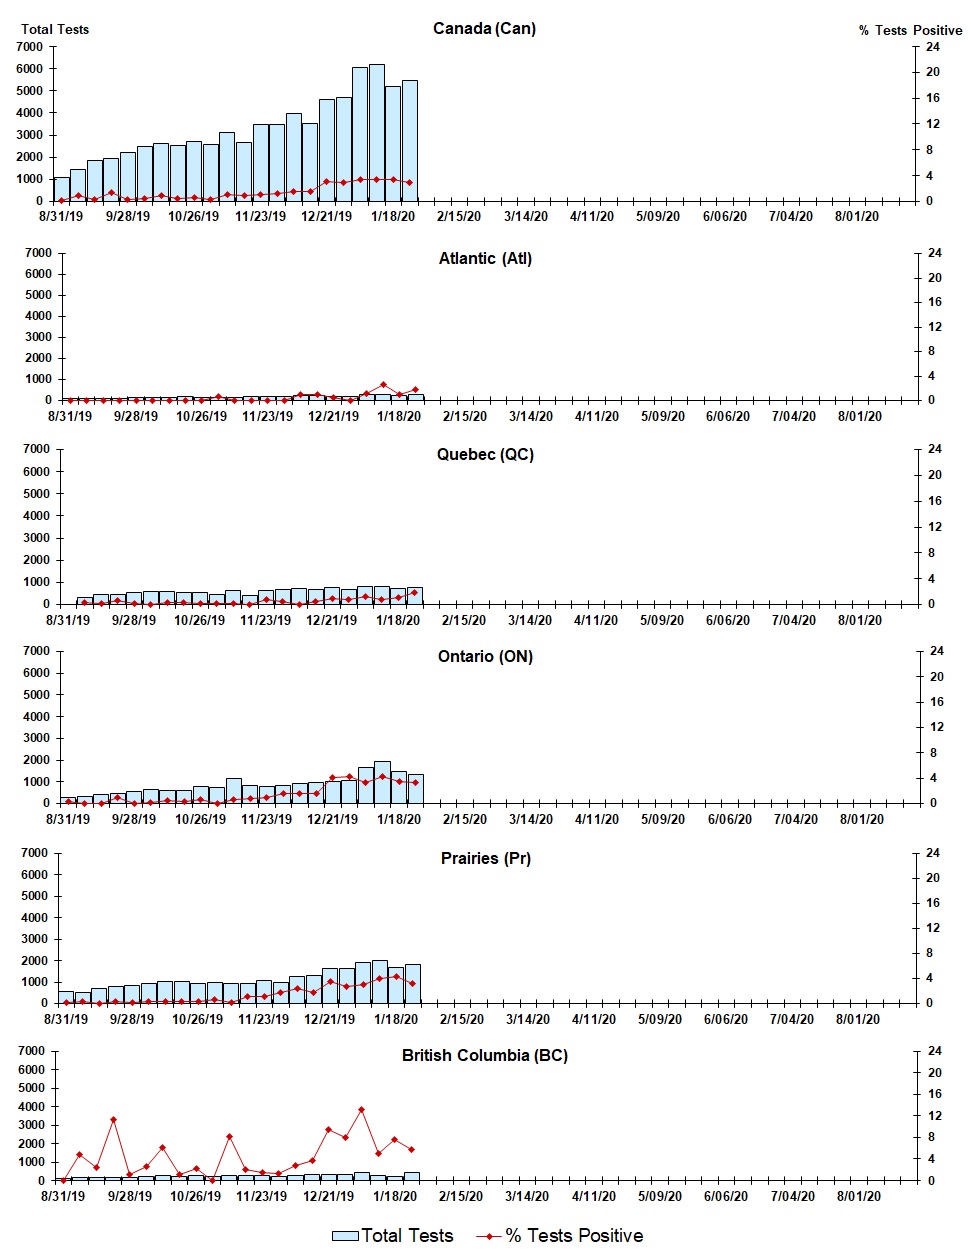
Figure 6: Positive human metapneumovirus (hMPV) Tests (%) in Canada by Region by Week of Report - Text description
| Week | Week End | Can Tests | hMPV % |
Atl Tests | hMPV % |
QC Tests | hMPV % |
ON Tests | hMPV % |
Pr Tests | hMPV % |
BC Tests | hMPV % |
|---|---|---|---|---|---|---|---|---|---|---|---|---|---|
| 35 | 2019-08-31 | 1069 | 0.2 | 74 | 0.0 | N.A. | N.A. | 264 | 0.4 | 577 | 0.2 | 124 | 0.0 |
| 36 | 2019-09-07 | 1424 | 0.8 | 76 | 0.0 | 338 | 0.3 | 322 | 0.0 | 498 | 0.4 | 164 | 4.9 |
| 37 | 2019-09-14 | 1851 | 0.3 | 87 | 0.0 | 445 | 0.2 | 424 | 0.0 | 723 | 0.0 | 160 | 2.5 |
| 38 | 2019-09-21 | 1960 | 1.4 | 89 | 0.0 | 452 | 0.7 | 450 | 0.9 | 793 | 0.4 | 160 | 11.3 |
| 39 | 2019-09-28 | 2229 | 0.3 | 121 | 0.0 | 548 | 0.2 | 531 | 0.0 | 827 | 0.2 | 178 | 1.1 |
| 40 | 2019-10-05 | 2492 | 0.4 | 145 | 0.0 | 582 | 0.0 | 642 | 0.2 | 915 | 0.3 | 197 | 2.5 |
| 41 | 2019-10-12 | 2618 | 1.0 | 141 | 0.0 | 608 | 0.3 | 585 | 0.5 | 1006 | 0.3 | 261 | 6.1 |
| 42 | 2019-10-19 | 2526 | 0.4 | 173 | 0.00 | 551 | 0.36 | 589 | 0.34 | 1005 | 0.4 | 194 | 1.03 |
| 43 | 2019-10-26 | 2723 | 0.55 | 166 | 0.00 | 527 | 0.19 | 794 | 0.63 | 956 | 0.31 | 264 | 2.27 |
| 44 | 2019-11-02 | 2593 | 0.35 | 152 | 0.66 | 466 | 0.21 | 757 | 0 | 991 | 0.61 | 216 | 0 |
| 45 | 2019-11-09 | 3126 | 0.99 | 147 | 0.00 | 622 | 0.16 | 1161 | 0.69 | 925 | 0.22 | 247 | 8.1 |
| 46 | 2019-11-16 | 2663 | 0.94 | 191 | 0.00 | 409 | 0 | 830 | 0.72 | 924 | 1.19 | 288 | 2.08 |
| 47 | 2019-11-23 | 3460 | 1.01 | 177 | 0.00 | 643 | 0.78 | 785 | 1.02 | 1088 | 1.19 | 279 | 1.43 |
| 48 | 2019-11-30 | 3468 | 1.18 | 183 | 0.00 | 684 | 0.44 | 813 | 1.6 | 991 | 1.82 | 232 | 1.29 |
| 49 | 2019-12-07 | 3955 | 1.49 | 221 | 0.90 | 728 | 0 | 918 | 1.53 | 1239 | 2.34 | 247 | 2.83 |
| 50 | 2019-12-14 | 3532 | 1.59 | 223 | 0.90 | 679 | 0.44 | 979 | 1.53 | 1302 | 1.69 | 317 | 3.79 |
| 51 | 2019-12-21 | 3772 | 3.39 | 202 | 0.50 | 765 | 0.92 | 1004 | 4.08 | 1455 | 3.23 | 318 | 9.43 |
| 52 | 2019-12-28 | 4813 | 2.8 | 185 | 0.00 | 667 | 0.75 | 1056 | 4.26 | 1770 | 2.94 | 294 | 6.8 |
| 1 | 2020-01-04 | 6078 | 3.31 | 270 | 1.11 | 824 | 1.21 | 1657 | 3.32 | 1916 | 3.03 | 410 | 13.17 |
| 2 | 2020-01-11 | 6186 | 3.36 | 267 | 2.62 | 818 | 0.73 | 1932 | 4.19 | 2025 | 4 | 280 | 5 |
| 3 | 2020-01-18 | 5180 | 3.32 | 217 | 0.92 | 731 | 1.09 | 1465 | 3.55 | 1703 | 4.29 | 234 | 7.69 |
| 4 | 2020-01-25 | 5450 | 2.97 | 278 | 1.80 | 788 | 1.9 | 1316 | 3.34 | 1816 | 3.25 | 429 | 5.83 |
Positive Enterovirus/Rhinovirus tests
Figure 7: Positive Enterovirus/Rhinovirus (entero/rhino) Tests (%) in Canada by Region by Week of Report
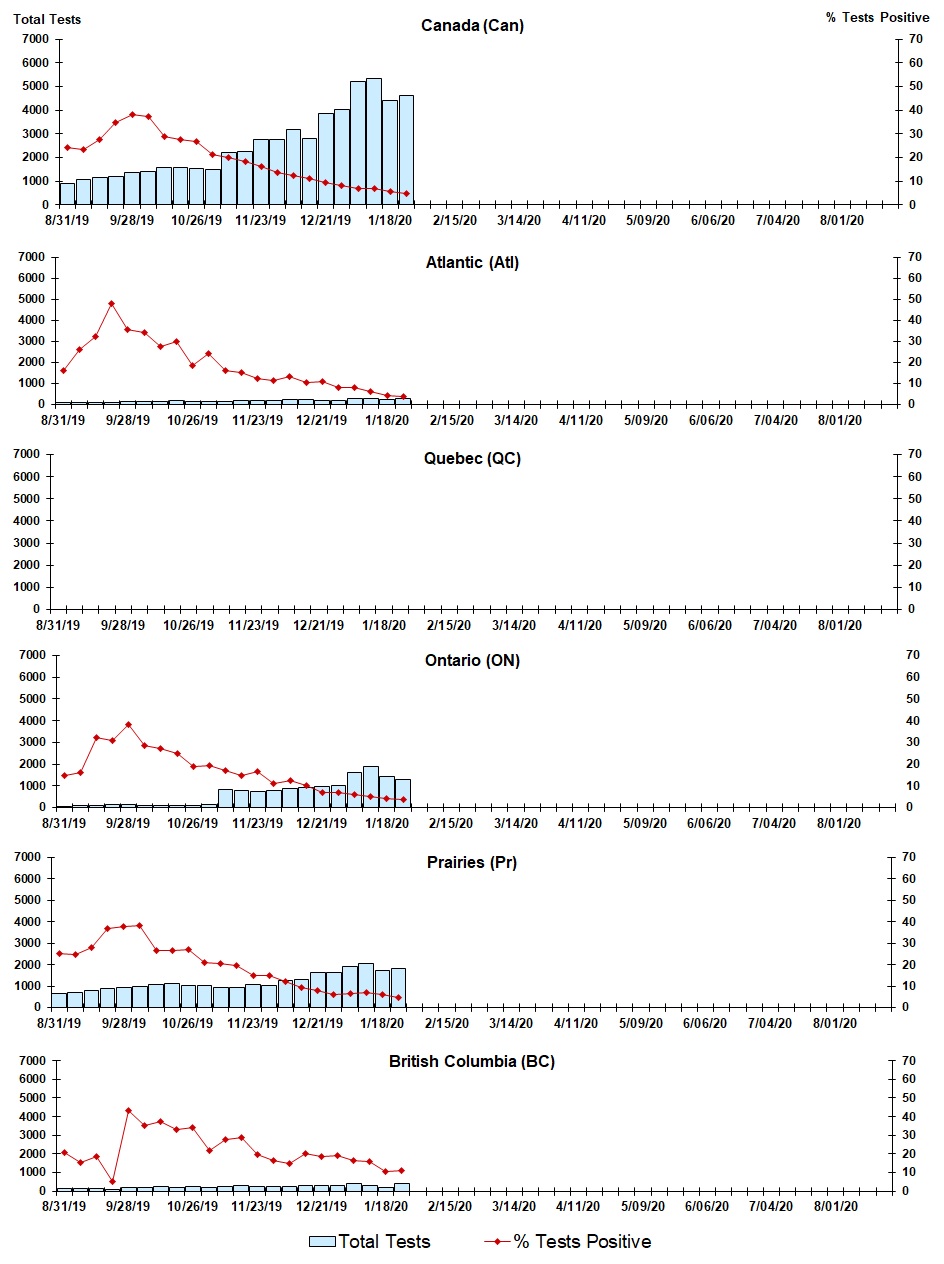
Figure 7: Positive Enterovirus/Rhinovirus (entero/rhino) Tests (%) in Canada by Region by Week of Report - Text description
| Week | Week End | Canada Tests | Entero/rhino % |
Atl Tests | Entero/rhino % |
QC Tests | Entero/rhino % |
ON Tests | Entero/rhino % |
Pr Tests | Entero/rhino % |
BC Tests | Entero/rhino % |
|---|---|---|---|---|---|---|---|---|---|---|---|---|---|
| 35 | 2019-08-31 | 907 | 24.4 | 74 | 16.2 | N.A. | N.A. | 54 | 14.8 | 633 | 25.1 | 116 | 20.7 |
| 36 | 2019-09-07 | 1047 | 23.3 | 76 | 26.3 | N.A. | N.A. | 107 | 15.9 | 683 | 24.6 | 155 | 15.5 |
| 37 | 2019-09-14 | 1139 | 27.7 | 87 | 32.2 | N.A. | N.A. | 106 | 32.1 | 787 | 27.8 | 147 | 18.4 |
| 38 | 2019-09-21 | 1207 | 34.9 | 89 | 48.3 | N.A. | N.A. | 130 | 30.8 | 894 | 36.7 | 78 | 5.1 |
| 39 | 2019-09-28 | 1353 | 38.1 | 121 | 35.5 | N.A. | N.A. | 118 | 38.1 | 925 | 37.7 | 165 | 43.0 |
| 40 | 2019-10-05 | 1417 | 37.3 | 145 | 34.5 | N.A. | N.A. | 101 | 28.7 | 979 | 38.4 | 181 | 35.4 |
| 41 | 2019-10-12 | 1589 | 28.6 | 141 | 27.7 | N.A. | N.A. | 84 | 27.4 | 1095 | 26.6 | 253 | 37.2 |
| 42 | 2019-10-19 | 1587 | 27.73 | 173 | 30.06 | N.A. | N.A. | 108 | 25 | 1108 | 26.71 | 184 | 33.15 |
| 43 | 2019-10-26 | 1545 | 26.93 | 166 | 18.67 | N.A. | N.A. | 90 | 18.89 | 1025 | 27.12 | 248 | 33.87 |
| 44 | 2019-11-02 | 1486 | 21.4 | 152 | 24.34 | N.A. | N.A. | 130 | 19.23 | 1016 | 20.77 | 177 | 22.03 |
| 45 | 2019-11-09 | 2212 | 19.85 | 147 | 16.33 | N.A. | N.A. | 850 | 16.82 | 944 | 20.66 | 247 | 27.94 |
| 46 | 2019-11-16 | 2249 | 18.41 | 191 | 15.18 | N.A. | N.A. | 804 | 14.55 | 954 | 19.39 | 279 | 28.67 |
| 47 | 2019-11-23 | 2760 | 16.09 | 177 | 12.43 | N.A. | N.A. | 758 | 16.62 | 1069 | 14.97 | 268 | 19.4 |
| 48 | 2019-11-30 | 2757 | 13.75 | 185 | 11.35 | N.A. | N.A. | 779 | 11.17 | 1007 | 14.9 | 221 | 16.29 |
| 49 | 2019-12-07 | 3182 | 12.35 | 221 | 13.12 | N.A. | N.A. | 884 | 12.22 | 1246 | 11.96 | 229 | 14.85 |
| 50 | 2019-12-14 | 2795 | 10.91 | 223 | 10.31 | N.A. | N.A. | 934 | 9.96 | 1313 | 9.37 | 293 | 20.14 |
| 51 | 2019-12-21 | 2973 | 8.95 | 202 | 10.89 | N.A. | N.A. | 983 | 7.12 | 1455 | 7.77 | 305 | 18.36 |
| 52 | 2019-12-28 | 4098 | 8.15 | 185 | 8.11 | N.A. | N.A. | 1022 | 6.85 | 1782 | 6.62 | 268 | 20.9 |
| 1 | 2020-01-04 | 5215 | 7.04 | 270 | 8.15 | N.A. | N.A. | 1615 | 6.13 | 1925 | 6.39 | 404 | 16.58 |
| 2 | 2020-01-11 | 5327 | 6.7 | 267 | 5.99 | N.A. | N.A. | 1882 | 5.15 | 2041 | 6.91 | 273 | 16.12 |
| 3 | 2020-01-18 | 4403 | 5.43 | 217 | 4.15 | N.A. | N.A. | 1426 | 4 | 1715 | 6.24 | 215 | 10.7 |
| 4 | 2020-01-25 | 4634 | 4.7 | 278 | 3.6 | N.A. | N.A. | 1291 | 3.56 | 1838 | 4.62 | 404 | 11.14 |
Positive Coronovirus tests
Figure 8: Positive Coronavirus (coron) Tests (%) in Canada by Region by Week of Report
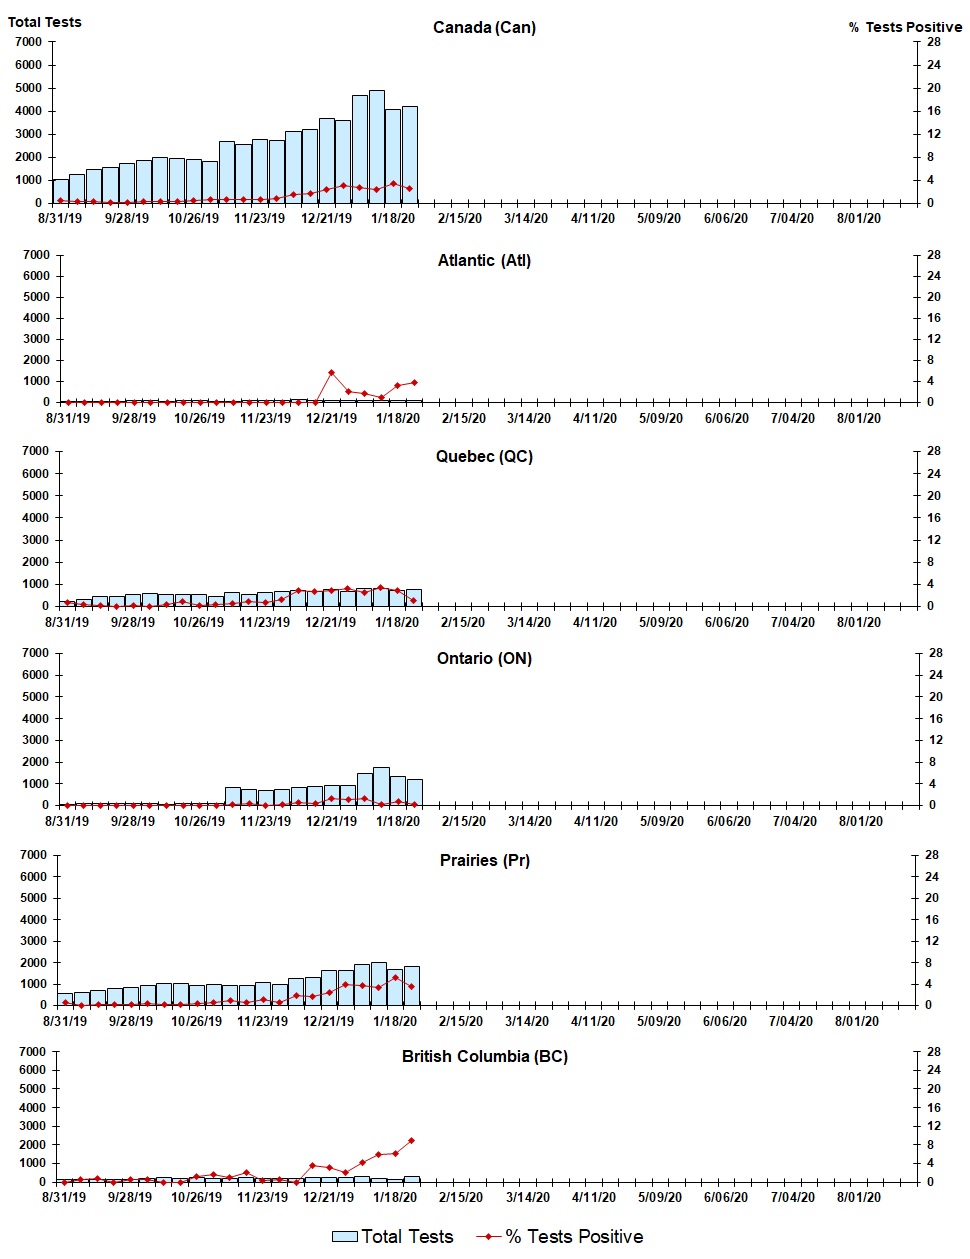
Figure 8: Positive Coronavirus (coron) Tests (%) in Canada by Region by Week of Report - Text description
| Week | Week End | Canada Tests | Coron % |
Atl Tests | Coron % |
QC Tests | Coron % |
ON Tests | Coron % |
Pr Tests | Coron % |
BC Tests | Coron % |
|---|---|---|---|---|---|---|---|---|---|---|---|---|---|
| 35 | 2019-08-31 | 1043 | 0.5 | 38 | 0.0 | 246 | 0.8 | 36 | 0.0 | 577 | 0.5 | 116 | 0.0 |
| 36 | 2019-09-07 | 1257 | 0.2 | 46 | 0.0 | 338 | 0.3 | 87 | 0.0 | 605 | 0.0 | 155 | 0.7 |
| 37 | 2019-09-14 | 1464 | 0.2 | 54 | 0.0 | 444 | 0.2 | 84 | 0.0 | 723 | 0.1 | 147 | 0.7 |
| 38 | 2019-09-21 | 1567 | 0.1 | 42 | 0.0 | 452 | 0.0 | 105 | 0.0 | 793 | 0.1 | 159 | 0.0 |
| 39 | 2019-09-28 | 1736 | 0.2 | 74 | 0.0 | 548 | 0.2 | 101 | 0.0 | 824 | 0.1 | 165 | 0.6 |
| 40 | 2019-10-05 | 1855 | 0.2 | 79 | 0.0 | 582 | 0.0 | 86 | 0.0 | 915 | 0.3 | 182 | 0.6 |
| 41 | 2019-10-12 | 1965 | 0.2 | 71 | 0.0 | 550 | 0.4 | 68 | 0.0 | 1006 | 0.2 | 253 | 0.0 |
| 42 | 2019-10-19 | 1922 | 0.31 | 77 | 0 | 551 | 0.91 | 91 | 0 | 1005 | 0.1 | 184 | 0 |
| 43 | 2019-10-26 | 1908 | 0.42 | 85 | 0 | 526 | 0.19 | 77 | 0 | 956 | 0.42 | 248 | 1.21 |
| 44 | 2019-11-02 | 1824 | 0.6 | 66 | 0 | 466 | 0.43 | 113 | 0 | 991 | 0.61 | 177 | 1.69 |
| 45 | 2019-11-09 | 2679 | 0.6 | 69 | 0 | 622 | 0.48 | 835 | 0.24 | 925 | 0.97 | 204 | 0.98 |
| 46 | 2019-11-16 | 2530 | 0.71 | 84 | 0 | 538 | 0.93 | 725 | 0.28 | 924 | 0.65 | 238 | 2.1 |
| 47 | 2019-11-23 | 2749 | 0.62 | 90 | 0 | 643 | 0.78 | 708 | 0 | 1058 | 1.04 | 221 | 0.45 |
| 48 | 2019-11-30 | 2705 | 0.81 | 106 | 0 | 684 | 1.32 | 731 | 0.27 | 991 | 0.61 | 171 | 0.58 |
| 49 | 2019-12-07 | 3102 | 1.58 | 122 | 0 | 728 | 2.88 | 819 | 0.49 | 1239 | 1.94 | 171 | 0 |
| 50 | 2019-12-14 | 3201 | 1.72 | 88 | 0 | 679 | 2.8 | 878 | 0.34 | 1302 | 1.69 | 222 | 3.6 |
| 51 | 2019-12-21 | 3505 | 2.4 | 89 | 5.62 | 764 | 2.88 | 915 | 1.2 | 1455 | 2.47 | 254 | 3.15 |
| 52 | 2019-12-28 | 3672 | 2.94 | 94 | 2.13 | 665 | 3.31 | 939 | 1.17 | 1770 | 3.79 | 178 | 2.25 |
| 1 | 2020-01-04 | 4660 | 2.75 | 114 | 1.75 | 820 | 2.56 | 1493 | 1.21 | 1916 | 3.65 | 281 | 4.27 |
| 2 | 2020-01-11 | 4914 | 2.36 | 110 | 0.91 | 818 | 3.42 | 1739 | 0.23 | 2025 | 3.41 | 185 | 5.95 |
| 3 | 2020-01-18 | 4046 | 3.34 | 92 | 3.26 | 731 | 2.87 | 1339 | 0.67 | 1703 | 5.28 | 149 | 6.04 |
| 4 | 2020-01-25 | 4204 | 2.59 | 105 | 3.81 | 788 | 1.02 | 1183 | 0.17 | 1816 | 3.63 | 278 | 8.99 |
Page details
- Date modified: