Moisture meter comparisons
Every year, we verify the accuracy of 919/3.5” and UGMA (Unified Grain Moisture Algorithm) moisture meters against the reference method (oven drying method). Our research confirms that, when properly calibrated and maintained, both types of moisture meter predict similar moisture results.
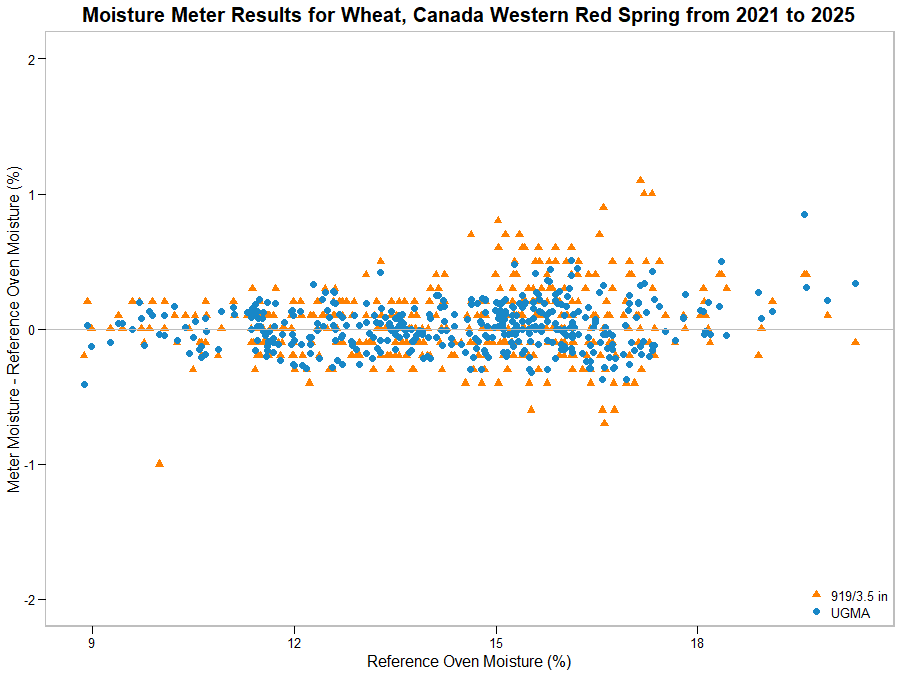
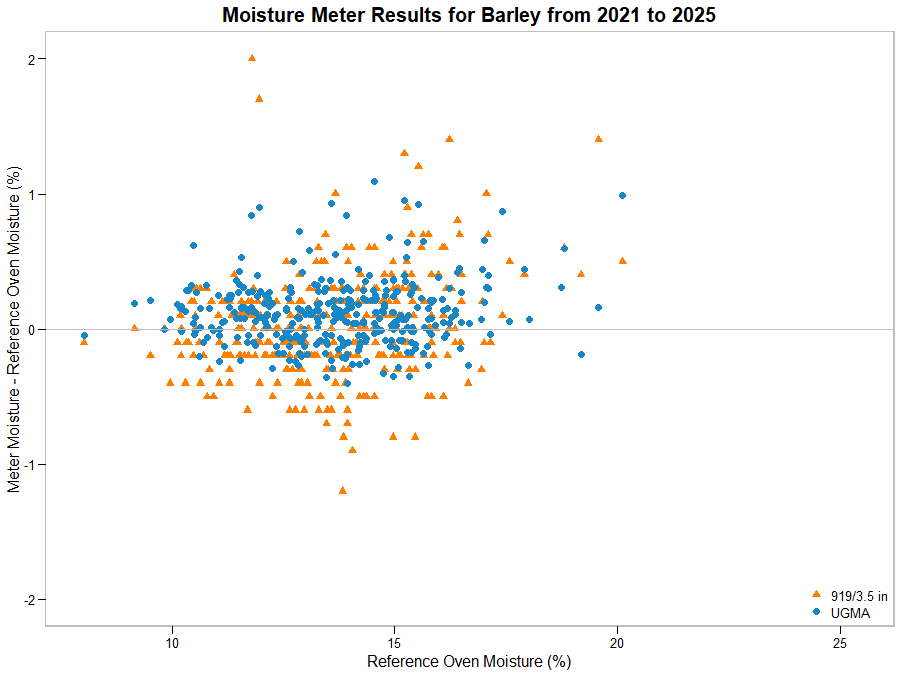
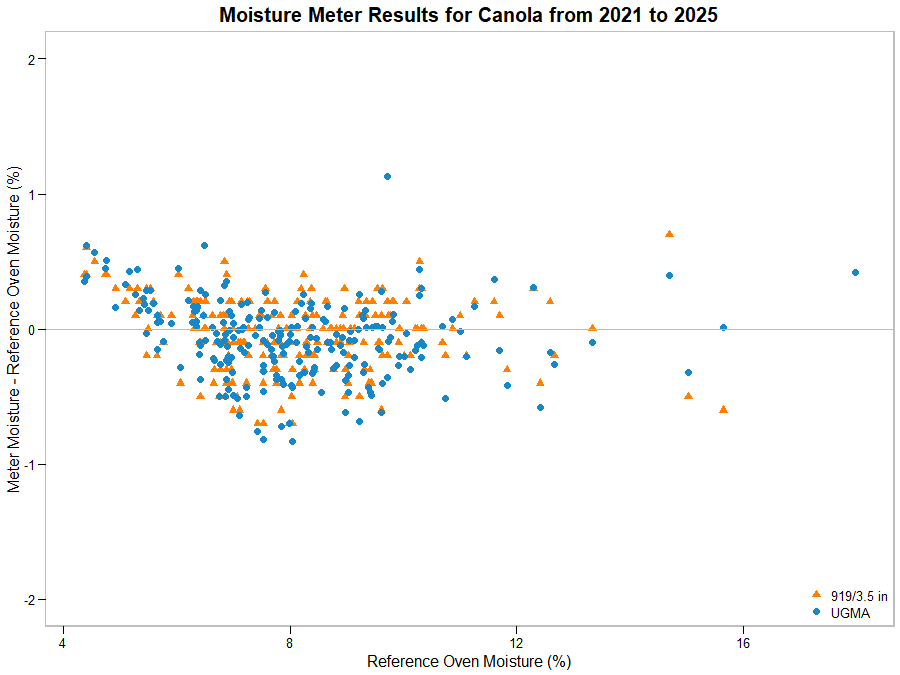
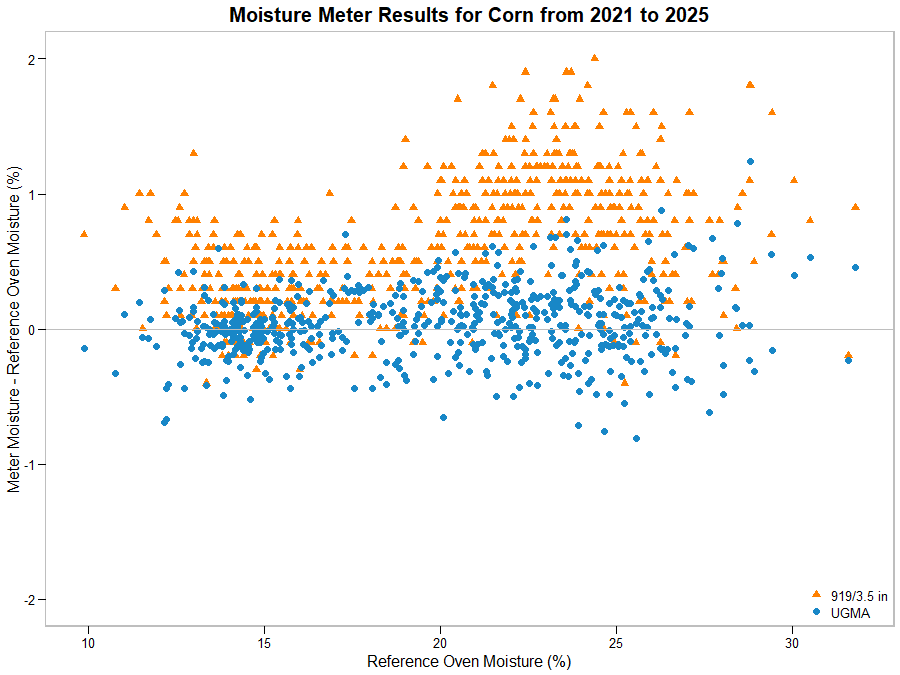
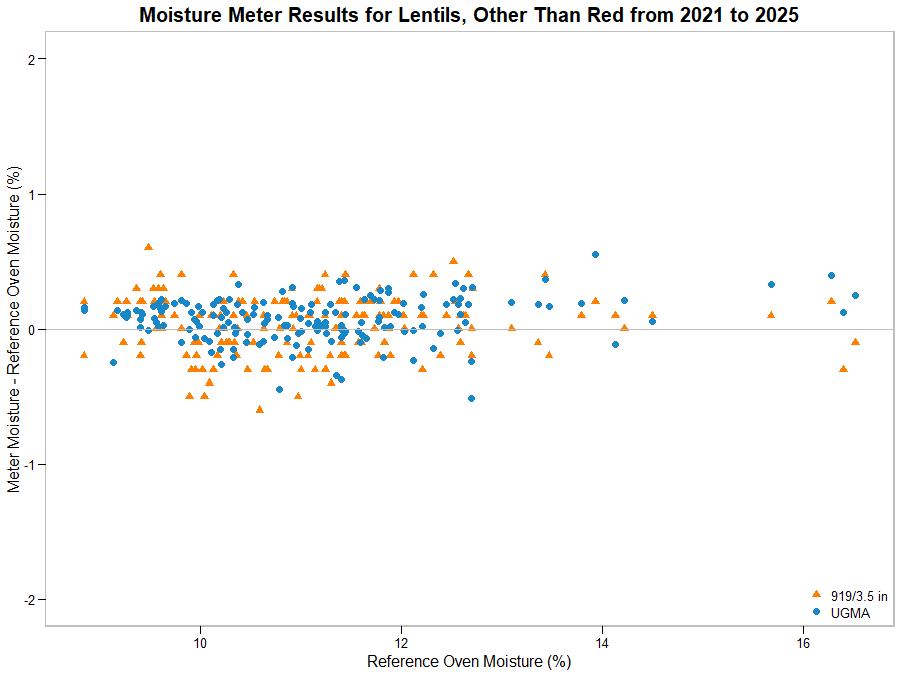
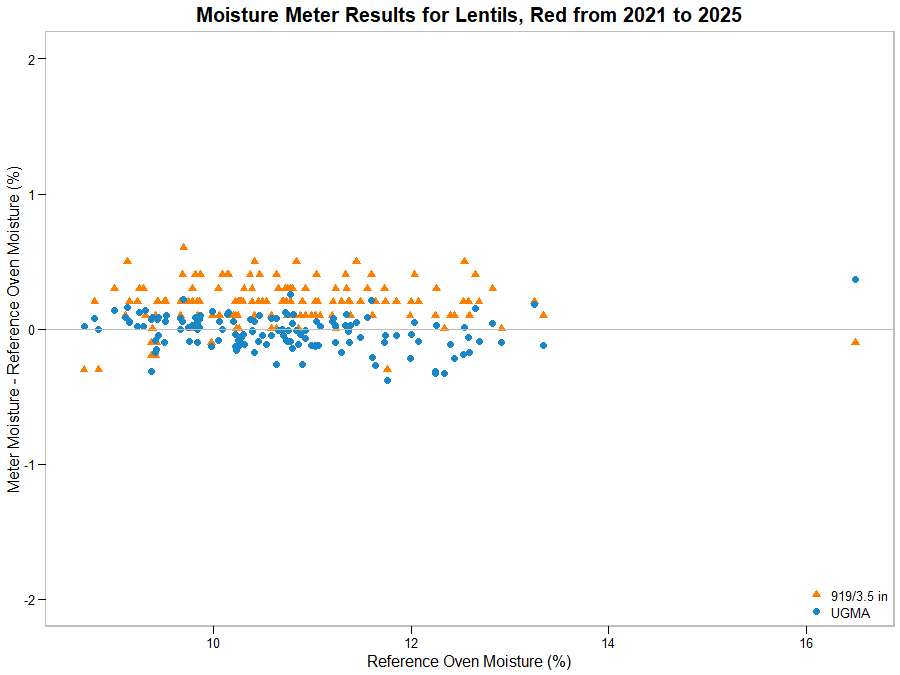
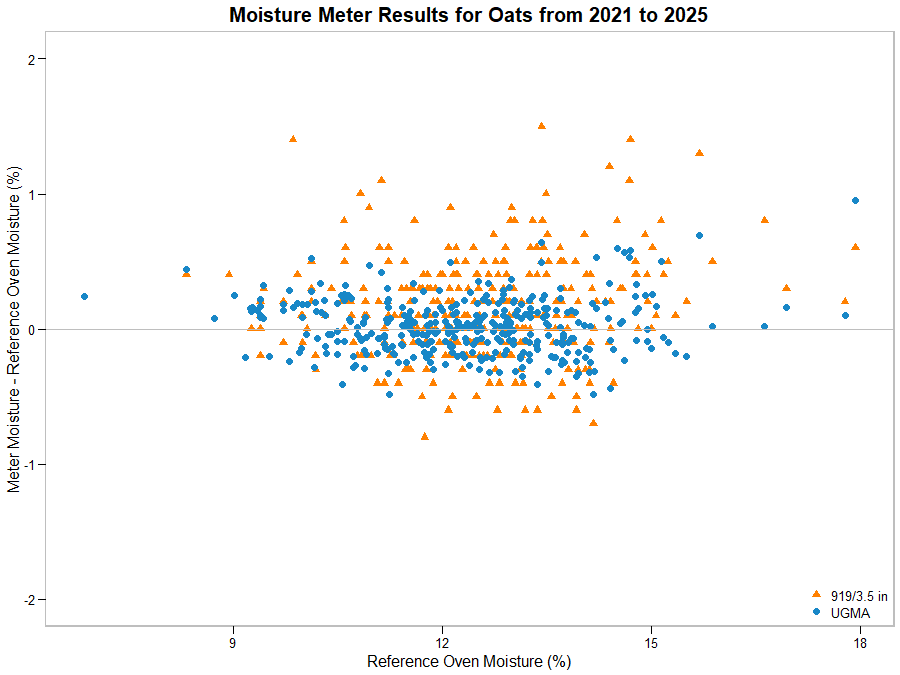
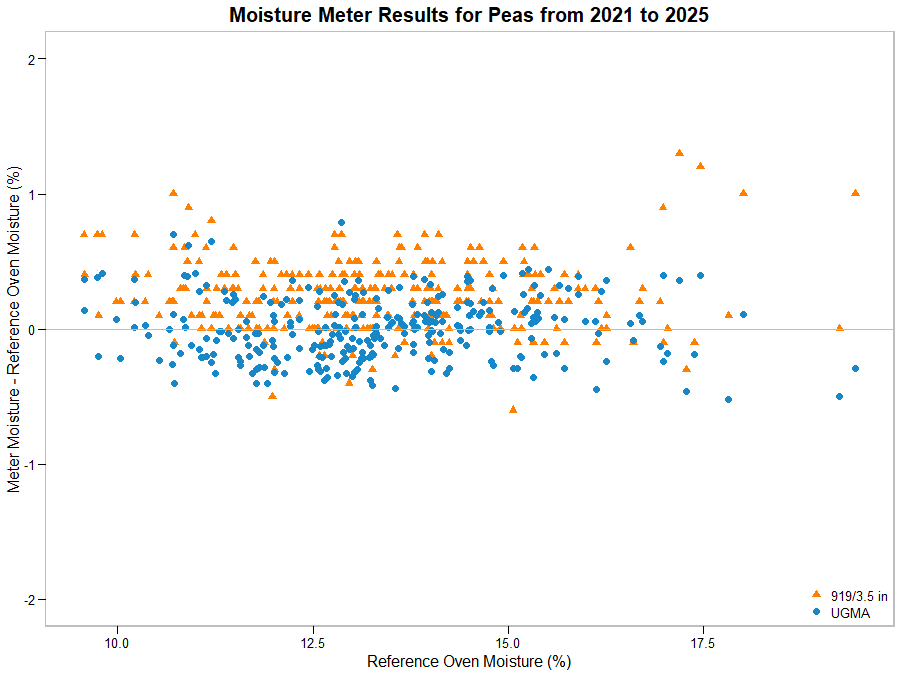
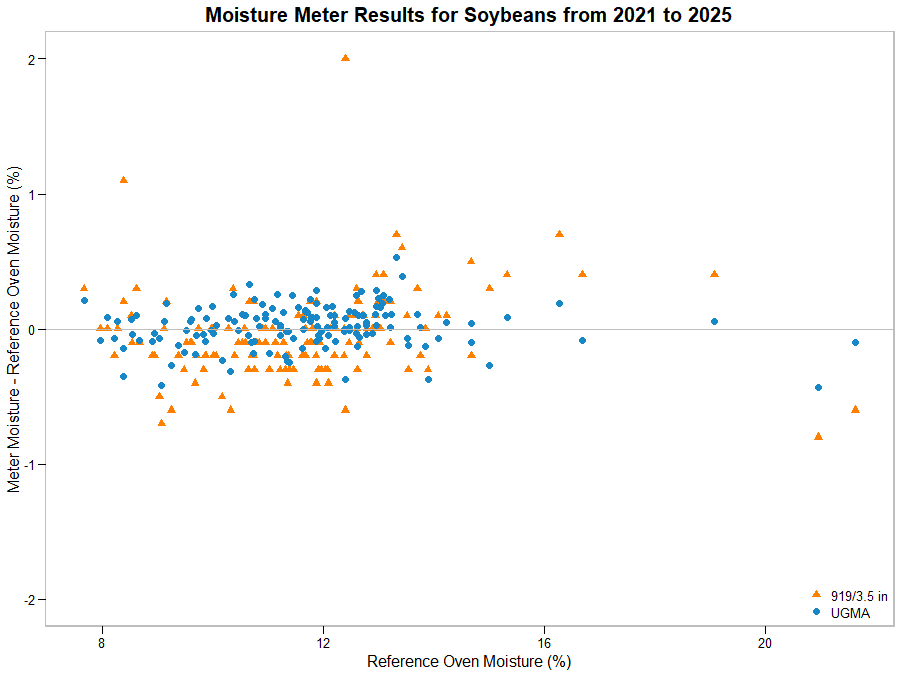
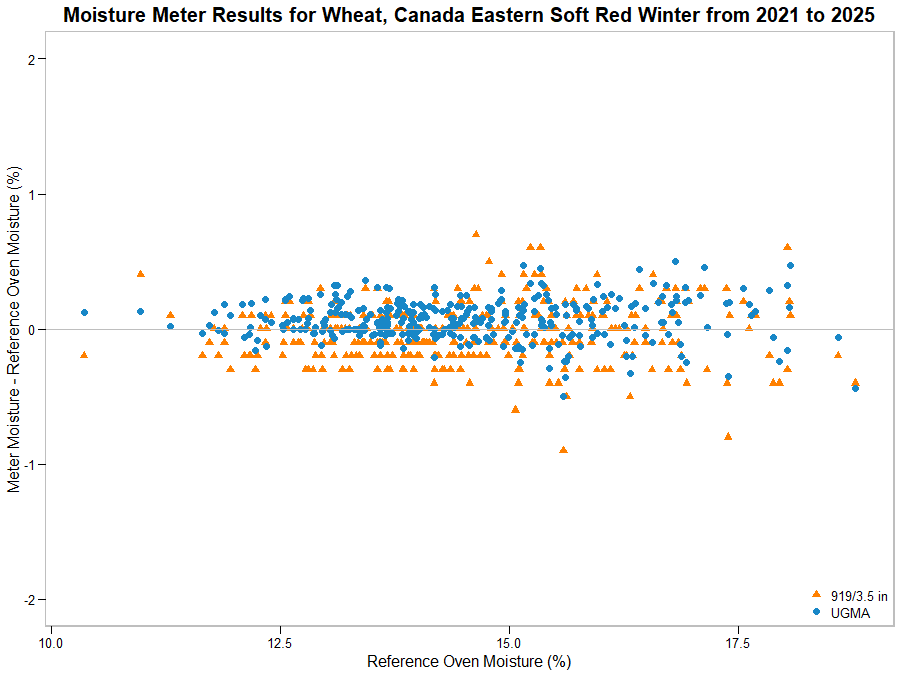
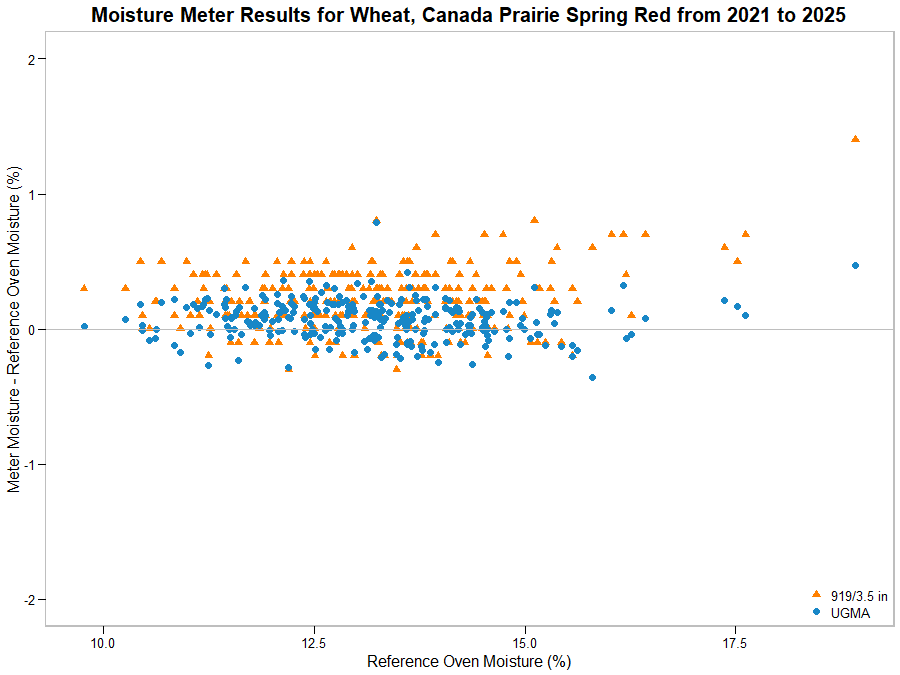
These figures show the performance of moisture meters from the last 5 crop years based on our current calibrations. All samples were tested at 22°C. Data was collected using our master moisture instruments for the crop listed on each figure. Each figure shows the difference between the meter results and the reference oven results. The orange triangles show results from model 919/3.5” moisture meters and the blue circles show results from UGMA moisture meters.
The number of samples tested, the average difference between the meter and reference oven, and the standard deviation of the differences are provided for each crop. The average difference value is a measure of the overall difference between the meter and reference oven results. The standard deviation of differences (SDD) value is a measure of the variability of differences between the meter results and the reference oven results.
Moisture meter comparison results by commodity
-
Barley
We evaluated 351 samples between 2021 and 2025 on our master 919/3.5" and UGMA moisture meters along with our reference oven method.
- The model 919/3.5" gives an average difference of 0.1% and a SDD of 0.54
- The UGMA models give an average difference of 0.1% and a SDD of 0.30
- 85% of the model 919/3.5" data points and 94% of the UGMA data points are within ±0.5% of the reference oven results
- 50% of the model 919/3.5" data points and 64% of the UGMA data points are within ±0.2% of the reference oven results
-
Canola
We evaluated 231 samples between 2021 and 2025 on our master 919/3.5" and UGMA moisture meters along with our reference oven method.
- The model 919/3.5" gives an average difference of 0.0% and a SDD of 0.27
- The UGMA models give an average difference of -0.1% and a SDD of 0.28
- 93% of the model 919/3.5" data points and 93% of the UGMA data points are within ±0.5% of the reference oven results
- 55% of the model 919/3.5" data points and 57% of the UGMA data points are within ±0.2% of the reference oven results
-
Corn
We evaluated 596 samples between 2021 and 2025 on our master 919/3.5" and UGMA moisture meters along with our reference oven method.
- The model 919/3.5" gives an average difference of 0.6% and a SDD of 0.55
- The UGMA models give an average difference of 0.0% and a SDD of 0.26
- 45% of the model 919/3.5" data points and 94% of the UGMA data points are within ±0.5% of the reference oven results
- 20% of the model 919/3.5" data points and 61% of the UGMA data points are within ±0.2% of the reference oven results
-
Lentils, other than red
We evaluated 169 samples between 2021 and 2025 on our master 919/3.5" and UGMA moisture meters along with our reference oven method.
- The model 919/3.5" gives an average difference of 0.0% and a SDD of 0.22
- The UGMA models give an average difference of 0.1% and a SDD of 0.16
- 99% of the model 919/3.5" data points and 99% of the UGMA data points are within ±0.5 % of the reference oven results
- 59% of the model 919/3.5" data points and 82% of the UGMA data points are within ±0.2% of the reference oven results
-
Lentils, red
We evaluated 138 samples between 2021 and 2025 on our master 919/3.5" and UGMA moisture meters along with our reference oven method.
- The model 919/3.5" gives an average difference of 0.2% and a SDD of 0.16
- The UGMA models give an average difference of 0.0% and a SDD of 0.12
- 99% of the model 919/3.5" data points and 100% of the UGMA data points are within ±0.5% of the reference oven results
- 53% of the model 919/3.5" data points and 90% of the UGMA data points are within ±0.2% of the reference oven results
-
Oats
We evaluated 358 samples between 2021 and 2025 on our master 919/3.5" and UGMA moisture meters along with our reference oven method.
- The model 919/3.5" gives an average difference of 0.2% and a SDD of 0.41
- The UGMA models give an average difference of 0.0% and a SDD of 0.21
- 81% of the model 919/3.5" data points and 97% of the UGMA data points are within ±0.5% of the reference oven results
- 45% of the model 919/3.5" data points and 71% of the UGMA data points are within ±0.2% of the reference oven results
-
Peas
We evaluated 291 samples between 2021 and 2025 on our master 919/3.5" and UGMA moisture meters along with our reference oven method.
- The model 919/3.5" gives an average difference of 0.2% and a SDD of 0.26
- The UGMA models give an average difference of 0.0% and a SDD of 0.23
- 85% of the model 919/3.5" data points and 98% of the UGMA data points are within ±0.5% of the reference oven results
- 42% of the model 919/3.5" data points and 59% of the UGMA data points are within ±0.2% of the reference oven results
-
Soybeans
We evaluated 149 samples between 2021 and 2025 on our master 919/3.5" and UGMA moisture meters along with our reference oven method.
- The model 919/3.5" gives an average difference of 0.0% and a SDD of 0.32
- The UGMA models give an average difference of 0.0% and a SDD of 0.16
- 91% of the model 919/3.5" data points and 93% of the UGMA data points are within ±0.5% of the reference oven results
- 58% of the model 919/3.5" data points and 82% of the UGMA data points are within ±0.2% of the reference oven results
-
Wheat, Canada Eastern Soft Red Winter
We evaluated 335 samples between 2021 and 2025 on our master 919/3.5" and UGMA moisture meters along with our reference oven method.
- The model 919/3.5" gives an average difference of 0.0% and a SDD of 0.22
- The UGMA models give an average difference of 0.1% and a SDD of 0.15
- 97% of the model 919/3.5" data points and 100% of the UGMA data points are within ±0.5 % of the reference oven results
- 65% of the model 919/3.5" data points and 80% of the UGMA data points are within ±0.2% of the reference oven results
-
Wheat, Canada Eastern White Winter
We evaluated 135 samples between 2021 and 2025 on our master 919/3.5" and UGMA moisture meters along with our reference oven method.
- The model 919/3.5" gives an average difference of 0.1% and a SDD of 0.29
- The UGMA models give an average difference of 0.1% and a SDD of 0.16
- 90% of the model 919/3.5" data points and 100% of the UGMA data points are within ±0.5% of the reference oven results
- 48% of the model 919/3.5" data points and 73% of the UGMA data points are within ±0.2% of the reference oven results

-
Wheat, Canada Prairie Spring Red
We evaluated 285 samples between 2021 and 2025 on our master 919/3.5" and UGMA moisture meters along with our reference oven method.
- The model 919/3.5" gives an average difference of 0.2 % and a SDD of 0.22
- The UGMA models give an average difference of 0.1 % and a SDD of 0.14
- 92% of the model 919/3.5" data points and 100% of the UGMA data points are within ±0.5% of the reference oven results
- 51% of the model 919/3.5" data points and 82% of the UGMA data points are within ±0.2% of the reference oven results
-
Wheat, Canada Western Amber Durum
We evaluated 209 samples between 2021 and 2025 on our master 919/3.5" and UGMA moisture meters along with our reference oven method.
- The model 919/3.5" gives an average difference of 0.1% and a SDD of 0.25
- The UGMA models give an average difference of 0.0% and a SDD of 0.19
- 94% of the model 919/3.5" data points and 97% of the UGMA data points are within ±0.5% of the reference oven results
- 67% of the model 919/3.5" data points and 82% of the UGMA data points are within ±0.2% of the reference oven results

-
Wheat, Canada Western Red Spring
We evaluated 403 samples between 2021 and 2025 on our master 919/3.5" and UGMA moisture meters along with our reference oven method.
- The model 919/3.5" gives an average difference of 0.0% and a SDD of 0.26
- The UGMA models give an average difference of 0.0% and a SDD of 0.17
- 94% of the model 919/3.5" data points and 100% of the UGMA data points are within ±0.5% of the reference oven results
- 64% of the model 919/3.5" data points and 79% of the UGMA data points are within ±0.2% of the reference oven results