
Culture Satellite Account
The Culture Satellite Account (CSA) is an accounting framework created to better measure the economic importance of culture, arts, heritage and sport in the Canadian economy.
Video — Updating the Culture Satellite Account (CSA)
The most recent data publications can be found on the Statistics Canada website:
- International Trade of Culture and Sport Products for 2013-2021
- The Provincial and Territorial Culture Indicators for 2010-2021
- Tourism Spending on Culture and Sport Products for 2010-2016
For further information on the concepts behind the CSA, please refer to the Conceptual Framework for Culture Statistics 2011, the Classification Guide for the Canadian Framework for Culture Statistics 2011 and Satellite Accounting in Canada.
The CSA is developed by Statistics Canada with the support of a diverse group of partners referred to as the Culture Statistics Strategy Consortium, which consists of:
- Canadian Heritage
- The Provincial/Territorial Ministries of Culture and/or Heritage
- Canada Council for the Arts
- Telefilm Canada
- Cultural Human Resources Council
- Ontario Creates
- Ontario Arts Council
- Creative City Network of Canada and all participating municipalities
- Canadian Crafts Federation
- Parks Canada
- Canadian Association of Performing Arts (CAPACOA)
If you have technical questions related to the concepts, methods or data quality of the CSA, please contact Statistics Canada by phone at 1-800-263-1136; or email General enquiries and comments.
For Media Relations please call 613-951-4636; or email Statistics Canada's media hotline.
If you have questions regarding the partnership behind the Culture Statistics Strategy, please contact the Department of Canadian Heritage.
Infographics on this page
National Culture Indicators for 2023 (Fourth Quarter)
- National Culture Indicators - Gross Domestic Product and Jobs
Detailed Figures for 2023 (Fourth Quarter) - National Sport Indicators - Gross Domestic Product and Jobs
Detailed Figures for 2023 (Fourth Quarter)
International Trade of Culture and Sport Products for 2013-2021
- International Trade of Culture Products for 2013-2021
- International Trade of Sport Products for 2013-2021
The Provincial and Territorial Culture Indicators for 2010-2021
National Culture Indicators - Gross Domestic Product and Jobs - Detailed Figures for Fourth Quarter of 2023
Description of the infographic: National Culture Indicators - Gross Domestic Product and Jobs - Detailed Figures for Fourth Quarter of 2023
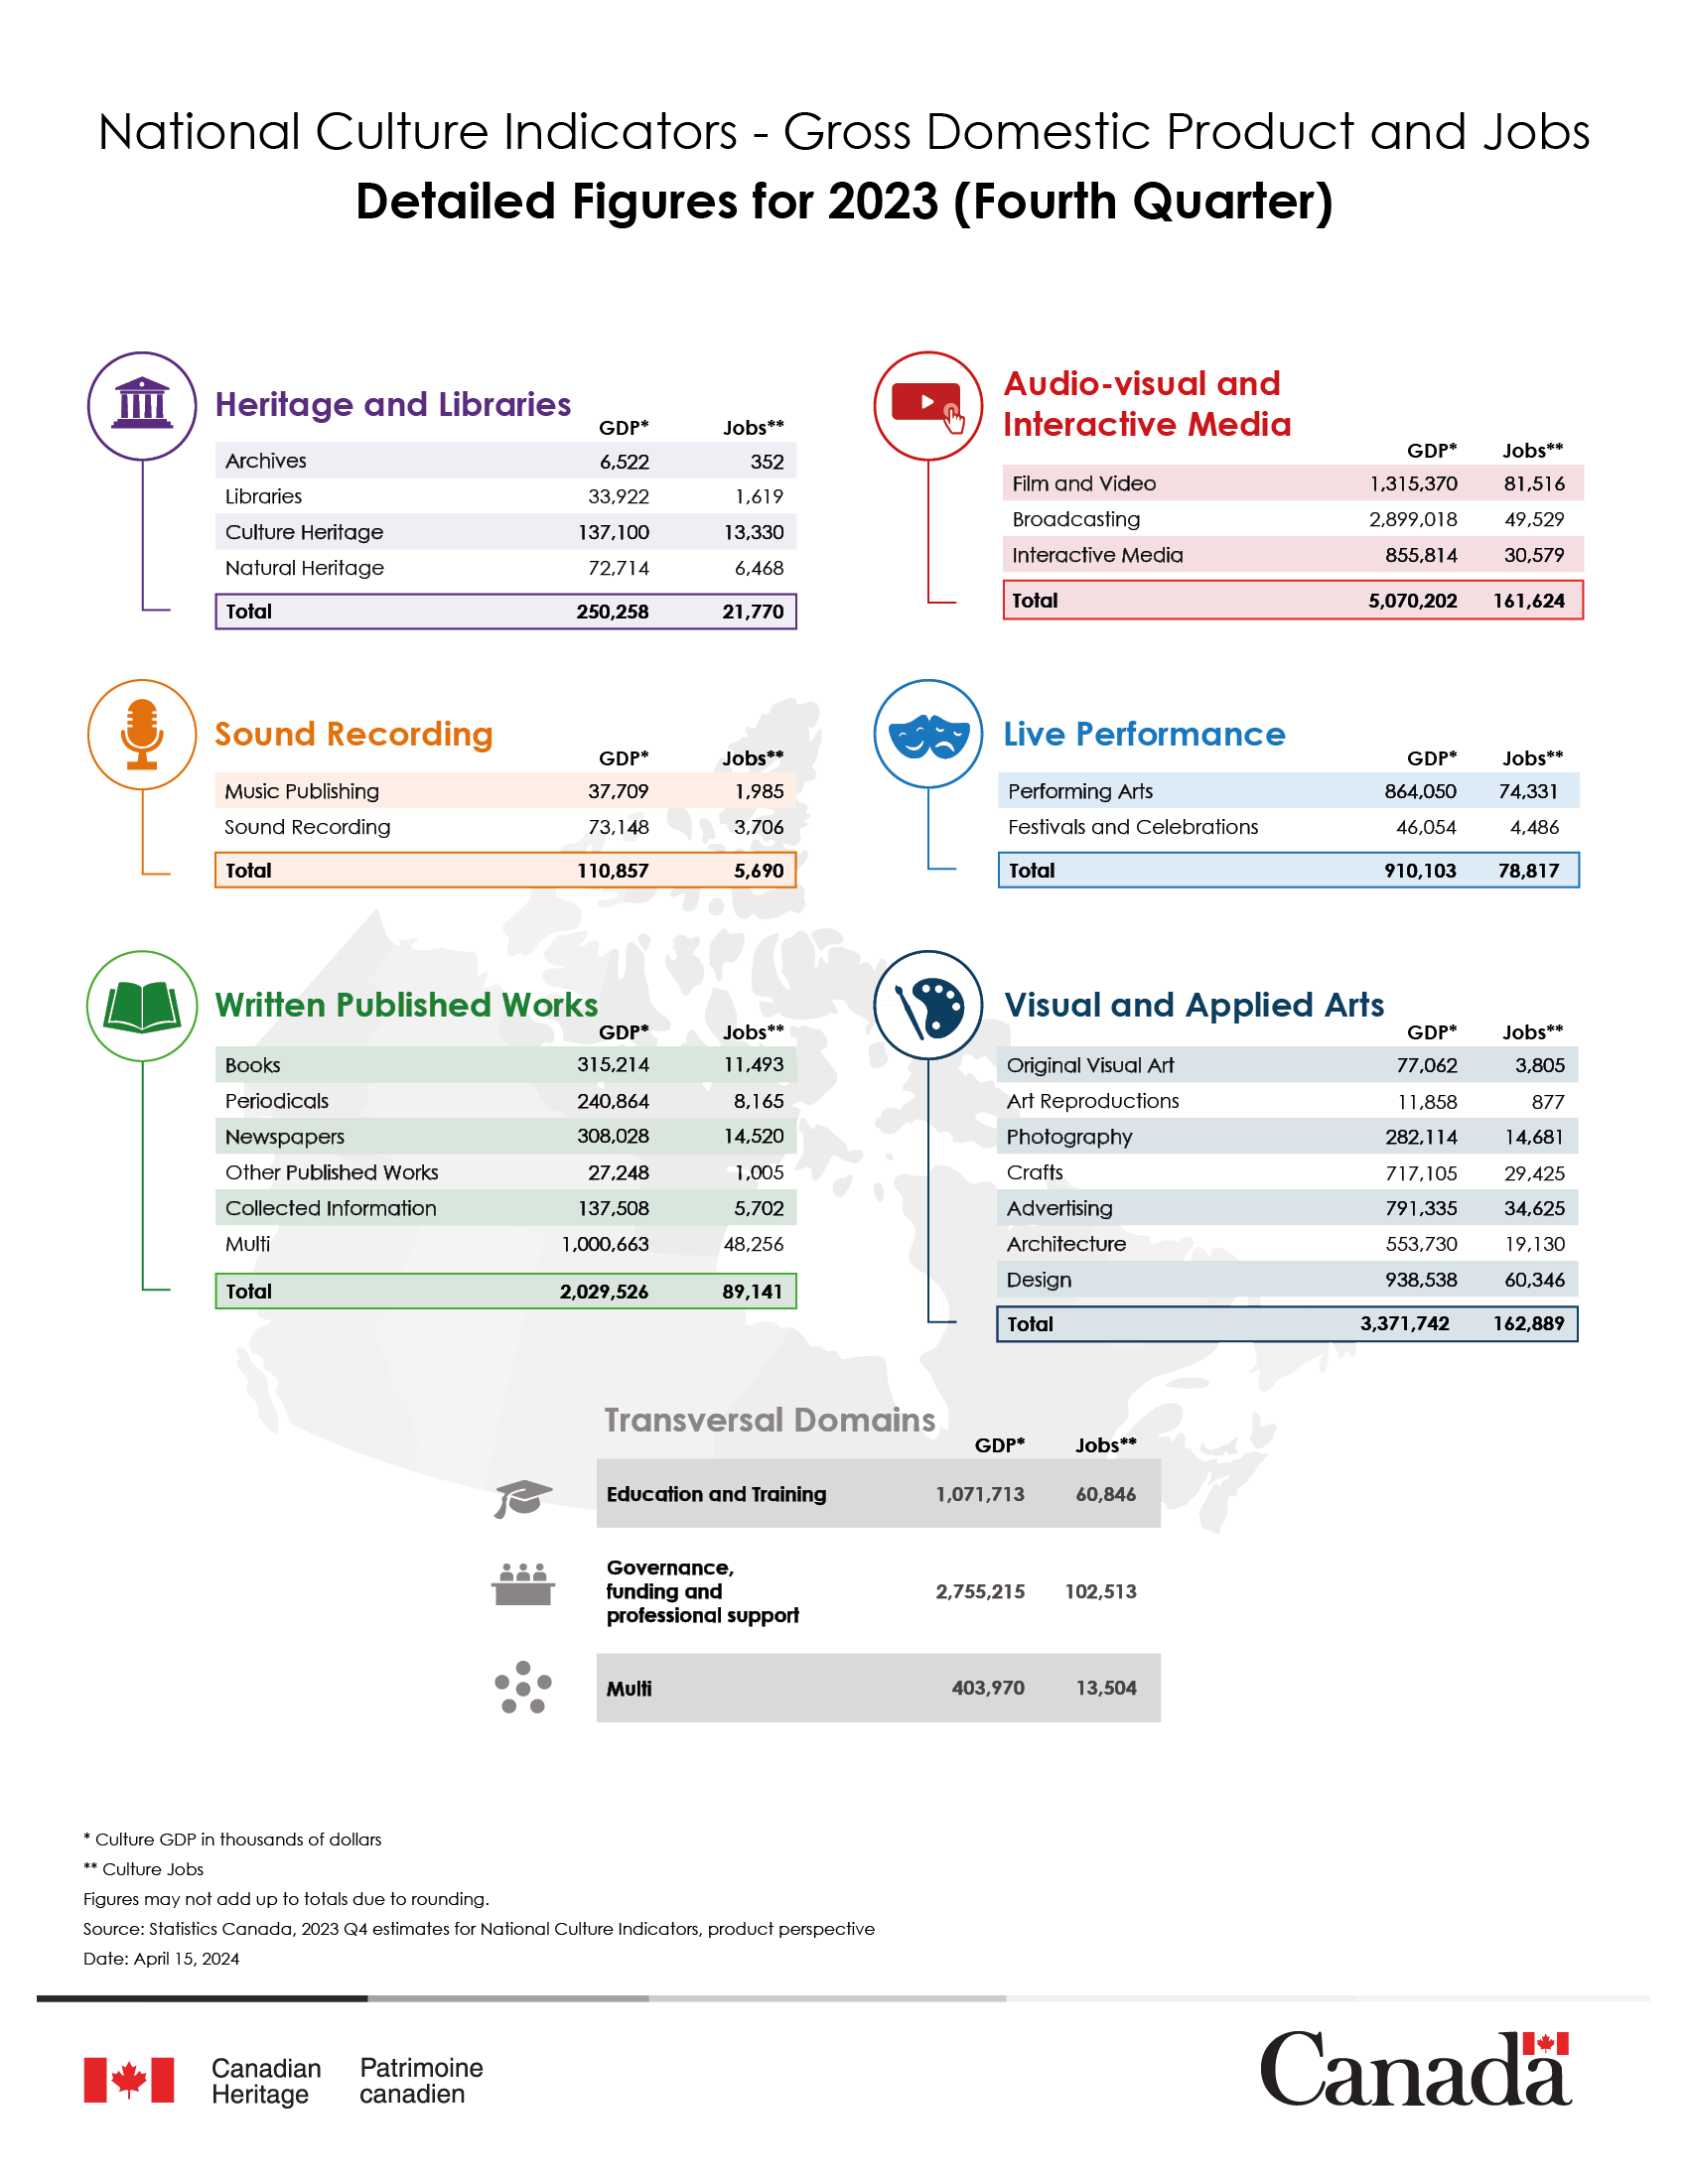
This infographic shows National Culture Indicators - Gross Domestic Product (GDP) and job numbers by domain and subdomain for the Fourth Quarter of 2023.
| Gross Domestic Product (GDP) – In thousands of dollars – Product Perspective | Jobs – Product Perspective | |
|---|---|---|
| Archives | 6,522 | 352 |
| Libraries | 33,922 | 1,619 |
| Culture Heritage | 137,100 | 13,330 |
| Natural Heritage | 72,714 | 6,468 |
| Total | 250,258 | 21,770 |
| Gross Domestic Product (GDP) – In thousands of dollars – Product Perspective | Jobs – Product Perspective | |
|---|---|---|
| Film and Video | 1,315,370 | 81,516 |
| Broadcasting | 2,899,018 | 49,529 |
| Interactive Media | 855,814 | 30,579 |
| Total | 5,070,202 | 161,624 |
| Gross Domestic Product (GDP) – In thousands of dollars – Product Perspective | Jobs – Product Perspective | |
|---|---|---|
| Music Publishing | 37,709 | 1,985 |
| Sound Recording | 73,148 | 3,706 |
| Total | 110,857 | 5,690 |
| Gross Domestic Product (GDP) – In thousands of dollars – Product Perspective | Jobs – Product Perspective | |
|---|---|---|
| Performing Arts | 864,050 | 74,331 |
| Festivals and Celebrations | 46,054 | 4,486 |
| Total | 910,103 | 78,817 |
| Gross Domestic Product (GDP) – In thousands of dollars – Product Perspective | Jobs – Product Perspective | |
|---|---|---|
| Books | 315,214 | 11,493 |
| Periodicals | 240,864 | 8,165 |
| Newspapers | 308,028 | 14,520 |
| Other Published Works | 27,248 | 1,005 |
| Collected Information | 137,508 | 5,702 |
| Multi | 1,000,663 | 48,256 |
| Total | 2,029,526 | 89,141 |
| Gross Domestic Product (GDP) – In thousands of dollars – Product Perspective | Jobs – Product Perspective | |
|---|---|---|
| Original Visual Art | 77,062 | 3,805 |
| Art Reproductions | 11,858 | 877 |
| Photography | 282,114 | 14,681 |
| Crafts | 717,105 | 29,425 |
| Advertising | 791,335 | 34,625 |
| Architecture | 553,730 | 19,130 |
| Design | 938,538 | 60,346 |
| Total | 3,371,742 | 162,889 |
| Gross Domestic Product (GDP) – In thousands of dollars – Product Perspective | Jobs – Product Perspective | |
|---|---|---|
| Education and Training | 1,071,713 | 60,846 |
| Governance, Funding and Professional development | 2,755,215 | 102,513 |
| Multi | 403,970 | 13,504 |
Figures may not add up to totals due to rounding.
Source: Statistics Canada, 2023 Q4 estimates for National Culture Indicators, product perspective
Date: April 15, 2024
National Sport Indicators - Gross Domestic Product and Jobs Detailed Figures - Fourth Quarter of 2023
Description of the infographic: National Sport Indicators - Gross Domestic Product and Jobs - Detailed Figures for Fourth Quarter of 2023
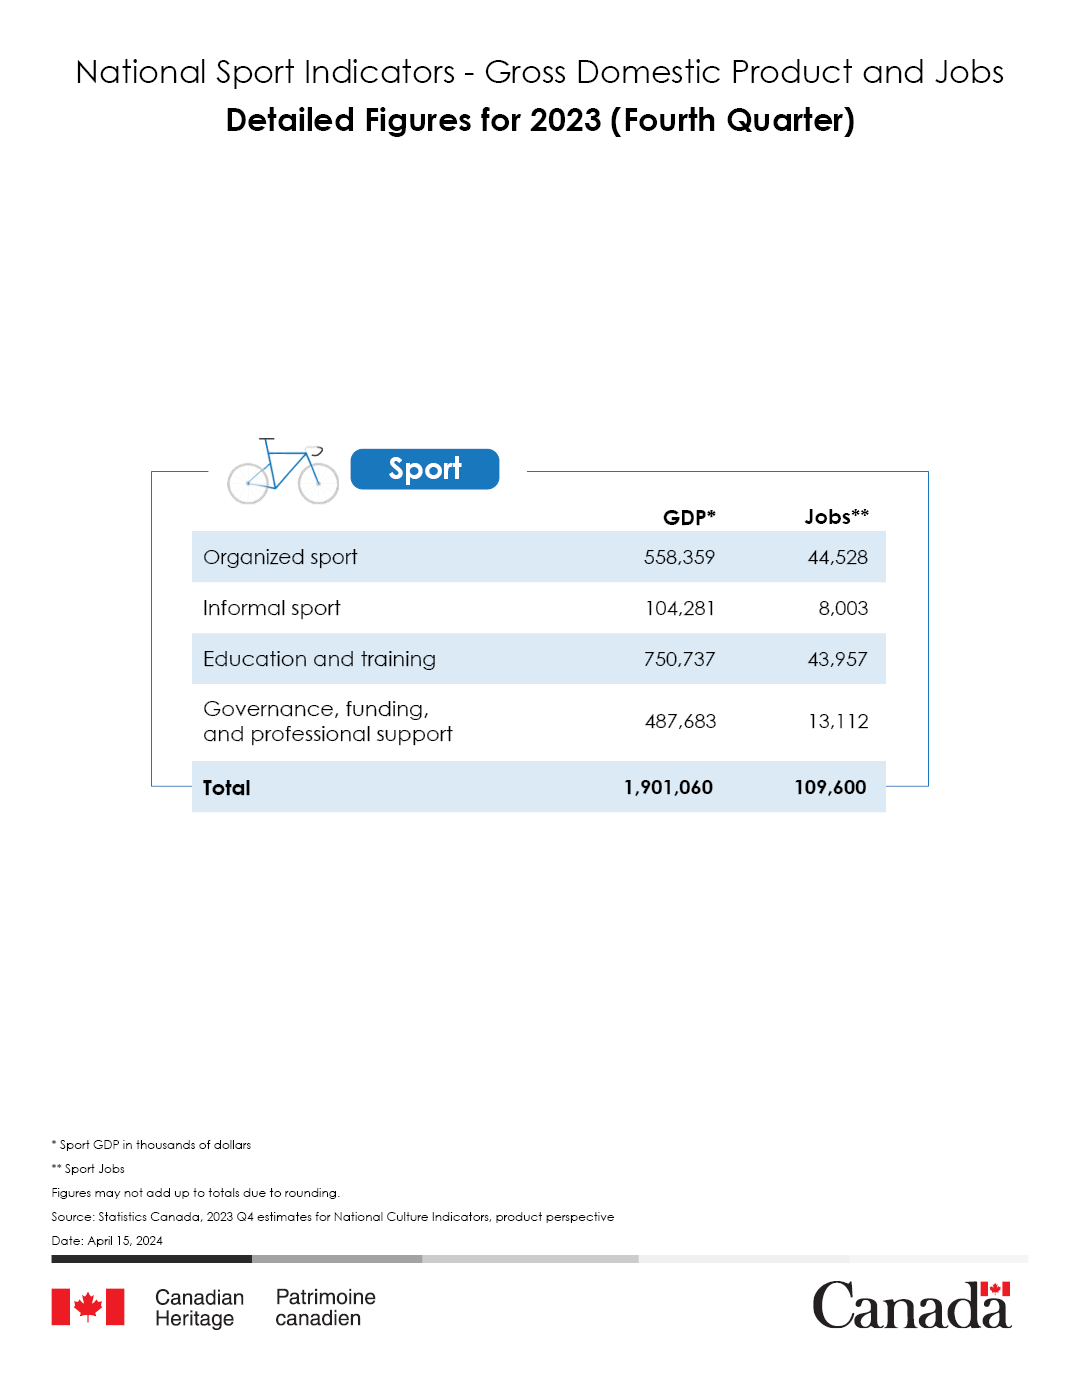
This infographic shows National Sport Indicators - Gross Domestic Product (GDP) and job numbers by domain and subdomain for the Fourth quarter of 2023.
| Sport Gross Domestic Product (GDP) – In thousands of dollars – Product Perspective | Sport Jobs – Product Perspective | |
|---|---|---|
| Organized Sport | 558,359 | 44,528 |
| Informal Sport | 104,281 | 8,003 |
| Education and Training | 750,737 | 43,957 |
| Governance, Funding and Professional development | 487,683 | 13,112 |
| Total | 1,901,060 | 109,600 |
Figures may not add up to totals due to rounding.
Source: Statistics Canada, 2023 Q4 estimates for National Culture Indicators, product perspective
Date: April 15, 2024
International Trade of Culture ProductsFootnote 1 for 2013-2021
Description of the infographic: International Trade of Culture Products for 2013-2021, Canada
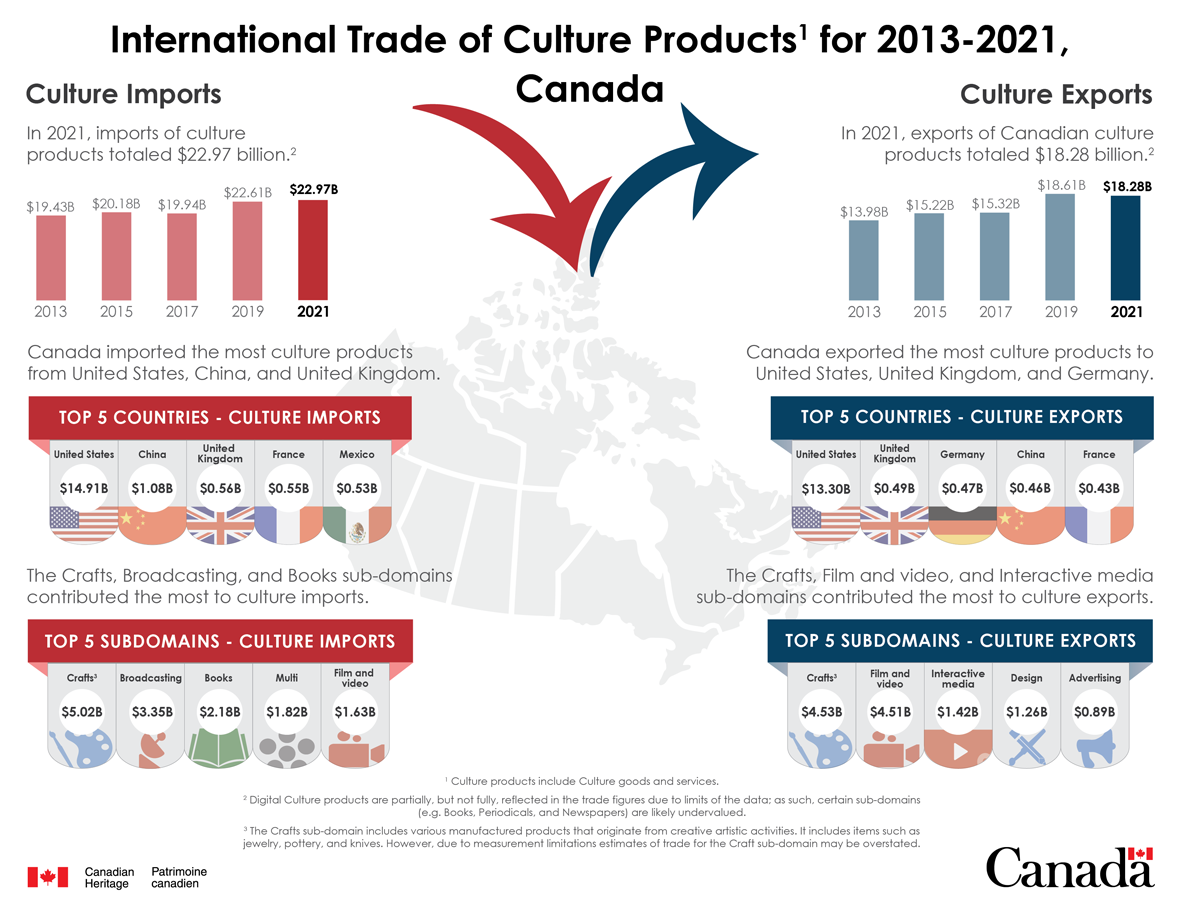
Image of a map of Canada with an arrow pointing in towards the map (representing culture imports) and an arrow pointing outwards from the map (representing culture exports).
Culture imports
In 2021, imports of culture products totaled $22.97 billion.Footnote 2
| Year | Total culture imports (culture products) |
|---|---|
| 2013 | $19.43 billion |
| 2015 | $20.18 billion |
| 2017 | $19.94 billion |
| 2019 | $22.61 billion |
| 2021 | $22.97 billion |
Canada imported the most culture products from the United States, European Union and China.
| Country | Culture imports in 2021 |
|---|---|
| United States | $14.91 billion |
| China | $1.08 billion |
| United Kingdom | $0.56 billion |
| France | $0.55 billion |
| Mexico | $0.53 billion |
The Crafts, Broadcasting, and Design sub-domains contributed the most to culture imports.
| Subdomain | Culture imports in 2021 |
|---|---|
| CraftsFootnote 3 | $5.02 billion |
| Broadcasting | $3.35 billion |
| Books | $2.18 billion |
| Multi | $1.82 billion |
| Film and Video | $1.63 billion |
Culture exports
In 2021, exports of Canadian culture products totaled $18.28 billion.Footnote 2
| Year | Total culture exports (culture products) |
|---|---|
| 2013 | $13.98 billion |
| 2015 | $15.22 billion |
| 2017 | $15.32 billion |
| 2019 | $18.61 billion |
| 2021 | $18.28 billion |
Canada exported the largest amount of culture products to the United States, United Kingdom, and Germany.
| Country | Culture exports in 2021 |
|---|---|
| United States | $13.30 billion |
| United Kingdom | $0.49 billion |
| Germany | $0.47 billion |
| China | $0.46 billion |
| France | $0.43 billion |
The Crafts, Film and video, and Interactive media sub-domains contributed the most to culture exports.
| Subdomain | Culture exports in 2021 |
|---|---|
| CraftsFootnote 3 | $4.53 billion |
| Film and Video | $4.51 billion |
| Interactive media | $1.42 billion |
| Design | $1.26 billion |
| Advertising | $0.89 million |
International Trade of Sport Products for 2013-2021
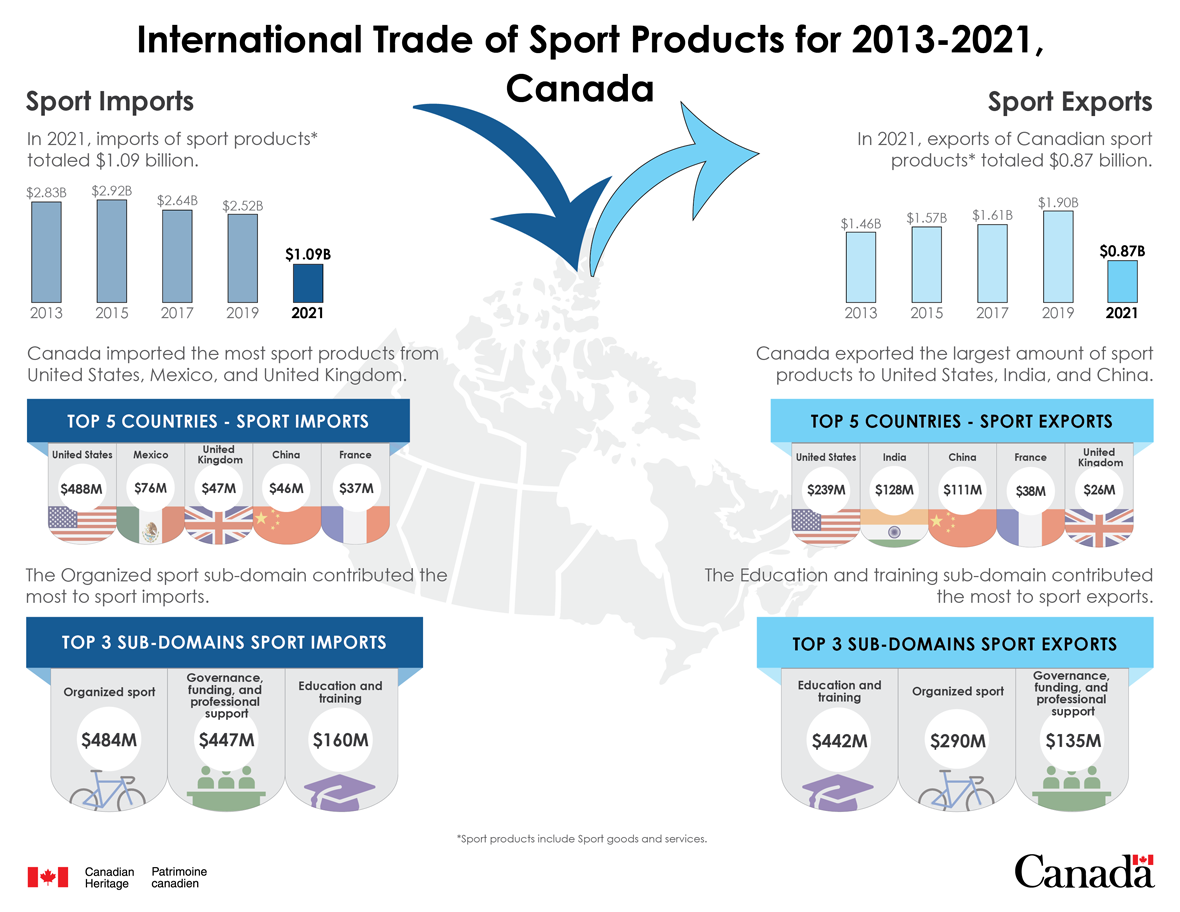
Description of the infographic: Trade of Sport Products for 2013-2021, Canada
Image of a map of Canada with an arrow pointing in towards the map (representing sport imports) and an arrow pointing outwards from the map (representing sport exports).
Sport imports
In 2021, imports of sport productsFootnote 4 totaled $1.09 billion.
| Year | Total sport imports (sport product) |
|---|---|
| 2013 | $2.83 billion |
| 2015 | $2.92 billion |
| 2017 | $2.64 billion |
| 2019 | $2.52 billion |
| 2021 | $1.09 billion |
Canada imported the most sport products from the United States, Mexico and United Kingdom
| Country | Sport imports in 2021 |
|---|---|
| United States | $488 million |
| Mexico | $76 million |
| United Kingdom | $47 million |
| China | $46 million |
| France | S37 million |
The Organized sport sub-domain contributed the most to sport imports.
| Subdomain | Sport imports in 2021 |
|---|---|
| Organized Sport | $484 million |
| Governance, funding, and professional support | $447 million |
| Education and training | $160 million |
Sport Exports
In 2021, exports of Canadian sport productsFootnote 4 $0.87 billion.
| Year | Total sport exports (sport product) |
|---|---|
| 2013 | $1.46 billion |
| 2015 | $1.57 billion |
| 2017 | $1.61 billion |
| 2019 | $1.90 billion |
| 2021 | $0.87 billion |
Canada exported the largest amount of sport products to the United States, India, and China.
| Country | Sport exports in 2021 |
|---|---|
| United States | $239 million |
| India | $128 million |
| China | $111 million |
| France | $38 million |
| United Kingdom | $26 million |
The Education and training sport subdomain contributed the most to sport exports.
| Subdomain | Sport exports in 2021 |
|---|---|
| Education and training | $442 million |
| Organized sport | $290 million |
| Governance, funding, and professional support | $135 million |
Provincial/Territorial Culture Totals for 2021
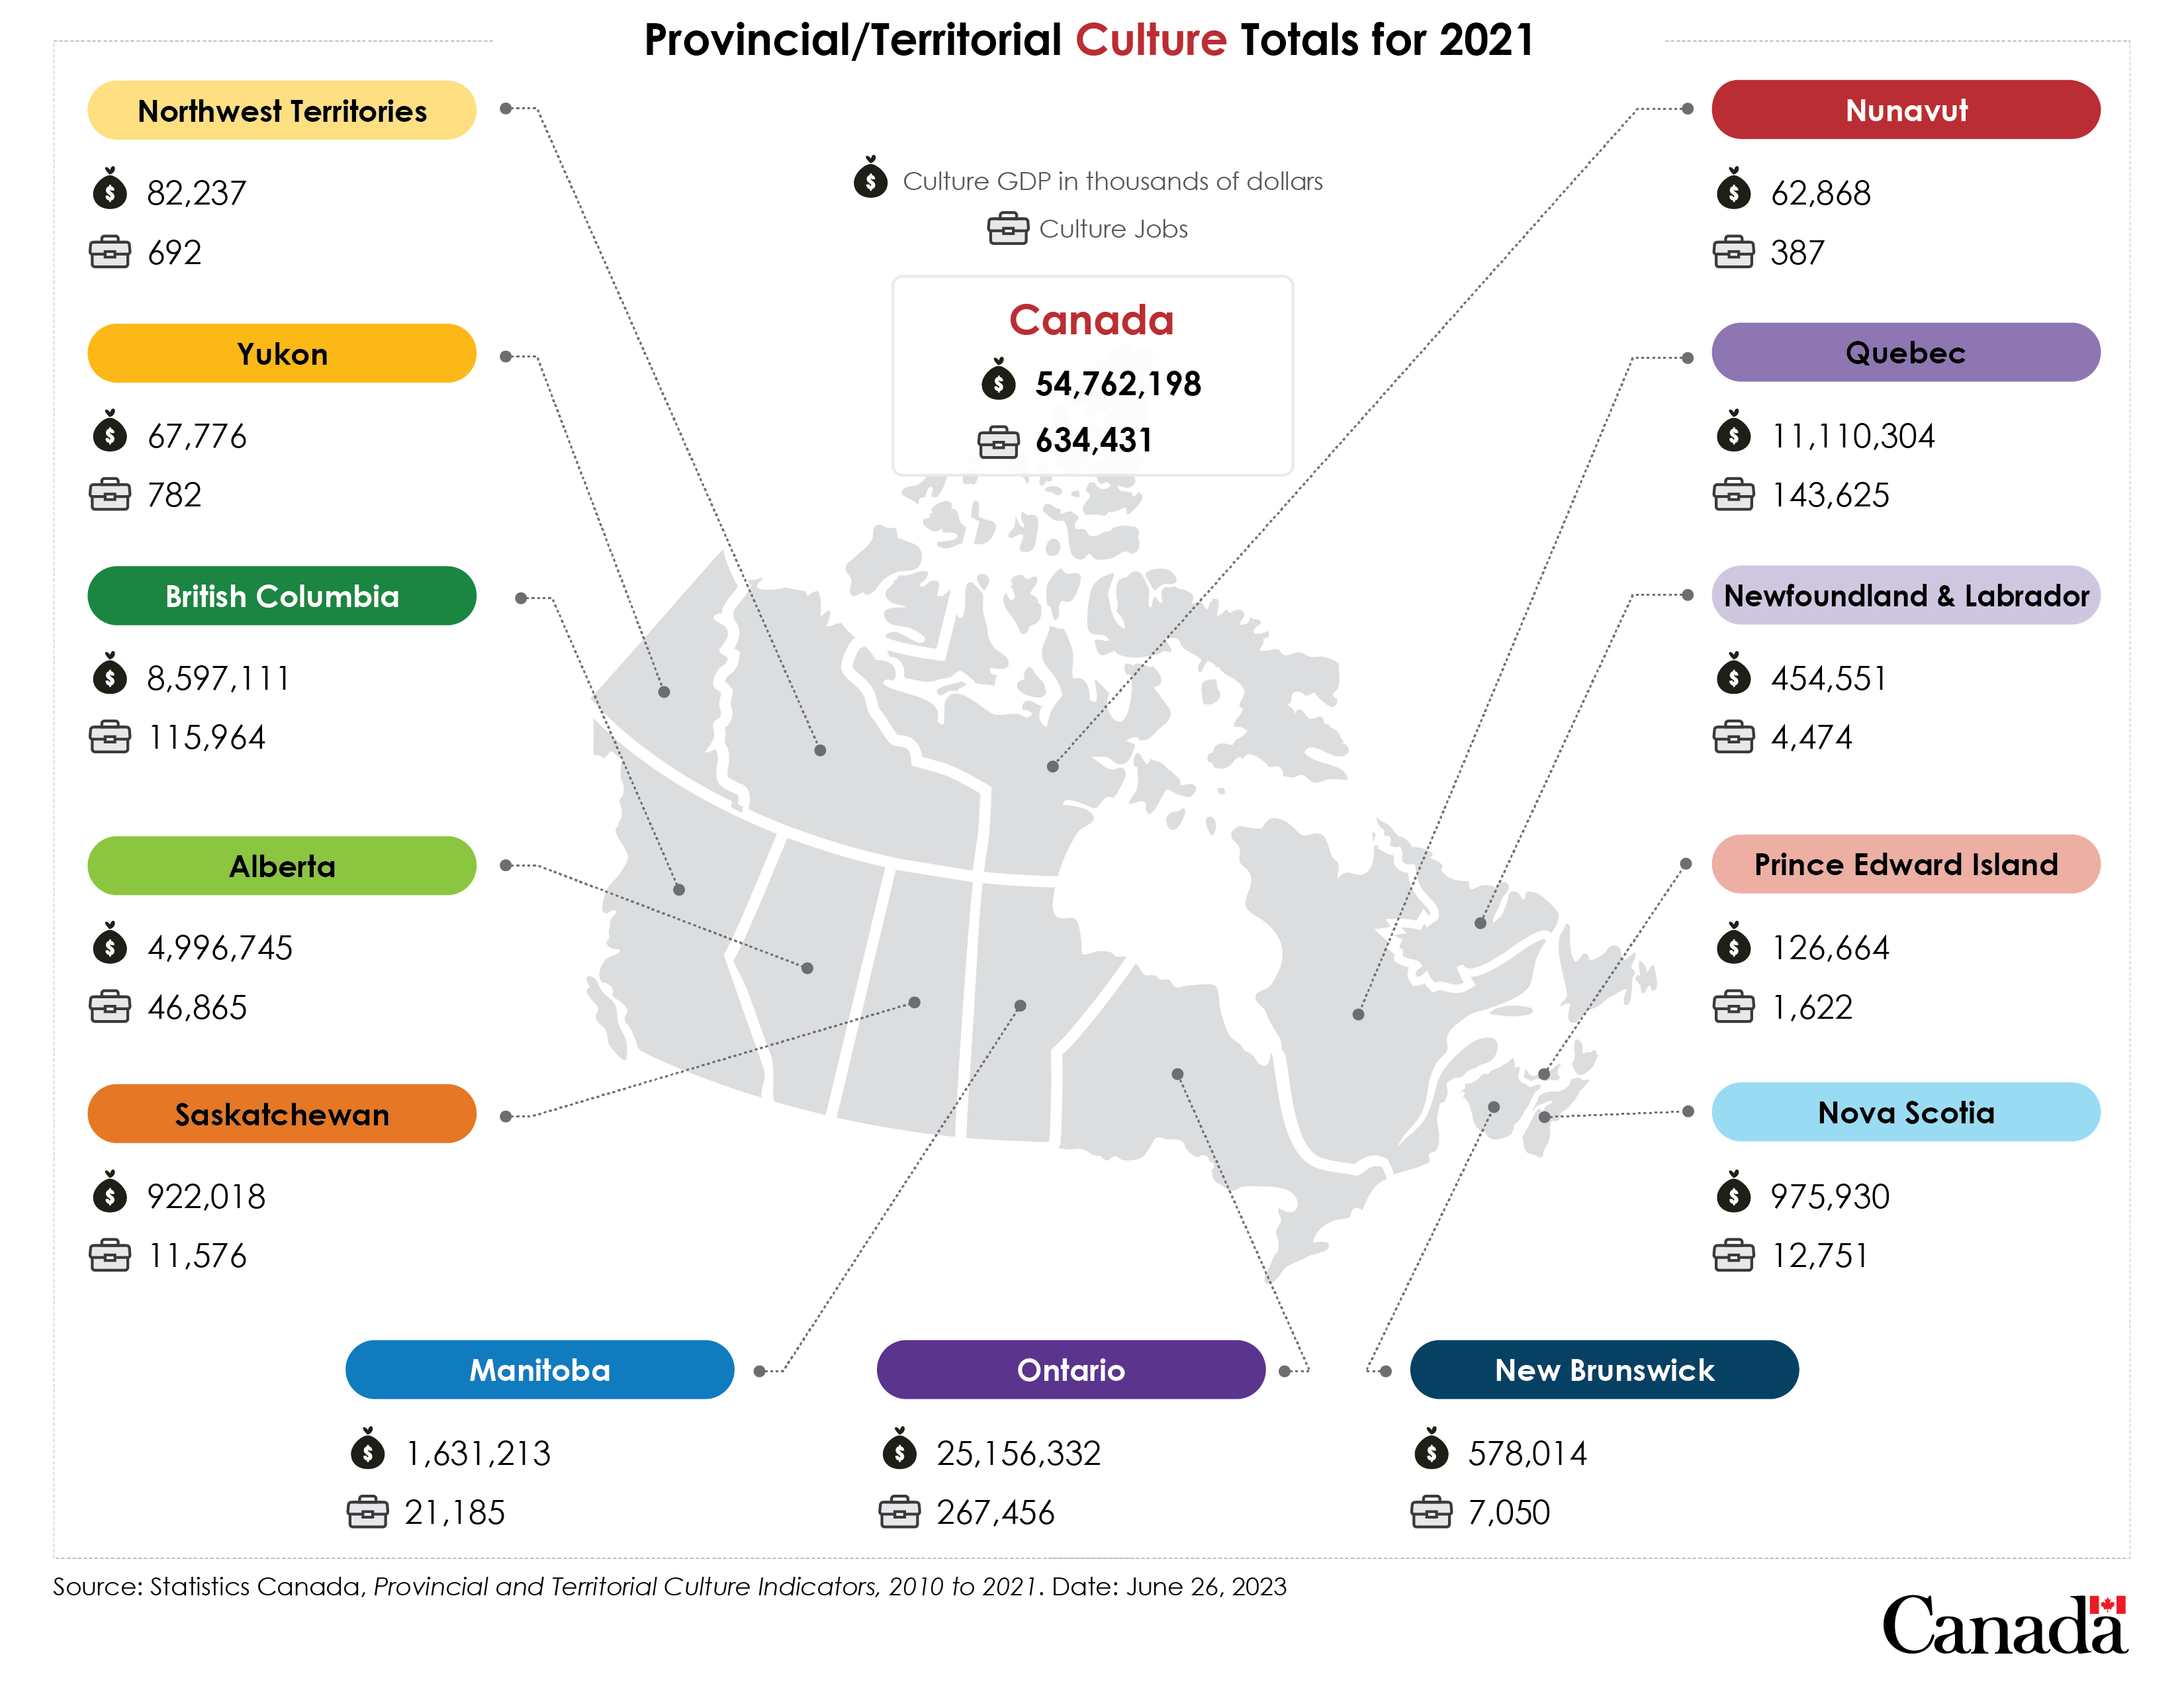
Description of the infographic: Provincial/Territorial Culture Totals for 2021
Image of a map of Canada with lines connecting each province/territory to individual boxes. Boxes contain the name of the province/territory and the statistical information relating to the specific jurisdiction it points to.
| Culture GDP in 2021 - In thousands of dollars – Product perspective | Culture jobs in 2021 – Product perspective | |
|---|---|---|
| Canada | 54,762,198 | 634,431 |
| Alberta | 4,996,745 | 46,865 |
| British Columbia | 8,597,111 | 115,964 |
| Manitoba | 1,631,213 | 21,185 |
| New Brunswick | 578,014 | 7,050 |
| Newfoundland and Labrador | 454,551 | 4,474 |
| Northwest Territories | 82,237 | 692 |
| Nova Scotia | 975,930 | 12,751 |
| Nunavut | 62,868 | 387 |
| Ontario | 25,156,332 | 267,456 |
| Prince Edward Island | 126,664 | 1,622 |
| Quebec | 11,110,304 | 143,625 |
| Saskatchewan | 922,018 | 11,576 |
| Yukon | 67,776 | 782 |
Source: Statistics Canada, Provincial and Territorial Culture Indicators, 2010 to 2021.
Date: June 26, 2023
Provincial/Territorial Sport Totals for 2021
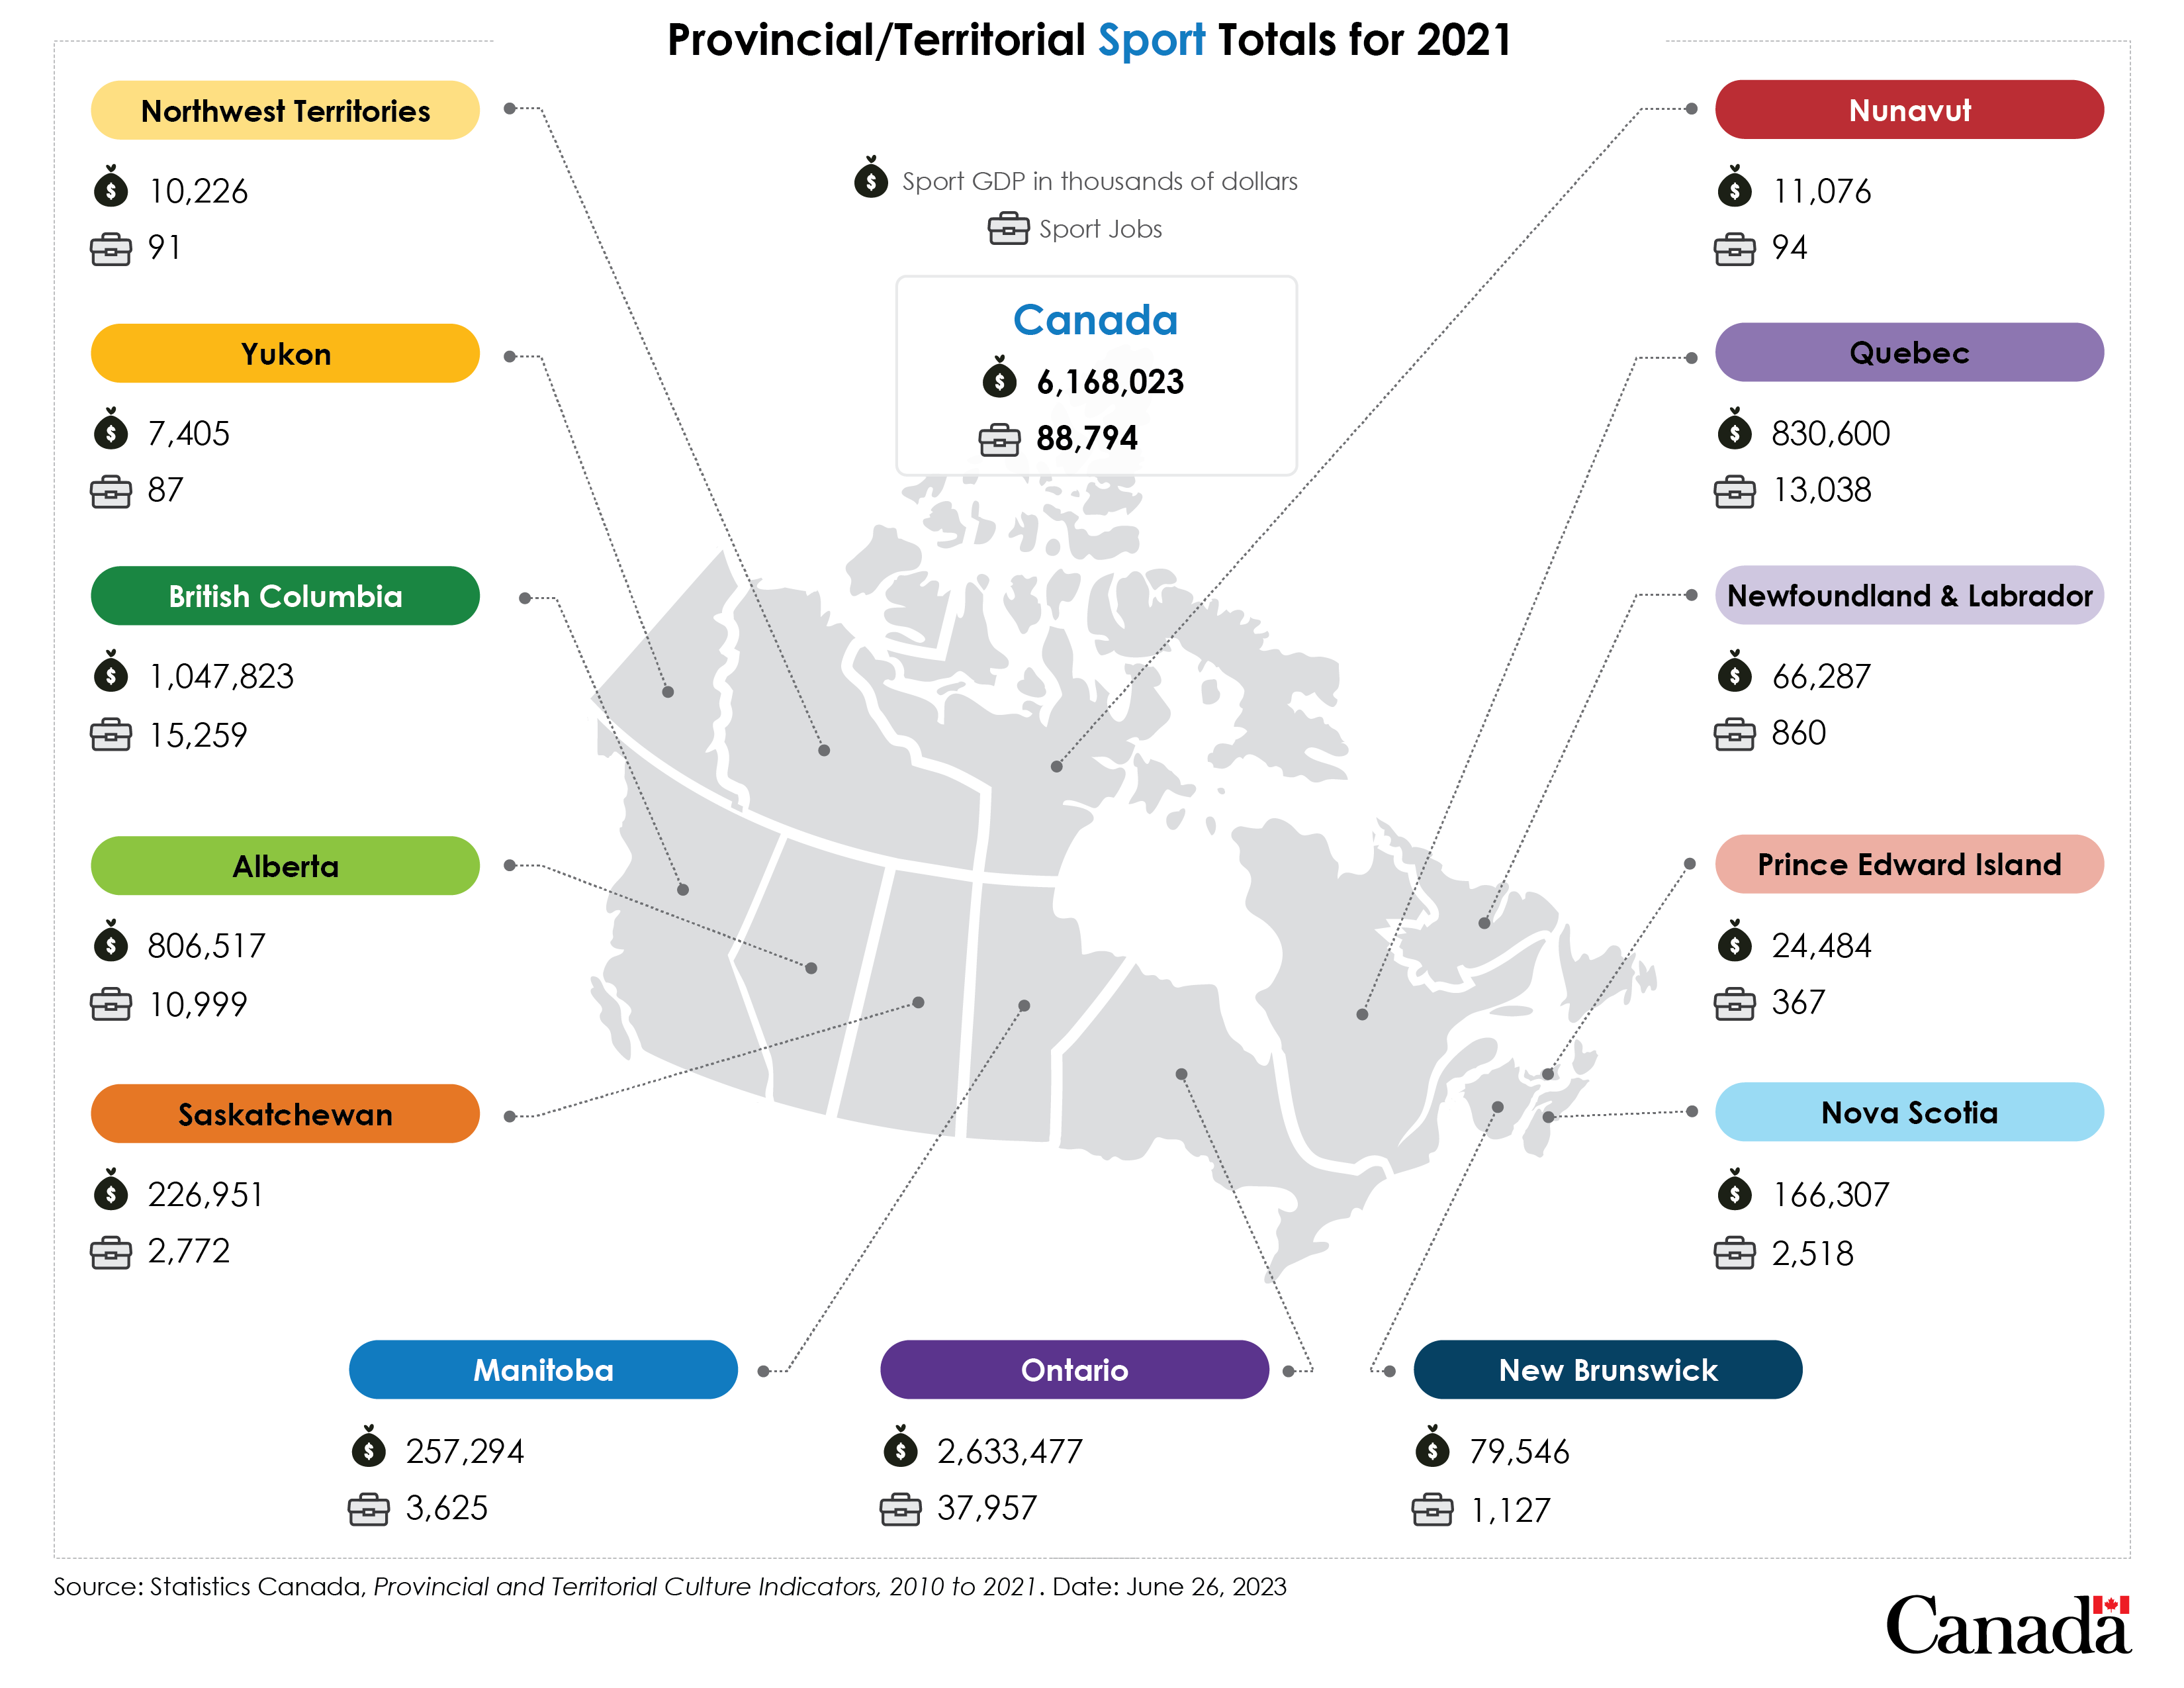
Description of the infographic: Provincial/Territorial Sport Totals for 2021
Image of a map of Canada with lines connecting each province/territory to individual boxes. Boxes contain the name of the province/territory and the statistical information relating to the specific jurisdiction it points to.
| Sport GDP in 2021 - In thousands of dollars – Product perspective | Sport jobs in 2021 – Product perspective | |
|---|---|---|
| Canada | 6,168,023 | 88,794 |
| Alberta | 806,517 | 10,999 |
| British Columbia | 1,047,823 | 15,259 |
| Manitoba | 257,294 | 3,625 |
| New Brunswick | 79,546 | 1,127 |
| Newfoundland and Labrador | 66,287 | 860 |
| Northwest Territories | 10,226 | 91 |
| Nova Scotia | 166,307 | 2,518 |
| Nunavut | 11,076 | 94 |
| Ontario | 2,633,477 | 37,957 |
| Prince Edward Island | 24,484 | 367 |
| Quebec | 830,600 | 13,038 |
| Saskatchewan | 226,951 | 2,772 |
| Yukon | 7,405 | 87 |
Source: Statistics Canada, Provincial and Territorial Culture Indicators, 2010 to 2021.
Date: June 26, 2023
Culture Gross Domestic Product and Jobs, Detailed Figures for 2021
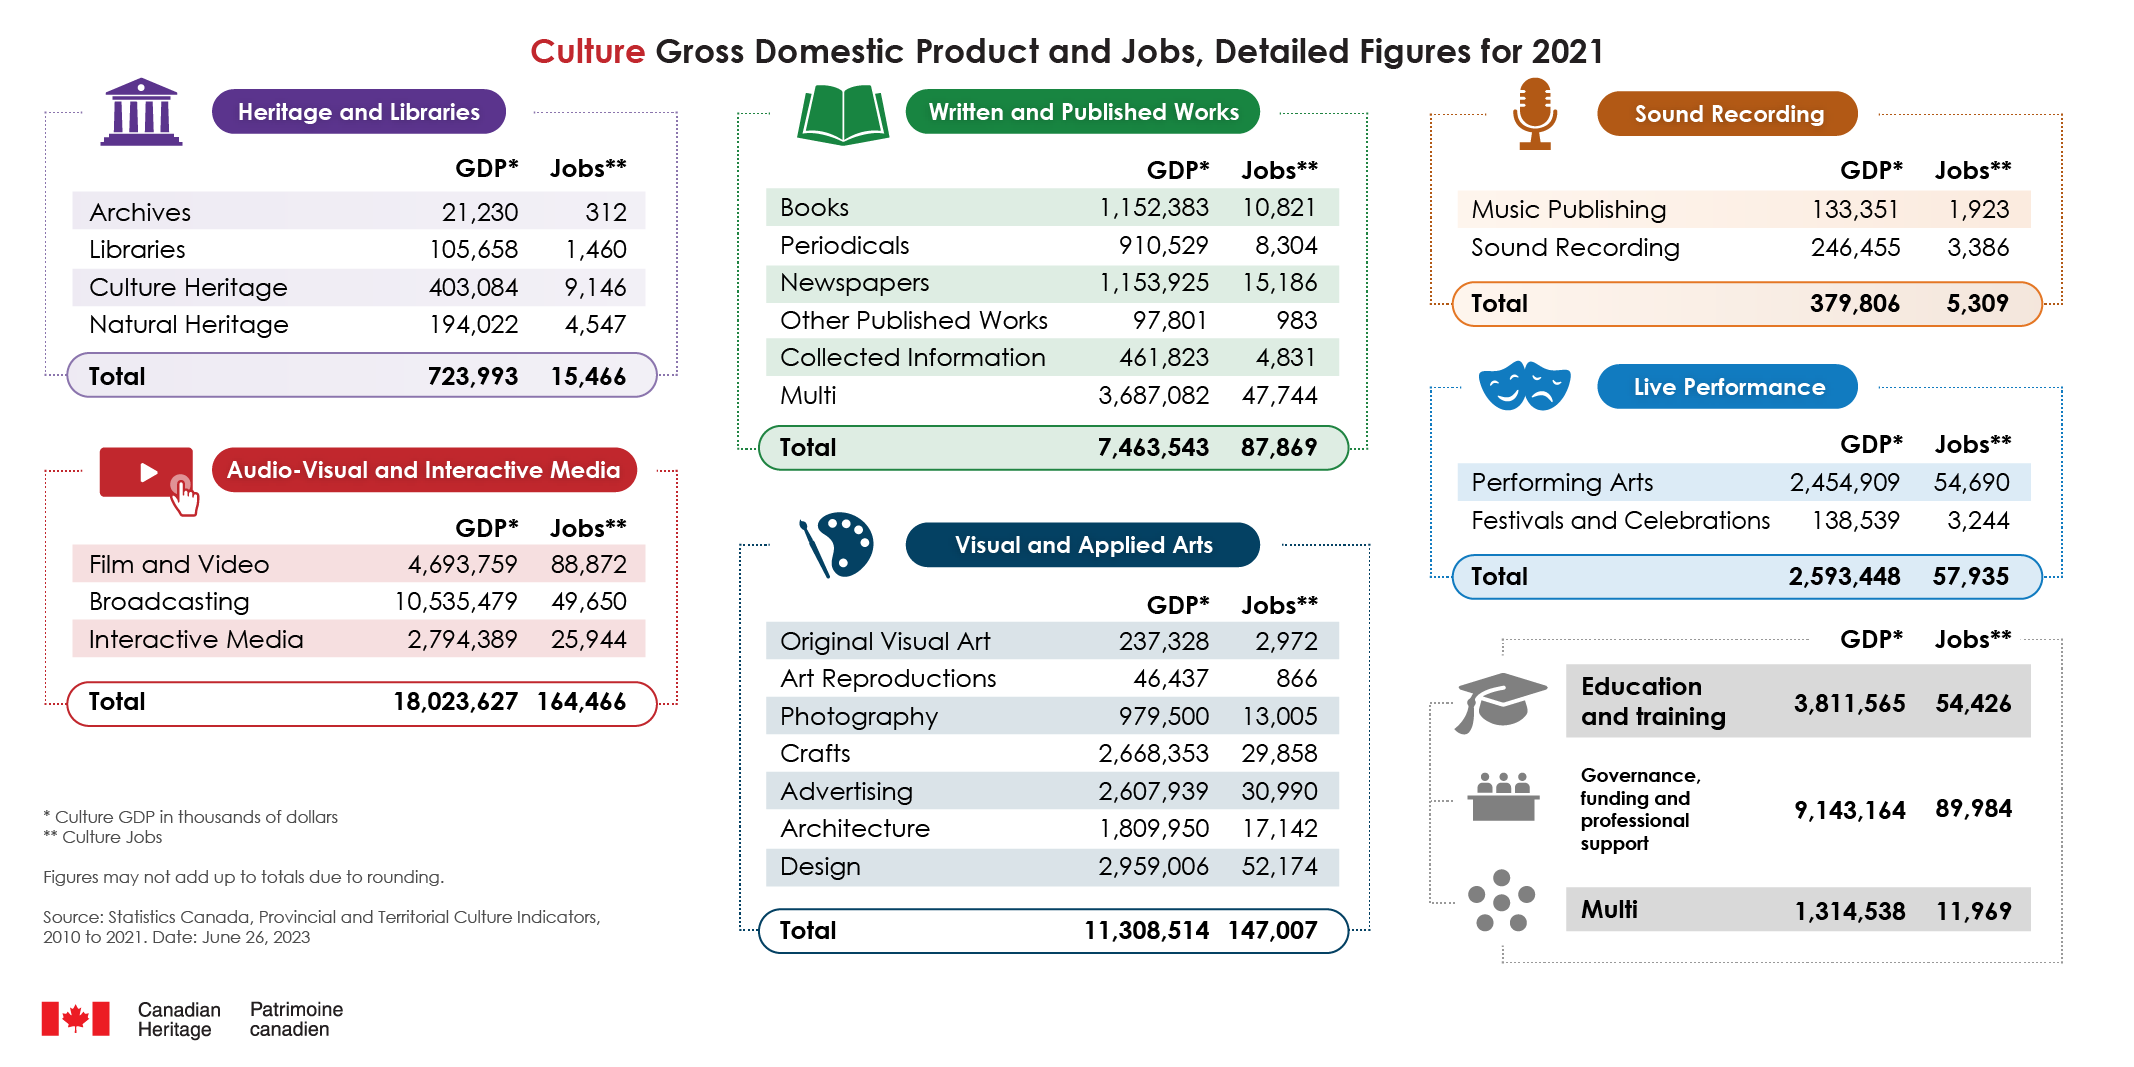
Description of the infographic: Culture Gross Domestic Product and Jobs, Detailed Figures for 2021
This infographic shows culture Gross Domestic Product (GDP) and job numbers by domain and subdomain for 2021.
| Gross Domestic Product (GDP) – In thousands of dollars – Product Perspective | Jobs – Product Perspective | |
|---|---|---|
| Archives | 21,230 | 312 |
| Libraries | 105,658 | 1,460 |
| Culture heritage | 403,084 | 9,146 |
| Natural heritage | 194,022 | 4,547 |
| Total | 723,993 | 15,466 |
| Gross Domestic Product (GDP) – In thousands of dollars – Product Perspective | Jobs – Product Perspective | |
|---|---|---|
| Film and video | 4,693,759 | 88,872 |
| Broadcasting | 10,535,479 | 49,650 |
| Interactive media | 2,794,389 | 25,944 |
| Total | 18,023,627 | 164,466 |
| Gross Domestic Product (GDP) – In thousands of dollars – Product Perspective | Jobs – Product Perspective | |
|---|---|---|
| Music publishing | 133,351 | 1,923 |
| Sound recording | 246,455 | 3,386 |
| Total | 379,806 | 5,309 |
| Gross Domestic Product (GDP) – In thousands of dollars – Product Perspective | Jobs – Product Perspective | |
|---|---|---|
| Books | 1,152,383 | 10,821 |
| Periodicals | 910,529 | 8,304 |
| Newspaper | 1,153,925 | 15,186 |
| Other published works | 97,801 | 983 |
| Collected information | 461,823 | 4,831 |
| Multi | 3,687,082 | 47,744 |
| Total | 7,463,543 | 87,869 |
| Gross Domestic Product (GDP) – In thousands of dollars – Product Perspective | Jobs – Product Perspective | |
|---|---|---|
| Original visual art | 237,328 | 2,972 |
| Art reproductions | 46,437 | 866 |
| Photography | 979,500 | 13,005 |
| Crafts | 2,668,353 | 29,858 |
| Advertising | 2,607,939 | 30,990 |
| Architecture | 1,809,950 | 17,142 |
| Design | 2,959,006 | 52,174 |
| Total | 11,308,514 | 147,007 |
| Gross Domestic Product (GDP) – In thousands of dollars – Product Perspective | Jobs – Product Perspective | |
|---|---|---|
| Performing arts | 2,454,909 | 54,690 |
| Festivals and celebrations | 138,539 | 3,244 |
| Total | 2,593,448 | 57,935 |
| Gross Domestic Product (GDP) – In thousands of dollars – Product Perspective | Jobs – Product Perspective | |
|---|---|---|
| Education and training | 3,811,565 | 54,426 |
| Governance, funding and professional support | 9,143,164 | 89,984 |
| Multi | 1,314,538 | 11,969 |
Source: Statistics Canada, Provincial and Territorial Culture Indicators, 2010 to 2021
Date: June 26, 2023
Sport Gross Domestic Product and Jobs, Detailed Figures for 2021
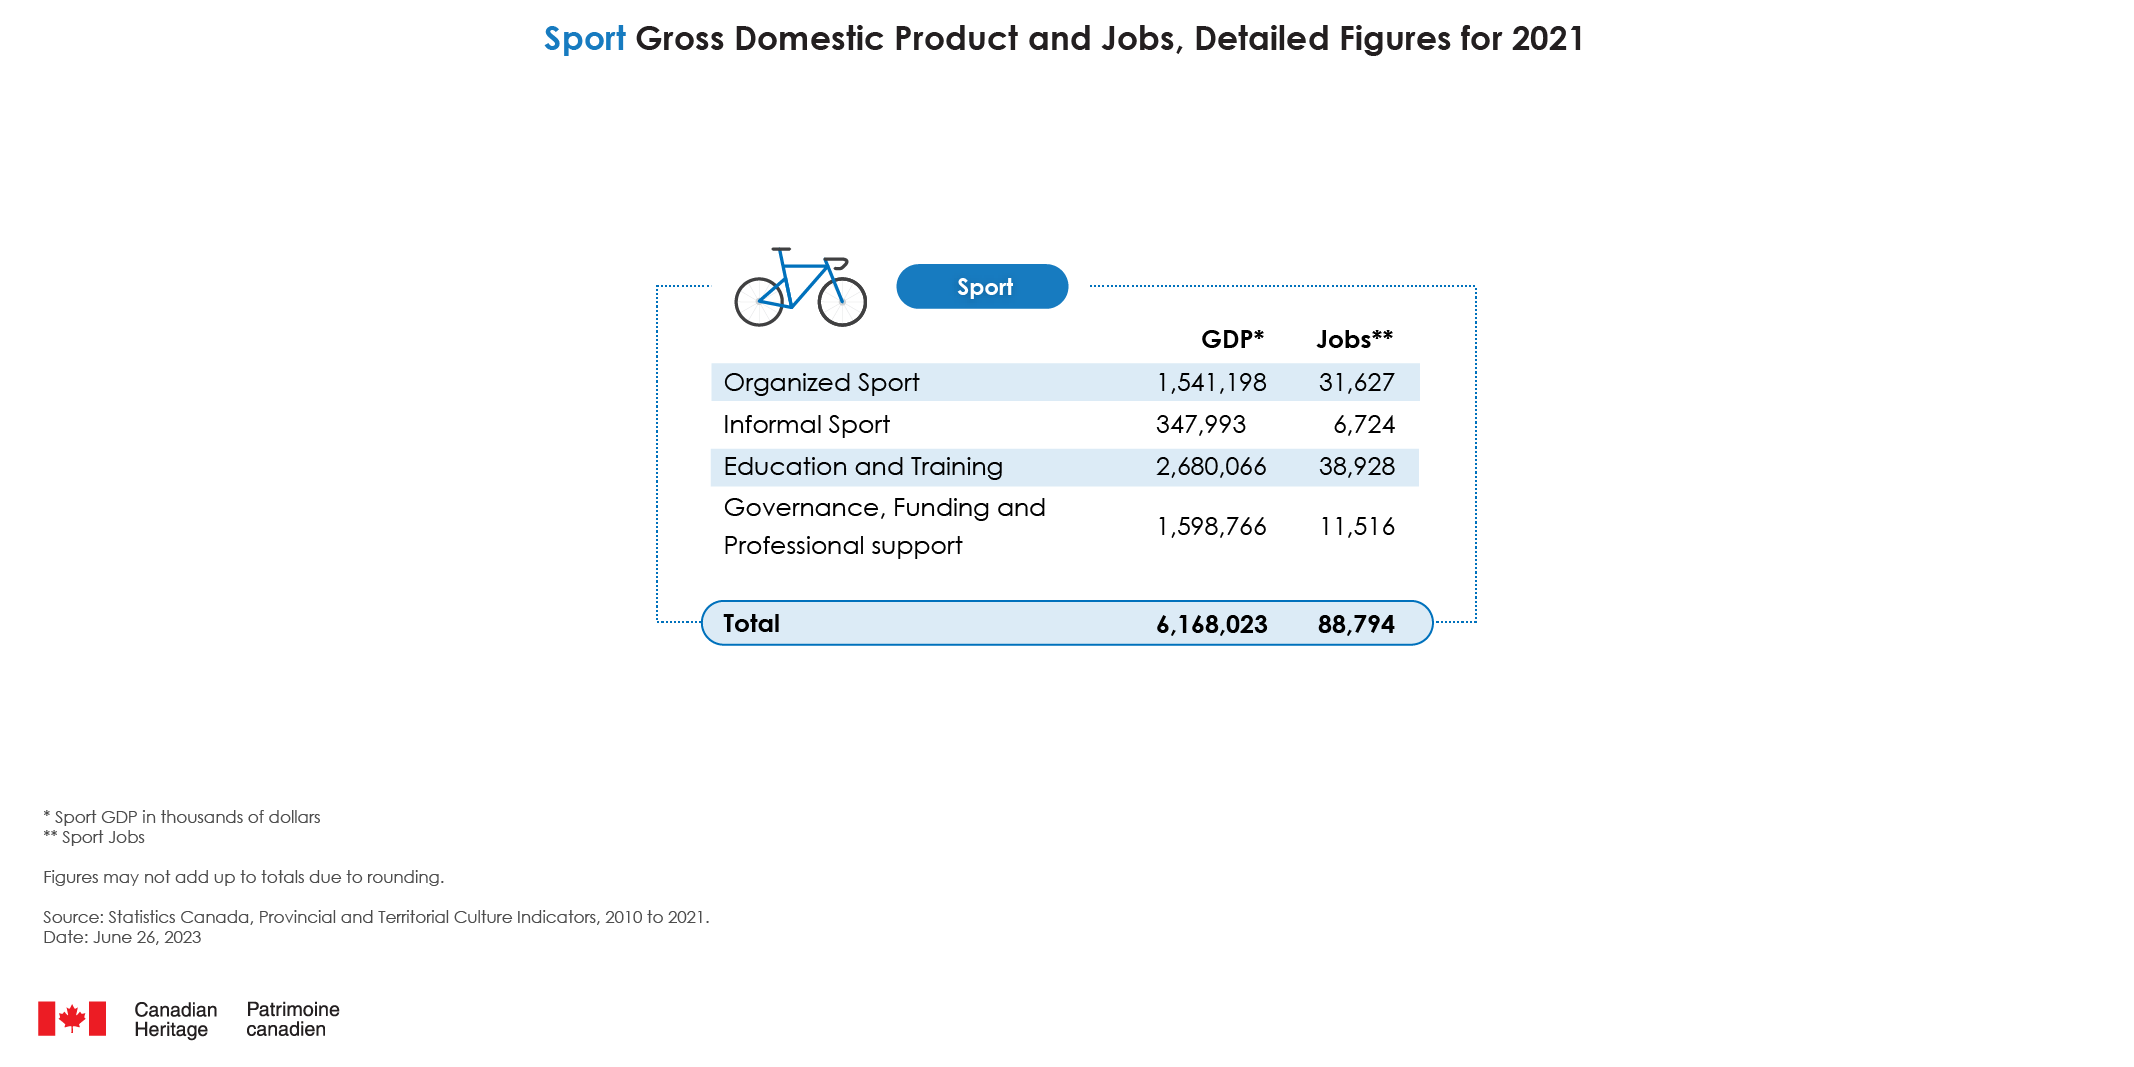
Description of the infographic: Sport Gross Domestic Product and Jobs, Detailed Figures for 2021
This infographic shows sport Gross Domestic Product (GDP) and job numbers by domain and subdomain for 2021.
| Gross Domestic Product (GDP) – In thousands of dollars – Product Perspective | Jobs – Product Perspective | |
|---|---|---|
| Organized sport | 1,541,198 | 31,627 |
| Informal sport | 347,993 | 6,724 |
| Education and training | 2,680,066 | 38,928 |
| Governance, funding and professional support | 1,598,766 | 11,516 |
| Total | 6,168,023 | 88,794 |
Source: Statistics Canada, Provincial and Territorial Culture Indicators, 2010 to 2021.
Date: June 26, 2023
Page details
- Date modified: