
Respiratory Virus Report, Week 10 ending March 9, 2019
Download the alternative format
(PDF format, 1.08 MB, 11 pages)
Organization: Public Health Agency of Canada
On this page
- List of abbreviations
- Respiratory Virus Detections and Isolations
- Number of positive laboratory tests for other respiratory viruses
- Positive Influenza tests
- Positive Respiratory synctial virus tests
- Positive Parainfluenza tests
- Positive Adenovirus tests
- Positive Human metapneumovirus tests
- Positive Enterovirus/Rhinovirus tests
- Positive Coronovirus tests
List of abbreviations
- A(H1N1)pdm09
- Influenza A(H1N1)pdm09
- A(H3)
- Influenza A(H3N2)
- A (UnS)
- Influenza A (Unsubtyped)
- Adeno
- Adenovirus
- CHEO
- Children's Hospital of Eastern Ontario
- Coron
- Coronavirus
- Entero
- Enterovirus
- hMPV
- human metapneumovirus
- HSC
- Health Sciences Centre
- N.A
- Not Applicable
- P.H.L.
- Public Health Laboratory
- P.H.O.L.
- Public Health Ontario Laboratory
- PIV
- Parainfluenza
- Rhino
- Rhinovirus
- RSV
- Respiratory syncytial virus
- UHN
- University Health Network
Respiratory Virus Detections and Isolations
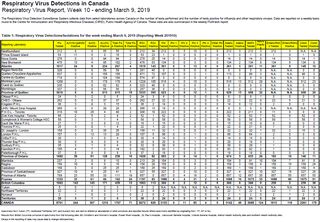
Table 1: Respiratory Virus Detections/Isolations for the week ending March 9, 2019 (Reporting Week 201910)
| Reporting Laboratory | Flu Tested | A(H1N1)pdm09 Positive | A(H3) Positive | A(UnS) Positive | Total Flu A Positive | Total Flu B Positive | RSV Tested | RSV Positive | PIV Tested | PIV 1 Positive | PIV 2 Positive | PIV 3 Positive | PIV 4 Positive | Other PIV Positive | Adeno Tested | Adeno Positive | hMPV Tested | hMPV Positive | Entero/Rhino Tested | Entero/Rhino Positive | Coron Tested | Coron Positive |
|---|---|---|---|---|---|---|---|---|---|---|---|---|---|---|---|---|---|---|---|---|---|---|
| Newfoundland | 212 | 0 | 0 | 55 | 55 | 0 | 212 | 34 | 212 | 0 | 5 | 10 | 0 | 0 | 212 | 3 | 212 | 3 | 212 | 3 | N.A. | N.A. |
| Prince Edward Island | 53 | 11 | 5 | 0 | 16 | 0 | 53 | 23 | 1 | 0 | 0 | 0 | 0 | 0 | 1 | 0 | 1 | 0 | 1 | 0 | 1 | 0 |
| Nova Scotia | 276 | 0 | 0 | 94 | 94 | 2 | 278 | 25 | 14 | 0 | 0 | 0 | 0 | 0 | 14 | 0 | 14 | 0 | 14 | 0 | 14 | 1 |
| New Brunswick | 476 | 13 | 4 | 85 | 102 | 2 | 476 | 63 | 134 | 0 | 0 | 3 | 0 | 0 | 134 | 2 | 134 | 8 | 134 | 6 | 134 | 9 |
| Atlantic | 1017 | 24 | 9 | 234 | 267 | 4 | 1019 | 145 | 361 | 0 | 5 | 13 | 0 | 0 | 361 | 5 | 361 | 11 | 361 | 9 | 149 | 10 |
| Région Nord-Est | 320 | 0 | 0 | 59 | 59 | 1 | 281 | 45 | 0 | 0 | 0 | 0 | 0 | 0 | 0 | 0 | 0 | 0 | N.A. | N.A. | 0 | 0 |
| Québec-Chaudière-Appalaches | 637 | 0 | 0 | 156 | 156 | 0 | 671 | 72 | 107 | 0 | 0 | 2 | 1 | 0 | 113 | 2 | 96 | 3 | N.A. | N.A. | 96 | 3 |
| Centre-du-Québec | 719 | 0 | 0 | 104 | 104 | 2 | 574 | 97 | 0 | 0 | 0 | 0 | 0 | 0 | 0 | 0 | 0 | 0 | N.A. | N.A. | 0 | 0 |
| Montréal-Laval | 1268 | 0 | 0 | 178 | 178 | 8 | 1229 | 105 | 516 | 4 | 0 | 10 | 0 | 0 | 516 | 13 | 512 | 29 | N.A. | N.A. | 512 | 23 |
| Ouest du Québec | 335 | 0 | 0 | 62 | 62 | 6 | 323 | 40 | 0 | 0 | 0 | 0 | 0 | 0 | 0 | 0 | 0 | 0 | N.A. | N.A. | 0 | 0 |
| Montérégie | 337 | 0 | 0 | 56 | 56 | 2 | 257 | 36 | 0 | 0 | 0 | 0 | 0 | 0 | 0 | 0 | 0 | 0 | N.A. | N.A. | 0 | 0 |
| Province of Québec | 3616 | 0 | 0 | 615 | 615 | 19 | 3335 | 395 | 623 | 4 | 0 | 12 | 1 | 0 | 629 | 15 | 608 | 32 | N.A. | N.A. | 608 | 26 |
| Ottawa P.H.L. | 24 | 3 | 2 | 0 | 5 | 0 | 24 | 3 | 6 | 0 | 0 | 0 | 0 | 0 | 6 | 0 | 6 | 1 | 0 | 0 | 0 | 0 |
| CHEO - Ottawa | 262 | 0 | 0 | 37 | 37 | 0 | 262 | 27 | 22 | 0 | 0 | 0 | 0 | 0 | 22 | 1 | 22 | 0 | 22 | 5 | 21 | 3 |
| Kingston P.H.L. | 36 | 3 | 9 | 3 | 15 | 1 | 36 | 2 | 14 | 0 | 0 | 0 | 0 | 0 | 14 | 0 | 12 | 0 | 2 | 0 | 0 | 0 |
| UHN / Mount Sinai Hospital | 366 | 0 | 0 | 29 | 29 | 3 | 366 | 13 | 19 | 0 | 0 | 0 | 0 | 0 | 0 | 0 | 0 | 0 | N.A. | N.A. | N.A. | N.A. |
| P.H.O.L. - Toronto | 318 | 10 | 26 | 4 | 40 | 2 | 308 | 10 | 222 | 0 | 0 | 5 | 0 | 0 | 222 | 0 | 211 | 8 | 11 | 0 | 0 | 0 |
| Sick Kids Hospital - Toronto | 66 | 2 | 5 | 2 | 9 | 2 | 52 | 1 | 52 | 0 | 0 | 3 | 0 | 0 | 52 | 2 | 52 | 7 | 52 | 8 | 52 | 0 |
| Sunnybrook & Women's College HSC | 58 | 0 | 3 | 1 | 4 | 1 | 58 | 0 | 58 | 0 | 0 | 0 | 0 | 0 | 58 | 0 | 58 | 5 | 58 | 1 | 58 | 5 |
| Sault Ste. Marie P.H.L. | 27 | 7 | 5 | 0 | 12 | 0 | 16 | 1 | 15 | 0 | 0 | 0 | 0 | 0 | 15 | 0 | 15 | 0 | 0 | 0 | 0 | 0 |
| Timmins P.H.L. | 25 | 3 | 0 | 1 | 4 | 0 | 22 | 1 | 22 | 0 | 0 | 0 | 0 | 0 | 22 | 0 | 21 | 0 | 1 | 0 | 0 | 0 |
| St. Joseph's - London | 156 | 0 | 0 | 35 | 35 | 1 | 156 | 11 | 32 | 1 | 0 | 0 | 1 | 0 | 32 | 2 | 32 | 1 | 32 | 2 | 15 | 3 |
| London P.H.L. | 107 | 3 | 13 | 13 | 29 | 0 | 107 | 5 | 66 | 0 | 0 | 1 | 0 | 0 | 66 | 0 | 64 | 1 | 2 | 0 | 0 | 0 |
| Orillia P.H.L. | 30 | 1 | 3 | 0 | 4 | 0 | 30 | 4 | 14 | 0 | 0 | 1 | 0 | 0 | 14 | 0 | 14 | 0 | 0 | 0 | 0 | 0 |
| Thunder Bay P.H.L. | 30 | 0 | 9 | 0 | 9 | 0 | 20 | 0 | 20 | 0 | 0 | 1 | 0 | 0 | 20 | 0 | 19 | 0 | 1 | 0 | 0 | 0 |
| Sudbury P.H.L. | 35 | 3 | 1 | 0 | 4 | 0 | 32 | 0 | 30 | 0 | 0 | 1 | 0 | 0 | 30 | 0 | 29 | 1 | 1 | 0 | 0 | 0 |
| Hamilton P.H.L. | 105 | 4 | 7 | 3 | 14 | 0 | 102 | 2 | 83 | 1 | 0 | 2 | 0 | 0 | 83 | 0 | 82 | 2 | 1 | 0 | 0 | 0 |
| Peterborough P.H.L. | 37 | 0 | 8 | 0 | 8 | 0 | 37 | 2 | 18 | 0 | 0 | 0 | 0 | 0 | 18 | 0 | 18 | 0 | 0 | 0 | 0 | 0 |
| Province of Ontario | 1682 | 39 | 91 | 128 | 258 | 10 | 1628 | 82 | 693 | 2 | 0 | 14 | 1 | 0 | 674 | 5 | 655 | 26 | 183 | 16 | 146 | 11 |
| Manitoba | 237 | 2 | 0 | 8 | 10 | 0 | 213 | 28 | 104 | 0 | 0 | 3 | 0 | 0 | 104 | 0 | 91 | 10 | 104 | 7 | 91 | 8 |
| Regina | 158 | 10 | 6 | 0 | 16 | 4 | 158 | 29 | 158 | 0 | 0 | 8 | 0 | 0 | 158 | 3 | 158 | 9 | 158 | 16 | 158 | 24 |
| Saskatoon | 169 | 0 | 0 | 25 | 25 | 1 | 169 | 26 | 169 | 0 | 0 | 2 | 0 | 0 | 169 | 1 | 169 | 1 | 169 | 2 | 169 | 4 |
| Province of Saskatchewan | 327 | 10 | 6 | 25 | 41 | 5 | 327 | 55 | 327 | 0 | 0 | 10 | 0 | 0 | 327 | 4 | 327 | 10 | 327 | 18 | 327 | 28 |
| Province of Alberta | 789 | 23 | 55 | 33 | 111 | 19 | 657 | 0 | 657 | 0 | 4 | 18 | 2 | 0 | 657 | 12 | 657 | 35 | 657 | 55 | 657 | 55 |
| Prairies | 1353 | 35 | 61 | 66 | 162 | 24 | 1197 | 83 | 1088 | 0 | 4 | 31 | 2 | 0 | 1088 | 16 | 1075 | 55 | 1088 | 80 | 1075 | 91 |
| British Columbia | 1063 | 143 | 145 | 171 | 459 | 13 | 1063 | 113 | 366 | 0 | 2 | 12 | 0 | 0 | 366 | 6 | 366 | 0 | 259 | 3 | 259 | 38 |
| Yukon | 6 | 0 | 1 | 2 | 3 | 0 | 6 | 2 | N.A. | N.A. | N.A. | N.A. | N.A. | N.A. | N.A. | N.A. | N.A. | N.A. | N.A. | N.A. | N.A. | N.A. |
| Northwest Territories | 22 | 2 | 0 | 0 | 2 | 1 | 22 | 0 | 22 | 0 | 0 | 3 | 0 | 0 | 22 | 1 | 22 | 0 | 22 | 1 | 22 | 3 |
| Nunavut | 2 | 1 | 0 | 0 | 1 | 0 | 2 | 0 | 2 | 0 | 0 | 0 | 0 | 0 | 2 | 1 | 2 | 0 | 2 | 1 | 2 | 0 |
| Territories | 30 | 3 | 1 | 2 | 6 | 1 | 30 | 2 | 24 | 0 | 0 | 3 | 0 | 0 | 24 | 2 | 24 | 0 | 24 | 2 | 24 | 3 |
| CANADA | 8761 | 244 | 307 | 1216 | 1767 | 71 | 8272 | 820 | 3155 | 6 | 11 | 85 | 4 | 0 | 3142 | 49 | 3089 | 124 | 1915 | 110 | 2261 | 179 |
Table 1 notes
|
||||||||||||||||||||||
Table 2: Respiratory Virus Detections/Isolations for the period August 26, 2018 - March 9, 2019 (Reporting Weeks 201835-201910)
| Reporting Laboratory | Flu Tested | A(H1N1)pdm09 Positive | A(H3) Positive | A(UnS) Positive | Total Flu A Positive | Total Flu B Positive | RSV Tested | RSV Positive | PIV Tested | PIV 1 Positive | PIV 2 Positive | PIV 3 Positive | PIV 4 Positive | Other PIV Positive | Adeno Tested | Adeno Positive | hMPV Tested | hMPV Positive | Entero/Rhino Tested | Entero/Rhino Positive | Coron Tested | Coron Positive |
|---|---|---|---|---|---|---|---|---|---|---|---|---|---|---|---|---|---|---|---|---|---|---|
| Newfoundland | 2961 | 1 | 0 | 451 | 452 | 2 | 2961 | 322 | 2961 | 0 | 47 | 84 | 0 | 0 | 2961 | 28 | 2961 | 47 | 2961 | 268 | N.A. | N.A. |
| Prince Edward Island | 884 | 205 | 7 | 0 | 212 | 0 | 882 | 86 | 66 | 1 | 0 | 1 | 3 | 0 | 61 | 5 | 61 | 1 | 61 | 21 | 61 | 2 |
| Nova Scotia | 2528 | 0 | 0 | 494 | 494 | 8 | 2528 | 243 | 419 | 0 | 3 | 11 | 2 | 0 | 419 | 0 | 419 | 4 | 419 | 58 | 419 | 6 |
| New Brunswick | 9781 | 210 | 21 | 1966 | 2197 | 5 | 9784 | 862 | 2479 | 0 | 16 | 16 | 38 | 0 | 2479 | 110 | 2479 | 64 | 2479 | 272 | 2479 | 103 |
| Atlantic | 16154 | 416 | 28 | 2911 | 3355 | 15 | 16155 | 1513 | 5925 | 1 | 66 | 112 | 43 | 0 | 5920 | 143 | 5920 | 116 | 5920 | 619 | 2959 | 111 |
| Région Nord-Est | 6514 | 0 | 0 | 1277 | 1277 | 9 | 5068 | 400 | 0 | 0 | 0 | 0 | 0 | 0 | 0 | 0 | 0 | 0 | N.A. | N.A. | 0 | 0 |
| Québec-Chaudière-Appalaches | 11397 | 0 | 0 | 2551 | 2551 | 13 | 11777 | 1329 | 2203 | 4 | 29 | 18 | 9 | 0 | 2276 | 77 | 1855 | 16 | N.A. | N.A. | 1693 | 20 |
| Centre-du-Québec | 13480 | 0 | 0 | 2911 | 2911 | 134 | 10723 | 1306 | 0 | 0 | 0 | 0 | 0 | 0 | 36 | 0 | 0 | 0 | N.A. | N.A. | 0 | 0 |
| Montréal-Laval | 30105 | 0 | 0 | 3687 | 3687 | 81 | 29079 | 2589 | 15927 | 56 | 147 | 87 | 35 | 0 | 15927 | 455 | 15614 | 213 | N.A. | N.A. | 15563 | 631 |
| Ouest du Québec | 10128 | 0 | 0 | 2259 | 2259 | 35 | 9188 | 1288 | 0 | 0 | 0 | 0 | 0 | 0 | 0 | 0 | 0 | 0 | N.A. | N.A. | 0 | 0 |
| Montérégie | 6572 | 0 | 0 | 1128 | 1129 | 15 | 6250 | 569 | 0 | 0 | 0 | 0 | 0 | 0 | 0 | 0 | 0 | 0 | N.A. | N.A. | 0 | 0 |
| Province of Québec | 78196 | 0 | 0 | 13813 | 13814 | 287 | 72085 | 7481 | 18130 | 60 | 176 | 105 | 44 | 0 | 18239 | 532 | 17469 | 229 | N.A. | N.A. | 17256 | 651 |
| Ottawa P.H.L. | 777 | 88 | 45 | 19 | 152 | 0 | 772 | 79 | 418 | 0 | 3 | 3 | 0 | 0 | 418 | 0 | 400 | 5 | 21 | 0 | 0 | 0 |
| CHEO - Ottawa | 5911 | 0 | 0 | 618 | 618 | 12 | 5911 | 808 | 648 | 2 | 8 | 6 | 5 | 0 | 649 | 20 | 648 | 12 | 641 | 169 | 633 | 28 |
| Kingston P.H.L. | 720 | 59 | 36 | 11 | 106 | 5 | 720 | 57 | 511 | 0 | 3 | 5 | 0 | 0 | 511 | 0 | 491 | 3 | 65 | 0 | 0 | 0 |
| UHN / Mount Sinai Hospital | 8739 | 5 | 9 | 598 | 612 | 21 | 8739 | 422 | 444 | 0 | 9 | 0 | 2 | 0 | 0 | 0 | 401 | 2 | N.A. | N.A. | N.A. | N.A. |
| P.H.O.L. - Toronto | 10517 | 800 | 419 | 72 | 1291 | 40 | 10185 | 456 | 8197 | 12 | 57 | 34 | 0 | 0 | 8198 | 33 | 7975 | 72 | 378 | 0 | 0 | 0 |
| Sick Kids Hospital - Toronto | 1994 | 109 | 27 | 95 | 231 | 9 | 1689 | 208 | 1689 | 12 | 35 | 26 | 21 | 0 | 1689 | 64 | 1689 | 54 | 1689 | 404 | 1689 | 113 |
| Sunnybrook & Women's College HSC | 1886 | 68 | 48 | 10 | 126 | 4 | 1886 | 57 | 1886 | 4 | 5 | 8 | 1 | 0 | 1886 | 1 | 1886 | 37 | 1886 | 164 | 1886 | 73 |
| Sault Ste. Marie P.H.L. | 302 | 40 | 8 | 1 | 49 | 0 | 262 | 9 | 250 | 0 | 3 | 0 | 0 | 0 | 250 | 0 | 245 | 3 | 7 | 0 | 0 | 0 |
| Timmins P.H.L. | 295 | 55 | 1 | 1 | 57 | 0 | 238 | 4 | 238 | 0 | 7 | 3 | 0 | 0 | 238 | 0 | 231 | 1 | 15 | 0 | 0 | 0 |
| St. Joseph's - London | 3193 | 3 | 0 | 376 | 379 | 1 | 3186 | 333 | 1097 | 3 | 5 | 7 | 14 | 0 | 1097 | 27 | 1097 | 32 | 811 | 143 | 620 | 14 |
| London P.H.L. | 3081 | 301 | 81 | 60 | 442 | 6 | 3044 | 291 | 2101 | 2 | 19 | 10 | 0 | 0 | 2101 | 13 | 2033 | 16 | 114 | 0 | 0 | 0 |
| Orillia P.H.L. | 849 | 60 | 28 | 15 | 103 | 1 | 849 | 114 | 584 | 1 | 2 | 5 | 0 | 0 | 584 | 1 | 572 | 5 | 25 | 0 | 0 | 0 |
| Thunder Bay P.H.L. | 312 | 28 | 19 | 5 | 52 | 0 | 258 | 7 | 251 | 1 | 1 | 9 | 0 | 0 | 250 | 0 | 237 | 7 | 23 | 0 | 0 | 0 |
| Sudbury P.H.L. | 652 | 40 | 5 | 0 | 45 | 0 | 612 | 28 | 595 | 1 | 4 | 1 | 0 | 0 | 595 | 2 | 564 | 9 | 53 | 0 | 0 | 0 |
| Hamilton P.H.L. | 2784 | 214 | 86 | 28 | 328 | 4 | 2729 | 122 | 2152 | 5 | 14 | 20 | 0 | 0 | 2152 | 11 | 2116 | 15 | 75 | 0 | 0 | 0 |
| Peterborough P.H.L. | 831 | 42 | 26 | 17 | 85 | 2 | 828 | 46 | 655 | 2 | 3 | 0 | 0 | 0 | 655 | 0 | 648 | 5 | 9 | 0 | 0 | 0 |
| Province of Ontario | 42843 | 1912 | 838 | 1926 | 4676 | 105 | 41908 | 3041 | 21716 | 45 | 178 | 137 | 43 | 0 | 21273 | 172 | 21233 | 278 | 5900 | 885 | 4923 | 233 |
| Manitoba | 7656 | 282 | 21 | 719 | 1022 | 8 | 7471 | 403 | 3037 | 1 | 11 | 24 | 12 | 0 | 3037 | 30 | 1848 | 48 | 3037 | 353 | 1882 | 71 |
| Regina | 7017 | 1405 | 74 | 147 | 1626 | 18 | 7017 | 376 | 8950 | 4 | 60 | 128 | 35 | 0 | 7017 | 99 | 7017 | 95 | 7017 | 1292 | 7017 | 155 |
| Saskatoon | 4785 | 0 | 0 | 715 | 715 | 10 | 4785 | 318 | 4785 | 2 | 7 | 18 | 13 | 0 | 4785 | 28 | 4785 | 38 | 4785 | 271 | 4785 | 54 |
| Province of Saskatchewan | 11802 | 1405 | 74 | 862 | 2341 | 28 | 11802 | 694 | 13735 | 6 | 67 | 146 | 48 | 0 | 11802 | 127 | 11802 | 133 | 11802 | 1563 | 11802 | 209 |
| Province of Alberta | 27533 | 3517 | 285 | 1791 | 5593 | 98 | 22172 | 0 | 22172 | 23 | 199 | 291 | 213 | 0 | 22172 | 291 | 22172 | 472 | 22172 | 3408 | 22172 | 998 |
| Prairies | 46991 | 5204 | 380 | 3372 | 8956 | 134 | 41445 | 1097 | 38944 | 30 | 277 | 461 | 273 | 0 | 37011 | 448 | 35822 | 653 | 37011 | 5324 | 35856 | 1278 |
| British Columbia | 17761 | 2752 | 620 | 1187 | 4559 | 57 | 17761 | 1084 | 7371 | 10 | 61 | 175 | 89 | 0 | 7371 | 99 | 7371 | 26 | 5651 | 1256 | 5651 | 302 |
| Yukon | 267 | 50 | 4 | 20 | 74 | 0 | 267 | 17 | N.A. | N.A. | N.A. | N.A. | N.A. | N.A. | N.A. | N.A. | N.A. | N.A. | N.A. | N.A. | N.A. | N.A. |
| Northwest Territories | 610 | 157 | 2 | 0 | 159 | 1 | 606 | 0 | 606 | 1 | 0 | 23 | 3 | 0 | 606 | 20 | 606 | 3 | 606 | 106 | 606 | 32 |
| Nunavut | 67 | 20 | 0 | 0 | 20 | 0 | 67 | 0 | 67 | 0 | 0 | 0 | 0 | 0 | 67 | 11 | 66 | 0 | 67 | 20 | 66 | 7 |
| Territories | 944 | 227 | 6 | 20 | 253 | 1 | 940 | 17 | 673 | 1 | 0 | 23 | 3 | 0 | 673 | 31 | 672 | 3 | 673 | 126 | 672 | 39 |
| CANADA | 202889 | 10511 | 1872 | 23229 | 35613 | 599 | 190294 | 14233 | 92759 | 147 | 758 | 1013 | 495 | 0 | 90487 | 1425 | 88487 | 1305 | 55155 | 8210 | 67317 | 2614 |
Table 2 notes
|
||||||||||||||||||||||
Number of positive laboratory tests for other respiratory viruses
Figure 1: Number positive laboratory tests for other respiratory viruses by report week, Canada, 2018-19
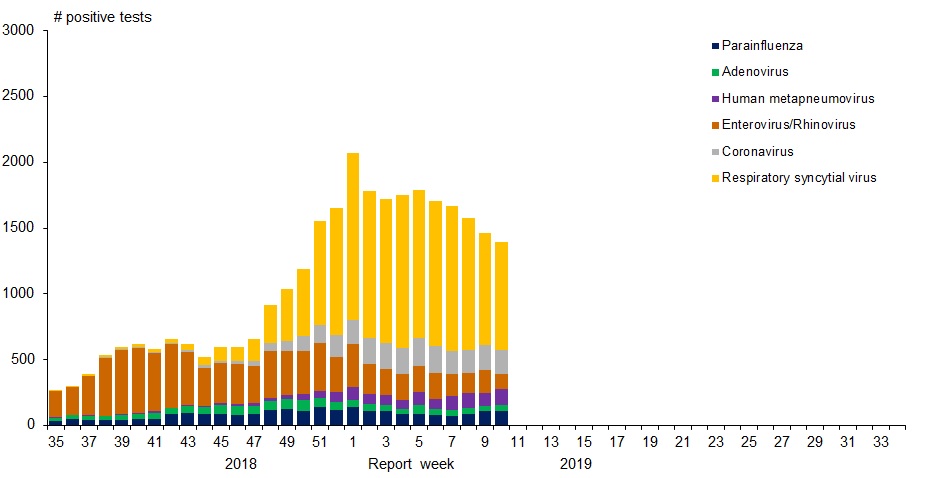
Figure 1: Number positive laboratory tests for other respiratory viruses by report week, Canada, 2018-19 - Text description
| Week | ParaInfluenza | Adenovirus | Human metapneumovirus | Enterovirus/Rhinovirus | Coronavirus | Respiratory syncytial virus |
|---|---|---|---|---|---|---|
| 35 | 35 | 21 | 6 | 196 | 4 | 9 |
| 36 | 49 | 27 | 3 | 214 | 2 | 7 |
| 37 | 40 | 32 | 5 | 299 | 2 | 15 |
| 38 | 41 | 31 | 2 | 440 | 3 | 15 |
| 39 | 40 | 42 | 6 | 487 | 9 | 12 |
| 40 | 47 | 42 | 7 | 490 | 8 | 24 |
| 41 | 49 | 46 | 12 | 446 | 7 | 23 |
| 42 | 84 | 45 | 6 | 481 | 7 | 32 |
| 43 | 98 | 50 | 10 | 402 | 10 | 49 |
| 44 | 86 | 55 | 8 | 287 | 20 | 62 |
| 45 | 88 | 70 | 14 | 303 | 16 | 108 |
| 46 | 82 | 62 | 19 | 304 | 26 | 103 |
| 47 | 84 | 65 | 23 | 279 | 38 | 171 |
| 48 | 119 | 65 | 27 | 355 | 62 | 287 |
| 49 | 122 | 76 | 35 | 336 | 74 | 395 |
| 50 | 111 | 82 | 42 | 328 | 116 | 507 |
| 51 | 139 | 69 | 56 | 360 | 141 | 788 |
| 52 | 117 | 63 | 76 | 265 | 166 | 966 |
| 1 | 137 | 53 | 105 | 324 | 180 | 1,270 |
| 2 | 113 | 50 | 75 | 228 | 198 | 1,120 |
| 3 | 110 | 45 | 76 | 194 | 200 | 1,093 |
| 4 | 83 | 41 | 71 | 198 | 195 | 1,160 |
| 5 | 89 | 65 | 101 | 200 | 207 | 1,131 |
| 6 | 77 | 47 | 79 | 195 | 202 | 1,105 |
| 7 | 70 | 47 | 103 | 171 | 171 | 1,104 |
| 8 | 87 | 48 | 113 | 147 | 176 | 1,002 |
| 9 | 110 | 37 | 100 | 171 | 190 | 855 |
| 10 | 106 | 49 | 125 | 110 | 184 | 820 |
Positive Influenza tests
Figure 2: Positive Influenza Tests (%) in Canada by Region by Week of Report
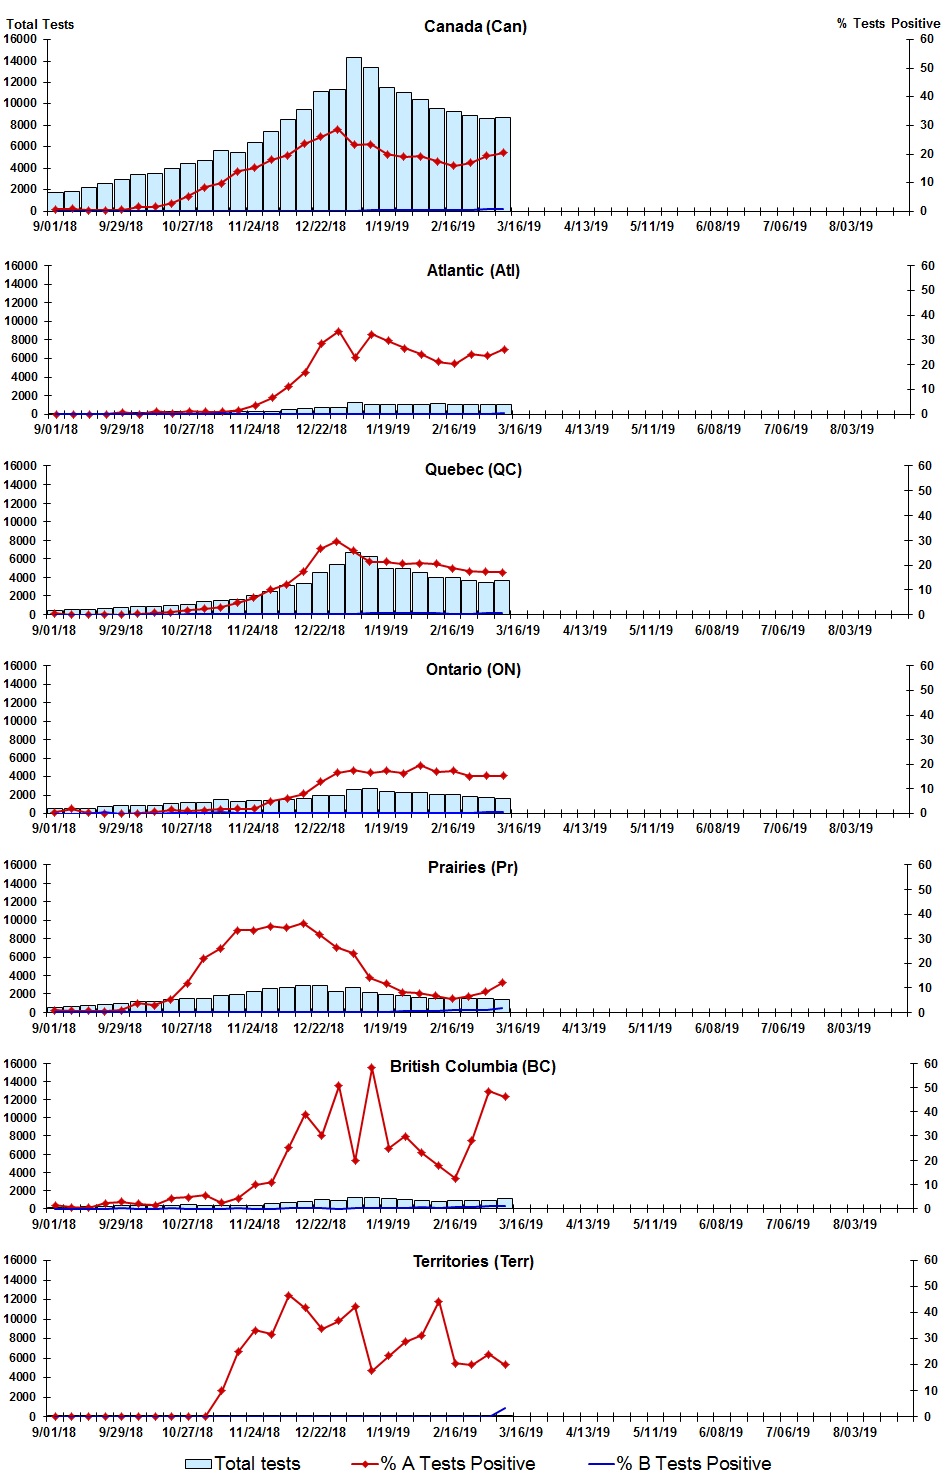
Figure 2: Positive Influenza Tests (%) in Canada by Region by Week of Report - Text description
| Week | Week end | Can Tests | Can A % |
Can B % |
Atl Tests | Atl A % |
Atl B % |
QC Tests | QC A % |
QC B % |
ON Tests | ON A % |
ON B % |
Pr Tests | Pr A % |
Pr B % |
BC Tests | BC A % |
BC B % |
Terr Tests | Terr A % |
Terr B % |
|---|---|---|---|---|---|---|---|---|---|---|---|---|---|---|---|---|---|---|---|---|---|---|
| 35 | 2018-09-01 | 1764 | 0.68 | 0.00 | 60 | 0.00 | 0.00 | 471 | 0.42 | 0.00 | 511 | 0.59 | 0.00 | 555 | 0.90 | 0.00 | 155 | 1.29 | 0.00 | 12 | 0 | 0 |
| 36 | 2018-09-08 | 1880 | 0.80 | 0.00 | 101 | 0.00 | 0.00 | 494 | 0.00 | 0.00 | 523 | 1.91 | 0.00 | 587 | 0.68 | 0.00 | 167 | 0.60 | 0.00 | 8 | 0 | 0 |
| 37 | 2018-09-15 | 2235 | 0.36 | 0.04 | 127 | 0.00 | 0.00 | 586 | 0.00 | 0.00 | 555 | 0.36 | 0.00 | 721 | 0.69 | 0.14 | 230 | 0.43 | 0.00 | 16 | 0 | 0 |
| 38 | 2018-09-22 | 2567 | 0.43 | 0.12 | 98 | 0.00 | 0.00 | 669 | 0.15 | 0.00 | 722 | 0.14 | 0.42 | 799 | 0.38 | 0.00 | 262 | 2.29 | 0.00 | 17 | 0 | 0 |
| 39 | 2018-09-29 | 2996 | 0.57 | 0.10 | 145 | 0.69 | 0.00 | 753 | 0.00 | 0.00 | 842 | 0.00 | 0.00 | 954 | 0.84 | 0.21 | 289 | 2.77 | 0.35 | 13 | 0 | 0 |
| 40 | 2018-10-06 | 3384 | 1.54 | 0.09 | 153 | 0.00 | 0.00 | 833 | 0.36 | 0.00 | 902 | 0.11 | 0.00 | 1130 | 3.63 | 0.27 | 359 | 1.95 | 0.00 | 7 | 0 | 0 |
| 41 | 2018-10-13 | 3510 | 1.54 | 0.09 | 180 | 1.11 | 0.00 | 865 | 0.81 | 0.23 | 909 | 0.66 | 0.00 | 1176 | 2.89 | 0.09 | 350 | 1.43 | 0.00 | 30 | 0 | 0 |
| 42 | 2018-10-20 | 4020 | 2.84 | 0.05 | 248 | 0.40 | 0.00 | 966 | 0.93 | 0.00 | 1103 | 1.63 | 0.09 | 1359 | 5.30 | 0.00 | 325 | 4.31 | 0.31 | 19 | 0 | 0 |
| 43 | 2018-10-27 | 4470 | 5.23 | 0.09 | 238 | 1.26 | 0.00 | 1091 | 1.74 | 0.09 | 1183 | 1.18 | 0.08 | 1486 | 11.91 | 0.13 | 449 | 4.68 | 0.00 | 23 | 0 | 0 |
| 44 | 2018-11-03 | 4703 | 8.42 | 0.13 | 322 | 0.93 | 0.00 | 1371 | 2.33 | 0.22 | 1194 | 1.34 | 0.17 | 1481 | 22.08 | 0.07 | 323 | 5.57 | 0.00 | 12 | 0 | 0 |
| 45 | 2018-11-10 | 5665 | 9.83 | 0.26 | 336 | 0.89 | 0.30 | 1562 | 3.01 | 0.06 | 1571 | 1.72 | 0.76 | 1804 | 26.00 | 0.06 | 372 | 2.42 | 0.00 | 20 | 10 | 0 |
| 46 | 2018-11-17 | 5449 | 13.95 | 0.17 | 267 | 1.50 | 0.00 | 1573 | 4.77 | 0.19 | 1298 | 1.85 | 0.23 | 1898 | 33.46 | 0.11 | 393 | 4.33 | 0.25 | 20 | 25 | 0 |
| 47 | 2018-11-24 | 6386 | 15.24 | 0.13 | 307 | 3.58 | 0.00 | 2043 | 6.71 | 0.05 | 1380 | 2.03 | 0.29 | 2248 | 33.45 | 0.13 | 387 | 9.82 | 0.00 | 21 | 33.33 | 0 |
| 48 | 2018-12-01 | 7416 | 18.07 | 0.13 | 312 | 6.73 | 0.00 | 2462 | 9.99 | 0.28 | 1427 | 4.98 | 0.07 | 2623 | 35.07 | 0.08 | 507 | 10.85 | 0.00 | 85 | 31.76 | 0 |
| 49 | 2018-12-08 | 8559 | 19.52 | 0.19 | 458 | 11.35 | 0.22 | 3150 | 12.32 | 0.25 | 1523 | 6.17 | 0.07 | 2718 | 34.51 | 0.15 | 620 | 25.32 | 0.32 | 90 | 46.67 | 0 |
| 50 | 2018-12-15 | 9464 | 23.57 | 0.15 | 655 | 16.95 | 0.15 | 3365 | 17.53 | 0.15 | 1677 | 8.11 | 0.30 | 2869 | 36.32 | 0.00 | 805 | 38.88 | 0.37 | 93 | 41.94 | 0 |
| 51 | 2018-12-22 | 11142 | 26.00 | 0.19 | 753 | 28.69 | 0.00 | 4519 | 26.55 | 0.33 | 1940 | 12.84 | 0.26 | 2898 | 31.64 | 0.00 | 967 | 30.30 | 0.10 | 65 | 33.85 | 0 |
| 52 | 2018-12-29 | 11338 | 28.67 | 0.23 | 751 | 33.56 | 0.00 | 5369 | 29.65 | 0.34 | 1990 | 16.48 | 0.10 | 2299 | 26.58 | 0.26 | 910 | 50.66 | 0.00 | 19 | 36.84 | 0 |
| 1 | 2019-01-05 | 14349 | 23.26 | 0.22 | 1228 | 22.96 | 0.08 | 6627 | 25.74 | 0.29 | 2612 | 17.53 | 0.08 | 2651 | 24.07 | 0.30 | 1179 | 19.68 | 0.08 | 52 | 42.31 | 0 |
| 2 | 2019-01-12 | 13442 | 23.35 | 0.32 | 1058 | 32.23 | 0.00 | 6300 | 21.33 | 0.51 | 2705 | 16.56 | 0.22 | 2127 | 14.01 | 0.19 | 1201 | 58.20 | 0.08 | 51 | 17.65 | 0 |
| 3 | 2019-01-19 | 11505 | 19.98 | 0.35 | 1062 | 29.66 | 0.09 | 4927 | 21.33 | 0.51 | 2422 | 17.34 | 0.29 | 1931 | 11.60 | 0.21 | 1129 | 24.89 | 0.27 | 34 | 23.53 | 0 |
| 4 | 2019-01-26 | 11066 | 19.05 | 0.43 | 1031 | 26.67 | 0.10 | 4937 | 20.48 | 0.65 | 2241 | 16.47 | 0.27 | 1840 | 8.10 | 0.38 | 972 | 29.94 | 0.21 | 45 | 28.89 | 0 |
| 5 | 2019-02-02 | 10393 | 19.19 | 0.41 | 1095 | 24.29 | 0.00 | 4537 | 20.72 | 0.48 | 2247 | 19.72 | 0.22 | 1564 | 7.86 | 0.70 | 918 | 23.09 | 0.54 | 32 | 31.25 | 0 |
| 6 | 2019-02-09 | 9552 | 17.45 | 0.44 | 1109 | 21.19 | 0.09 | 3982 | 20.49 | 0.53 | 2097 | 17.07 | 0.33 | 1515 | 6.67 | 0.73 | 822 | 17.64 | 0.24 | 27 | 44.44 | 0 |
| 7 | 2019-02-16 | 9343 | 15.93 | 0.35 | 1004 | 20.42 | 0.10 | 3954 | 18.59 | 0.25 | 2040 | 17.30 | 0.29 | 1454 | 5.57 | 0.76 | 852 | 12.44 | 0.59 | 39 | 20.51 | 0 |
| 8 | 2019-02-23 | 8927 | 17.00 | 0.45 | 1013 | 24.28 | 0.20 | 3705 | 17.46 | 0.40 | 1829 | 15.14 | 0.27 | 1482 | 6.55 | 0.88 | 863 | 28.27 | 0.58 | 35 | 20 | 0 |
| 9 | 2019-03-02 | 8603 | 19.41 | 0.74 | 1026 | 23.68 | 0.10 | 3469 | 17.32 | 0.81 | 1718 | 15.37 | 0.64 | 1469 | 8.37 | 0.88 | 892 | 48.43 | 1.23 | 29 | 24.14 | 0 |
| 10 | 2019-03-09 | 8761 | 20.53 | 0.81 | 1017 | 26.25 | 0.39 | 3616 | 17.01 | 0.53 | 1682 | 15.34 | 0.59 | 1353 | 11.97 | 1.77 | 1063 | 46.19 | 1.22 | 30 | 20 | 3.33 |
Positive Respiratory synctial virus tests
Figure 3: Positive Respiratory syncytial virus (RSV) Tests (%) in Canada by Region by Week of Report
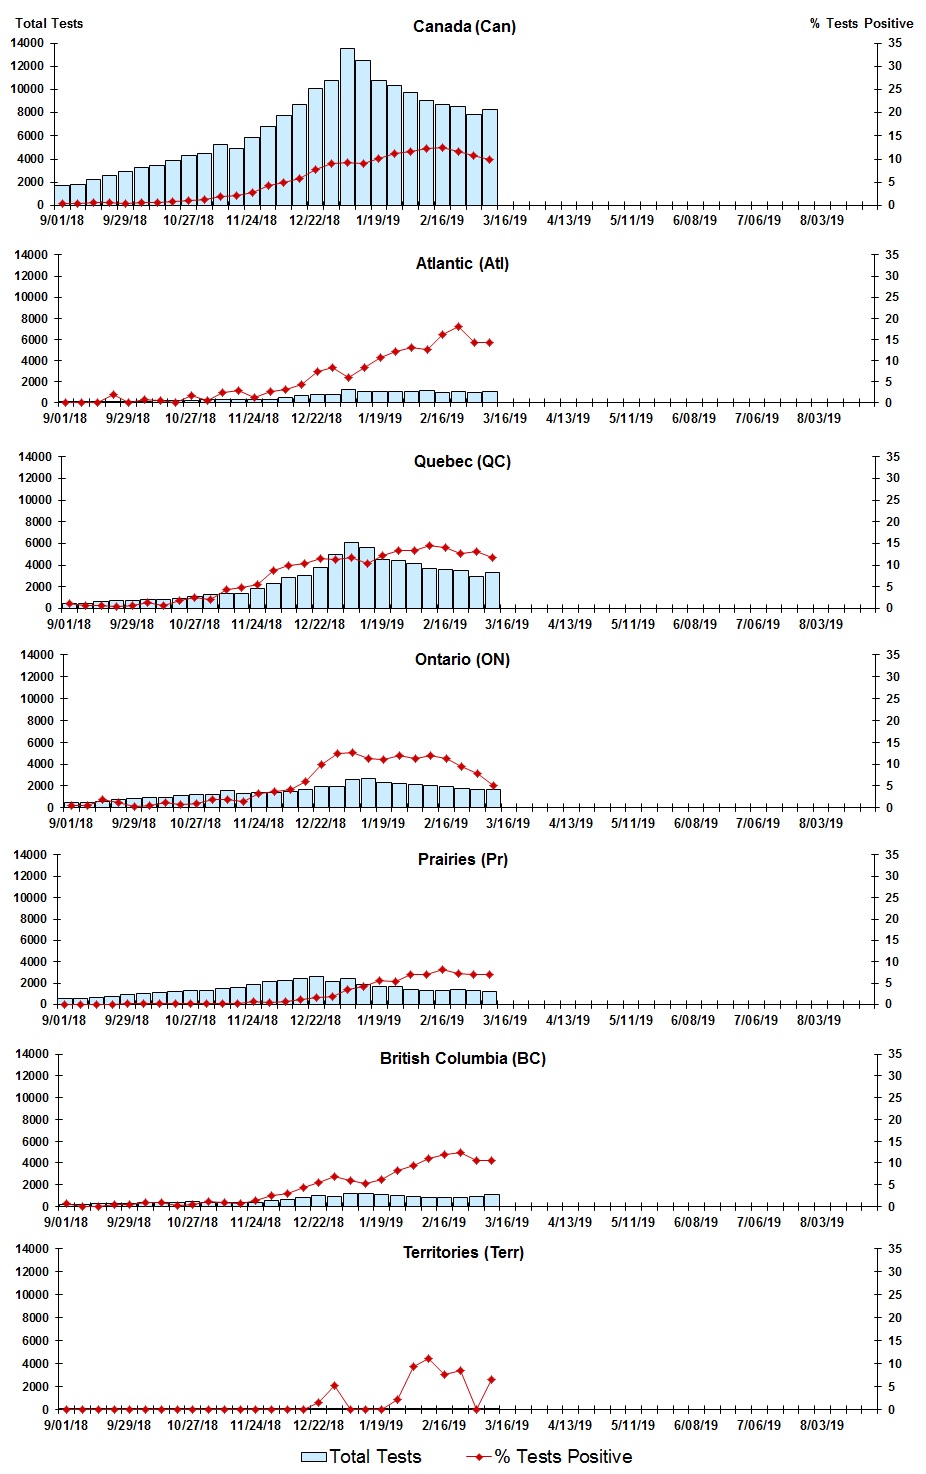
Figure 3: Positive Respiratory syncytial virus (RSV) Tests (%) in Canada by Region by Week of Report - Text description
| Week | Week end | Can Tests | RSV % |
Atl Tests | RSV % |
QC Tests | RSV % |
ON Tests | RSV % |
Pr Tests | RSV % |
BC Tests | RSV % |
Terr Tests | RSV % |
|---|---|---|---|---|---|---|---|---|---|---|---|---|---|---|---|
| 35 | 2018-09-01 | 1743 | 0.52 | 57 | 0 | 489 | 1.23 | 504 | 0.4 | 526 | 0 | 155 | 0.65 | 12 | 0 |
| 36 | 2018-09-08 | 1853 | 0.38 | 100 | 0 | 510 | 0.78 | 514 | 0.58 | 554 | 0 | 167 | 0 | 8 | 0 |
| 37 | 2018-09-15 | 2232 | 0.67 | 127 | 0 | 620 | 0.81 | 552 | 1.81 | 687 | 0 | 230 | 0 | 16 | 0 |
| 38 | 2018-09-22 | 2562 | 0.59 | 99 | 2.02 | 720 | 0.56 | 720 | 1.11 | 744 | 0 | 262 | 0.38 | 17 | 0 |
| 39 | 2018-09-29 | 2946 | 0.41 | 146 | 0 | 770 | 0.78 | 838 | 0.36 | 890 | 0.22 | 289 | 0.35 | 13 | 0 |
| 40 | 2018-10-06 | 3307 | 0.73 | 153 | 0.65 | 844 | 1.42 | 897 | 0.56 | 1047 | 0.29 | 359 | 0.84 | 7 | 0 |
| 41 | 2018-10-13 | 3423 | 0.67 | 180 | 0.56 | 862 | 0.81 | 907 | 1.1 | 1094 | 0.18 | 350 | 0.86 | 30 | 0 |
| 42 | 2018-10-20 | 3875 | 0.83 | 246 | 0 | 964 | 1.97 | 1094 | 0.73 | 1227 | 0.33 | 325 | 0.31 | 19 | 0 |
| 43 | 2018-10-27 | 4346 | 1.13 | 240 | 1.67 | 1123 | 2.58 | 1178 | 1.02 | 1333 | 0.15 | 449 | 0.45 | 23 | 0 |
| 44 | 2018-11-03 | 4472 | 1.39 | 322 | 0.62 | 1328 | 2.18 | 1191 | 1.93 | 1297 | 0.31 | 323 | 1.24 | 11 | 0 |
| 45 | 2018-11-10 | 5234 | 2.06 | 336 | 2.38 | 1430 | 4.48 | 1559 | 1.86 | 1518 | 0.26 | 372 | 0.81 | 19 | 0 |
| 46 | 2018-11-17 | 4960 | 2.08 | 267 | 3 | 1427 | 4.98 | 1284 | 1.32 | 1569 | 0.25 | 393 | 0.76 | 20 | 0 |
| 47 | 2018-11-24 | 5857 | 2.92 | 310 | 1.29 | 1891 | 5.5 | 1378 | 3.34 | 1870 | 0.64 | 387 | 1.29 | 21 | 0 |
| 48 | 2018-12-01 | 6776 | 4.24 | 314 | 2.55 | 2311 | 8.74 | 1423 | 3.65 | 2136 | 0.56 | 507 | 2.56 | 85 | 0 |
| 49 | 2018-12-08 | 7795 | 5.07 | 459 | 3.05 | 2860 | 9.93 | 1518 | 4.22 | 2248 | 0.67 | 620 | 2.9 | 90 | 0 |
| 50 | 2018-12-15 | 8720 | 5.81 | 655 | 4.27 | 3055 | 10.34 | 1663 | 6.01 | 2449 | 1.14 | 805 | 4.35 | 93 | 0 |
| 51 | 2018-12-22 | 10088 | 7.81 | 753 | 7.44 | 3810 | 11.63 | 1918 | 9.96 | 2575 | 1.71 | 967 | 5.48 | 65 | 1.54 |
| 52 | 2018-12-29 | 10747 | 8.99 | 751 | 8.26 | 4991 | 11.32 | 1899 | 12.43 | 2177 | 1.79 | 910 | 6.92 | 19 | 5.26 |
| 1 | 2019-01-05 | 13546 | 9.38 | 1230 | 6.02 | 6123 | 11.74 | 2547 | 12.6 | 2416 | 3.56 | 1179 | 5.94 | 51 | 0 |
| 2 | 2019-01-12 | 12483 | 8.97 | 1058 | 8.41 | 5652 | 10.42 | 2650 | 11.36 | 1871 | 4.17 | 1201 | 5.25 | 51 | 0 |
| 3 | 2019-01-19 | 10787 | 10.13 | 1063 | 10.63 | 4529 | 12.3 | 2341 | 11.02 | 1691 | 5.68 | 1129 | 6.11 | 34 | 0 |
| 4 | 2019-01-26 | 10370 | 11.19 | 1031 | 12.03 | 4484 | 13.4 | 2203 | 11.98 | 1636 | 5.44 | 972 | 8.33 | 44 | 2.27 |
| 5 | 2019-02-02 | 9712 | 11.65 | 1100 | 13 | 4192 | 13.5 | 2093 | 11.37 | 1377 | 6.9 | 918 | 9.37 | 32 | 9.38 |
| 6 | 2019-02-09 | 9035 | 12.23 | 1111 | 12.51 | 3689 | 14.5 | 2037 | 11.88 | 1349 | 7.12 | 822 | 10.95 | 27 | 11.11 |
| 7 | 2019-02-16 | 8745 | 12.62 | 1008 | 16.07 | 3612 | 14.2 | 1923 | 11.28 | 1311 | 8.24 | 852 | 11.85 | 39 | 7.69 |
| 8 | 2019-02-23 | 8545 | 11.73 | 1015 | 18.03 | 3497 | 12.64 | 1778 | 9.39 | 1357 | 7.3 | 863 | 12.51 | 35 | 8.57 |
| 9 | 2019-03-02 | 7863 | 10.87 | 1005 | 14.23 | 2967 | 13.28 | 1671 | 7.9 | 1299 | 7.08 | 892 | 10.54 | 29 | 0 |
| 10 | 2019-03-09 | 8272 | 9.91 | 1019 | 14.23 | 3335 | 11.84 | 1628 | 5.04 | 1197 | 6.93 | 1063 | 10.63 | 30 | 6.67 |
Positive Parainfluenza tests
Figure 4: Positive Parainfluenza (PIV) Tests (%) in Canada by Region by Week of Report
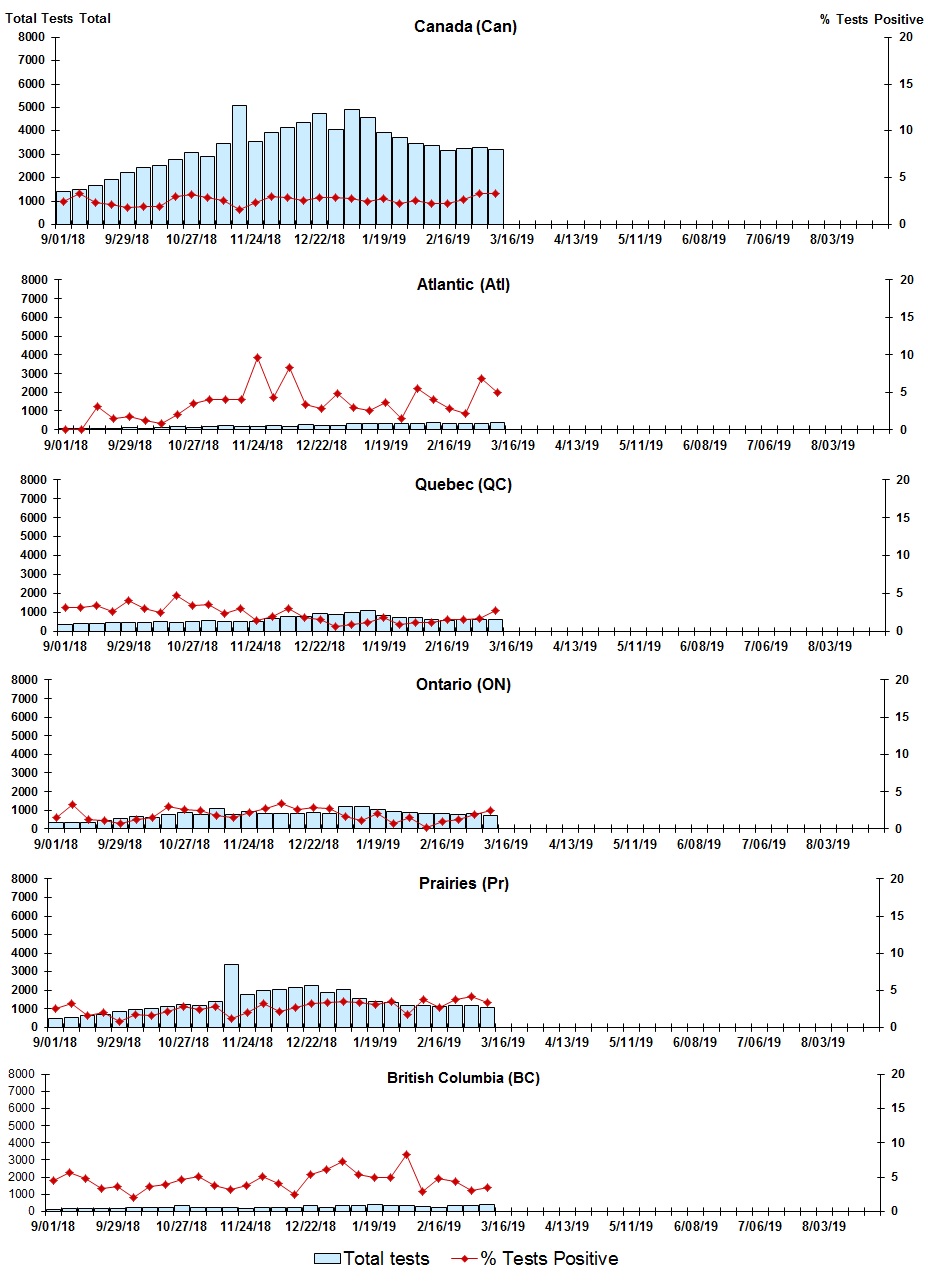
Figure 4: Positive Parainfluenza (PIV) Tests (%) in Canada by Region by Week of Report - Text description
| Week | Week End | Canada Tests | PIV % |
Atl Tests | PIV % |
QC Tests | PIV % |
ON Tests | PIV % |
Pr Tests | PIV % |
BC Tests | PIV % |
|---|---|---|---|---|---|---|---|---|---|---|---|---|---|
| 35 | 2018-09-01 | 1401 | 2.5 | 57 | 0 | 382 | 3.14 | 332 | 1.51 | 507 | 2.56 | 111 | 4.5 |
| 36 | 2018-09-08 | 1480 | 3.31 | 49 | 0 | 404 | 3.22 | 345 | 3.19 | 534 | 3.18 | 141 | 5.67 |
| 37 | 2018-09-15 | 1677 | 2.39 | 64 | 3.13 | 432 | 3.47 | 341 | 1.17 | 659 | 1.67 | 165 | 4.85 |
| 38 | 2018-09-22 | 1924 | 2.13 | 70 | 1.43 | 487 | 2.67 | 453 | 1.1 | 716 | 1.96 | 181 | 3.31 |
| 39 | 2018-09-29 | 2214 | 1.81 | 113 | 1.77 | 492 | 4.07 | 555 | 0.72 | 847 | 0.83 | 194 | 3.61 |
| 40 | 2018-10-06 | 2444 | 1.92 | 82 | 1.22 | 492 | 3.05 | 635 | 1.26 | 987 | 1.72 | 241 | 2.07 |
| 41 | 2018-10-13 | 2521 | 1.94 | 117 | 0.85 | 517 | 2.51 | 598 | 1.51 | 1006 | 1.59 | 253 | 3.56 |
| 42 | 2018-10-20 | 2798 | 3 | 146 | 2.05 | 501 | 4.79 | 785 | 2.93 | 1121 | 2.14 | 226 | 3.98 |
| 43 | 2018-10-27 | 3081 | 3.18 | 113 | 3.54 | 544 | 3.49 | 852 | 2.58 | 1230 | 2.85 | 319 | 4.7 |
| 44 | 2018-11-03 | 2921 | 2.94 | 149 | 4.03 | 583 | 3.6 | 778 | 2.44 | 1189 | 2.35 | 214 | 5.14 |
| 45 | 2018-11-10 | 3474 | 2.53 | 201 | 3.98 | 534 | 2.43 | 1086 | 1.75 | 1403 | 2.78 | 237 | 3.8 |
| 46 | 2018-11-17 | 5070 | 1.62 | 175 | 4 | 523 | 3.06 | 747 | 1.47 | 3392 | 1.21 | 219 | 3.2 |
| 47 | 2018-11-24 | 3558 | 2.36 | 156 | 9.62 | 553 | 1.45 | 901 | 2.22 | 1748 | 1.95 | 183 | 3.83 |
| 48 | 2018-12-01 | 3932 | 3.03 | 209 | 4.31 | 672 | 1.93 | 808 | 2.72 | 1963 | 3.16 | 215 | 5.12 |
| 49 | 2018-12-08 | 4143 | 2.94 | 157 | 8.28 | 795 | 3.02 | 835 | 3.35 | 2051 | 2.19 | 223 | 4.04 |
| 50 | 2018-12-15 | 4371 | 2.54 | 268 | 3.36 | 784 | 1.91 | 821 | 2.56 | 2171 | 2.72 | 243 | 2.47 |
| 51 | 2018-12-22 | 4729 | 2.94 | 217 | 2.76 | 967 | 1.65 | 892 | 2.8 | 2264 | 3.27 | 338 | 5.33 |
| 52 | 2018-12-29 | 4081 | 2.87 | 205 | 4.88 | 924 | 0.65 | 834 | 2.64 | 1872 | 3.42 | 227 | 6.17 |
| 1 | 2019-01-05 | 4919 | 2.79 | 311 | 2.89 | 986 | 0.91 | 1175 | 1.62 | 2056 | 3.5 | 356 | 7.3 |
| 2 | 2019-01-12 | 4593 | 2.46 | 347 | 2.59 | 1095 | 1.19 | 1213 | 1.15 | 1556 | 3.41 | 349 | 5.44 |
| 3 | 2019-01-19 | 3952 | 2.78 | 327 | 3.67 | 829 | 1.81 | 1005 | 2.09 | 1395 | 3.08 | 380 | 5 |
| 4 | 2019-01-26 | 3731 | 2.22 | 337 | 1.48 | 762 | 0.92 | 935 | 0.75 | 1343 | 3.43 | 327 | 4.89 |
| 5 | 2019-02-02 | 3468 | 2.57 | 343 | 5.54 | 726 | 1.24 | 893 | 1.46 | 1166 | 1.72 | 325 | 8.31 |
| 6 | 2019-02-09 | 3375 | 2.28 | 377 | 3.98 | 662 | 1.21 | 840 | 0.12 | 1174 | 3.75 | 310 | 2.9 |
| 7 | 2019-02-16 | 3152 | 2.22 | 326 | 2.76 | 609 | 1.64 | 801 | 1 | 1136 | 2.73 | 253 | 4.74 |
| 8 | 2019-02-23 | 3262 | 2.67 | 327 | 2.14 | 631 | 1.58 | 775 | 1.29 | 1183 | 3.8 | 325 | 4.31 |
| 9 | 2019-03-02 | 3298 | 3.34 | 321 | 6.85 | 621 | 1.77 | 788 | 1.9 | 1187 | 4.21 | 357 | 3.08 |
| 10 | 2019-03-09 | 3190 | 3.32 | 361 | 4.99 | 623 | 2.73 | 693 | 2.45 | 1088 | 3.4 | 401 | 3.49 |
Positive Adenovirus tests
Figure 5: Positive Adenovirus (adeno) Tests (%) in Canada by Region by Week of Report
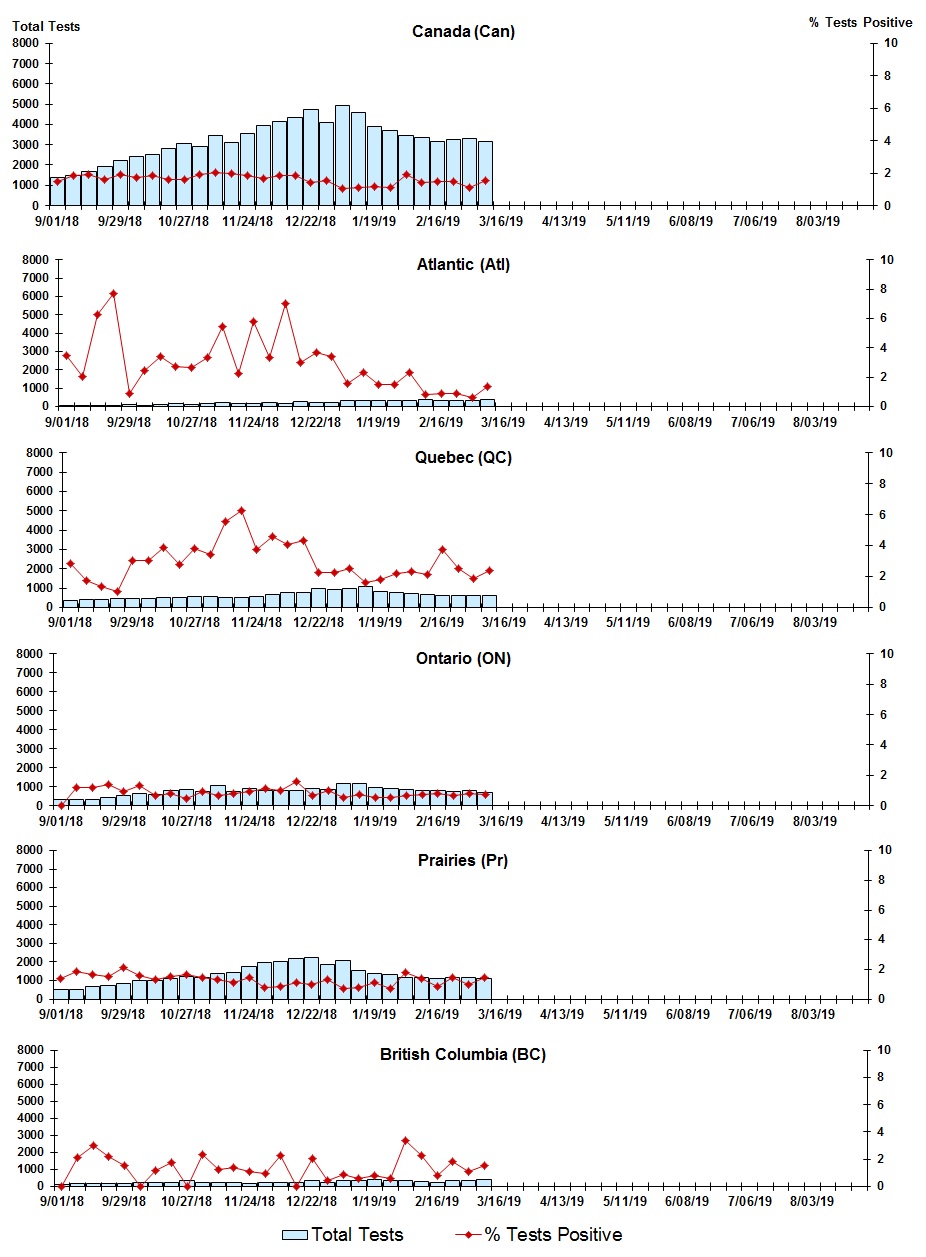
Figure 5: Positive Adenovirus (adeno) Tests (%) in Canada by Region by Week of Report - Text description
| Week | Week End | Can Tests | Adeno % |
Atl Tests | Adeno % |
QC Tests | Adeno % |
ON Tests | Adeno % |
Pr Tests | Adeno % |
BC Tests | Adeno % |
|---|---|---|---|---|---|---|---|---|---|---|---|---|---|
| 35 | 2018-09-01 | 1394 | 1.51 | 57 | 3.51 | 384 | 2.86 | 323 | 0 | 507 | 1.38 | 111 | 0 |
| 36 | 2018-09-08 | 1471 | 1.84 | 49 | 2.04 | 404 | 1.73 | 336 | 1.19 | 534 | 1.87 | 141 | 2.13 |
| 37 | 2018-09-15 | 1666 | 1.92 | 64 | 6.25 | 434 | 1.38 | 328 | 1.22 | 659 | 1.67 | 165 | 3.03 |
| 38 | 2018-09-22 | 1910 | 1.62 | 65 | 7.69 | 489 | 1.02 | 442 | 1.36 | 716 | 1.54 | 181 | 2.21 |
| 39 | 2018-09-29 | 2200 | 1.91 | 113 | 0.88 | 493 | 3.04 | 540 | 0.93 | 847 | 2.13 | 194 | 1.55 |
| 40 | 2018-10-06 | 2426 | 1.73 | 82 | 2.44 | 492 | 3.05 | 617 | 1.3 | 987 | 1.62 | 241 | 0 |
| 41 | 2018-10-13 | 2511 | 1.83 | 117 | 3.42 | 516 | 3.88 | 589 | 0.68 | 1006 | 1.29 | 253 | 1.19 |
| 42 | 2018-10-20 | 2789 | 1.61 | 146 | 2.74 | 502 | 2.79 | 775 | 0.77 | 1121 | 1.52 | 226 | 1.77 |
| 43 | 2018-10-27 | 3065 | 1.63 | 113 | 2.65 | 550 | 3.82 | 830 | 0.48 | 1230 | 1.63 | 319 | 0 |
| 44 | 2018-11-03 | 2910 | 1.89 | 149 | 3.36 | 586 | 3.41 | 764 | 0.92 | 1189 | 1.43 | 214 | 2.34 |
| 45 | 2018-11-10 | 3459 | 2.02 | 201 | 5.47 | 540 | 5.56 | 1065 | 0.66 | 1403 | 1.35 | 237 | 1.27 |
| 46 | 2018-11-17 | 3123 | 1.99 | 175 | 2.29 | 524 | 6.3 | 732 | 0.82 | 1459 | 1.1 | 219 | 1.37 |
| 47 | 2018-11-24 | 3547 | 1.83 | 156 | 5.77 | 557 | 3.77 | 886 | 0.9 | 1748 | 1.43 | 183 | 1.09 |
| 48 | 2018-12-01 | 3926 | 1.66 | 209 | 3.35 | 675 | 4.59 | 799 | 1.13 | 1963 | 0.76 | 215 | 0.93 |
| 49 | 2018-12-08 | 4137 | 1.84 | 157 | 7.01 | 804 | 4.1 | 820 | 0.98 | 2051 | 0.88 | 223 | 2.24 |
| 50 | 2018-12-15 | 4356 | 1.88 | 268 | 2.99 | 786 | 4.33 | 804 | 1.62 | 2171 | 1.11 | 243 | 0 |
| 51 | 2018-12-22 | 4759 | 1.45 | 217 | 3.69 | 1009 | 2.28 | 880 | 0.68 | 2264 | 0.97 | 338 | 2.07 |
| 52 | 2018-12-29 | 4077 | 1.55 | 205 | 3.41 | 928 | 2.26 | 826 | 0.97 | 1872 | 1.34 | 227 | 0.44 |
| 1 | 2019-01-05 | 4909 | 1.08 | 311 | 1.61 | 986 | 2.54 | 1165 | 0.52 | 2056 | 0.68 | 356 | 0.84 |
| 2 | 2019-01-12 | 4571 | 1.09 | 347 | 2.31 | 1097 | 1.64 | 1189 | 0.76 | 1556 | 0.77 | 349 | 0.57 |
| 3 | 2019-01-19 | 3918 | 1.15 | 327 | 1.53 | 829 | 1.81 | 971 | 0.51 | 1395 | 1.15 | 380 | 0.79 |
| 4 | 2019-01-26 | 3710 | 1.11 | 337 | 1.48 | 764 | 2.23 | 912 | 0.55 | 1343 | 0.74 | 327 | 0.61 |
| 5 | 2019-02-02 | 3444 | 1.89 | 343 | 2.33 | 727 | 2.34 | 868 | 0.69 | 1166 | 1.8 | 325 | 3.38 |
| 6 | 2019-02-09 | 3351 | 1.4 | 377 | 0.8 | 660 | 2.12 | 818 | 0.73 | 1174 | 1.36 | 310 | 2.26 |
| 7 | 2019-02-16 | 3134 | 1.5 | 326 | 0.92 | 611 | 3.76 | 781 | 0.77 | 1136 | 0.88 | 253 | 0.79 |
| 8 | 2019-02-23 | 3256 | 1.47 | 327 | 0.92 | 636 | 2.52 | 764 | 0.65 | 1183 | 1.44 | 325 | 1.85 |
| 9 | 2019-03-02 | 3291 | 1.12 | 321 | 0.62 | 627 | 1.91 | 775 | 0.77 | 1187 | 1.01 | 357 | 1.12 |
| 10 | 2019-03-09 | 3177 | 1.54 | 361 | 1.39 | 629 | 2.38 | 674 | 0.74 | 1088 | 1.47 | 401 | 1.5 |
Positive Human metapneumovirus tests
Figure 6: Positive human metapneumovirus (hMPV) Tests (%) in Canada by Region by Week of Report
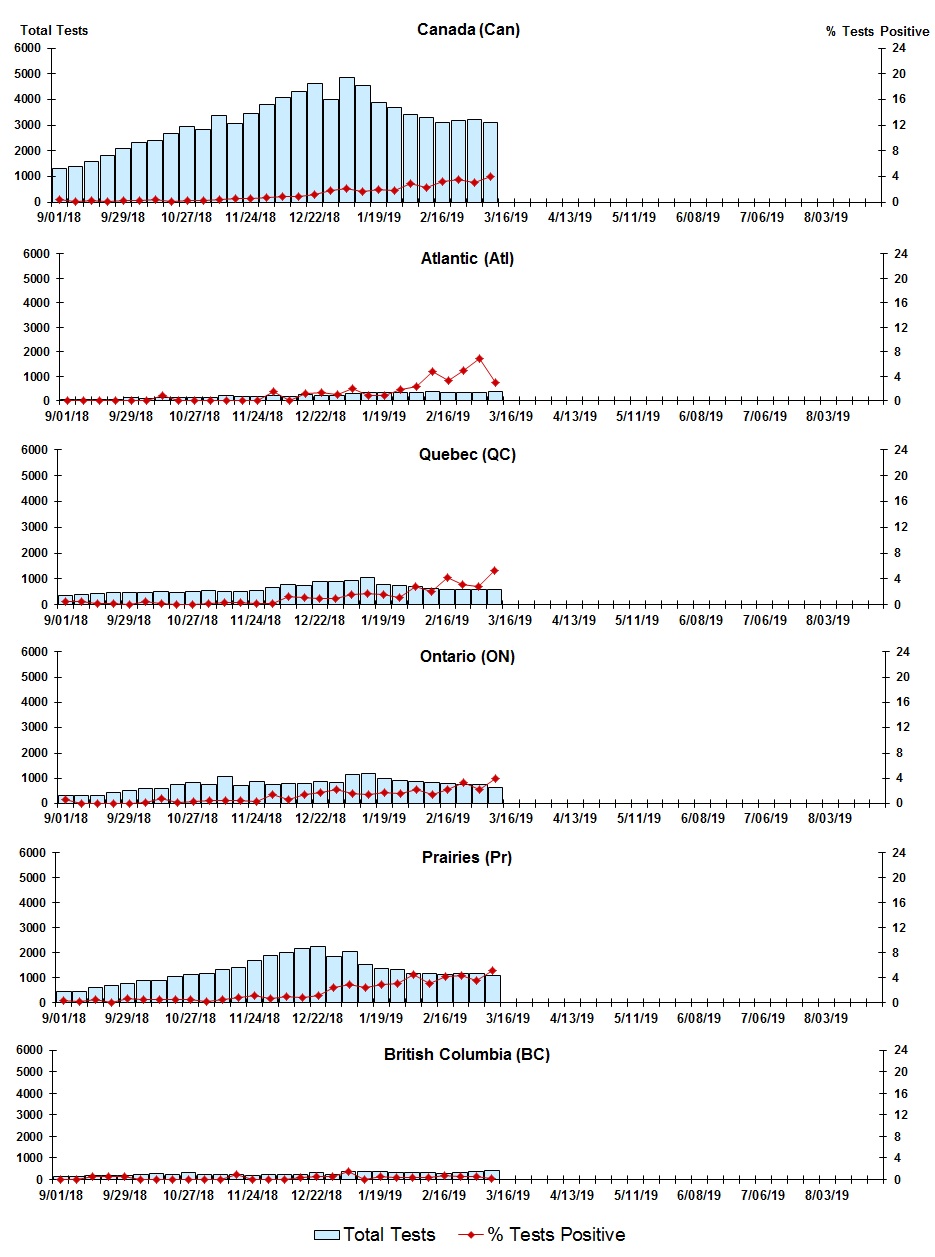
Figure 6: Positive human metapneumovirus (hMPV) Tests (%) in Canada by Region by Week of Report - Text description
| Week | Week End | Can Tests | hMPV % |
Atl Tests | hMPV % |
QC Tests | hMPV % |
ON Tests | hMPV % |
Pr Tests | hMPV % |
BC Tests | hMPV % |
|---|---|---|---|---|---|---|---|---|---|---|---|---|---|
| 35 | 2018-09-01 | 1335 | 0.45 | 57 | 0.00 | 368 | 0.54 | 322 | 0.62 | 466 | 0.43 | 111 | 0 |
| 36 | 2018-09-08 | 1383 | 0.22 | 49 | 0.00 | 393 | 0.51 | 335 | 0 | 458 | 0.22 | 141 | 0 |
| 37 | 2018-09-15 | 1598 | 0.31 | 64 | 0.00 | 416 | 0.24 | 336 | 0 | 601 | 0.5 | 165 | 0.61 |
| 38 | 2018-09-22 | 1837 | 0.11 | 65 | 0.00 | 470 | 0.21 | 434 | 0 | 670 | 0 | 181 | 0.55 |
| 39 | 2018-09-29 | 2097 | 0.29 | 113 | 0.00 | 474 | 0 | 538 | 0 | 765 | 0.65 | 194 | 0.52 |
| 40 | 2018-10-06 | 2312 | 0.3 | 82 | 0.00 | 467 | 0.43 | 620 | 0.16 | 895 | 0.45 | 241 | 0 |
| 41 | 2018-10-13 | 2392 | 0.5 | 117 | 0.85 | 499 | 0.2 | 589 | 0.85 | 904 | 0.55 | 253 | 0 |
| 42 | 2018-10-20 | 2690 | 0.22 | 146 | 0.00 | 481 | 0 | 769 | 0.13 | 1049 | 0.48 | 226 | 0 |
| 43 | 2018-10-27 | 2946 | 0.34 | 113 | 0.00 | 523 | 0 | 837 | 0.36 | 1131 | 0.53 | 319 | 0 |
| 44 | 2018-11-03 | 2841 | 0.28 | 149 | 0.00 | 560 | 0.18 | 757 | 0.53 | 1153 | 0.26 | 214 | 0 |
| 45 | 2018-11-10 | 3375 | 0.41 | 201 | 0.00 | 524 | 0.38 | 1078 | 0.46 | 1322 | 0.53 | 237 | 0 |
| 46 | 2018-11-17 | 3074 | 0.62 | 175 | 0.00 | 507 | 0.39 | 734 | 0.54 | 1425 | 0.77 | 219 | 0.91 |
| 47 | 2018-11-24 | 3475 | 0.66 | 156 | 0.00 | 538 | 0.19 | 872 | 0.34 | 1709 | 1.11 | 183 | 0 |
| 48 | 2018-12-01 | 3820 | 0.71 | 209 | 1.44 | 650 | 0.15 | 777 | 1.42 | 1904 | 0.63 | 215 | 0 |
| 49 | 2018-12-08 | 4072 | 0.86 | 157 | 0.00 | 773 | 1.29 | 811 | 0.62 | 2026 | 0.99 | 223 | 0 |
| 50 | 2018-12-15 | 4319 | 0.97 | 268 | 1.12 | 762 | 1.05 | 805 | 1.49 | 2157 | 0.79 | 243 | 0.41 |
| 51 | 2018-12-22 | 4618 | 1.21 | 217 | 1.38 | 900 | 0.89 | 877 | 1.82 | 2235 | 1.21 | 338 | 0.59 |
| 52 | 2018-12-29 | 4018 | 1.89 | 205 | 0.98 | 903 | 0.89 | 824 | 2.31 | 1840 | 2.5 | 227 | 0.44 |
| 1 | 2019-01-05 | 4844 | 2.17 | 311 | 1.93 | 949 | 1.58 | 1160 | 1.64 | 2033 | 2.95 | 356 | 1.4 |
| 2 | 2019-01-12 | 4529 | 1.66 | 347 | 0.86 | 1063 | 1.69 | 1193 | 1.42 | 1544 | 2.4 | 349 | 0 |
| 3 | 2019-01-19 | 3872 | 1.96 | 327 | 0.92 | 792 | 1.64 | 978 | 1.84 | 1379 | 2.9 | 380 | 0.53 |
| 4 | 2019-01-26 | 3677 | 1.93 | 337 | 1.78 | 740 | 1.08 | 916 | 1.64 | 1330 | 3.08 | 327 | 0.31 |
| 5 | 2019-02-02 | 3413 | 2.96 | 343 | 2.33 | 698 | 2.87 | 877 | 2.17 | 1155 | 4.5 | 325 | 0.31 |
| 6 | 2019-02-09 | 3313 | 2.38 | 377 | 4.77 | 630 | 2.06 | 828 | 1.45 | 1156 | 3.03 | 310 | 0.32 |
| 7 | 2019-02-16 | 3092 | 3.33 | 326 | 3.37 | 579 | 4.15 | 782 | 2.3 | 1125 | 4.27 | 253 | 0.79 |
| 8 | 2019-02-23 | 3186 | 3.55 | 327 | 4.89 | 600 | 3.17 | 758 | 3.43 | 1155 | 4.33 | 325 | 0.62 |
| 9 | 2019-03-02 | 3235 | 3.09 | 321 | 6.85 | 602 | 2.82 | 771 | 2.2 | 1160 | 3.62 | 357 | 0.56 |
Positive Enterovirus/Rhinovirus tests
Figure 7: Positive Enterovirus/Rhinovirus (entero/rhino) Tests (%) in Canada by Region by Week of Report
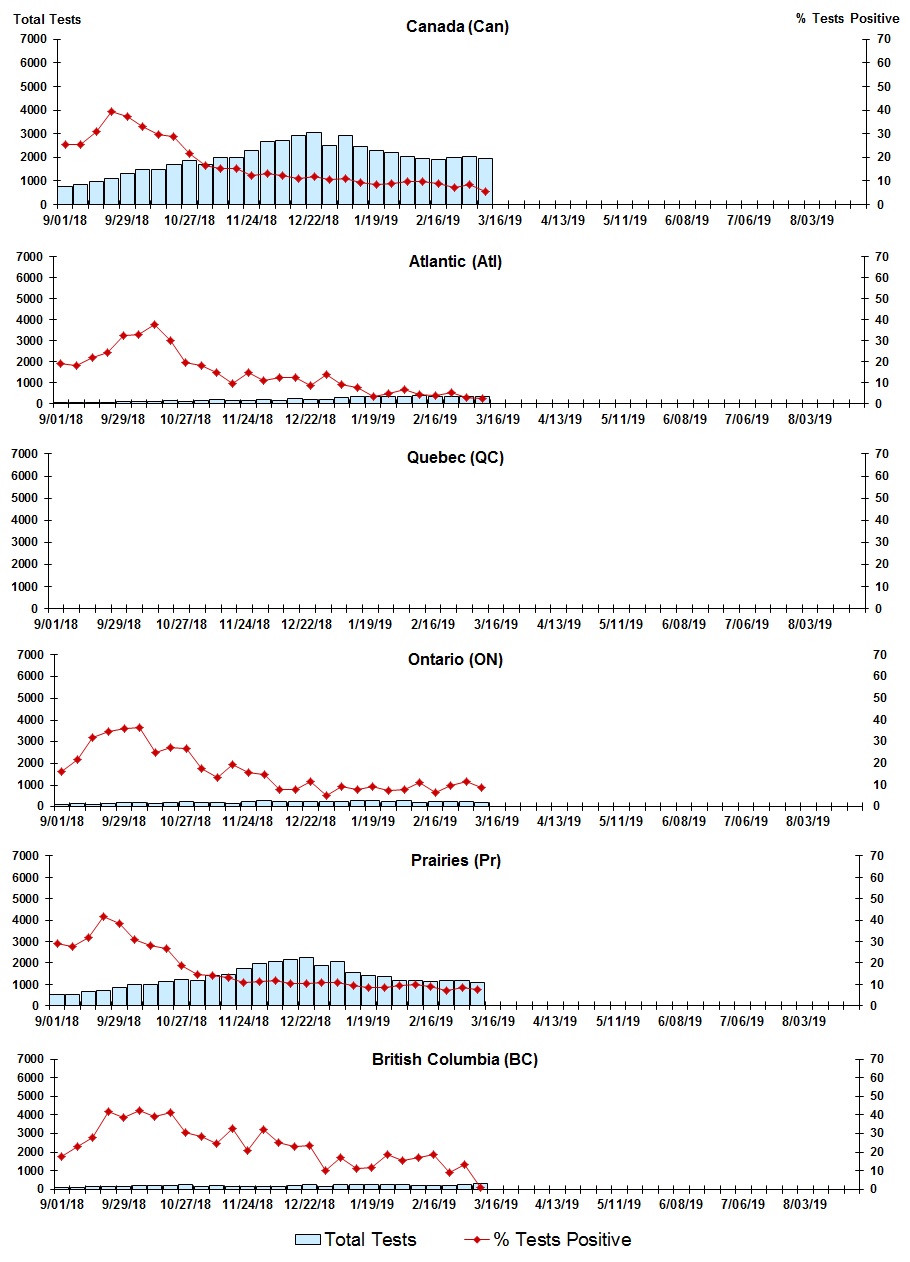
Figure 7: Positive Enterovirus/Rhinovirus (entero/rhino) Tests (%) in Canada by Region by Week of Report - Text description
| Week | Week End | Canada Tests | Entero/rhino % |
Atl Tests | Entero/rhino % |
QC Tests | Entero/rhino % |
ON Tests | Entero/rhino % |
Pr Tests | Entero/rhino % |
BC Tests | Entero/rhino % |
|---|---|---|---|---|---|---|---|---|---|---|---|---|---|
| 35 | 2018-09-01 | 771 | 25.42 | 57 | 19.3 | N.A. | N.A. | 99 | 16.16 | 507 | 29.19 | 96 | 17.71 |
| 36 | 2018-09-08 | 837 | 25.57 | 49 | 18.37 | N.A. | N.A. | 125 | 21.6 | 534 | 27.53 | 122 | 22.95 |
| 37 | 2018-09-15 | 963 | 31.05 | 64 | 21.88 | N.A. | N.A. | 81 | 32.1 | 659 | 32.02 | 143 | 27.97 |
| 38 | 2018-09-22 | 1112 | 39.57 | 65 | 24.62 | N.A. | N.A. | 161 | 34.78 | 716 | 41.48 | 153 | 41.83 |
| 39 | 2018-09-29 | 1303 | 37.38 | 113 | 32.74 | N.A. | N.A. | 180 | 36.11 | 847 | 38.37 | 150 | 38.67 |
| 40 | 2018-10-06 | 1475 | 33.22 | 82 | 32.93 | N.A. | N.A. | 198 | 36.36 | 987 | 30.9 | 201 | 42.29 |
| 41 | 2018-10-13 | 1496 | 29.81 | 117 | 37.61 | N.A. | N.A. | 141 | 24.82 | 1006 | 27.93 | 202 | 39.11 |
| 42 | 2018-10-20 | 1679 | 28.65 | 146 | 30.14 | N.A. | N.A. | 206 | 27.18 | 1121 | 26.67 | 187 | 41.18 |
| 43 | 2018-10-27 | 1855 | 21.67 | 113 | 19.47 | N.A. | N.A. | 225 | 26.67 | 1230 | 18.7 | 264 | 30.68 |
| 44 | 2018-11-03 | 1713 | 16.75 | 149 | 18.12 | N.A. | N.A. | 206 | 17.48 | 1189 | 14.8 | 161 | 28.57 |
| 45 | 2018-11-10 | 1998 | 15.17 | 201 | 14.93 | N.A. | N.A. | 198 | 13.64 | 1403 | 14.18 | 183 | 24.59 |
| 46 | 2018-11-17 | 1990 | 15.28 | 175 | 9.71 | N.A. | N.A. | 168 | 19.64 | 1459 | 13.23 | 174 | 32.76 |
| 47 | 2018-11-24 | 2296 | 12.15 | 156 | 14.74 | N.A. | N.A. | 227 | 15.86 | 1748 | 10.76 | 148 | 20.95 |
| 48 | 2018-12-01 | 2678 | 13.26 | 209 | 11 | N.A. | N.A. | 280 | 15 | 1963 | 11.46 | 161 | 32.3 |
| 49 | 2018-12-08 | 2706 | 12.42 | 157 | 12.74 | N.A. | N.A. | 245 | 8.16 | 2051 | 11.9 | 171 | 25.15 |
| 50 | 2018-12-15 | 2947 | 11.13 | 268 | 12.69 | N.A. | N.A. | 246 | 7.72 | 2171 | 10.18 | 178 | 23.03 |
| 51 | 2018-12-22 | 3058 | 11.77 | 217 | 8.76 | N.A. | N.A. | 250 | 11.6 | 2264 | 10.51 | 276 | 23.55 |
| 52 | 2018-12-29 | 2497 | 10.61 | 205 | 14.15 | N.A. | N.A. | 252 | 5.16 | 1872 | 11 | 149 | 10.07 |
| 1 | 2019-01-05 | 2922 | 11.09 | 311 | 9.32 | N.A. | N.A. | 253 | 9.49 | 2056 | 10.65 | 267 | 16.85 |
| 2 | 2019-01-12 | 2473 | 9.22 | 347 | 7.78 | N.A. | N.A. | 264 | 7.95 | 1556 | 9.25 | 273 | 10.99 |
| 3 | 2019-01-19 | 2304 | 8.42 | 327 | 3.36 | N.A. | N.A. | 282 | 9.22 | 1395 | 8.53 | 284 | 11.97 |
| 4 | 2019-01-26 | 2190 | 9.04 | 337 | 5.04 | N.A. | N.A. | 246 | 7.32 | 1343 | 8.34 | 237 | 18.57 |
| 5 | 2019-02-02 | 2043 | 9.79 | 343 | 7 | N.A. | N.A. | 271 | 8.12 | 1166 | 9.61 | 248 | 15.73 |
| 6 | 2019-02-09 | 1972 | 9.89 | 377 | 4.24 | N.A. | N.A. | 198 | 11.11 | 1174 | 10.14 | 211 | 17.06 |
| 7 | 2019-02-16 | 1910 | 8.95 | 326 | 3.99 | N.A. | N.A. | 233 | 6.44 | 1136 | 9.07 | 188 | 18.62 |
| 8 | 2019-02-23 | 1971 | 7.43 | 327 | 5.5 | N.A. | N.A. | 220 | 10 | 1183 | 7.1 | 228 | 9.21 |
| 9 | 2019-03-02 | 2038 | 8.39 | 321 | 2.8 | N.A. | N.A. | 262 | 11.83 | 1187 | 8.34 | 244 | 13.11 |
| 10 | 2019-03-09 | 1950 | 5.64 | 361 | 2.49 | N.A. | N.A. | 183 | 8.74 | 1088 | 7.35 | 294 | 1.02 |
Positive Coronovirus tests
Figure 8: Positive Coronavirus (coron) Tests (%) in Canada by Region by Week of Report
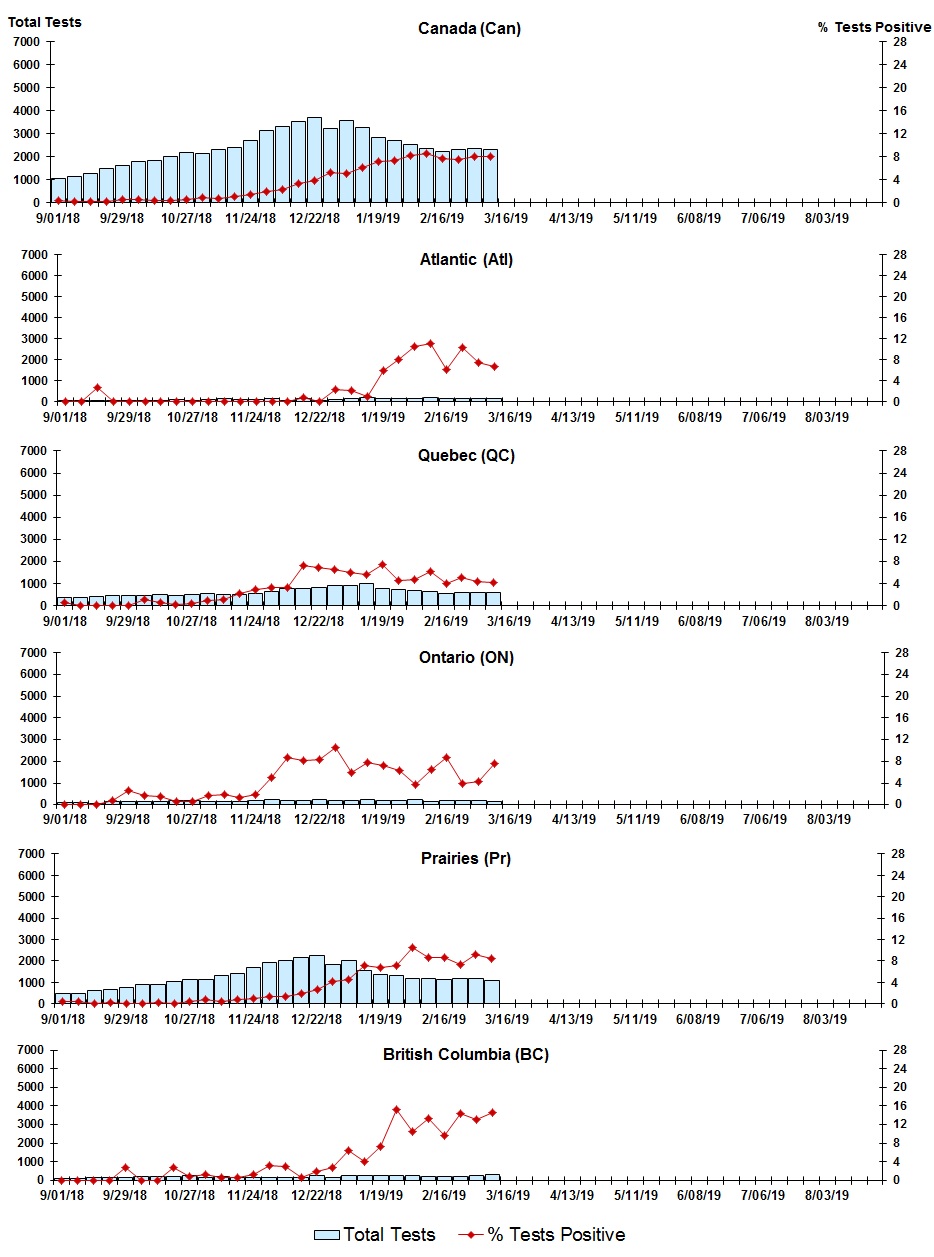
Figure 8: Positive Coronavirus (coron) Tests (%) in Canada by Region by Week of Report - Text description
| Week | Week End | Canada Tests | Coron % |
Atl Tests | Coron % |
QC Tests | Coron % |
ON Tests | Coron % |
Pr Tests | Coron % |
BC Tests | Coron % |
|---|---|---|---|---|---|---|---|---|---|---|---|---|---|
| 35 | 2018-09-01 | 1058 | 0.38 | 35 | 0 | 368 | 0.54 | 82 | 0 | 466 | 0.43 | 96 | 0 |
| 36 | 2018-09-08 | 1149 | 0.17 | 30 | 0 | 393 | 0 | 105 | 0 | 492 | 0.41 | 122 | 0 |
| 37 | 2018-09-15 | 1277 | 0.16 | 36 | 2.78 | 416 | 0 | 65 | 0 | 601 | 0 | 143 | 0 |
| 38 | 2018-09-22 | 1477 | 0.2 | 37 | 0 | 470 | 0 | 130 | 0.77 | 670 | 0.3 | 153 | 0 |
| 39 | 2018-09-29 | 1616 | 0.56 | 60 | 0 | 474 | 0 | 154 | 2.6 | 765 | 0.13 | 150 | 2.67 |
| 40 | 2018-10-06 | 1786 | 0.45 | 46 | 0 | 467 | 1.07 | 170 | 1.76 | 895 | 0 | 201 | 0 |
| 41 | 2018-10-13 | 1841 | 0.38 | 79 | 0 | 500 | 0.6 | 126 | 1.59 | 904 | 0.22 | 202 | 0 |
| 42 | 2018-10-20 | 2005 | 0.35 | 93 | 0 | 480 | 0.21 | 177 | 0.56 | 1049 | 0 | 187 | 2.67 |
| 43 | 2018-10-27 | 2193 | 0.46 | 63 | 0 | 523 | 0.38 | 189 | 0.53 | 1131 | 0.35 | 264 | 0.76 |
| 44 | 2018-11-03 | 2132 | 0.94 | 82 | 0 | 560 | 0.89 | 168 | 1.79 | 1153 | 0.87 | 161 | 1.24 |
| 45 | 2018-11-10 | 2325 | 0.69 | 131 | 0 | 524 | 1.15 | 152 | 1.97 | 1322 | 0.45 | 183 | 0.55 |
| 46 | 2018-11-17 | 2383 | 1.09 | 116 | 0 | 507 | 2.17 | 147 | 1.36 | 1425 | 0.84 | 174 | 0.57 |
| 47 | 2018-11-24 | 2708 | 1.4 | 94 | 0 | 537 | 2.98 | 203 | 1.97 | 1709 | 0.94 | 148 | 1.35 |
| 48 | 2018-12-01 | 3137 | 1.98 | 139 | 0 | 650 | 3.23 | 218 | 5.05 | 1904 | 1.31 | 161 | 3.11 |
| 49 | 2018-12-08 | 3324 | 2.23 | 76 | 0 | 772 | 3.37 | 197 | 8.63 | 2026 | 1.28 | 171 | 2.92 |
| 50 | 2018-12-15 | 3524 | 3.29 | 134 | 0.75 | 762 | 7.22 | 209 | 8.13 | 2157 | 1.85 | 178 | 0.56 |
| 51 | 2018-12-22 | 3684 | 3.83 | 77 | 0 | 819 | 6.96 | 226 | 8.41 | 2235 | 2.68 | 276 | 1.81 |
| 52 | 2018-12-29 | 3207 | 5.18 | 87 | 2.3 | 903 | 6.64 | 209 | 10.53 | 1840 | 4.24 | 149 | 2.68 |
| 1 | 2019-01-05 | 3588 | 5.02 | 140 | 2.14 | 897 | 6.02 | 216 | 6.02 | 2033 | 4.57 | 267 | 6.37 |
| 2 | 2019-01-12 | 3279 | 6.04 | 190 | 1.05 | 1006 | 5.57 | 233 | 7.73 | 1544 | 7.06 | 273 | 4.03 |
| 3 | 2019-01-19 | 2829 | 7.07 | 153 | 5.88 | 790 | 7.47 | 207 | 7.25 | 1379 | 6.74 | 284 | 7.39 |
| 4 | 2019-01-26 | 2698 | 7.23 | 160 | 8.13 | 736 | 4.62 | 208 | 6.25 | 1330 | 7.22 | 237 | 15.19 |
| 5 | 2019-02-02 | 2513 | 8.24 | 162 | 10.49 | 697 | 4.73 | 236 | 3.81 | 1155 | 10.56 | 248 | 10.48 |
| 6 | 2019-02-09 | 2357 | 8.57 | 180 | 11.11 | 630 | 6.19 | 168 | 6.55 | 1156 | 8.65 | 211 | 13.27 |
| 7 | 2019-02-16 | 2235 | 7.65 | 131 | 6.11 | 567 | 4.06 | 197 | 8.63 | 1125 | 8.62 | 188 | 9.57 |
| 8 | 2019-02-23 | 2324 | 7.57 | 145 | 10.34 | 600 | 5.17 | 175 | 4 | 1155 | 7.27 | 228 | 14.47 |
| 9 | 2019-03-02 | 2372 | 8.01 | 134 | 7.46 | 600 | 4.33 | 210 | 4.29 | 1160 | 9.22 | 244 | 13.11 |
| 10 | 2019-03-09 | 2296 | 8.01 | 149 | 6.71 | 608 | 4.28 | 146 | 7.53 | 1075 | 8.47 | 294 | 14.63 |
Page details
- Date modified: