
Appendix A: Participant statistics
Official title: Federal Accessibility Legislation - Technical analysis report
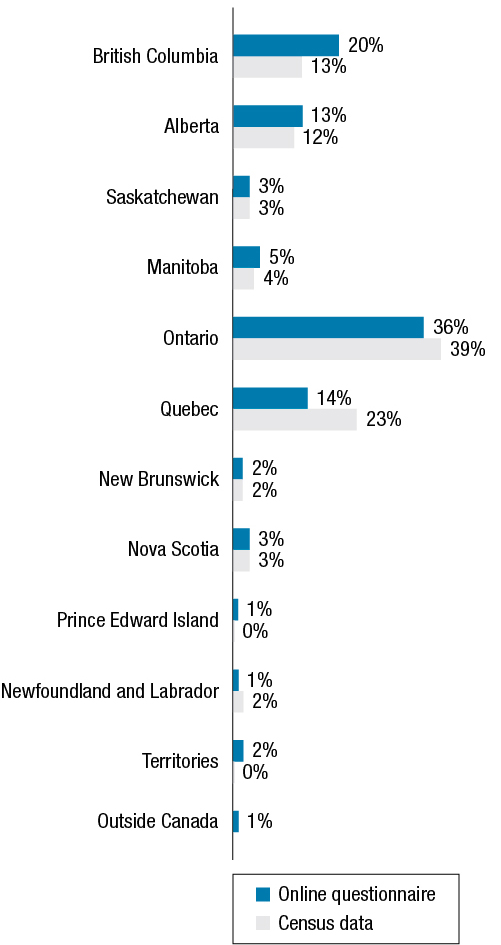
Text description of Figure percentage of respondents from the provinces and territories compared to census data:
| Provinces/Territories | Online questionnaire | Census data |
|---|---|---|
| British Columbia | 20% | 13.10% |
| Alberta | 13% | 11.70% |
| Saskatchewan | 3% | 3.20% |
| Manitoba | 5% | 3.60% |
| Ontario | 36% | 38.50% |
| Quebec | 14% | 22.90% |
| New Brunswick | 2% | 2.10% |
| Nova Scotia | 3% | 2.60% |
| Prince Edward Island | 1% | 0.40% |
| Newfoundland and Labrador | 1% | 1.50% |
| Territories | 2% | 0.30% |
| Outside Canada | 1% | 0.00% |
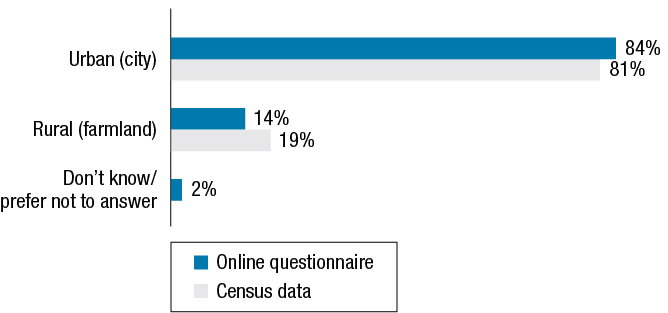
Text description of Figure percentage of respondents from different settings compared to census data:
| Setting | Online questionnaire | Census data |
|---|---|---|
| Urban (city) | 84% | 81% |
| Rural (farmland) | 14% | 19% |
| Don’t know/prefer not to answer | 2% | 0% |

Text description of Figure percentage of respondents from each gender compared to census data:
| Gender | Online questionnaire | Census data |
|---|---|---|
| Female | 69% | 51% |
| Male | 27% | 49% |
| Another gender identity | 2% | 0% |
| Prefer not to answer | 2% | 0% |
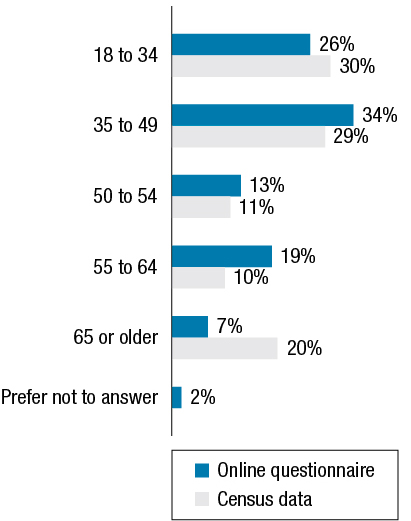
Text description of Figure percentage of respondents in different age brackets compared to census data:
| Age | Online questionnaire | Census data |
|---|---|---|
| 18 to 34 | 26% | 30% |
| 35 to 49 | 34% | 29% |
| 50 to 54 | 13% | 11% |
| 55 to 64 | 19% | 10% |
| 65 or older | 7% | 20% |
| Prefer not to answer | 2% | 0% |
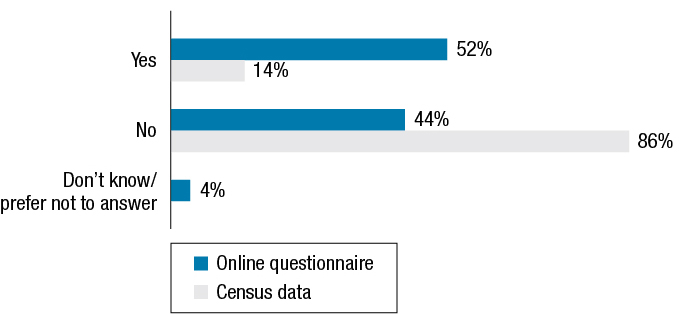
Text description of Figure percentage of respondents in the disability category compared to census data:
| Disability | Online questionnaire | Census data |
|---|---|---|
| Yes | 52% | 14% |
| No | 44% | 86% |
| Don’t know/prefer not to answer | 4% | 0% |

Text description of Figure percentage of respondents to the indigenous people’s category:
| Indigenous peoples | Online questionnaire | Census data |
|---|---|---|
| Yes | 4% | 4% |
| No | 94% | 96% |
| Don’t know/prefer not to answer | 2% | 0% |

Text description of Figure percentage of respondents to the visible minority category compared to census data:
| Visible minority | Online questionnaire | Census data |
|---|---|---|
| Yes | 15% | 19% |
| No | 80% | 81% |
| Don’t know/prefer not to answer | 4% | 0% |
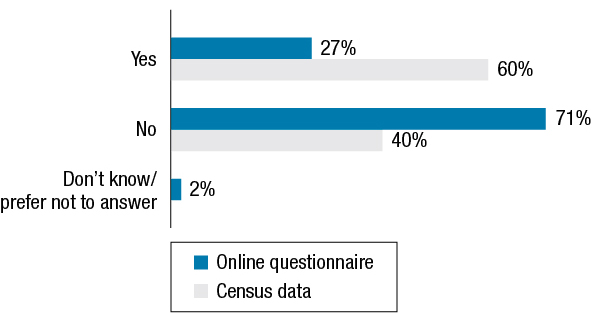
Text description of Figure percentage of respondents to the “Children under the age of 18” category compared to census data:
| Children under the age of 18 | Online questionnaire | Census data |
|---|---|---|
| Yes | 27% | 60% |
| No | 71% | 40% |
| Prefer not to answer | 2% | 0% |

Text description of Figure percentage of respondents to the occupation category:
| Occupation | Online questionnaire |
|---|---|
| Working at a paid job or business | 53% |
| Looking for paid work | 6% |
| Going to school | 9% |
| Caring for children | 3% |
| Household work | 1% |
| Retired | 8% |
| Maternity/Paternity or parental leave | 0% |
| Long-term illness | 9% |
| Volunteering | 3% |
| Providing care to family or friends for a long-term health condition | 2% |
| Don't know / Prefer not to answer | 2% |
| Other (please specify below) | 5% |
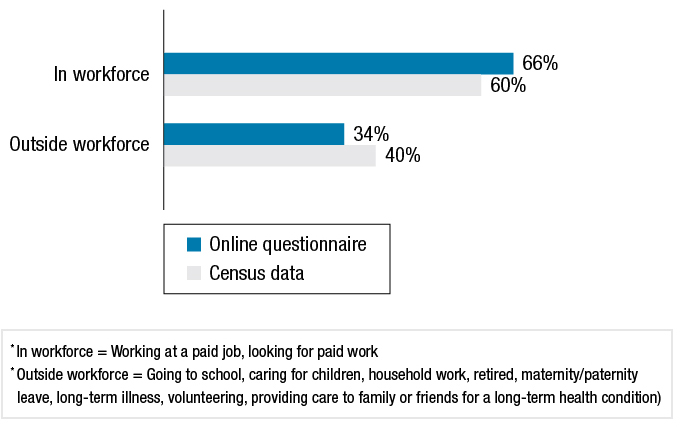
Text description of Figure percentage of respondents to the category of “workforce”:
| Workforce | Census data | Online questionnaire |
|---|---|---|
| Outside workforce | 40% | 34% |
| In workforce | 60% | 66% |
- *In workforce = Working at a paid job, looking for paid work
- *Outside workforce = Going to school, caring for children, household work, retired, maternity/paternity leave, long-term illness, volunteering, providing care to family or friends for a long-term health condition)

Text description of Figure percentage of respondents to the organization profile:
| Organization profile | Online questionnaire |
|---|---|
| Yes | 16% |
| No | 80% |
| Don't know / Prefer not to answer | 4% |

Text description of Figure percentage of respondents to the type of organization:
| Type of organization | % |
|---|---|
| Private sector company or business association | 10% |
| Academic institution | 7% |
| Indigenous organization | 1% |
| Other charitable or not-for-profit organization | 53% |
| Indigenous government | 0% |
| Federal government | 10% |
| Provincial/territorial government | 5% |
| Municipal government | 6% |
| Don’t know/prefer not to answer | 2% |
| Other | 6% |
Page details
- Date modified: