Water withdrawal and consumption by sector
Access PDF (227 KB)
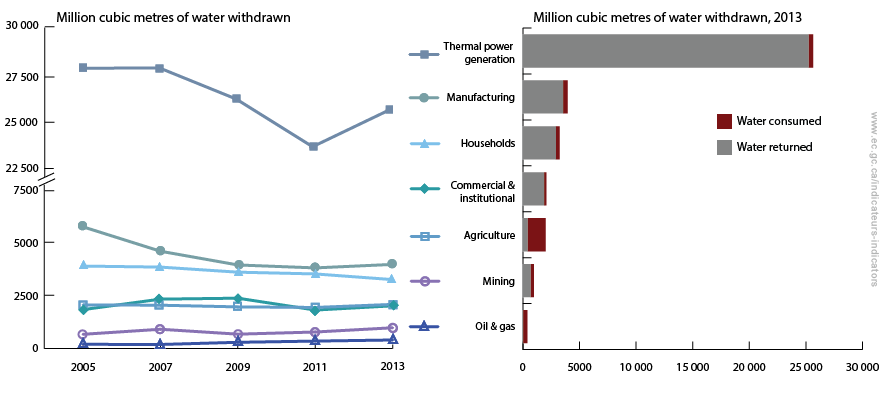
In 2013, approximately 38 300 million cubic metres of water were withdrawn from Canada's rivers, lakes, groundwater and oceans. The thermal power generation industry withdrew the most water, which was used for cooling and to produce steam to drive the turbines that generate electricity. Thermal power generation is followed by the manufacturing, households, commercial and institutional, agriculture, mining and oil and gas sectors. The majority of the water withdrawn is circulated back into the water body from which it was taken.
Total water withdrawal declined from 42 200 million cubic metres of water in 2005 to 38 300 million cubic metres in 2013. The substantial drop in water withdrawal is related, in part, to a decrease in manufacturing production between 2005 and 2013,Footnote [1] which resulted in the manufacturing sector withdrawing 31% and consuming 37% less water in 2013 than in 2005.
In 2013, approximately 3600 million cubic metres of water were consumed or were not returned to the original source. Agriculture consumed 1600 million cubic metres, or 80%, of the water withdrawn from water sources.
Between 2005 and 2013, water consumption decreased slightly from 3700 million cubic metres to 3600 million cubic metres. Households and thermal power generation experienced reductions in consumption of 16% and 45%, respectively, over the same period.
Water withdrawal by sector, Canada, 2005 to 2013

Long description
The graph displays two charts side by side. The line chart shows the estimated volume (in million cubic metres) of water withdrawn by the thermal power generation, manufacturing, households, commercial and institutional, agriculture, mining, and oil and gas sectors every two years from 2005 to 2013. The stacked bar chart shows the volume of water withdrawn (in million cubic metres) by each of those seven sectors in Canada in 2013. Of the water withdrawn by each sector, the volume of water returned to the environment is displayed, along with the volume consumed, or not returned to the original source.
Data for this chart
| Sector | Year | Volume of water withdrawn (million cubic metres) |
Volume of water consumed (million cubic metres) |
Volume of water returned (million cubic metres) |
|---|---|---|---|---|
| Thermal power generation | 2005 | 27 825 | 716 | 27 109 |
| Thermal power generation | 2007 | 27 834 | 522 | 27 313 |
| Thermal power generation | 2009 | 26 214 | 484 | 25 729 |
| Thermal power generation | 2011 | 23 716 | 412 | 23 304 |
| Thermal power generation | 2013 | 25 635 | 397 | 25 239 |
| Manufacturing | 2005 | 5719 | 650 | 5069 |
| Manufacturing | 2007 | 4573 | 452 | 4122 |
| Manufacturing | 2009 | 3927 | 367 | 3561 |
| Manufacturing | 2011 | 3790 | 448 | 3342 |
| Manufacturing | 2013 | 3954 | 411 | 3543 |
| Households | 2005 | 3875 | 388 | 3488 |
| Households | 2007 | 3827 | 383 | 3445 |
| Households | 2009 | 3589 | 359 | 3230 |
| Households | 2011 | 3506 | 351 | 3156 |
| Households | 2013 | 3239 | 324 | 2915 |
| Commercial and institutional | 2005 | 2053 | 205 | 1847 |
| Commercial and institutional | 2007 | 2036 | 204 | 1832 |
| Commercial and institutional | 2009 | 1957 | 196 | 1762 |
| Commercial and institutional | 2011 | 1930 | 193 | 1737 |
| Commercial and institutional | 2013 | 2074 | 207 | 1867 |
| Agriculture | 2005 | 1829 | 1536 | 293 |
| Agriculture | 2007 | 2322 | 1950 | 371 |
| Agriculture | 2009 | 2366 | 1988 | 379 |
| Agriculture | 2011 | 1809 | 1519 | 289 |
| Agriculture | 2013 | 2007 | 1600 | 407 |
| Mining | 2005 | 669 | 44 | 624 |
| Mining | 2007 | 906 | 151 | 755 |
| Mining | 2009 | 675 | 98 | 578 |
| Mining | 2011 | 776 | 144 | 632 |
| Mining | 2013 | 976 | 300 | 675 |
| Oil and gas | 2005 | 198 | 188 | 10 |
| Oil and gas | 2007 | 190 | 181 | 10 |
| Oil and gas | 2009 | 293 | 278 | 15 |
| Oil and gas | 2011 | 349 | 332 | 17 |
| Oil and gas | 2013 | 402 | 382 | 20 |
Note: Totals may not add up due to rounding.
Download data file (Excel/CSV; 1.61 KB)
Note: The indicator reports estimates of water withdrawal and consumption by each sector. Refer to the Data Sources and Methods document for more details.
Source: Statistics Canada (2012) CANSIM Table 153-0101 - Water use in Canada, by sector, every 2 years, CANSIM database. Statistics Canada (2015) CANSIM Table 153-0116 - Physical flow account for water use, every 2 years, CANSIM database. Statistics Canada (2015) Industrial Water Survey 2013.
Water consumption refers to water withdrawn but not returned to its original source. In producing food for Canadians, the agriculture sector in British Columbia, Alberta and Saskatchewan consume the most water overall. In the British Columbia interior and the Prairies, irrigation systems are widely used to improve crop yields because the amount of water in this region is naturally low. Very little of the water used for irrigation is returned directly to its source. The oil and gas sector is also a large consumer of water. Approximately 95% of the water withdrawn is consumed; however, water is recycled and reused wherever possible, avoiding additional withdrawals from surface water and groundwater sources.Footnote [2]
Related indicators
Other information
Access PDF (227 KB)
Page details
- Date modified: