
Screening assessment triclocarban
Official title: Screening Assessment - Urea, N-(4-chlorophenyl)-N'-(3,4-dichlorophenyl)- (Triclocarban)
Chemical Abstracts Service Registry Number: 101-20-2
Environment and Climate Change Canada
Health Canada
March 2023
Cat. No.: En84-317/2022E-PDF
ISBN 978-0-660-45318-7

Synopsis
Pursuant to section 74 of the Canadian Environmental Protection Act, 1999 (CEPA), the Minister of the Environment and the Minister of Health have conducted a screening assessment of urea, N-(4-chlorophenyl)-N'-(3,4-dichlorophenyl)-, hereinafter referred to as triclocarban. The Chemical Abstracts Service Registry Number (CAS RNFootnote 1) for triclocarban is 101-20-2.
According to information submitted in response to CEPA section 71 surveys, triclocarban was reported to be imported into Canada in volumes in the range of 10 000 kg to 100 000 kg and 1000 kg to 10 000 kg in 2008 and 2015, respectively, but was not reported to be manufactured in Canada above the reporting threshold of 100 kg. Triclocarban is used in Canada in products available to consumers, including in a limited number of cosmetics such as bar soaps and facial cleansers.
The ecological risk of triclocarban was characterized using the ecological risk classification of organic substances (ERC), which is a risk-based approach that employs multiple metrics for both hazard and exposure, with weighted consideration of multiple lines of evidence for determining risk classification. Hazard profiles are based principally on metrics regarding mode of toxic action, chemical reactivity, food web-derived internal toxicity thresholds, bioavailability, and chemical and biological activity. Metrics considered in the exposure profiles include potential emission rate, overall persistence, and long-range transport potential. A risk matrix is used to assign a low, moderate or high level of potential concern for substances on the basis of their hazard and exposure profiles. The ERC approach resulted in an exposure classification of low for triclocarban, based on its reported use patterns, and in a hazard classification of moderate. As this substance is known to possess antibacterial properties, its hazard classification was reviewed using a broader set of data than is considered under the initial ERC analysis. On the basis of this additional analysis, triclocarban is considered to have a high hazard based on its inherent toxicity in aquatic organisms and its high potential for bioaccumulation in aquatic invertebrates. However, due to its limited exposure potential, triclocarban is considered unlikely to be causing ecological harm.
Considering all available lines of evidence presented in this screening assessment, there is a low risk of harm to the environment from triclocarban. It is concluded that triclocarban does not meet the criteria under paragraph 64(a) or (b) of CEPA, as it is not entering the environment in a quantity or concentration or under conditions that have or may have an immediate or long-term harmful effect on the environment or its biological diversity or that constitute or may constitute a danger to the environment on which life depends.
The critical health effect identified for triclocarban was reduced absolute and relative organ weight (spleen, kidneys, liver, adrenal, heart, and pituitary) with changes in organ histology in animal studies. Triclocarban exposure also produced effects on fecal microbial diversity, body weight, and organ weight in repeated-dose studies. Effects on male reproductive tissues, reproduction, live births, reduced rat pup body weight, and reduced pup survival were observed in animal studies. Canadians are mainly exposed to triclocarban via the use of cosmetics as well as from food and environmental sources (drinking water, soil, and house dust). Canadian biomonitoring data indicated that the majority of the population has a low exposure to triclocarban. Margins of exposure were considered adequate to address uncertainties in the health effects and exposure databases.
Considering all the information presented in this screening assessment, it is concluded that triclocarban does not meet the criteria under paragraph 64(c) of CEPA, as it is not entering the environment in a quantity or concentration or under conditions that constitute or may constitute a danger in Canada to human life or health.
It is therefore concluded that triclocarban does not meet any of the criteria set out in section 64 of CEPA.
1. Introduction
Pursuant to section 74 of the Canadian Environmental Protection Act, 1999 (CEPA) (Canada 1999), the Minister of the Environment and the Minister of Health have conducted a screening assessment of triclocarban to determine whether this substance presents or may present a risk to the environment or to human health. This substance was identified as a priority for assessment under the Chemicals Management Plan (CMP) as it met categorization criteria under subsection 73(1) of CEPA (ECCC, HC [modified 2017]).
The ecological risk of triclocarban was characterized using the ecological risk classification of organic substances (ERC) approach (ECCC 2016a). The ERC describes the hazard of a substance using key metrics including mode of action, chemical reactivity, food-web derived internal toxicity thresholds, bioavailability, and chemical and biological activity, and considers the possible exposure of organisms in the aquatic and terrestrial environments on the basis of such factors as potential emission rates, overall persistence, and long-range transport potential in air. These various lines of evidence are combined to identify substances as warranting further evaluation of their potential to cause harm to the environment or as having a low likelihood of causing harm to the environment.
This screening assessment includes consideration of information on chemical properties, environmental fate, hazards, uses, and exposures, including additional information submitted by stakeholders. Relevant data were identified from literature searches conducted up to October 2018, with targeted searches up to November 2020. Empirical data from key studies, as well as results from models were used to reach conclusions. When available and relevant, information presented in assessments from other jurisdictions was considered.
This screening assessment was prepared by staff in the CEPA Risk Assessment Program at Health Canada and Environment and Climate Change Canada, and incorporates input from other programs within these departments. The human health portion of this screening assessment has undergone external review and/or consultation. Comments on the technical portions relevant to human health were received from Dr. R.S. Prosser (University of Guelph, Canada), Dr. Hongbo Ma (University of Wisconsin, United States [US]), Dr. Ndeke Musee (University of Pretoria, South Africa), and Dr. Rolf Halden (Arizona State University, US). The ecological portion of this screening assessment is based on the ERC document (published July 30, 2016), which was subject to an external review as well as a 60-day public comment period. Additionally, the draft of this screening assessment (published October 10, 2020) was subject to a 60-day public comment period. While external comments were taken into consideration, the final content and outcome of this screening assessment remain the responsibility of Health Canada and Environment and Climate Change Canada.
This screening assessment focuses on information critical to determining whether the substance meets the criteria as set out in section 64 of CEPA by examining scientific information and incorporating a weight-of-evidence approach and precaution.Footnote 2 This screening assessment presents the critical information and considerations on which the conclusion is based.
2. Substance identity
The Chemical Abstracts Service Registry Number (CAS RN), Domestic Substances List (DSL) name and common name for triclocarban are presented in Table 2‑1.
| CAS RN | DSL name (common name) | Chemical structure and molecular formula | Molecular weight (g/mol) |
|---|---|---|---|
| 101-20-2 | Urea, N-(4-chlorophenyl)-N'-(3,4-dichlorophenyl)- (Triclocarban) | 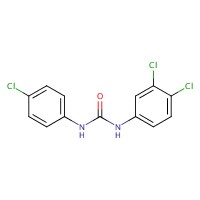 C13H9Cl3N2O
 | 315.59 |
Synonyms: 1-(3',4'-Dichlorophenyl)-3-(4'-chlorophenyl)urea; 3,4,4'-Trichlorocarbanilide; 3,4,4'-Trichlorodiphenylurea; Carbanilide, 3,4,4'-trichloro-; N-(3,4-Dichlorophenyl)-N'-(4-chlorophenyl)urea; N-(4-Chlorophenyl)-N'-(3,4-dichlorophenyl)urea; Trichlocarban; Triclocarbanum(ChemIDplus 1993-).
Triclocarban is a carbanilide composed of mono- and di-chlorinated benzene rings linked by urea (also known as carbamide).
3. Physical and chemical properties
A summary of physical and chemical property data of triclocarban are presented in Table 3‑1. Additional physical and chemical properties are reported in ECCC (2016b).
| Property | Value | Data type | Key reference |
|---|---|---|---|
| Physical state | Solid | Experimental | O’Neil 2013 |
| Melting point (°C) | 255.6°C | Experimental | Bradley et al. 2014 |
| Vapour pressure (Pa, 25°C) | 4.8 x10⁻⁷ | Modelled | PubChem 2004- |
| Henry’s law constant (Pa m3/mol) | 4.6 x 10⁻⁶ | Modelled | PubChem 2004- |
| Water solubility (mg/L, 25°C) | 0.62 | Experimental | ECHA c2007-2017 |
| Log Kow (dimensionless) | 3.63 | Experimental | ECHA c2007-2017 |
| pKa (dimensionless, 20°C) | 12.7 | Experimental | PubChem 2004- |
Abbreviations: Kow, octanol-water partition coefficient; pKa, acid dissociation constant
4. Sources and uses
Triclocarban was included in surveys issued pursuant to section 71 of CEPA (Canada 2009, 2017Footnote 3). Triclocarban was not reported to be manufactured in Canada above the reporting threshold of 100 kg in the reporting years of 2008 and 2015. Respondents reported importing quantities of 10 000 to 100 000 kg and 1000 to 10 000 kg of triclocarban into Canada in 2008 and 2015, respectively. Triclocarban was reported to be used in personal care products in Canada as an antibacterial agent to prevent body odour (Canada 2009, 2017).
Triclocarban is listed in the Natural Health Products Ingredients Database a non-natural health product since it is not a naturally occurring substance included in Schedule 1 to the Natural Health Products Regulations, and is not listed in the Licensed Natural Health Products Database as being present in natural health products in Canada (NHPID [modified 2021]; LNHPD [modified 2021]). Triclocarban is not used in any currently marketed drug products for human use as per the listing in the Drug Product Database (personal communication, email from the Natural and Non-prescription Health Products Directorate, Health Canada, to the Safe Environments Directorate, Health Canada, dated February 2, 2022; unreferenced). Triclocarban is not a food additive, incidental additive, or component used to manufacture food packaging materials (personal communication, email from the Food Directorate, Health Canada, to the Consumer and Hazardous Products Safety Directorate, Health Canada, dated August 31, 2018; unreferenced). Triclocarban is not an active ingredient or formulant in registered pest control products (personal communication, email from the Pest Management Regulatory Agency, Health Canada, to the Consumer and Hazardous Products Safety Directorate, Health Canada, dated August 31, 2018; unreferenced).
Triclocarban is not currently listed on the Cosmetic Ingredient Hotlist (Health Canada [modified 2019]). Based on notifications submitted under the Cosmetic Regulations to Health Canada between December 2015 and December 2018, triclocarban is used in Canada in a limited number of cosmetic products, including in bar soaps and facial cleansers (internal data, Consumer and Hazardous Products Safety Directorate, Health Canada, dated January 7, 2019; unreferenced).
Triclocarban is listed in the Personal Care Products Council’s Cosmetic Ingredient Identification Database with the reported functions of cosmetic biocide, deodorant agent, and preservative and is reported to be usedin bath oils, tablets and salts, bath soaps and detergent, cleansing products, deodorants, and powders (PCPC 2018).
Triclocarban has been identified in Europe in product categories including air care products, coatings and paints, thinners, paint removers, fillers, putties, plasters, modelling clay, finger paints, ink and toners, pharmaceuticals, and washing and cleaning products (CoRAP 2018). Triclocarban was not identified in these or in other products available to consumers in Canada, other than those described above.
In Europe, the percentage of triclocarban in cosmetics is restricted to less than 1.5% in rinse-off products when used for purposes other than as a preservative (Annex III/100, EC 2018a) and to no more than 0.2% in cosmetics when used as a preservative (Annex V/23, EC 2018b). The United States Food and Drug Administration (US FDA) has published a final rule stating that triclocarban (and 18 other active ingredients) is not generally recognized as safe or effective in consumer antiseptic washes (hand and body) based on a lack of data supporting safety and efficacy in this context (US FDA 2016).
5. Potential to cause ecological harm
5.1 Characterization of ecological risk
The ecological risk of triclocarban was characterized using the ERC approach (ECCC 2016a). The ERC is a risk-based prioritization approach that considers multiple metrics for both hazard and exposure, with weighted consideration of multiple lines of evidence for determining risk classification. The various lines of evidence are combined to discriminate between substances of lower or higher potency and lower or higher potential for exposure in various media. This approach reduces the overall uncertainty with risk characterization compared to an approach that relies on a single metric in a single medium (e.g., median lethal concentration) for characterization.
Data on physical-chemical properties, fate (chemical half-lives in various media and biota, partition coefficients, and fish bioconcentration), acute fish ecotoxicity, and chemical import or manufacture volume in Canada were collected from the scientific literature, from available empirical databases (e.g., OECD QSAR Toolbox 2014), from responses to surveys issued pursuant to section 71 of CEPA, or they were generated using selected (quantitative) structure-activity relationship ([Q]SAR) or mass-balance fate and bioaccumulation models. These data were used as inputs to other mass-balance models or to complete the substance hazard and exposure profiles.
Hazard profiles were based principally on metrics regarding mode of toxic action, chemical reactivity, food web-derived internal toxicity thresholds, bioavailability, and chemical and biological activity. Exposure profiles were also based on multiple metrics, including potential emission rate, overall persistence, and long-range transport potential. Hazard and exposure profiles were compared to decision criteria in order to classify the hazard and exposure potentials for each organic substance as low, moderate or high. Additional rules were applied (e.g., classification consistency, margin of exposure) to refine the preliminary classifications of hazard or exposure.
A risk matrix was used to assign a low, moderate or high classification of potential risk for each substance on the basis of its hazard and exposure classifications. ERC classifications of potential risk were verified using a two-step approach. The first step adjusted the risk classification outcomes from moderate or high to low for substances that had a low estimated rate of emission to water after wastewater treatment, representing a low potential for exposure. The second step reviewed low risk potential classification outcomes using relatively conservative, local-scale (i.e., in the area immediately surrounding a point source of discharge) risk scenarios, designed to be protective of the environment, to determine whether the classification of potential risk should be increased.
ERC uses a weighted approach to minimize the potential for both over- and under- classification of hazard and exposure, and of subsequent risk. The balanced approaches for dealing with uncertainties are described in greater detail in ECCC (2016a). The following describes two of the more substantial areas of uncertainty. Error with empirical or modelled acute toxicity values could result in changes in classification of hazard, particularly metrics relying on tissue residue values (i.e., mode of toxic action), many of which are predicted values derived using (Q)SAR models (OECD QSAR Toolbox 2014). However, the impact of this error is mitigated by the fact that overestimation of median lethality will result in a conservative (protective) tissue residue value used for critical body residue analysis. Error with underestimation of acute toxicity will be mitigated through the use of other hazard metrics, such as structural profiling of mode of action, reactivity and/or estrogen-binding affinity. Changes or errors in chemical quantity could result in differences in classification of exposure, as the exposure and risk classifications are highly sensitive to emission rate and use quantity. The ERC classifications thus reflect exposure and risk in Canada on the basis of what is estimated to be the current use quantity and may not reflect future trends.
Critical data and considerations used to develop the substance-specific profiles for triclocarban and the hazard, exposure and risk classification results are presented in ECCC (2016b).
According to the information considered under ERC, triclocarban was classified as having a low exposure potential. Triclocarban was also classified as having a moderate hazard potential due to its moderate potential to cause adverse effects in aquatic food webs, given its bioaccumulation potential and elevated toxicity ratio. Based on this combination, triclocarban was classified as having a low potential for ecological risk.
Available use pattern and environmental monitoring data support the low exposure potential ERC classification. Because the number of uses of triclocarban in consumer and commercial applications (see section 4 - Sources and Uses) is limited, releases of triclocarban from products available to consumers via wastewater into Canadian freshwater aquatic ecosystems is likely to be dispersive, resulting in low exposure to aquatic organisms. Available measured Canadian surface water data indicate that triclocarban concentrations are below the reported detection limit of 0.006 µg/L (Garcia-Ac et al. 2009), which supports the classification result of low exposure potential to aquatic wildlife. Triclocarban can also be released onto Canadian agricultural soils where biosolids are applied. Available studies indicate that pure triclocarban applied to soil biodegrades slowly (Ying et al. 2007), but degradation could be potentiated with bioaugmentation (a bioremediation technique that enhances contaminant degradation by adding microbial cultures) (Mulla et al. 2016; Yun et al. 2017; Sipahutar and Vangnai 2017; Sipahutar et al. 2018). Furthermore, biosolids-borne triclocarban degrades even more slowly (Lozano et al. 2018; Snyder et al. 2010), and biodegradation may be hindered by limited bioavailability when applied to fields (Kwon and Xia 2012). In addition, available studies show that biosolids-borne triclocarban may have low bioavailability (Snyder et al. 2010; Higgins et al. 2011; Macherius et al. 2014; Walters et al. 2010) and low food-web bioaccumulation in terrestrial organisms, such as earthworms and birds (Appendix A, Table A-2).
The moderate hazard potential of triclocarban was determined by the classification rules applied under ERC, specifically those associated with the aquatic hazard assessment factor (HAF)Footnote 4 and bioavailability. However, because triclocarban is known to possess antibacterial properties with a potentially higher hazard profile, an additional ecological hazard characterization was conducted, which used a broader set of data than was considered under the ERC approach.
Empirical toxicity data suggest a high hazard (rather than a moderate hazard) potential for aquatic species, particularly for aquatic invertebrates (LC50 toxicity values range from 6.896 µg/L to 910 µg/L; EC50 toxicity values range from 0.209 µg/L to 295 µg/L; Appendix A, Table A-1). Empirical bioaccumulation data also suggest a high potential for bioaccumulation in aquatic invertebrates, particularly in daphnids (bioconcentration factor/bioaccumulation factor [BCF/BAF]: 1240 to 82 900) and bivalves (BCF/BAF: 7943 to 45 538) (Appendix A, Table A-2), two categories of organisms that were not accounted for in the metrics considered under the ERC approach.
Given this additional information, the hazard posed by triclocarban is likely greater than predicted based on the metrics considered under ERC. While current levels of triclocarban exposure in the Canadian environment are unlikely to be of concern, triclocarban is considered to have a high hazard potential based on its inherent toxicity to aquatic species and its high potential for bioaccumulation in aquatic invertebrates. As such, there may be a concern for the Canadian environment should exposures increase.
6. Potential to cause harm to human health
6.1 Exposure assessment
6.1.1 Environmental media and food
Environmental media
Environmental media studies have measured triclocarban in drinking water, soil, and house dust. In the National Survey of Disinfection By-Products and Selected New and Emerging Contaminants in Canadian Drinking Water (2009-2010) (Tugulea 2016), Health Canada analyzed 65 drinking water treatment systems across Canada. Triclocarban levels in both treated and untreated water sourced from well water, river water, or lake water were below the minimum detection level (4 ng/L) in 92% of the available sampling sites. Where detected (in four samples), levels found in well water ranged from 9.2 ng/L to 29.3 ng/L in untreated samples and from 109.9 ng/L to 160.5 ng/L in treated samples, with 160.5 ng/L being the highest level found in all samples. These data indicate that triclocarban levels may be higher in treated water than untreated; the reasons for this are unclear (Tugulea 2016). Triclocarban was below the limit of detection (LOD) in a study of drinking water in three boroughs of Montreal, Quebec (LOD = 3 ng/L; Garcia-Ac et al. 2009). Triclocarban was not detected in drinking water in an early monitoring study in 12 metropolitan areas in the US (LOD = 10 ng/L; Monsanto 1980); however, this study may predate modern practices and had a higher LOD. In a more recent study, triclocarban was detected in Spain in mineral water and tap water at 53 and 56 ng/L, respectively (limit of quantification [LOQ] = 0.1 ng/L; Carmona et al. 2014).
Triclocarban has been measured in agricultural soil after application of biosolids. Reported concentrations vary widely by location, potentially due to the extent of prior biosolid application or background levels of contamination. In Quebec, Canada, soil samples from two regions that had received 12 and 11 applications of municipal biosolids between 1991 and 2006 had mean triclocarban concentrations of 53 and 13 ng/g, respectively (Viglino et al. 2011). In the mid-Atlantic region and Northern Virginia, US, fields that had received a single application of biosolids over the last 3 to 13 years had a mean triclocarban concentration of 107.1 ng/g (dry weight). Fields that had received multiple applications in the same time period had a slightly higher mean of 131.9 ng/g (dry) (Lozano et al. 2018). In Illinois, fields in which biosolids had been applied for 33 years had a maximum triclocarban concentration of 1251 ng/g (dry), and soil in control plots had a maximum of 744 ng/g (dry; Xia et al. 2010).
Canadian environmental monitoring data were not identified for triclocarban in house dust. A median concentration of 200 ng/g triclocarban was reported in a study of dust samples from a mixed-use athletic and educational facility in the US (Hartmann et al. 2016). A study of dust samples from 19 athletic facilities and 27 single-family detached homes in Oregon reported a mean concentration of 497 ng/g and a maximum concentration of 9760 ng/g triclocarban (Chen et al. 2018).
Environmental monitoring studies for triclocarban in indoor and outdoor air were not identified. Given that triclocarban has a low vapour pressure, it is not expected to partition to air.
Food
It has been reported in various countries, including Canada and the US, that the agricultural use of municipal biosolids and reclaimed wastewater contains triclocarban from its use in products available to consumers. Both biosolids and reclaimed wastewater may be potential sources of triclocarban in foods (AGDH 2017; SCCP 2005; US EPA 2002, 2009).
Available studies from the scientific literature primarily of controlled trials estimating the uptake of triclocarban by edible plants from amended soils or reclaimed wastewater in which the plants were grown, or modelling studies estimating expected concentrations in animal products derived from animals consuming such edible plants. However, because these studies are limited to experimental trials or modelling and did not directly measure concentrations occurring in retail food, they were considered inappropriate for use in generating exposure estimates. The only measured concentrations of triclocarban in retail foods identified, in Canada or elsewhere, were samples of leafy and root vegetables purchased from a market in Spain (Aparicio et al. 2018), all of which contained detectable concentrations of triclocarban. For the purpose of this exposure assessment, the maximum reported concentration of triclocarban in lettuce, reported by Aparicio et al. (2018) was14.6 ppb (ng/g dry matter) and calculated to be 0.79 ppb on a wet weight basis, was conservatively assumed to represent all foods within the broad 'vegetable' category.
The single-day 'eaters only' food consumption rate for the 'vegetables' category, from Health Canada’s Food Consumption Table based on the 2004 Canadian Community Health Survey (CCHS), was used for children aged 6 months to 3 years old (Health Canada 2015), and consumption data from the Food Consumption Table based on the 2015 CCHS were employed for all other age groupsFootnote 5 (Health Canada 2018b). Dietary exposure to triclocarban was conservatively estimated by multiplying the maximum concentration of triclocarban in lettuce, described above, with the mean and 90th percentile consumption rates for vegetables from the CCHS surveys. Mean and 90th percentile exposure estimates from food ranged from 2.31 ng/kg bw/day to 6.84 ng/kg bw/day and from 4.69 ng/kg bw/day to 13.71 ng/kg bw/day, respectively (personal communication, email from the Food Directorate, Health Canada, to the Consumer and Hazardous Products Safety Directorate, Health Canada, dated March 5, 2019; unreferenced).
Triclocarban was not detected in human milk (n = 56, LOD = 0.86 µg/L) in a regional Ottawa studythat is part of the Plastics and Personal-care Products use in Pregnancy (P4) study (Arbuckle et al. 2015). Exposures from human milk feeding were estimated using the LOD from this study as a conservative approach and were included in the human daily intake value described below for human milk-fed infants.
Considering all identified sources of exposure from environmental media and food, estimates of human daily intake range from 7.8 ng/kg bw/day for adolescents (aged 14 to 18 years) to 113.8 ng/kg bw/day for human milk-fed infants (0 to 5 months).
Table B‑1 in Appendix B summarizes the potential intake of triclocarban from environmental media and food.
6.1.2 Biomonitoring
Total triclocarban in urine provides a measure of integrated exposure for individuals, from all routes of exposure and all sources (including environmental media, diet, and daily use products). In human studies, 27% of the ingested dose was excreted in urine over 3 days after oral exposure; triclocarban (free and metabolites) can be detected in urine after dermal exposure as well (Hiles and Birch 1978a; Scharpf et al. 1975; Schebb et al. 2011b). Elimination following oral dosing is biphasic, with half-lives of 2.4 and 20 hours (Hiles and Birch 1978a). Elimination after dermal exposure is monophasic, with a half-life of 8 to 10 hours (Scharpf et al. 1975). The primary metabolites of triclocarban detected in urine are glucuronidated forms of either triclocarban or hydroxylated triclocarban (2’- or 3’-hydroxytriclocarban). Total triclocarban is detected after enzymatic deconjugation and acid hydrolysis; free triclocarban is rarely detected in human urine (Birch et al. 1978; Ye et al. 2011; Zhou et al. 2012). See section 6.2.1 for further details of triclocarban metabolism and excretion.
Triclocarban was measured in Cycle 2 (2009-2011) of the Canadian Health Measures Survey (CHMS). In this study, total triclocarban was detected in urine after enzymatic deconjugation and acid hydrolysis. Triclocarban was detected in less than 4% of a nationally representative sample of 2549 Canadians, aged 3 to 79 years (LOD = 1 µg/L). The 95th percentile was less than the LOD in all age groups including children, with the exception of the 40 to 59-years age group, which was not reported due to high variation (Health Canada 2013). Total triclocarban was detected in only 4% of urine samples (LOD = 1.1 µg/L) from pregnant women (n = 80) in a regional Ottawa study that is part of the P4 Study (Arbuckle et al. 2015).
Total triclocarban (after enzymatic deconjugation and acid hydrolysis) was detected in 37% of urine samples (LOD = 0.1 µg/L) taken from the general population aged 6 years and over in the US National Health and Nutrition Examination Survey (NHANES, n = 2686) in 2013-2014, with a 95th percentile value of 13.4 µg/L and a maximum value of 588 µg/L (Ye et al. 2016). The difference in concentration at the 95th percentile between the US and Canadian populations suggests more widespread or heavier use of triclocarban in the US population. However, the lower frequency of detection in Canada may be partly attributed to the lower LOD in the NHANES as compared to the CHMS. The highest reported detection rate identified for triclocarban in urine was >99% in a group of 209 healthy adult volunteers in China (LOD = 0.005 µg/L). The maximum value reported in this study was 192 µg/L (Yin et al. 2016).
Triclocarban was detected in 22% of urine samples from children in the NHANES in 2013-2014, compared to 37% in adults, with a 95th percentile urinary concentration of 0.9 µg/L in children (Ye et al. 2016). However, in a smaller US study (n = 181), triclocarban was detected in 37% of urine samples (LOD = 0.1 µg/L) from children aged 3 to 6 years, with a maximum reported value of 8.5 µg/L (Hoffman et al. 2018). Worldwide, triclocarban detection frequency in children’s urine was 28% in Denmark (ages 6 to 11 years, LOD = 0.01 µg/L), undetected in Germany (LOQ = 1.0 µg/L), and up to 70% in Brazil (6 to 14 years, LOD = 0.004 µg/L) (Frederiksen et al. 2013; Moos et al. 2014; Rocha et al. 2018a, 2018b). The maximum measured concentrations were 1.0 µg/L in Denmark and 0.94 µg/L in Brazil (Frederiksen et al. 2013; Rocha et al. 2018a).
Triclocarban was detected in umbilical cord blood in 22% of samples from 33 neonates in the US (LOD not reported) and in 65% of 92 Chinese neonates (LOD = 0.002 µg/L) (Pycke et al. 2014; Wei et al. 2017). The maximum reported concentration in the latter study was 0.82 µg/L. Triclocarban was neither detected in meconium (n = 54, LOD = 0.53 ng/g) or human milk (n = 56, LOD = 0.86 µg/L) samples in the P4 study, nor was it detected in human milk samples (n = 20, LOD = 1.2 µg/L) in a US study (Arbuckle et al. 2015; Ye et al. 2006).
Estimated daily intakes of triclocarban were derived based on biomonitoring data from the CHMS and NHANES studies (Health Canada 2013; Ye et al. 2006). In a study of human pharmacokinetics, in response to oral exposure to triclocarban, human volunteers (n = 6 males, aged 20 to 40 years) were administered a single dose of 2.2 µmol of 14C-labelled triclocarban per kg bw (Hiles and Birch1978a). Triclocarban was absorbed rapidly, and a maximum plasma level of 3.7 nmol/g was achieved in less than 3 hours. Twenty-seven percent of the applied dose was excreted in urine over 80 hours. Since the metabolism of triclocarban does not result in breaking the basic structure, the recovery of 14C-label in the urine is a reliable estimate of excretion of the original dose by this route and can be considered a specific biomarker. The CHMS and NHANES biomonitoring studies detected total triclocarban in urine after acid hydrolysis and enzyme deconjugation, which is considered a specific measure of triclocarban (Health Canada 2013; Ye et al. 2006).
Estimated daily intakes were derived from the 95th percentile values from the CHMS and NHANES studies using a fractional urinary excretion value of 27%, based on Hiles and Birch (1978a). The 95th percentile concentrations reported by the CHMS were below the LOD, and a value of 1.0 µg/L was used as a conservative estimate of urinary concentration. See Appendix C for further details on the default values and models used to calculate estimated daily intakes. Estimated daily intakes based on Canadian biomonitoring data range from 0.07 to 0.11 µg/kg bw/day. Intakes are presented in Table 6‑1.
| Source | Age group (y) | UC or UCCr, P95 | FUE |
Estimated daily intake (mg/kg bw/day) |
|---|---|---|---|---|
|
CHMS Cycle 2, 2009-2011 (Health Canada 2013) |
3 to 5 | 1.0 µg/L | 0.27 | 0.00011 |
|
CHMS Cycle 2, 2009-2011 (Health Canada 2013) |
6 to 11 | 1.0 µg/L | 0.27 | 0.000093 |
|
CHMS Cycle 2, 2009-2011 (Health Canada 2013) |
12 to 19 | 1.0 µg/L | 0.27 | 0.000074 |
|
CHMS Cycle 2, 2009-2011 (Health Canada 2013) |
20 to 39 | 1.0 µg/L | 0.27 | 0.000074 |
|
CHMS Cycle 2, 2009-2011 (Health Canada 2013) |
40 to 59 | 1.0 µg/L | 0.27 | 0.000074 |
|
CHMS Cycle 2, 2009-2011 (Health Canada 2013) |
60 to 79 | 1.0 µg/L | 0.27 | 0.000074 |
|
NHANES, 2013-2014 (Ye et al. 2006) |
6 to 11 | 0.778 µg/g Cr | 0.27 | 0.000033 |
|
NHANES, 2013-2014 (Ye et al. 2006) |
12 to 19 | 1.97 µg/g Cr | 0.27 | 0.00015 |
|
NHANES, 2013-2014 (Ye et al. 2006) |
20+ | 17.6 µg/g Cr | 0.27 | 0.0012 |
|
NHANES, 2013-2014 (Ye et al. 2006) |
All | 14.6 µg/g Cr | 0.27 | 0.0010 |
Abbreviations: UC, urinary concentration; UCCr, creatinine-adjusted urinary concentration; Cr, creatinine; FUE, fractional urinary excretion
6.1.3 Cosmetics
Triclocarban was reported to be used in Canada in a limited number of cosmetics such as bar soaps and facial cleansers. Reported concentrations of triclocarban in these products range from 0.1% to 3% (internal data, Consumer and Hazardous Products Safety Directorate, Health Canada, dated January 7, 2019; unreferenced). Potential exposures were estimated based on conservative assumptions and default values. See Appendix C for details on the default values and models used for generating exposure estimates. Sentinel exposure scenarios are presented in Table 6‑2.
Dermal absorption values from various human studies were used to estimate an internal dose. Dermal absorption was assayed in static and in flow through in vitro skin cell systems using adult and newborn human skin (Wester et al.1985). Triclocarban was applied at a surface load of 27 µg/cm2. At 37°C, 0.26% of the applied dose was absorbedFootnote 6 by newborn abdominal skin and 0.23% by adult abdominal skin in a static cell. In a continuous flow model, 6% was absorbed by adult abdominal skin. In an in vivo trial, 14C-labelled triclocarban was applied to a skin surface area of 500 cm2 at 4 µg/cm2 in 5 human male volunteers. Over a period of 7 days, 7% of the applied dose penetrated the skin, based on urinary excretion (Wester et al. 1985). In two separate studies, triclocarban absorption was measured in human volunteers after the subjects had showered with soap containing triclocarban. In the first study, 6 adult male subjects used approximately 7 g of soap containing 2% triclocarban (equivalent to a surface load of approximately 8 µg/cm2 before rinsing, based on default values for the 19+ years age group). The total average recovery in urine and feces was 0.39% of the applied dose (0.16% in urine over 2 days and 0.23% in feces over 6 days) (Scharpf et al. 1975). In the second study, 6 adult volunteers (5 males, 1 female) used soap containing 0.6% triclocarban, applying an average maximal dose of 4 µg/cm2. After lathering with the soap, the volunteers let the foam stand for 15 minutes before rinsing. The average urinary excretion over 72 hours was 0.6% of the applied dose, or 0.5 mg per shower per person (Schebb et al. 2011b). In each of these studies, the applied dose reported was prior to rinsing. Based on these studies, the dermal absorption of triclocarban applied in soap at a surface load of >8 µg/cm2 (prior to rinsing) can be conservatively estimated at 0.39% of the applied dose (based on Scharpf et al. 1975). The dermal absorption of triclocarban applied in soap at 4 µg/cm2 or less (before rinsing) can be estimated at >0.6% of the applied dose, based on Schebb et al. (2011b), as fecal excretion was not reported. In the interest of a conservative estimate, a value of 1% absorption was applied to scenarios with a surface load of <4 µg triclocarban/cm2.
| Product scenario | Upper limit of concentration (%) | Age group | Surface loada (µg/cm2) | Dermal absorption (%) | Systemic exposure (mg/kg bw/day) |
|---|---|---|---|---|---|
| Body soap (solid) | 3.0b | 19+ years | 2.3 | 1.0 | 0.0053 |
| Body soap (solid) | 3.0b | 9 to 13 years | 2.2 | 1.0 | 0.0067 |
a Surface load is prior to rinsing.
b Internal data, Consumer and Hazardous Products Safety Directorate, Health Canada, dated January 7, 2019; unreferenced.
6.2 Health effects assessment
Triclocarban has been reviewed by the European Commission’s Scientific Committee on Consumer Products (SCCP), the Australian Department of Health’s National Industrial Chemicals Notification and Assessment Scheme, and as part of the United States Environmental Protection Agency’s High Production Volume Challenge (SCCP 2005; AGDH 2017; US EPA 2002). Some data from these sources have been considered in this health effects assessment.
6.2.1 Toxicokinetics
Triclocarban is readily absorbed and metabolized via oral and intravenous routes in humans, rats, and other species. Triclocarban is less readily absorbed by the dermal route, but doses absorbed by this route are readily metabolized and excreted. Once triclocarban is absorbed, metabolism does not break the basic structure; triclocarban undergoes hydroxylation followed by conjugation with glucuronic acid and sulfates in varying proportions, depending on the tissue. Conjugation can occur to triclocarban or to hydroxylated species. Very little of the absorbed dose (<1%) is distributed to tissues in animal studies (Hiles 1977; Hiles et al. 1978). In humans, rats, and monkeys, over 90% of the absorbed oral dose is excreted in urine and feces, with the greatest portion excreted in feces (Hiles 1977; Hiles and Birch 1978b; Hiles et al.1978). Urinary excretion occurs over a period of up to 80 hours, and fecal excretion of triclocarban occurs for up to 12 days (Hiles 1977; Hiles and Birch 1978a; Scharpf et al. 1975; Schebb et al. 2011b).
Human Studies
In humans, triclocarban was rapidly absorbed after oral dosing, reaching a maximum plasma concentration after less than 3 hours (Hiles and Birch 1978a). After dermal application via showering with a soap containing up to 2% triclocarban, triclocarban and metabolites were below detection level (10 ppb) in blood at all times sampled (Scharpf et al. 1975; Taulli et al.1977). Following intravenous administration, triclocarban underwent a very short distribution phase in plasma, with a half-life of less than 5 minutes, followed by an elimination phase with a half-life of 8.6 hours (Scharpf et al. 1975). After a single oral dose, two-thirds to three-quarters of triclocarban in blood is sulfonated within 3 hours, and less than 10% is glucuronidated; within 24 hours, over 95% of triclocarban present in plasma is sulfonated (Taulli et al. 1977; Birch et al. 1978). Triclocarban metabolites were eliminated from plasma in two phases: glucuronides were eliminated with a half-life of 1.8 hours, and sulfates were eliminated with a half-life of 20.2 hours (Hiles and Birch 1978a). Very little evidence was found describing the organ distribution of triclocarban in humans. However, triclocarban was identified in the hypothalamus in 1 out of 24 samples, in white matter in 2 out of 10 samples in a biomonitoring study, and in cord blood in additional studies (Van Der Meer 2017; Wei et al. 2017; Pycke et al. 2014).
Following dermal exposure via showering with a triclocarban-containing soap, excreted metabolites are mainly glucuronidated, and little parent triclocarban is detected in urine. The highest concentration of N-triclocarban glucuronides in urine was observed 10-24 hours after showering with 0.6% triclocarban soap and demonstrated a large amount of inter-individual variation. Repeated daily showering resulted in a steady state of triclocarban glucuronides in urine (Schebb et al. 2011b; Scharpf et al. 1975). After a single dermal exposure, the majority of triclocarban was excreted in urine over a period of up to 36 hours, comprising up to 0.6% of the applied dose, and a further 0.24% of the applied dose was excreted in feces (Scharpf et al. 1975; Schebb et al. 2011b). After intravenous dosing, 18% of the absorbed dose was excreted in urine after 24 hours and 20% after 4 days. Approximately 10% was excreted in feces in the first 2 days and 55% after 14 days (Scharpf et al. 1975). After oral dosing, 27% was eliminated in urine within 80 hours, and 70% was eliminated in feces within 120 hours, indicating potential route-specific differences (Hiles and Birch 1978a).
Animal studies
In adult rhesus monkeys, plasma concentrations increased rapidly up to 12 hours after intravenous injection and increased relatively slowly thereafter between 12 and 24 hours, suggesting first order kinetics (Hiles et al. 1978). In male Sprague-Dawley rats, 43% of a gavage dose of 14C-triclocarban was recovered in urine, bile, and tissues over 72 hours (Hiles 1977). In the same study, 7.8% was recovered in feces, bile, urine, and tissues over 72 hours after dermal exposure to14C-triclocarban in a 10% soap solution (Hiles 1977). After intravenous, oral or dermal administration in male rats, the only tissues with greater than 0.01% of the administered 14C were the liver, kidney, testes, and lung, in order of relative accumulation. However, quantities were very small, ranging from 0.072% to 0.04% of the administered dose for liver and lungs, respectively (Hiles 1977). In a study of reproductive and post-natal dosing in female CD-1 mice using ad libitum dosing in drinking water, triclocarban translocated across the placenta and was transferred through human milk. Triclocarban-related compounds representing 7% to 18% of the absorbed dose were detected in the brain, heart, fat, and female gonads in offspring, while much lower levels (<1% to 7% of absorbed dose) were found in the brain, muscle, and heart of dams (Enright et al. 2017).
As with humans, the primary metabolites detected in plasma after intravenous and oral administration in animals (to adult rhesus monkeys) were sulfonated forms of triclocarban; in bile, the majority of triclocarban species were glucuronidated (Hiles et al. 1978; Taulli et al. 1977; Birch et al. 1978). After dermal exposure in rats, glucuronide conjugates were only detected in plasma in higher dose groups (Schebb et al. 2011b). In monkeys, removal from plasma also occurred in two phases: fast elimination of glucuronide species followed by the slower removal of sulfate-conjugated species (Hiles et al. 1978). Following oral or intravenous administration to rats, approximately 90% of the administered dose was excreted in feces or bile and 4.3% in urine (Hiles 1977). After dermal administration, the absorbed dose was steadily excreted over 72 hours, with 15.6% excreted in urine and 77% in bile (Hiles 1977). In rhesus monkeys, approximately 20% of the absorbed dose was excreted in urine after intravenous administration, with the remainder eliminated in feces (Hiles et al. 1978).
6.2.2 Acute studies, irritation and sensitization
Triclocarban is of low acute toxicity by the oral and dermal routes (SCCP 2005). Studies by the inhalation route were not available; however, inhalation exposure is not expected due to low vapour pressure. Triclocarban is non-irritating and is not a sensitizer in animal and human studies (SCCP 2005).
6.2.3 Genotoxicity
Triclocarban was negative in Ames assays, with and without metabolic activation, in Salmonella typhimurium strains TA98, TA100, TA1535, TA1537, and TA1538 at doses up to 5000 µg/plate (Bayer 1992; Bonin et al. 1982; ECHA c2007-2017). Triclocarban was also negative in an in vitro chromosome aberration test in Chinese hamster ovary cells, with and without metabolic activation, at concentrations up to 2000 µg/mL (Soap and Detergent Association 2002). In Tox21 assays, triclocarban was identified as genotoxic in cell lines deficient in DNA repair pathways (Kim et al. 2019).
6.2.4 Repeated-dose studies
In a repeated-dose study, weaned female Sprague-Dawley rats at post-natal day (PND) 22 (4 per group) were exposed to 0%, 0.2%, or 0.5% triclocarban in diet (equivalent to approximately 103 and 257 mg/kg bw/day, respectively) for 28 days, followed by a 28-day washout period (Kennedy et al. 2018). No significant differences were observed in body weight or body-weight gain. Fecal samples were collected throughout the study, and 16S rRNA was sequenced from extracted total fecal DNA to determine the diversity of microbiota. Phylogenetic diversity decreased significantly over time in both dose groups in the treatment phase (compared to day 0) over the entire treatment period. The decreasing trend in phylogenetic diversity (compared to day 0) was statistically significant in the low-dose group at treatment day 28 and at days 5, 12, and 28 in the high-dose group. Phylogenetic diversity increased in the washout period and on washout day 8 (and thereafter), was significantly different in both groups compared to day 2. A statistically significant microbial community shift, compared to control groups, occurred in both treatment groups on treatment day 2 and continued throughout the treatment phase. During the washout period, the microbial communities became more similar to the control microbiota over time. In the low-dose group, differences were statistically significant at day 2 of the washout period, but were no longer significant at day 8 and thereafter; in the high-dose group, differences were statistically significant up to washout day 11, but were no longer significant at day 28. There were no significant differences in phylogenetic diversity or microbial community between the treatment groups in either phase of the study. During the treatment phase, Firmicutes was the dominant phylum present in both treatment groups, and Bacteroidetes was the dominant phylum in the control group and on day 0 in treatment groups. In the washout phase, the relative abundance of Bacteroidetes and Firmicutes in the treatment groups recovered to levels that were not significantly different from the control group (Kennedy et al. 2018).
Groups of 12 adult male C57BL/6 mice were exposed to 0, 3, 10, 30, and 90 mg/kg bw/day triclocarban by intragastric intubation for 35 days in a study of short-term effects on cardiac function (Xie et al. 2018). Animals were sacrificed on day 35 and their hearts removed for histological and metabolomic analysis. A statistically significant decrease in body weight compared to controls was observed at 10, 30, and 90 mg/kg bw/day. A statistically significant decrease in absolute heart weight was observed at 30 and 90 mg/kg bw/day, and a statistically significant decrease in heart weight relative to body weight was observed in all test groups. Histopathological examination revealed that cardiac fibres were thicker with less staining in animals from the two highest dose groups. Metabolomic data indicated multiple effects on cardiac metabolism, including changes in levels of endogenous metabolites and the levels of cardiac enzymes involved in fatty acid synthesis and metabolism (Xie et al. 2018). The biological significance of metabolic effects was not clearly established. Metabolic changes induced by triclocarban are mediated by the constitutive androstane receptor (CAR), of which triclocarban is an established activator. CAR plays a central role in cytochrome P450 and phase II enzyme induction as well as lipid and glucose metabolism, among other processes. However, CAR is poorly conserved across species, and the CAR receptors of different species vary considerably in their ability to bind and become activated by CAR-activating chemicals (Omiecinski et al. 2011). Therefore, the CAR-mediated alterations in metabolism and subsequent cardiac physiology observed by Xie et al. (2018) are unlikely to be of human relevance.
In a two-year chronic study performed based on a protocol approved by the US FDA, groups of 80 Sprague-Dawley rats were exposed to 0, 25, 75, and 250 mg/kg bw/day triclocarban in diet (Monsanto 1981). Clinical signs, body weight, and food consumption were monitored throughout the study. Ophthalmoscopic examinations were conducted regularly, and clinical evaluations of hematology, clinical chemistry, and urinalysis were conducted at 6, 12, 20, 23 (males), and 25 (females) months. Necropsy and pathological examinations were conducted at termination. Gross lesions were examined microscopically for neoplastic changes. No treatment-related clinical signs or mortality were observed throughout the study. No differences were observed with regard to ophthalmic observations, food consumption, or urinalysis. Signs of laboured breathing, emaciation, rales, and mortality were observed among control and treated males in weeks 64 to 86 and weeks 70 to 83, respectively, due to respiratory infection. For most of the study duration, the mean body weight of males (250 mg/kg bw/day) and females (75 and 250 mg/kg bw/day) was slightly reduced compared to controls. Anemia was observed in males at 75 and 250 mg/kg bw/day and in females at 250 mg/kg bw/day. A slight increase in serum alkaline phosphatase, blood urea nitrogen, glucose, and total bilirubin was observed in high-dose males at various time points. Statistically significant changes in organ weights included increased liver weights in both sexes at 75 and 250 mg/kg bw/day, increased spleen weights at 75 (males) and 250 mg/kg bw/day (males and females), and increased testes and heart weights in males at 250 mg/kg bw/day. No microscopic changes were observed to account for increased organ weights, and the authors stated that the organ weight changes may therefore not be biologically significant. An increase in the incidence of small and flaccid testes was observed in males (250 mg/kg bw/day) that died spontaneously or were killed moribund between 12 and 23 months. A similar treatment-related increase was not apparent at terminal sacrifice. There was no evidence for dose-related increases in tumour incidence at any site (Monsanto 1981). A no-observed-adverse-effect level (NOAEL) of 25 mg/kg bw/day was selected by the SCCP (2005) for this study based on anemia, organ weight changes, and body weight changes observed at 75 mg/kg bw/day.
6.2.5 In vitro studies
In prostate cancer-derived cells, co-treatment of androgen with triclocarban increased activation of a luciferase reporter with an androgen response element promoter compared to androgen alone. This effect was suppressed by an androgen receptor-binding inhibitor (bicalutamide) (Duleba et al. 2011). Co-exposure of triclocarban with estrogen or dihydrotestosterone enhances estrogenic and androgenic activation of luciferase reporters in cell lines such as HeLa 9908 and MDA-2kb (Tarnow et al. 2013; Huang et al. 2014; Christen et al. 2010; Chen et al. 2008; Blake et al. 2010; Ahn et al. 2008). In MCF-7 breast cancer cells, triclocarban promotes cell proliferation, reduces ERα RNA and protein expression, and stimulates AhR expression when co-expressed with estrogens (Huang et al. 2014; Tarnow et al. 2013). In non-cancerous breast cells (MCF10A), triclocarban induced premalignant cancer-like characteristics including reduced dependence on growth factors, anchorage-independent growth, and increased cell proliferation (Sood et al. 2013). Triclocarban exposure resulted in significant changes in the abundance of thyroid hormone-responsive transcripts in rat GH3 cells, inhibited iodide uptake, and inhibited thyroid peroxidase activity in cellular thyroid models (Hinther et al. 2011; Wu et al. 2016).
Triclocarban induced adenosine triphosphate depletion at non-cytotoxic concentrations and significant arrhythmic beating in human-induced pluriopotent stem cell-derived cardiomyocites (Chaudhari et al. 2018). Triclocarban was identified in a Tox21 in vitro screen for chemicals affecting mitochondrial function (Xia et al. 2018).
6.2.6 Reproduction and development studies
In a three-generation reproductive study, triclocarban was administered to groups of 12 male and 24 female Charles River CD rats in diet at 0, 250, 500, 1000, and 3000 ppm (corresponding to an uptake of 0, 23, 50, 95, and 280 mg/kg bw/day, respectively) (Monsanto 1983). Triclocarban was administered at least 60 days before mating and continuously thereafter. Each parent generation was mated to produce two litters, and some F2 animals were mated to produce a third litter. Offspring from the second litters of F0 and F1 parents were selected to be parents of subsequent generations. The F2 and F3 generations received the test substance for an 80-day growth period before mating, then continuously thereafter. Throughout the study, there were no treatment-related clinical observations, effects on body weight, or food consumption in the adult generations during growth or between mating periods. There were no consistent trends in effects on body weight or food consumption in parents during the gestation or lactation phases of the study. Mating indices and male fertility were not adversely affected by treatment in any of the generations other than F1. The pregnancy rate was unusually low in the 3000-ppm group during the second litter of the F1 generation. In a small satellite study, of the animals from the 3000-ppm group that did not demonstrate fertility, 1 out of 3 males and 3 out of 10 females were not fertile. The mean number of live pups at birth was lower than the controls for both litters in the highest dose group of the F0 generation; no similar effect was observed in the F1 or F2 generations. Mean pup weight was significantly reduced at PND 21 in both litters of the highest dose group in the F0 generation. Reduced spleen and liver weights compared to controls were observed in second litter F3 pups at 1000 ppm and above, and the kidney/body weight ratio was lower than the control in the 3000-ppm group. Histological effects were observed in the kidneys of first litter F1 pups at 500 ppm and above. Splenic congestion was observed in F3 female pups at 3000 ppm. In the adult generation, differences were observed in absolute and relative spleen, kidney, liver, adrenal, heart, and/or pituitary weights at 500 ppm and above. Histopathological evaluation of selected tissues from adult animals at 3000 ppm revealed effects in the spleen, liver, kidneys, and bone marrow (Monsanto 1983). A NOAEL of 250 ppm (23 mg/kg bw/day) was reported by the SCCP (2005) for systemic effects in the parental generation based on changes in absolute and relative organ weights at 500 ppm, which were supported by histological changes at 3000 ppm (Monsanto 1983). A NOAEL for reproductive and developmental toxicity of 1000 ppm (95 mg/kg bw/day) was reported by the SCCP (2005) based on reduced pregnancy rate, reduced number of live pups at birth, and reduced pup weight at PND 21 observed at 3000 ppm (280 mg/kg bw/day).
In a modified developmental study, pregnant and lactating Sprague-Dawley rats were exposed to triclocarban in diet at 0%, 0.2%, or 0.5% (approximately 0, 103, and 257 mg/kg bw/day, respectively) for a period during gestation only, gestation and lactation/nursing, or lactation/nursing only (Kennedy et al. 2015). In the first part of the study, pregnant rats were administered 0% (n = 4), 0.2% (n = 5), or 0.5% (n = 5) triclocarban in diet from gestation days (GDs) 5 to 19. Dams were sacrificed on GD 19. Triclocarban was detected in maternal serum and amniotic fluid. A statistically significant decrease in body weight gain and in serum triiodothyronine (T3) was observed in dams in the 0.5% group. There were no observed effects on survival, implantation number, systemic or sex organ weight, gross physiological or histological evaluation of organs (liver, kidney, adrenal, and ovaries), circulating estradiol, testosterone, progesterone, thyroxine, and thyroid-stimulating hormone. The second arm of the study was divided into parts A and B, in which pregnant females were exposed to triclocarban in diet from GD 5 to PND 21 (weaning), or from GD 5 to PND 14, respectively. In part A of this study arm, pregnant rats were exposed to 0% (n = 5) or 0.5% (n = 5) from GD 5 to PND 21. Dams were terminated either on PND 21 or on the day when remaining pups died. At birth, there were no differences in the number of live births or birth weights between the groups. Neonates born to and nursed by dams in the 0.5% triclocarban group did not survive past PND 8. All neonates born to and nursed by control animals survived beyond weaning. Milk bands were observed in pups from the 0.5% group (indicating milk intake); however, mammary glands collected from the 0.5% group dams had evidence of involution. In part B of this study arm, pregnant females were exposed to 0% (n = 5) or 0.5% (n = 5) from GD 5 to PND 14. In this part of the study, litters from dams in the 0.5% group were culled to 6 pups on PND 0, and 3 pups were replaced by control pups. At PND 3, control pups were replaced by new, healthy pups, and on PND 6, all pups born to treated dams were replaced by new control pups. On PND 9, the control pups added to the litter on PND 3 were replaced with healthy pups. Milk band scores were similar among control and treated groups on PNDs 1 and 3, but milk bands were absent on PND 6 in pups born to/raised by 0.5% dams. Mammary glands from treated dams on PND 14 were not involuted when additional healthy pups were continuously provided to maintain normal suckling activity. In the third arm of the study, pregnant female rats were fed 0% (n = 5), 0.2% (n = 5), or 0.5% (n = 5) in diet from GD 5 to PND 21. Litters were culled to 6 pups and cross-fostered: each dam carried and nursed 2 pups from her own litter and 2 from each of the other test groups. All dam groups (n = 5) raised 30 pups: 10 pups born to 0.5%-treated dams, 10 pups born to 0.2%-treated dams, and 10 pups born to control dams. At birth, there were no differences in live births or the average birth weight per litter. At PND 3, the average body weight was 16% and 25% lower than controls in pups raised by 0.2%-- and 0.5%-treated dams, respectively. Within each dam group, there was no difference between the body weights of pups with different in utero exposure. No pups raised by 0.5% triclocarban-treated dams survived beyond PND 5 regardless of in utero exposure status (n = 30). Of 30 pups raised by 0.2%-treated dams, 27 pups survived to PND 6, but only 4 animals in this group survived beyond weaning day. All pups raised by control dams survived the study period, regardless of in utero exposure. At weaning, the average body weight of the 4 surviving offspring raised by the 0.2%-treated dams was approximately half that of offspring raised by control dams (statistical analysis was not possible as all 4 pups were raised by the same dam). The abdomens of all pups raised by dams exposed to either of the triclocarban concentrations were distended, and all pups had diarrhea. On PNDs 4 and 5, gross pathological examination of the pups raised by the 0.5%-treated dams showed small acute gastric ulcers and fatty vacuolation of hepatocytes. In utero status had no effect on anogenital distance (AGD), vaginal opening (VO) date, first date of estrus after VO, or organ weight. Dam-raising had no effect on AGD (Kennedy et al. 2015). The lowest-observed-adverse-effect level selected for this study was 0.2% triclocarban (103 mg/kg bw/day, lowest dose tested) based on reduced body weight and survival in pups nursed by dams treated at this dose and above.
In a reproductive and teratogenic study, female New Zealand rabbits (n = 20/group) were administered 0 (untreated), 0 (vehicle only), 250, 500, or 1000 mg/kg bw/day of a 2:1 mixture of triclocarban and 3-trifluoromethyl-4,4’-dichlorocarbanilide (TFC) by the dermal route from GDs 7 to 18 (Nolen and Dierckman 1979). Triclocarban and TFC were administered in a 1% soap solution applied to a clipped area of 14 × 24 cm on the back of each doe and rinsed off after 4 hours. Animals were sacrificed on day 29 and fetuses removed by Caesarian section. No significant differences were reported in the number of live/dead fetuses, resorptions, implantations, corpora lutea, fetal weight, or malformations (based on gross, soft tissue, and skeletal examinations). Maternal toxicity was not observed, but mild skin irritation was seen in all treated animals (Nolen and Dierckman 1979).
Castrated male Sprague-Dawley rats were treated with triclocarban in diet and/or testosterone propionate injection over 10 days (Chen et al. 2008). Animals were divided into four groups (n = 12/group) based on treatment. Group 1 received a sham injection and normal diet, group 2 received an injection of 0.2 mg/kg bw/day testosterone propionate and normal diet, group 3 received sham injection and 0.25% triclocarban in diet (equivalent to 123 mg/kg bw/day), and group 4 received an injection of 0.2 mg/kg bw/day testosterone propionate and 0.25% triclocarban in diet. No significant difference was detected in total body weight, kidney or liver weight between the groups. No significant differences were observed in the weights of the seminal vesicles, Cowper’s gland, levator ani-bulbocavernosus muscle (LABC), and glans penis between control rats (group 1) and rats receiving only triclocarban (group 3). An increase in ventral prostate weight was observed in rats treated with triclocarban only (group 3), compared to control rats (group 1). Treatment with testosterone propionate alone (group 2) significantly increased the weights of accessory sex organs, compared with controls (group 1) and treatment with triclocarban alone (group 3). Treatment with both testosterone propionate and triclocarban resulted in a significant increase in the weights of all accessory sex organs, compared with testosterone propionate treatment alone, indicating a potential synergism between testosterone propionate and triclocarban in vivo (Chen et al. 2008).
In a study of male reproductive toxicity, male Sprague-Dawley rats (aged 48 to 52 days) were divided into groups of 12 and treated with 0% or 0.25% triclocarban (equivalent to 129 mg/kg bw/day) in diet for 10 days (Duleba et al. 2011). Animals in the treatment group had significantly more weight gain (5.1% higher final weight) compared to controls. Treated animals also had higher absolute and relative liver weights compared to controls, but kidney, adrenal and testes weights were not affected. Significantly higher absolute and relative weights were also observed in seminal vesicles (42%), ventral prostate (42%), LABC (136%) and glans penis (35%). Significantly higher dry weights of seminal vesicles, LABC, and glans penis were also observed, although no visible abnormalities or histological differences were found in accessary sex glands, penis, or testes. Hyperplasia was observed in vesicular glands which were variably distended with fluid and formed numerous complex folds that extended in to the lumen and in acini of prostate gland which were also distended compared to controls. Significantly greater protein and DNA content were observed in the ventral prostate, LABC, and glans penis compared to controls. Serum luteinizing hormone and testosterone levels were not significantly altered by triclocarban treatment (Duleba et al. 2011).
6.2.7 Epidemiology
In epidemiological studies, potential associations were identified between urinary concentrations of triclocarban and hormone levels during pregnancy, and decreased gestational age at birth (Aker et al. 2018; Geer et al. 2017). In a case-control sample (nested within a cohort study) of 439 pregnant women, a small but statistically significant decrease in total serum T3 (according to samples taken at up to 4 time points in pregnancy) was observed in relation to an inter-quartile range increase in urinary triclocarban levels (measured as a binary variable, either above or below the LOD). A non-significant increase in thyroid-stimulating hormone was also associated with triclocarban levels above the LOD. However, the association with T3 level was no longer significant in a sensitivity analysis conducted among women with term births (>37 weeks gestation) (Aker et al. 2018). In a group of 34 neonates, triclocarban concentration in umbilical cord blood was associated with increased odds of decreased gestational age at birth. In a sensitivity analysis, 2’-hydroxytriclocarban was marginally significantly associated with decreased body length at birth, but triclocarban in cord blood was no longer associated with gestational age at birth (Geer et al. 2017).
No association was reported between urinary concentrations of triclocarban and fetal growth, fetal malformation, DNA damage in children, diabetes incidence, fecundity (time-to-pregnancy), and adult semen quality parameters (Ferguson et al. 2018; Wei et al. 2017; Rocha et al. 2018a; Li et al. 2018; Smarr et al. 2017, 2018).
6.3 Characterization of risk to human health
Triclocarban has low mammalian toxicity in acute studies, is minimally irritating to eyes and skin, and is not a sensitizer. In a dietary two-year study, anemia, reduced body weight, and increased organ weights were observed in rats at doses of 75 mg/kg bw/day and above, with a NOAEL of 25 mg/kg bw/day (Monsanto 1981). This NOAEL was selected as a point of departure (POD) by the European Commission’s SCCP (2005) in their opinion on triclocarban. In a dietary three-generation reproductive study, reduced pregnancy rate in the F1 generation, reduced number of live pups at birth in the F0 generation, reduced body weight in pups in the F0 generation, and reduced organ weight in F3 pups were reported at 280 mg/kg bw/day (although none of these effects were present in all generations), resulting in a NOAEL of 95 mg/kg bw/day reported by the SCCP (2005) for reproductive effects (Monsanto 1983). In the same study, a NOAEL of 23 mg/kg bw/day was reported by the SCCP (2005) for changes in absolute and relative organ weights (spleen, kidney, liver, adrenal, heart, and pituitary) in parents, supported by histological changes. However, no significant effects on reproduction, teratogenicity, or maternal toxicity were reported in rabbits when up to 1000 mg/kg bw/day of a 2:1 mixture of triclocarban and TFC was applied dermally during gestation (Nolen and Dierckman 1979).
Effects were also observed at the lowest oral dose tested (103 to 129 mg/kg bw/day) in one repeated-dose study and three developmental and reproductive toxicity studies of shorter duration. In a 28-day dietary study, significant changes in fecal microbial diversity were observed at doses of 103 mg/kg bw/day (lowest dose tested) and higher(Kennedy et al. 2018). In a modified developmental study, reduced body weight and survival rate was observed in pups (rats) nursed by dams treated at 103 mg/kg bw/day in diet (lowest dose tested) and above (Kennedy et al. 2015). A significant increase in the weights of multiple accessory sex organs was observed in castrated male rats when testosterone was co-administered with a dietary dose of 123 mg/kg bw/day triclocarban (Chen et al. 2008). In a related study of male reproductive toxicity, male accessory sex organs in male rats treated with 129 mg/kg bw/day in diet showed increased absolute and relative weights, hyperplasia, and altered morphology (Duleba et al. 2011). Effects on the male reproductive system are consistent with in vitro studies that demonstrate an amplification of testosterone signalling in the presence of triclocarban.
Sentinel exposure scenarios for triclocarban are based on the daily topical use of cosmetics and oral exposure to environmental media and food. In consideration of critical effects and the long-term nature of the sentinel exposure scenarios, the NOAEL of 23 mg/kg bw/day for systemic toxicity in a dietary three-generation reproductive study was selected as a POD. The resulting margins of exposures (MOEs) are expected to be protective of other systemic and reproductive effects reported in studies of shorter duration as wells as in a two-year chronic toxicity study.
The Canadian population is exposed to triclocarban via environmental media (including drinking water and dust), food products, and cosmetics. Biomonitoring data indicate that over 96% of the Canadian population has a urinary concentration of less than 1 µg/L triclocarban. Triclocarban was not detected in human milk or meconium in a Canadian study. To address the potential risk associated with exposure to triclocarban from environmental media, food products, and cosmetics, MOEs derived from modelled exposures in sentinel scenarios are presented in Table 6‑3.
| Exposure scenario | Systemic exposure (mg/kg bw/day) | Critical effect level (mg/kg bw/day) | Critical health effect endpoint | MOE |
|---|---|---|---|---|
| Environmental media and food (infants aged 0 to 5 months, human milk-fed) | 1.1 x 10⁻⁴ | NOAEL 23 | Reduced absolute and relative organ weights; altered organ histology | 200 000 |
| Body soap (solid, 9- to 13-year-olds) | 0.0067 | NOAEL 23 | Reduced absolute and relative organ weights; altered organ histology | 3430 |
Abbreviations: MOE, margin of exposure; NOAEL, no-observed-adverse-effect level
On the basis of the conservative parameters used in modelling exposures, the calculated MOEs are considered adequate to address uncertainties in the health effects and exposure databases.
6.4 Uncertainties in evaluation of risk to human health
The key sources of uncertainty are presented in the table below.
| Key source of uncertainty | Impact |
|---|---|
| No Canadian or North American data for triclocarban in retail foods have been identified. The maximum triclocarban concentration reported in the scientific literature for lettuce was used to represent all vegetables in the food intake assessment. | +/- |
| Few repeated-dose dermal studies were available for triclocarban. | +/- |
+ = uncertainty with potential to cause overestimation of exposure/risk; - = uncertainty with potential to cause underestimation of exposure/risk; +/- = unknown potential to cause over- or underestimation of risk.
7. Conclusion
Considering all available lines of evidence presented in this screening assessment, there is low risk of harm to the environment from triclocarban. It is concluded that triclocarban does not meet the criteria under paragraphs 64(a) or (b) of CEPA as it is not entering the environment in a quantity or concentration or under conditions that have or may have an immediate or long-term harmful effect on the environment or its biological diversity or that constitute or may constitute a danger to the environment on which life depends.
Considering all of the information presented in this screening assessment, it is concluded that triclocarban does not meet the criteria under paragraph 64(c) of CEPA as it is not entering the environment in a quantity or concentration or under conditions that constitute or may constitute a danger in Canada to human life or health.
It is therefore concluded that triclocarban does not meet any of the criteria set out in section 64 of CEPA.
References
[AGDH] Australian Government Department of Health. 2017. Urea, N-(4-chlorophenyl)-N'-(3,4-dichlorophenyl)-: Environment tier II assessment [PDF]. Sydney (AU): Department of Health, National Industrial Chemicals Notification and Assessment Scheme (NICNAS). [accessed: 2019 Jan 31].
Ahn KC, Zhao B, Chen J, Cherednichenko G, Sanmarti E, Denison MS, Lasley B, Pessah IN, Kültz D, Chang DPY, Gee SJ, Hammock BD. 2008. In vitro biologic activities of the antimicrobials triclocarban, its analogs, and triclosan in bioassay screens: receptor-based bioassay screens. Environ Health Perspect. 116(9):1203-1210.
Aker AM, Johns L, McElrath TF, Cantonwine DE, Mukherjee B, Meeker JD. 2018. Associations between maternal phenol and paraben urinary biomarkers and maternal hormones during pregnancy: A repeated measures study. Environ Int. 113:341-349.
Albanese KA, Lanno RP, Hadad CM, Chin Y-P. 2017. Photolysis- and dissolved organic matter-induced toxicity of triclocarban to Daphnia magna. Environ Sci Technol Lett. 4(11):457-462
Aparicio I, Martín J, Abril C, Santos JL, Alonso E. 2018. Determination of household and industrial chemicals, personal care products and hormones in leafy and root vegetables by liquid chromatography-tandem mass spectrometry. J Chromatogr A. 1533:49-56.
Arbuckle TE, Weiss L, Fisher M, Hauser R, Dumas P, Bérubé R, Neisa A, LeBlanc A, Lang C, Ayotte P, et al. 2015. Maternal and infant exposure to environmental phenols as measured in multiple biological matrices. Sci Total Environ. 508:575-584.
Arnot JA, Mackay D. 2008. Policies for chemical hazard and risk priority setting: Can persistence, bioaccumulation, toxicity, and quantity information be combined? Environ Sci Technol. 42(13):4648-4654.
Aylward LL, Hays SM, Vezina A, Deveau M, St-Amand A, Nong A. 2015. Biomonitoring Equivalents for interpretation of urinary fluoride. Regul Toxicol Pharmacol. 72(1):158-167.
Barros S, Montes R, Quintana JB, Rodil R, Oliveira JMA, Santos MM, Neuparth T. 2017. Chronic effects of triclocarban in the amphipod Gammarus locusta: Behavioural and biochemical impairment. Ecotoxicol Environ Saf. 135:276-283.
Bayer AG. 1992. Preventol SB - Salmonella/microsome test. Report no. 21078. [as cited in SCCP 2005].
Birch CG, Hiles RA, Eichhold TH, Jeffcoat AR, Handy RW, Hill JM, Willis SL, Hess TR, Wall ME. 1978. Biotransformation products of 3,4,4'-trichlorocarbanilide in rat, monkey, and man. Drug Metab Dispos. 6(2): 169-76.
Blake LS, Martinović D, Gray LE, Wilson VS, Regal RR, Villeneuve DL, Ankley GT. 2010. Characterization of the androgen-sensitive MDA-kb2 cell line for assessing complex environmental mixtures. Environ Toxicol Chem. 29(6):1367-1376.
Bonin AM, Arlauskas AP, Angus DS, Baker RSU, Gallagher CH, Greenoak G, Lane Brown MM, Meher-Homji KM, Reeve V. 1982. UV-absorbing and other sun-protecting substances: genotoxicity of 2-ethylhexyl P-methoxycinnamate. Mutat Res. 105(5):303-308. [as cited in SCCP 2005].
Bradley JC, Lang A, Williams A. 2014. Jean-Claude Bradley Double Plus Good (Highly Curated and Validated) Melting Point Dataset. figshare. Dataset.
Canada. 1999. Canadian Environmental Protection Act, 1999. S.C. 1999, c.33. Canada gazette Part III, vol. 22, no. 3.
Canada, Dept. of the Environment. 2009. Canadian Environmental Protection Act, 1999: Notice with respect to certain inanimate substances (chemicals) on the Domestic Substances List [PDF]. Canada gazette, Part I, vol. 143, no. 40, p. 2945-2956.
Canada, Dept. of the Environment. 2017. Canadian Environmental Protection Act, 1999: Notice with respect to substances included as part of the 2017 Inventory Update. Canada gazette, Part I, vol. 151, no. 2.
Carmona E, Andreu V, Picó Y. 2014. Occurrence of acidic pharmaceuticals and personal care products in Turia River Basin: From waste to drinking water. Sci Total Environ. 484(1):53-63.
Cha J, Cupples AM. 2010. Triclocarban and triclosan biodegradation at field concentrations and the resulting leaching potentials in three agricultural soils. Chemosphere. 81(4):494-499.
Chaudhari U, Nemade H, Sureshkumar P, Vinken M, Ates G, Rogiers V, Hescheler J, Hengstler JG, Sachinidis A. 2018. Functional cardiotoxicity assessment of cosmetic compounds using human-induced pluripotent stem cell-derived cardiomyocytes. Arch Toxicol. 92(1):371-381.
ChemIDplus [database]. 1993- . Bethesda (MD): US National Library of Medicine. [updated 2016 Jul 20; accessed 2019 Mar 5]
Chen J, Ahn KC, Gee NA, Ahmed MI, Duleba AJ, Zhao L, Gee SJ, Hammock BD, Lasley BL. 2008. Triclocarban enhances testosterone action: a new type of endocrine disruptor? Endocrinology. 149(3):1173-1179.
Chen J, Hartmann EM, Kline J, Van Den Wymelenberg K, Halden RU. 2018. Assessment of human exposure to triclocarban, triclosan and five parabens in U.S. indoor dust using dispersive solid phase extraction followed by liquid chromatography tandem mass spectrometry. J Hazard Mater. 360:623-630.
Chiaia-Hernandez AC, Ashauer R, Moest M, Hollinghaus T, Jeon J, Spaak P, Hollender J. 2013. Bioconcentration of organic contaminants in Daphnia resting eggs. Environ Sci Technol. 47(18):10667-10675.
Christen V, Crettaz P, Oberli-Schrämmli A, Fent K. 2010. Some flame retardants and the antimicrobials triclosan and triclocarban enhance the androgenic activity in vitro. Chemosphere. 81(10):1245-1252.
Coogan MA, Edziyie RE, La Point TW, Venables BJ. 2007. Algal bioaccumulation of triclocarban, triclosan, and methyl-triclosan in a North Texas wastewater treatment plant receiving stream. Chemosphere. 67(10):1911-1918.
Coogan MA , La Point TW. 2008. Snail bioaccumulation of triclocarban, triclosan, and methyltriclosan in a north Texas, USA, stream affected by wastewater treatment plant runoff. Environ Toxicol Chem. 27(8): 1788-1793.
[CoRAP] ECHA Community Rolling Action Plan. 2018. Justification Document for the Selection of a CoRAP Substance: Triclocarban. March 20 2018. EC 202-924-1.
de Solla SR, Gilroy EAM, Klinck JS, King LE, McInnis R, Struger J, Backus SM, Gillis PL. 2016. Bioaccumulation of pharmaceuticals and personal care products in the unionid mussel Lasmigona costata in a river receiving wastewater effluent. Chemosphere. 146:486-496.
Dong X, Xu H, Wu X, Yang L. 2018. Multiple bioanalytical method to reveal developmental biological responses in zebrafish embryos exposed to triclocarban. Chemosphere. 193:251-258.
Duleba AJ, Ahmed MI, Sun M, Gao AC, Villanueva J, Conley AJ, Turgeon JL, Benirschke K, Gee NA, Chen J, Green PG, Lasley BL. 2011. Effects of triclocarban on intact immature male rat: augmentation of androgen action. Reprod Sci. 18(2):119-127.
[EC] European Commission. 2018a. Annex III: List of substances which cosmetic products must not contain except subject to the restrictions laid down. [updated 2018 Oct 24; accessed 2019 May 31].
[EC] European Commission. 2018b. Annex V: List of preservatives allowed in cosmetic products. [updated 2018 Nov 23; accessed 2019 May 31].
[ECCC] Environment and Climate Change Canada. 2016a. Science approach document: ecological risk classification of organic substances. Ottawa (ON): Government of Canada.
[ECCC] Environment and Climate Change Canada. 2016b. Supporting documentation: data used to create substance-specific hazard and exposure profiles and assign risk classifications. Gatineau (QC): ECCC. Information in support of the science approach document: ecological risk classification of organic substances. Available from: substances@ec.gc.ca.
[ECCC, HC] Environment and Climate Change Canada, Health Canada. [modified 2017 Mar 12]. Categorization. Ottawa (ON): Government of Canada. [accessed 2017 Mar 12].
EG&G Bionomics. 1976. Acute toxicity of TCC-QM-769 to bluegill (Lepomis macrochirus) and rainbow trout (Salmo gairdneri). Report no. 88-920008326.
EG&G Bionomics. 1978a. Acute toxicity of TCC (1218033) to bluegill (Lepomis macrochirus) in dilution water with a total hardness (as calcium carbonate) of 100 milligrams per liter. Report no. 88-920008503.
EG&G Bionomics. 1978b. Acute toxicity of TCC (1218033) in a pH 6.0 dilution water to bluegill (Lepomis macrochirus). Report no. 88-920007553.
EG&G Bionomics. 1978c. The chronic toxicity of 1218033 to the water flea (Daphnia magna). Report no. 88-920007397.
EG&G Bionomics. 1978d. Acute toxicity of TCC (1218033) to bluegill (Lepomis macrochirus). Report no. 88-920008331.
EG&G Bionomics. 1978e. Acute toxicity of TCC (1218033) to bluegill (Lepomis macrochirus) in dilution water with a total hardness (as calcium carbonate) of 250 milligrams per liter. Report no. 88-920008507.
EG&G Bionomics. 1978f. Acute toxicity of TCC (1218033) to bluegill (Lepomis macrochirus) in dilution water with a pH of 8.0. Report no. 88-920008508.
EG&G Bionomics. 1978g. Acute toxicity of TCC (1218033) to bluegill (Lepomis macrochirus) at 30°C.Report no. 88-920008606.
EG&G Bionomics. 1979. Chronic toxicity of sediment-sorbed TCC to the midge (Paratanytarsus parthenogenica). Report no. 88-920007763.
EG&G Bionomics. 1980. Acute and chronic toxicity of TCC to mysid shrimp (Mysidopsis bahia) in flow-through tests. Report no. 88-920007499.
[ECHA] European Chemicals Agency. c2007-2017. Registered substances database; search results for CAS RN 101-20-2. Helsinki (FI): ECHA. [accessed 2021 Apr 20].
Enright HA, Falso MJS, Malfatti MA, Lao V, Kuhn EA, Hum N, Shi Y, Sales AP, Haack KW, Kulp KS, et al. 2017. Maternal exposure to an environmentally relevant dose of triclocarban results in perinatal exposure and potential alterations in offspring development in the mouse model. PLoS ONE. 12(8):e0181996.
Fan B, Li J, Wang X, Gao X, Chen J, Ai S, Li W, Huang Y, Liu Z. 2019. Study of aquatic life criteria and ecological risk assessment for triclocarban (TCC). Environ Pollut. 254:112956.
Ferguson KK, Meeker JD, Cantonwine DE, Mukherjee B, Pace GG, Weller D, McElrath TF. 2018. Environmental phenol associations with ultrasound and delivery measures of fetal growth. Environ Int. 112:243-250.
Ficheux AS, Chevillotte G, Wesolek N, Morisset T, Dornic N, Bernard A, Bertho A, Romanet A, Leroy L, Mercat AC, et al. 2016.Consumption of cosmetic products by the French population second part: Amount data. Food Chem Toxicol. 90:130-141.
Ficheux AS, Wesolek N, Chevillotte G, Roudot AC. 2015. Consumption of cosmetic products by the French population. First part: Frequency data. Food Chem Toxicol. 78:159-169.
Frederiksen H, Nielsen JKS, Mørck TA, Hansen PW, Jensen JF, Nielsen O, Andersson, A-M, Knudsen LE. 2013. Urinary excretion of phthalate metabolites, phenols and parabens in rural and urban Danish mother-child pairs. Int J Hyg Environ Health. 216(6):772-783.
Fu Q, Sanganyado E, Ye Q, Gan J. 2016. Meta-analysis of biosolid effects on persistence of triclosan and triclocarban in soil. Environ Pollut. 210:137-144.
Gao L, Yuan T, Cheng P, Bai Q, Zhou C, Ao J, Wang W, Zhang H. 2015. Effects of triclosan and triclocarban on the growth inhibition, cell viability, genotoxicity and multixenobiotic resistance responses of Tetrahymena thermophila. Chemosphere. 139:434-440.
Garcia-Ac A, Segura PA, Viglino L, Fϋrtös A, Gagnon C, Prévost M, Sauvé S. 2009. On-line solid-phase extraction of large-volume injections coupled to liquid chromatography-tandem mass spectrometry for the quantitation and confirmation of 14 selected trace organic contaminants in drinking and surface water. J Chromatogr A. 1216(48):8518-8527.
Geer LA, Pycke BFG, Waxenbaum J, Sherer DM, Abulafia O, Halden RU. 2017. Association of birth outcomes with fetal exposure to parabens, triclosan and triclocarban in an immigrant population in Brooklyn, New York. J Hazard Mater. 323(Pt A):177-183.
Geiss C, Ruppert K, Heidelbach T, Oehlmann J. 2016. The antimicrobial agents triclocarban and triclosan as potent modulators of reproduction in Potamopyrgus antipodarum (Mollusca: Hydrobiidae). J Environ Sci Health A Tox Hazard Subst Environ Eng. 51(13):1173-1179.
Giudice BD, Young TM. 2010. The antimicrobial triclocarban stimulates embryo production in the freshwater mudsnail Potamopyrgus antipodarium. Environ Toxicol Chem. 29(4):966-970.
Gomes MF, de Carvalho Soares de Paula V, Martins LRR, Garcia JRE, Yanamoto FY, de Freitas AM. 2020. Sublethal effects of triclosan and triclocarban at environmental concentrations in silver catfish (Rhamdia quelen) embryos. Chemosphere. 263(2):127985.
Han J, Won E-J, Hwang U-K, Kim I-C, Yim J-H, Lee J-S. 2016. Triclosan (TCS) and Triclocarban (TCC) cause lifespan reduction and reproductive impairment through oxidative stress-mediated expression of the defensome in the monogonont rotifer (Brachionus koreanus). Comp Biochem Physiol C Toxicol Pharmacol. 185-186:131-137.
Hartmann EM, Hickey R, Hsu T, Román CMB, Chen J, Schwager R, Kline J, Brown GZ, Halden RU, Huttenhower C, Green JL. 2016. Antimicrobial Chemicals Are Associated with Elevated Antibiotic Resistance Genes in the Indoor Dust Microbiome. Environ Sci Technol. 50(18):9807-9815.Health Canada. 2013. Second Report on Human Biomonitoring of Environmental Chemicals in Canada. Results of the Canadian Health Measures Survey Cycle 2 (2009-2011). Ottawa (ON): Government of Canada. [accessed 2019 Apr 17].
Health Canada. 2015. Food Consumption Table derived from Statistics Canada, Canadian Community Health Survey, Cycle 2.2, Nutrition (2004), Share file. Ottawa.
Health Canada. 2017. Water Consumption Table derived from Statistics Canada, Canadian Community Health Survey, Cycle 2.2, Nutrition (2004). Share file. Ottawa.
Health Canada. 2018a. Draft backgrounder document on default values for breast milk and formula intakes. Unpublished report. Ottawa (ON): Government of Canada.
Health Canada. 2018b. Food Consumption Table derived from Statistics Canada's 2015 Canadian Community Health Survey, Nutrition, Share file. Ottawa. Health Canada. [modified 2019 Dec 03]. Cosmetic Ingredient Hotlist: List of substances that are restricted or prohibited in cosmetics. Ottawa (ON): Government of Canada. [accessed 2021 Apr 16].
Higgins CP, Paesani ZJ, Abbot Chalew TE, Halden RU. 2009. Bioaccumulation of triclocarban in Lumbriculus variegatus. Environ Toxicol Chem. 28(12):2580-2586.
Higgins CP, Paesani ZJ, Abbot Chalew TE, Halden RU. 2011. Persistence of triclocarban and triclosan in soils after land application of biosolids and bioaccumulation in Eisenia foetida. Environ Toxicol Chem. 30 (3):556-563.
Hiles RA. 1977. Metabolism and toxicity of halogenated carbanilides: Absorption, distribution and excretion of radioactivity from 3,4,4'-trichloro[14C]carbanilide (TCC) and 3-trifluoromethyl-4,4'-dichloro[14C]carbanilide (TFC) in rats. Food Cosmet Toxicol. 15(3):205-211.
Hiles RA, Birch CG. 1978a. The absorption, excretion, and biotransformation of 3,4,4'-trichlorocarbanilide in humans. Drug Metabol Dispos. 6(2):177-183.
Hiles RA, Birch CG. 1978b. Nonlinear metabolism and disposition of 3,4,4'-trichlorocarbanilde in the rat. Toxicol Appl Pharmacol. 46(2):323-337.
Hiles RA, Caudill D, Birch CG, Eichhold T. 1978. The Metabolism and Disposition of 3,4,4’-Trichlorocarbanilide in the Intact and Bile Duct-Cannulated Adult and in the Newborn Rhesus Monkey (M. mulatfa). Toxicol Appl Pharmacol. 46(3):593-608.
Hinther A., Bromba CM, Wulff JE, Helbing CC. 2011. Effects of triclocarban, triclosan, and methyl triclosan on thyroid hormone action and stress in frog and mammalian culture systems. Environ Sci Technol. 45(12):5395-5402.
Hoffman K, Hammel SC, Phillips AL, Lorenzo AM, Chen A, Calafat AM, Ye X, Webster TF, Stapleton HM. 2018. Biomarkers of exposure to SVOCs in children and their demographic associations: The TESIE Study. Environ Int. 119:26-36.
Huang H, Du G, Zhang W, Hu J, Wu D, Song L, Xia Y, Wang X. 2014. The in vitro estrogenic activities of triclosan and triclocarban. J Appl Toxicol. 34(9):1060-1067.
Hyland KC, Blaine AC, Higgins CP. 2015. Accumulation of contaminants of emerging concern in food crops – part 2: Plant distribution. Environ Toxicol Chem. 34(10):2222-2230.
Ismail NS, Müller CE, Morgan RR, Luthy RG. 2014. Uptake of contaminants of emerging concern by the bivalves Anodonta californiensis and Corbicula fluminea. Environ Sci Technol. 48(16):9211-9219.
Kennedy RC, Fling RR, Robeson MS, Saxton AM, Schneider LG, Darcy JL, Bemis DA, Zhao L, Chen J. 2018. Temporal dynamics of gut microbiota in triclocarban-exposed weaned rats. Environ Sci Pollut Res Int. 25(15):14743-14751.
Kennedy RCM, Menn FM, Healy L, Fecteau KA, Hu P, Bae J, Gee NA, Lasley BL, Zhao L, Chen J. 2015. Early life triclocarban exposure during lactation affects neonate rat survival. Reprod Sci. 22(1):75-89.
Kim S, Chen J, Cheng T, Gindulyte A, He J, He S, Li Q, Shoemaker BA, Thiessen PA, Yu B, Zaslavsky L, Zhang J, Bolton EE. 2019. PubChem 2019 update: improved access to chemical data. Nucleic Acids Res. 47(D1):D1102-1109.
Kwon J-W, Xia K. 2012. Fate of triclosan and triclocarban in soil columns with and without biosolids surface application. Environ Toxicol Chem. 31(2):262-269.
Lawrence JR, Zhu B, Swerhone GDW, Roy J, Wassenaar LI, Topp E, Korber DR. 2009. Comparative microscale analysis of the effects of triclosan and triclocarban on the structure and function of river biofilm communities. Sci Total Environ. 407(10): 3307-3316.
Lenz KA, Pattison C, Ma H. 2017.Triclosan (TCS) and triclocarban (TCC) induce systemic toxic effects in a model organism in the nematode Caenorhabditis elegans. Environ Pollut. 231(Pt 1):462-470.
Li AJ, Xue J, Lin S, Al-Malki AL, Al-Ghamdi MA, Kumosani TA, Kannan K. 2018. Urinary concentrations of environmental phenols and their association with type 2 diabetes in a population in Jeddah, Saudi Arabia. Environ Res. 166: 544-552.
[LNHPD] Licensed Natural Health Products Database [database]. [modified 2021 Sep 08]. Ottawa (ON): Government of Canada. [accessed 2021 Nov 25].
Loretz LJ, Api AM, Babcock L, Barraj LM, Burdick J, Cater KC, Jarrett G, Mann S, Pan YHL, Re TA, et al. 2008. Exposure data for cosmetic products: Facial cleanser, hair conditioner, and eye shadow. Food Chem Toxicol. 46(5):1516-1524.
Lozano N, Rice CP, Ramirez M, Torrents A. 2018. Fate of triclocarban in agricultural soils after biosolid applications. Environ Sci Pollut Res. 25(1):222-232.
Lu Y, Jin H, Shao B, Xu H, Xu X. 2019. Physiological and biochemical effects of triclocarban stress on freshwater algae. SN Applied Sciences. 1(12):1685
Macherius A, Lapen DR, Reemtsma T, Römbke J, Topp E, Coors A. 2014. Triclocarban, triclosan and its transformation product methyl triclosan in native earthworm species four years after a commercial-scale biosolids application. Sci Total Environ. 472:235-238.
Monsanto. 1980. The chronic toxicity of TCC to the midge (Paratanytarsus parthenogenetica) via water, food and sediment exposure. Report no. 88-920007067.
Monsanto. 1980. Study # MSL-1264 (9/22/1980) TCC Environmental Monitoring-Surface Waters and Drinking Waters. [as cited by EPA HPVIS [PDF]].
Monsanto. 1981. A twenty-four month dietary toxicity/carcinogenicity study of TCC in rats. Report no. BDN-77-280. [as cited in SCCP 2005].
Monsanto. 1983. A three-generation reproduction study with TCC rats. Report no. BD-79-058. [as cited in SCCP 2005].
Moos RK, Angerer J, Wittsiepe J, Wilhelm M, Brüning T, Koch HM. 2014. Rapid determination of nine parabens and seven other environmental phenols in urine samples of German children and adults. Int J Hyg Environ Health 217(8):845-853.
Mulla SI, Hu A, Wang Y, Sun Q, Huang S-L, Wang H, Chang-Ping Y. 2016. Degradation of triclocarban by a triclosan-degrading Sphingomonas sp. Strain YL-JM2C. Chemosphere. 144:292-296.
[NHPID] Natural Health Products Ingredients Database [database]. [modified 2021 Oct 13]. Ottawa (ON): Government of Canada. [accessed 2021 Nov 25].
Nolen GA, Dierckman TA. 1979. Reproduction and teratogenic studies of a 2:1 mixture of 3,4,4'-trichlorocarbanilide and 3-trifluoromethyl-4,4'-dichlorocarbanilide in rats and rabbits. Toxicol Appl Pharmacol. 51(3):417-425.
OECD QSAR Toolbox [Read-across tool]. 2014. Version 3.3. Paris (FR): Organisation for Economic Co-operation and Development, Laboratory of Mathematical Chemistry.
Omiecinski CJ, Coslo DM, Chen T, Laurenzana EM, Peffer RC. 2011. Multi-species Analyses of Direct Activators of the Constitutive Androstane Receptor. Toxicol Sci. 123(2):550-562.
O'Neil, MJ, editor. 2013. The Merck Index: An Encyclopedia of Chemicals, Drugs, and Biologicals. 15th ed. Cambridge, UK: Royal Society of Chemistry.
[PCPC] Personal Care Products Council. 2018. Cosmetic Ingredient Identification Database (International Cosmetic Ingredient Dictionary [INCI]). [accessed 2019 Jan 30].
Prosser RS, Lissemore L, Shahmohamadloo RS, Sibley PK. 2015. Effect of biosolids-derived triclosan and triclocarban on the colonization of plant roots by arbuscular mycorrhizal fungi. Sci Total Environ. 508: 427-434.
Prosser RS, Lissemore L, Solomon KR, Sibley PK. 2014. Toxicity of biosolids-derived triclosan and triclocarban to six crop species. Environ Toxicol Chem. 33(8):1840-1848.
PubChem [database]. 2004- . Bethesda (MD): US National Library of Medicine, National Center for Biotechnology Information. [accessed 2019 Mar 5].
Pycke BFG, Geer LA, Dalloul M, Abulafia O, Jenck AM, Halden RU. 2014. Human fetal exposure to triclosan and triclocarban in an urban population from Brooklyn, New York. Environ Sci Technol. 48(15):8831-8838.
Rocha BA, Asimakopoulos AG, Honda M, da Costa NL, Barbosa RM, Barbosa F, Kannan K. 2018a. Advanced data mining approaches in the assessment of urinary concentrations of bisphenols, chlorophenols, parabens and benzophenones in Brazilian children and their association to DNA damage. Environ Int. 116:269-277.
Rocha BA, de Oliveira ARM, Barbosa F. 2018b, A fast and simple air-assisted liquid-liquid microextraction procedure for the simultaneous determination of bisphenols, parabens, benzophenones, triclosan, and triclocarban in human urine by liquid chromatography-tandem mass spectrometry. Talanta. 183:94-101.
Sabourin L, Duenk P, Bonte-Gelok S, Payne M, Lapen DR, Topp E. 2012. Uptake of pharmaceuticals, hormones and parabens into vegetables grown in soil fertilized with municipal biosolids. Sci Total Environ. 431:233-236.
Sales Junior SF, Vallerie Q, de Farias Araujo G, Soares LOS, da Silva EO, Correia FV, Saggioro EM. 2020. Triclocarban affects earthworms during long-term exposure:Bbehaviour, cytotoxicity, oxidative stress and genotoxicity assessments. Environ Pollut. 267:115570.
Saravanabhavan G, Walker M, Guay M, Aylward L. 2014. Urinary excretion and daily intake rates of diethyl phthalate in the general Canadian population. Sci Total Environ. 500-501:191-198.
Satyro S, Saggioro EM, Veríssimo F, Buss DF, de Paiva Magalhães D, Oliviera A. 2017. Triclocarban: UV photolysis, wastewater disinfection, and ecotoxicity assessment using molecular biomarkers. Environ Sci Pollut Res. 24(19):16077-16085.
[SCCP] European Commission Scientific Committee on Consumer Products. 2005. Opinion on Triclocarban for uses other than as a preservative [PDF]. Colipa no. P29. SCCP/0851/04.
Scharpf LGJ, Hill ID, Maibach HI. 1975. Percutaneous penetration and disposition of triclocarban in man: body showering. Arch Environ Health. 30(1):7-14.
Schebb NH, Flores I, Kurobe T, Franze B, Ranganathan A, Hammock BD, Teh, SJ. 2011a. Bioconcentration, metabolism and excretion of triclocarban in larval Qurt medaka (Oryzias latipes). Aquat Toxicol. 105(3-4):448-454.
Schebb NH, Inceoglu B, Ahn KC, Morisseau C, Gee SJ, Hammock BD. 2011b. Investigation of human exposure to triclocarban after showering and preliminary evaluation of its biological effects. Environ Sci Technol. 45(7):3109-3115.
Schultz MM, Bartell SE, Schoenfuss HL. 2012. Effects of triclosan and triclocarban, two ubiquitous environmental contaminants, on anatomy, physiology, and behaviour of the fathead minnow (Pimephales promelas). Arch Environ Contam Toxicol. 63(1):114-124.
Sherburne JJ, Anaya AM, Fernie KJ, Forbey JS, Furlong ET, Kolpin DW, Dufty AM, Kinney CA. 2016. Occurrence of triclocarban and triclosan in an agro-ecosystem following application of biosolids. Environ Sci Technol. 50(24):13206-13214.
Shi Q, Zhuang Y, Hu T, Lu C, Wang X, Huang H, Du G. 2019. Developmental toxicity of triclocarban in zebrafish (Danio rerio) embryos. J Biochem Mol Toxicol. 33(5):e22289.
Sipahutar MK, Piapukiew J, Vangnai AS. 2018. Efficiency of the formulated plant-growth promoting Pseudomonas fluorescens MC46 inoculant on triclocarban treatment in soil and its effect on Vigna radiata growth and soil enzyme activities. J Hazard Mater. 344:883-892.
Sipahutar MK, Vangnai AS. 2017. Role of plant growth-promoting Ochrobactrum sp. MC22 on triclocarban degradation and toxicity mitigation to legume plants. J Hazard Mater. 329:38-48.
Smarr MM, Honda M, Kannan K, Chen Z, Kim S, Buck Louis GM. 2018. Male urinary biomarkers of antimicrobial exposure and bi-directional associations with semen quality parameters. Reprod Toxicol. 77:103-108
Smarr MM, Sundaram R, Honda M, Kannan K, Buck Louis GM. 2017. Urinary concentrations of parabens and other antimicrobial chemicals and their association with couples' fecundity. Environ Health Perspect. 125(4):730-736.
Snyder EH, O’Connor GA, McAvoy DC. 2010. Fate of 14-C triclocarban in biosolids-amended soils. Sci Total Environ. 408(13):2726-2732.
Snyder EH, O’Connor GA, McAvoy DC. 2011. Toxicity and bioaccumulation of biosolids-borne triclocarban (TCC) in terrestrial organisms. Chemosphere. 82(3):460-467.
Soap and Detergent Association. 2002. In vitro mammalian chromosome aberration test. Report no. 2002-01-TCC. [as cited in SCCP 2005].
Sood S, Choudhary S, Wang H-CR. 2013. Induction of human breast cell carcinogenesis by triclocarban and intervention by curcumin. Biochem Biophys Res Commun. 438(4):600-606.
Springborn Life Sciences Inc. 1987. Acute toxicity of 3,4,4’ Trichlorocarbanilide to amphipods (Gammarus fasciatus). Report no. 88-920008374.
Springborn Life Sciences Inc. 1988a. Static acute toxicity of TCC to ceriodaphnids. Report no. 88-920008511.
Springborn Life Sciences Inc. 1988b. Static acute toxicity of 3,4,4’ Trichlorocarbanilide to channel catfish (Ictalurus punctatus). Report no. 88-920008550.
Springborn Life Sciences Inc. 1988c. Static acute toxicity of 3,4,4’ Trichlorocarbanilide to fathead minnow (Pimephales promelas). Report no. 88-920008373.
Statistics Canada. 2004. Canadian Community Health Survey – Nutrition (CCHS). Detailed information for 2004 (Cycle 2.2). Ottawa (ON): Statistics Canada.
Tamura I, Kagota K, Yasuda Y, Yoneda S, Morita J, Nakada N, Kameda Y, Kimura K, Tatarazako N, Yamamoto H. 2013a. Ecotoxicity and screening level ecotoxicological risk assessment of five antimicrobial agents: triclosan, triclocarban, resorcinol, phenoxyethanol and p-thymol. J Appl Toxicol. 33(11):1222-1229.
Tamura I, Kimura K, Kameda Y, Nakada N, Yamamoto H. 2013b. Ecological risk assessment of urban creek sediments contaminated by untreated domestic wastewater: potential contribution of antimicrobials and a musk fragrance. Environ Technol. 34(9-12):1567-1575.
Tanoue R, Nomiyama K, Nakamura H, Kim J-W, Isobe T, Shinohara R, Kunisue T, Tanabe S. 2015. Uptake and tissue distribution of pharmaceuticals and personal care products in wild fish from treated-wastewater-impacted streams. Environ Sci Technol. 49(19):11649-11658.
Tarnow P, Tralau T, Hunecke D, Luch A. 2013. Effects of triclocarban on the transcription of estrogen, androgen and aryl hydrocarbon receptor responsive genes in human breast cancer cells. Toxicol In Vitro. 27(5):1467-1475.
Taulli TA, Hill JT, Pounds GW. 1977. High-pressure liquid chromatographic studies of TCC and metabolites in experimental animals and man. J Chromatogr Sci. 15(3-4):111-118.
TCC Consortium. 2002. High Production Volume (HPV) Chemical Challenge Program data availability and screening level assessment for triclocarban CAS No. 101-20-2. Report No. 201-14186A.
Torres T, Cunha I, Martins R, Santos MM. 2016. Screening the toxicity of selected personal care products using embryo bioassays: 4-MBC, propylparaben and triclocarban. Int J Mol Sci. 17(10):1762
Tugulea 2016. A national survey of disinfection by-products and selected drinking water contaminants in Canadian drinking water (2009-2010). Unpublished database. Ottawa (ON): Exposure and Biomonitoring Division, Health Canada.
[US EPA] United States Environmental Protection Agency. 2002. High Production Volume (HPV) Chemical Challenge Program Data Availability and Screening Level Assessment for Triclocarban [PDF]. 201-14186A. Prepared for the HPV Challenge Program by the Triclocarban Consortium.
[US EPA] United States Environmental Protection Agency. 2009. Targeted National Sewage Sludge Survey Statistical Analysis Report. Office of Water (4301T), Washington, DC. EPA-822-R-08-018.
[US EPA] United States Environmental Protection Agency. 2011. Exposure Factors Handbook: 2011 Edition. Washington (DC): US EPA, National Center for Environmental Assessment, Office of Research and Development. [accessed 2019 May 31].
[US FDA] United States Food and Drug Administration. 2016. Safety and Effectiveness of Consumer Antiseptics; Topical Antimicrobial Drug Products for Over-the-Counter Human Use. 21 CFR Part 310.
Viglino L, Prévost M, Suavé S. 2011. High throughput analysis of solid-bound endocrine disruptors by LDTD-APCI-MS/MS. J Environ Monit. 13(3):583-590.
Villeneuve DL, Jensen KM, Cavallin JE, Durhan EJ, Garcia-Reyero N, Kahl MD, Leino RL, Makynen EA, Wehmas LC, Perkins EJ, et al. 2017. Effects of the antimicrobial contaminant triclocarban, and co-exposure with the androgen 17ß-trenbolone, on reproductive function and ovarian transcriptome of the fathead minnow (Pimephales promelas). Environ Toxicol Chem. 36(1):231-242.
Vingskes AK, Spann N. 2018. The toxicity of a mixture of two antiseptics, triclosan and triclocarban, on reproduction and growth of the nematode Caenorhabditis elegans. Ecotoxicology. 27(4):420-429
Walters E, McClellan K, Halden RU. 2010. Occurrence and loss over three years of 72 pharmaceuticals and personal care products from biosolids-soil mixtures in outdoor mesocosms. Water Res. 44(20):6011-6020.
Wei L, Qiao P, Shi Y, Ruan Y, Yin J, Wu Q, Shao B. 2017. Triclosan/triclocarban levels in maternal and umbilical blood samples and their association with fetal malformation. Clin Chim Acta. 466:133-137.
Wester RC, Maibach HI, Surinchak J, Bucks DAW. 1985. Predictability of In Vitro Diffusion Systems: Effect of Skin Types and Ages on Percutaneous Absorption of Triclocarban. Dermatology. 6:223-226. [as cited in SCCP 2005].
[Wilson and Meridian] Wilson Scientific Consulting Inc. and Meridian Environmental Inc. 2015 [modified]. Critical review of soil ingestion rates for use in contaminated site human health risk assessments in Canada. Contractor report prepared for the Contaminated Sites Division, Safe Environments Programme, Health Canada: Ottawa (ON).
Wu Y, Beland FA, Fang JL. 2016. Effect of triclosan, triclocarban, 2,2',4,4'-tetrabromodiphenyl ether, and bisphenol A on the iodide uptake, thyroid peroxidase activity, and expression of genes involved in thyroid hormone synthesis. Toxicol In Vitro. 32:310-319.
Xia K, Hundal LS, Kumar K, Armbrust K, Cox AE, Granato TC. 2010. Triclocarban, triclosan, polybrominated diphenyl ethers, and 4-nonylphenol in biosolids and in soil receiving 33-year biosolids application. Environ Toxicol Chem. 29(3):597-605.
Xia M, Huang R, Shi Q, Boyd WA, Zhao J, Sun N, Rice JR, Dunlap PE, Hackstadt AJ, Bridge MF, et al. 2018. Comprehensive Analyses and Prioritization of Tox21 10K Chemicals Affecting Mitochondrial Function by in-Depth Mechanistic Studies. Environ Health Perspect. 126(7):077010.
Xie W, Zhang W, Ren J, Li W, Zhou L, Cui Y, Chen H, Yu W, Zhuang X, Zhang Z, et al. 2018. Metabonomics Indicates Inhibition of Fatty Acid Synthesis, β-Oxidation, and Tricarboxylic Acid Cycle in Triclocarban-Induced Cardiac Metabolic Alterations in Male Mice. J Agric Food Chem. 66(6):1533-1542.
Xu X, Lu Y, Zhang D, Wang Y, Zhou X, Xu H, Mei Y. 2015. Toxic assessment of triclosan and triclocarban on Artemia salina. Bull Environ Contam Toxicol. 95(6):728-733.
Yang L-H, Ying G-G, Su H-C, Stauber JL, Adams MS, Binet MT. 2008. Growth-inhibiting effects of 12 antibacterial agents and their mixtures on the freshwater microalga Pseudokirchneriella subcaptiata. Environ Toxicol Chem. 27(5):1201-1208.
Ye X, Kuklenyik Z, Needham LL, Calafat AM. 2006. Measuring environmental phenols and chlorinated organic chemicals in breast milk using automated on-line column-switching-high performance liquid chromatography-isotope dilution tandem mass spectrometry. J Chromatogr B Analyt Technol Biomed Life Sci. 831(1-2):110-115.
Ye X, Wong L-Y, Dwivedi P, Zhou X, Jia T, Calafat AM. 2016. Urinary Concentrations of the Antibacterial Agent Triclocarban in United States Residents: 2013−2014 National Health and Nutrition Examination Survey. Environ Sci Technol. 50(24):13548-13554.
Ye X, Zhou X, Furr J, Ahn KC, Hammock BD, Gray EL, Calafat AM. 2011. Biomarkers of exposure to triclocarban in urine and serum. Toxicology. 286(1-3):69-74.
Yin J, Wei L, Shi Y, Zhang J, Wu Q, Shao B. 2016. Chinese population exposure to triclosan and triclocarban as measured via human urine and nails. Environ Geochem Health. 38(5):1125-1135.
Ying G-G, Yu X-Y, Kookana RS. 2007. Biological degradation of triclocarban and triclosan in a soil under aerobic and anaerobic conditions and comparison with environmental fate modelling. Environ Pollut. 150(3):300-305.
Yun H, Liang DK, Li Z, Qi G, Wang A. 2017. Enhanced biotransformation of triclocarban by Ochrobactrum sp. TCC-1 under anoxic nitrate respirate conditions. Curr Microbiol. 74(4):491-498.
Zhou X, Ye X, Calafat AM. 2012. Automated on-line column-switching HPLC-MS/MS method for the quantification of triclocarban and its oxidative metabolites in human urine and serum. J Chromatogr B Analyt Technol Biomed Life Sci. 881-882:27-33.
Appendices
Appendix A. Summary of ecological data for triclocarban
| Test organism | Endpoint | Value (µg/L or µg/g dw unless otherwise stated) | Observations | Reference |
|---|---|---|---|---|
| Water flea (Daphnia magna) | 48h LC50 | 13 | N/A | EG&G Bionomics 1978c |
| Water flea (Daphnia magna) | 96h LC50 | 27.4 | N/A | Albanese et al. 2017 |
| Water flea (Daphnia magna) | 48h LC50 | 10–20 | N/A | TCC Consortium 2002 |
| Water flea (Daphnia magna) | 48h EC50 (immobilization) | 10 | N/A | Tamura et al. 2013a |
| Water flea (Daphnia magna) | 42d NOEC (reproduction) | 0.25 | N/A | Fan et al. 2019 |
| Water flea (Daphnia magna) | 21d NOEC (reproduction) | >0.25 but less than 0.50 | N/A | EG&G Bionomics 1978c |
| Water flea (Daphnia magna) |
21d LOEC (mortality and reproduction) 21d NOEC (mortality and reproduction) |
4.7 (LOEC) 2.9 (NOEC) |
N/A | TCC Consortium 2002 |
| Water flea (Daphnia similis) | 48h EC50 | 14 | N/A | Satyro et al. 2017 |
| Water flea (Ceriodaphnia dubia) | 48h EC50 | 3.1 | N/A | TCC Consortium 2002 |
| Water flea (Ceriodaphnia dubia) | 48h LC50 (survival) | 6.896 | N/A | Fan et al. 2019 |
| Water flea (Ceriodaphnia dubia) | 8d NOEC (growth) | 1.9 | N/A | Tamura et al. 2013a |
| Water flea (Ceriodaphnia dubia) | 7d NOEC (mortality and reproduction) | 1.46 | N/A | TCC Consortium 2002 |
| Water flea (Ceriodaphnia dubia) |
48h EC50 48h NOEC |
3.1 (EC50) 1.9 (NOEC) |
N/A | Springborn Life Sciences Inc. 1988a |
| Freshwater shrimp (Macrobrachium nipponense) | 96h LC50 (survival) | 261.6 | N/A | Fan et al. 2019 |
| Brine shrimp (Artemia salina) | 24h LC50 | 17.8 | N/A | Xu et al. 2015 |
| Mysid shrimp (Mysidopsis bahia) |
96h LC50 28d MATC |
15 0.06–0.12 |
N/A | EG&G Bionomics 1980 |
| Mysid shrimp (Mysidopsis bahia) |
24h LC50 48h LC50 72h LC50 96h LC50 |
42 30 21 13–15 |
N/A | TCC Consortium 2002 |
| Mysid shrimp (Mysidopsis bahia) | 28d EC50 (reproduction) | 0.209 | N/A | TCC Consortium 2002 |
| Mysid shrimp (Mysidopsis bahia) |
28d LOEC (mortality and reproduction) 28d NOEC (mortality and reproduction) |
0.12 (LOEC) 0.06 (NOEC) |
N/A | TCC Consortium 2002 |
| Mysid shrimp (Mysidopsis bahia) |
28d LOEC (reproduction) 28d NOEC (reproduction) |
0.125 (LOEC) 0.062 (NOEC) |
N/A | TCC Consortium 2002 |
| Mysid shrimp (Mysidopsis bahia) |
28d LOEC (growth) 28d NOEC (growth) |
0.500 (LOEC) 0.250 (NOEC) |
N/A | TCC Consortium 2002 |
| Rotifer (Brachionus koreanus) | 24h LC50 | 388 |
200 µg/L: population growth reduced 100 µg/L: oxidative stress Transcriptional regulation of detoxification, antioxidant and heat shock proteins resulting in changes in lifespan and fecundity |
Han et al. 2016 |
| Freshwater amphipod (Gammarus fasciatus) |
96h LC50 NOEC |
13 (LC50) 7.9 (NOEC) |
N/A | Springborn Life Sciences 1987 |
| Nematode (Caenorhabditis elegans) | 24h LC50 | 910 | 10 µg/L: reduction in brood size, delayed hatching | Lenz et al. 2017 |
| Midge larvae (Chironomid sp.) | 48h LC50 | 60–100 | N/A | TCC Consortium 2002 |
| Freshwater protozoan (Tetrahymena thermophila) | 24h EC50 (growth) | 295 |
1.0 µg/L: DNA damage 0.316 µg/L: downregulation of MXR gene expression 0.79 µg/L: inhibition of efflux transporter activities |
Gao et al. 2015 |
| Benthic midge (Paratanytarsus parthenogenetica) | 48h LC50 (mortality) | 96 | N/A | Monsanto 1980 |
| Benthic midge (Paratanytarsus parthenogenetica) | 48h LC50 | 67 | N/A | EG&G Bionomics 1979 |
| Nematode (Caenorhabditis elegans) | 96h EC50 (reproduction and growth) | 119 | N/A | Vingskes and Spann 2018 |
| Marine amphipod (Gammarus locusta) | 60d LOEC (biochemical markers) | 2.5 |
No impact seen in survival/growth/ reproduction at any concentration; monotonic response 0.1 µg/L: higher LPO levels in females compared to males 0.1 and 0.5 µg/L: significant CAT/GST activity 2.5 µg/L: similar or lower levels of CAT/GST compared to control; 65% increase in AChE for males and females |
Barros et al. 2017 |
| Benthic midge (Paratanytarsus parthenogenetica) | Lifecycle NOEC water exposure | 1.3–3.0 | N/A | Monsanto 1980 |
| Benthic midge (Paratanytarsus parthenogenetica) | 28d NOEC sediment exposure | 2.76–5.9 | N/A | Monsanto 1980 |
| Benthic midge (Paratanytarsus parthenogenetica) | Lifecycle NOEC food exposure (growth, emergence, reproduction, hatchability) | >85.5 | N/A | Monsanto 1980 |
| Benthic organism (Chironomus yoshimatsui) | 20d NOEC (emergence) | 2.5 ug/g | N/A | Tamura et al. 2013b |
| Buzzer midge (Chironomus plumosus) | 48h EC50 (immobilization) | 97.44 | N/A | Fan et al. 2019 |
| California blackworm (Lumbriculus variegatus) | 10d NOEC (mortality) | 100 (µg/g dw) | No mortality seen | Higgins et al. 2009 |
| Pond loach (Misgurnus anguillicaudatus) | 96h LC50 (survival) | 471.7 | N/A | Fan et al. 2019 |
| Japanese medaka (Oryzias latipes sinensis) | 96h LC50 (survival) | 1189 | N/A | Fan et al. 2019 |
| Japanese medaka (Oryzias latipes) | 96h LC50 | 85 | N/A | Tamura et al. 2013a |
| Japanese medaka (Oryzias latipes sinensis) | 28d LC10 (survival) | 32,73 | N/A | Fan et al. 2019 |
| Zebrafish (Danio rerio) | 9d NOEC (survival) | 24 | N/A | Tamura et al. 2013a |
| Zebrafish (Danio rerio) | 32 and 80 hours post-fertilization LOEC (mortality) | 350 | N/A | Torres et al. 2016 |
| Zebrafish (Danio rerio) |
96h LC10 96h LC50 |
147.5 (LC10) 215.8 (LC50) |
Observations noted at other concentrations: 133.3 µg/L- inhibition of thyroid hormone, altered expression of thyroid hormone responsive genes 6.7 µg/L - altered expression of proteins related to binding, metabolism, skeletal muscle development, nervous system development, and immune response |
Dong et al. 2018 |
| Zebrafish (Danio rerio) | 4 and 120h post-fertilization LOEC | 0.3–300 |
Increased mortality and malformation, delayed hatching, and reduced body length Impact on heart rate and expressions of cardiac development-related genes, altered gene expression involved in hormonal pathways |
Shi et al. 2019 |
| Silver catfish (Rhamdia quelen) | 96h post-fertilization (developmental abnormalities, biochemical markers related to oxidative stress response) |
0.1 6.3 |
Developmental abnormalities were observed at 0.1 and 6.3 µg/L, including facial/cranial, spinal and tail abnormalities Biochemical alterations related to oxidative stress were seen at 0.1 µg/L |
Gomes et al. 2020 |
| Channel catfish (Ictalurus punctatus) |
96h LC50 NOEC |
140 120 |
N/A | Springborn Life Sciences Inc. 1988b |
| Rainbow trout (Oncorhynchus mykiss) | 96h LC50 | 120 | N/A | TCC Consortium 2002 |
| Rainbow trout (Oncorhynchus mykiss) | 96h LC50 | 120 | N/A | EG&G Bionomics 1976 |
| Bluegill (Lepomis macrochirus) | 96h LC50 | 12 - 77 | N/A | TCC Consortium 2002 |
| Bluegill (Lepomis macrochirus) | 96h LC50 (dilution water total hardness at 100 µg/L CaCO3) | 77 | N/A | EG&G Bionomics 1978a |
| Bluegill (Lepomis macrochirus) | 96h LC50 (pH 6.0 dilution water) | 40 | N/A | EG&G Bionomics 1978b |
| Bluegill (Lepomis macrochirus) | 96h LC50 | 70 | N/A | EG&G Bionomics 1978d |
| Bluegill (Lepomis macrochirus) | 96h LC50 (dilution water total hardness at 250 µg/L CaCO3) | 78 | N/A | EG&G Bionomics 1978e |
| Bluegill (Lepomis macrochirus) | 96h LC50 (pH 8.0 dilution water) | 100 | N/A | EG&G Bionomics 1978f |
| Bluegill (Lepomis macrochirus) | 96h LC50 (at 30oC) | 47 | N/A | EG&G Bionomics 1978g |
| Bluegill (Lepomis macrochirus) | 96h LC50 | 97 | N/A | EG&G Bionomics 1976 |
| Fathead minnow (Pimephales promelas) |
96h LC50 NOEC |
92 54 |
N/A | Springborn Life Sciences Inc. 1988c |
| Fathead minnow (Pimephales promelas) |
22d NOEC 22d LOEC (reproduction) |
1 (NOEC) 5 (LOEC) |
1 µg/L: no effect on reproduction 5 µg/L: Reduced fecundity No effect on body mass or gonadosomatic index |
Villeneuve et al. 2017 |
| Fathead minnow (Pimephales promelas) |
12d LOEC (newly hatched larvae 21d LOEC (mature fish) |
1.6 1.6 |
Newly hatched larvae: minor changes in larval growth parameters and larval escape performance Mature fish: decrease in nest defense behaviour |
Schultz et al. 2012 |
| Chinese rare minnow (Gobiocypris rarus) | 96h LC50 (survival) | 110.3 | N/A | Fan et al. 2019 |
| Chinese rare minnow (Gobiocypris rarus) | 28d NOEC (survival) | 41.24 | N/A | Fan et al. 2019 |
| Green algae (Selenastrum sp.) |
5d LOEC 5d NOEC |
36 (LOEC) 30 (NOEC) |
Minimum algistatic concentration | TCC Consortium 2002 |
| Blue-green algae (Microcystis sp.) |
5d LOEC 5d NOEC |
>32 (LOEC) >32 (NOEC) |
Minimum algistatic concentration | TCC Consortium 2002 |
| Green algae (Pseudokirchneriella subcapitata) |
72h IC50 NOEC LOEC |
17 (IC50) <10 (NOEC) 10 (LOEC) |
Growth inhibition | Yang et al. 2008 |
| Green algae (Pseudokirchneriella subcapitata) | 72h EC50 | 29 | N/A | Tamura et al. 2013 |
| Green algae (Pseudokirchneriella subcapitata) | 72h NOEC | 5.7 | N/A | Tamura et al. 2013 |
| Green algae (Pseudokirchneriella subcapitata) | 72h IC50 | 319 | N/A | Satyro et al. 2017 |
| Green algae (Scenedesmus obliquus) | 96h EC50 (algal growth inhibition) | 9.11 mg/L | N/A | Lu et al. 2019 |
| Green algae (Chlorella pyrenoidosa) | 96h EC50 (algal growth inhibition) | 8.76 mg/L | N/A | Lu et al. 2019 |
| Green algae (Chlorella vulgaris) | 96h EC50 (algal growth inhibition) | 8.474 mg/L | N/A | Lu et al. 2019 |
| River biofilm community structure | 8 weeks (algal biomass/architecture and activity, and microbial community composition) | 10 |
Significant reduction in algal biomass Suppressed carbon utilization Community altered from autotrophic processes to heterotrophic processes Significant changes in community composition and bacterial communities |
Lawrence et al. 2009 |
| Sea urchin (Paracentrotus lividus) |
8 and 80 hours post-fertilization LOEC (larval length) |
0.64 | Decreased larval length, morphological abnormalities | Torres et al. 2016 |
| Freshwater New Zealand mudsnail (Potamopyrgus antipodarum) | 28d NOEC and LOEC (reproduction) |
0.1 (NOEC) 10 (LOEC) |
0.082 0.287 |
Geiss et al. 2016 |
| Freshwater New Zealand mudsnail (Potamopyrgus antipodarum) |
2–4 weeks NOEC LOEC EC10 EC50 |
0.5 (NOEC) 0.2 (LOEC) 0.5 (EC10) 2.5 (EC50) |
2.5 µg/L: embryo production stimulated | Giudice and Young 2010 |
| Chinese brown frog (Rana chensinensis) | 96h LC50 (survival) | 23.84 | N/A | Fan et al. 2019 |
| American bullfrog (Rana catesbeiana) | 48h cultured frog tadpole tail fin bioassay (thyroid hormone gene regulation) | 0.316 to 316 (10 nM to 1000 nM) |
No effect on TRß transcript levels at any exposure concentration RLK1 transcript levels decreased at 316 µg/L IHSP30 and CAT transcript levels increased at 316 µg/L Gh and Dio 1 transcript levels reduced at 316 µg/L Hsp70 transcript level reduced at 0.316 to 316 µg/L |
Hinther et al. 2011 |
| Earthworm (Eisenia foetida) | 31d LC50 (biosolids-amended soil) | 40 000 µg/kg (40 mg/kg) | No worm behavioral (e.g., coming to the soil surface, writhing, stiffening, elongation, pulsing, inactivity in a ball) or other pathological (e.g., surface lesions, mid-segmental swellings, ulcerated areas) effects were observed at any treatment level. Weight loss and reproductive effects were not monitored. | Snyder et al. 2011 |
| Earthworm (Eisenia andrei) |
72h LC50 (acute contact) 48h EC50 (avoidance test) |
3.3 mg/cm2 (LC50) 1.92 mg/kg (EC50) |
N/A | Sales Junior et al. 2020 |
| Earthworm (Eisenia andrei) |
45d cell viability 200 g soil added to 10 replicates with 30 mL of triclocarban solution at 1, 10, 50, and 100 mg/kg |
1 and 10 mg/kg |
A 44% reduction in earthworm cell viability was observed after 14 days of exposure to 10 mg/kg. An increase in the percentage of amoebocyte cells also occurred. Chronic exposure led to reduced CAT and GST activities, decreased GSH levels, and increased LPO in exposed organisms. DNA damage resulting from a 1 mg/kg dose was observed after 45 days. |
Sales Junior et al. 2020 |
| Red worm (Limnodrilus hoffmeisteri) | 96h LC50 (survival) | 10 622 | N/A | Fan et al. 2019 |
| Lettuce Corn | 65d (symbiosis: arbuscular mycorrhizal fungi with plant roots) | 0–0.304 (µg/g dw) | Colonization of crop plant roots by arbuscular mycorrhizal fungi were not inhibited. | Prosser et al. 2015 |
|
Soybean Lettuce Wheat |
Approx. 39–85d (depending on species; biosolids-amended soil) (seed emergence, growth) | 3.6–304 (µg/g dw) | Negligible effects | Prosser et al. 2014 |
| Soil microbial community | 31d (soil microbial community respiration, ammonification, and nitrification) | 6–717 (µg/g dw) | Negligible effects | Snyder et al. 2011 |
Abbreviations: N/A, not applicable; LC50, concentration of a substance that is estimated to be lethal to 50% of the test organisms; LOEC, lowest observed effect concentration is the lowest concentration in a toxicity test that caused a statistically significant effect in comparison to the controls; NOEC, no observed effect concentration is the highest concentration in a toxicity test not causing a statistically significant effect in comparison to the controls; EC50, concentration of a substance that is estimated to cause an effect on 50% of the test organisms; EC10, concentration of a substance that is estimated to cause an effect on 10% of the test organisms; CAT, catalase; GST, glutathione S-transferase; LPO, lipid peroxidation; AChE, acetylcholinesterase; MATC, maximum acceptable toxicant concentration; IC50, inhibitory concentration causing an effect on 50% of the test organisms.
| Test organism | Triclocarban concentration (duration, if applicable) | Bioaccumulation metric (L/kg unless otherwise indicated) | Reference |
|---|---|---|---|
| Medaka (Oryzias latipes) |
Lab reconstituted water 20 µg/L (24 h) |
BCF: 724 (TCC was oxidatively metabolized to sulfate and glucuronic acid conjugates) | Schebb et al. 2011a |
| Crucian carp (Carassius carassius) |
WWTS effluent 0.000023–0.000044 µg/ml |
Plasma BAF: <0.1–8.6 | Tanoue et al. 2015 |
| Green algae (Cladophora spp.) |
WWTS effluent 0.191 µg/L |
BAF: 1900 | Coogan and La Point 2008 |
| Green algae (Cladophora spp.) |
WWTS effluent 0.08–0.20 µg/L |
BAF: 1600–2700 | Coogan et al. 2007 |
| Water flea (Daphnia longispina-galeata resting eggs) |
Lake Greifensee (Switzerland) sediment 0.0024–0.0152 µg/g dw (120 h) |
BCF: 1240–82 900 | Chiaia-Hernandez et al. 2013 |
| California blackworm (Lumbriculus variegatus) |
Lab-spiked sediment 22.4 µg/g dw (56 days) |
BAF (wet weight): 1600–2200 | Higgins et al. 2009 |
| Earthworm (Eisenia foetida) |
Biosolids 707 µg/gdw (31 days) |
BAF (dry weight; gsoil/gtissue): 5.2–18 | Snyder et al. 2011 |
| Earthworm (Eisenia foetida) |
Biosolids 7.6 – 10.8 µg/g dw (28 days) |
BSAF (steady state; goc/glip): 0.22–0.71 | Higgins et al. 2011 |
| Earthworm (Eisenia foetida) |
Biosolids 4.94 µg/g dw |
BSAF (dry weight; goc/glip): 0.1–1.6 | Macherius et al. 2014 |
| Freshwater snail (Helisoma trivolvis) |
WWTS effluent 0.191 µg/L (2 weeks) |
BAF: 1600 | Coogan and La Point 2008 |
| Freshwater mussel (Lasmigona costata) |
WWTS effluent NA |
BAF (caged): 9975–45 538 | de Solla et al. 2016 |
| Clam (Corbicula fluminea) |
Spiked WWTS effluent 250 ng/L (14 days) |
BCF: 7943 | Ismail et al. 2014 |
| Mussel (Anodonta californiensis) |
Spiked WWTS effluent 250 ng/L (14 days) |
BCF: 7943 | Ismail et al. 2014 |
| Lettuce (Lactuca sativa) |
Irrigation water 0.35 µg/L |
RCF <10 (harvested at maturity) | Hyland et al. 2015 |
| Strawberry (Fragaria ananassa) |
Irrigation water 0.35 µg/L |
RCF <100 SCF <100 (harvested at maturity) |
Hyland et al. 2015 |
| Sweet corn (Zea mays) Carrot (Daucus carota) Tomato (Solanum lycopersicum) Potato (Solanum tuberosum) |
Biosolids 6.03 µg/g dw |
No uptake detected at harvest | Sabourin et al. 2012 |
|
biosolids→ soil→ earthworms→ deer mice (Peromyscus maniculatus)→ European starling eggs (Sturnus vulgaris)→ American kestrel eggs (Falco sparverius) |
Biosolids 1.25 µg/g ww |
BSAF (wet weight; ngoc/nglip): earthworm: 0.79 (estimated as earthworms not depurated) BSAF deer mouse liver: 0.20 BSAF starling egg: 0.25 BSAF kestrel egg: 0.05 |
Sherburne et al. 2016 |
Abbreviations: NA, not available; dw, dry weight; RCF, root concentration factor; SCF, shoot concentration factor; BSAF, biota-to-soil or sediment accumulation factor; BAF, bioaccumulation factor; BCF, bioconcentration factor; WWTS, wastewater treatment system; goc/glip, gram organic carbon/gram lipids; ngoc/nglip, nanogram organic carbon/nanogram lipids
Appendix B. Human exposure from environmental media and food
| Route of exposure | 0 to 5 moa (human milk-fed)b | 0 to 5 moa (formula-fed)c | 6 to 11 mod | 1 yre | 2 to 3 yrf | 4 to 8 yrg | 9 to 13 yrh | 14 to 18 yri | 19+ yrj |
|---|---|---|---|---|---|---|---|---|---|
| Ambient airk | NI | NI | NI | NI | NI | NI | NI | NI | NI |
| Indoor airl | NI | NI | NI | NI | NI | NI | NI | NI | NI |
| Drinking waterm | NA | 21.0 | 13.5 | 5.3 | 4.6 | 3.7 | 2.8 | 2.8 | 3.3 |
| Food and beveragesn | 80.3 | NI | 53.6 | 13.7 | 12.5 | 11.9 | 6.7 | 4.7 | 5.1 |
| Soilo | NA | NA | 0.05 | 0.05 | 0.02 | 0.02 | 0.01 | 0.001 | 0.001 |
| Dustp | 33.5 | 33.5 | 29.0 | 31.1 | 13.9 | 10.4 | 5.5 | 0.33 | 0.34 |
| Total intake | 113.8 | 54.5 | 96.0 | 50.1 | 31.1 | 26.0 | 15.1 | 7.8 | 8.7 |
Abbreviations: NA, not applicable; NI, data not identified in the literature
a Assumed to weigh 6.3 kg (Health Canada 2015), to breathe 3.7 m3 of air per day (US EPA 2011 [modified]), and to ingest 21.6 mg of dust per day (Wilson and Meridian 2015 [modified]). It is assumed that no soil ingestion occurs due to typical caregiver practices.
b Exclusively for human milk-fed infants, assumed to consume 0.744 L of human milk per day (Health Canada 2018a), where human milk is assumed to be the only dietary source. Triclocarban was not detected in human milk samples from 80 Canadian women at two to three months post-partum (Arbuckle et al. 2015); the LOD of 0.68 µg/L from this study was used to estimate an upper-bound exposure level.
c Exclusively for formula-fed infants, assumed to drink 0.826 L of water per day (Health Canada 2018a), where water is used to reconstitute formula. See footnote on drinking water for details.
d Assumed to weigh 9.1 kg (Health Canada 2015), to breathe 5.4 m3 of air per day (US EPA 2011 [modified]), to drink 0 L of water per day (Health Canada 2017), to ingest 7.3 mg of soil per day, and to ingest 27.0 mg of dust per day (Wilson and Meridian 2015 [modified]). Human milk-fed infants are assumed to consume 0.632 L of human milk per day (Health Canada 2018a). Formula-fed infants are assumed to drink 0.764 L of water per day (Health Canada 2018a), where water is used to reconstitute formula. See footnote on drinking water for details.
e Assumed to weigh 11.0 kg (Health Canada 2015), to breathe 8.0 m3 of air per day (US EPA 2011 [modified]), to drink 0.36 L of water per day (Health Canada 2017), to ingest 8.8 mg of soil per day, and to ingest 35.0 mg of dust per day (Wilson and Meridian 2015 [modified]).
f Assumed to weigh 15 kg (Health Canada 2015), to breathe 9.2 m3 of air per day (US EPA 2011 [modified]), to drink 0.43 L of water per day (Health Canada 2017), to ingest 6.2 mg of soil per day, and to ingest 21.4 mg of dust per day (Wilson and Meridian 2015 [modified]).
g Assumed to weigh 23 kg (Health Canada 2015), to breathe 11.1 m3 of air per day (US EPA 2011 [modified]), to drink 0.53 L of water per day (Health Canada 2017), to ingest 8.7 mg of soil per day, and to ingest 24.4 mg of dust per day (Wilson and Meridian 2015 [modified]).
h Assumed to weigh 42 kg (Health Canada 2015), to breathe 13.9 m3 of air per day (US EPA 2011 [modified]), to drink 0.74 L of water per day (Health Canada 2017), to ingest 6.9 mg of soil per day, and to ingest 23.8 mg of dust per day (Wilson and Meridian 2015 [modified]).
i Assumed to weigh 62 kg (Health Canada 2015), to breathe 15.9 m3 of air per day (US EPA 2011 [modified]), to drink 1.09 L of water per day (Health Canada 2017), to ingest 1.4 mg of soil per day, and to ingest 2.1 mg of dust per day (Wilson and Meridian 2015 [modified]).
j Assumed to weigh 74 kg (Health Canada 2015), to breathe 15.1 m3 of air per day (US EPA 2011 [modified]), to drink 1.53 L of water per day (Health Canada 2017), to ingest 1.6 mg of soil per day, and to ingest 2.6 mg of dust per day (Wilson and Meridian 2015 [modified]).
k No monitoring data for triclocarban in ambient (outdoor) air were identified, in Canada or elsewhere.
l No monitoring data for triclocarban in indoor air were identified, in Canada or elsewhere.
m A maximum value of 160.5 ng/L triclocarban in treated water from Canadian water treatment plants was reported (personal communication, email from the Environmental and Radiation Health Sciences Directorate, Health Canada, to the Consumer and Hazardous Products Safety Directorate, Health Canada, dated September 20, 2018; unreferenced).
n Food consumption rates are described in Health Canada 2015. The 90th percentile values provided by the Food Directorate were used, except for the 0- to 5-month-old formula-fed age band, which was suppressed due to small sample size, and the 6- to 11-month-old age band, which incorporated both human milk feeding and the 90th percentile food value. Sources and values for exposure to triclocarban via food are described in section 6.1.1 provided by the Food Directorate, Health Canada (personal communication, email from the Food Directorate, Health Canada, to the Consumer and Hazardous Products Safety Directorate, Health Canada, dated March 5, 2019; unreferenced).
o A mean value of 53 ng/g triclocarban was reported in agricultural soil in Quebec (Viglino et al. 2011).
p No monitoring data on house dust in Canada were identified. A maximum value of 9760 ng/g triclocarban was reported in a study of dust collected from athletic facilities and single-family detached homes in Oregon (Chen et al. 2018).
Page details
- Date modified: