
Consultation: Proposed Residential Indoor Air Quality Guidelines for Carbon Dioxide
Current status: Closed
Closed to new input on October 21, 2020.Purpose of consultation
The present document reviews the epidemiological, toxicological, and exposure research on carbon dioxide (CO2). The intent is to propose a new long-term exposure limit for CO2 in residential indoor air, which would minimize risks to human health, and recommend various risk mitigation measures to reduce exposure to CO2. The purpose of this consultation is to solicit comments on the proposed Residential Indoor Air Quality Guidelines (RIAQG) for CO2.
The proposed document aims to revisit the Exposure Guidelines for Residential Indoor Air Quality developed for CO2 published in 1987 by Health Canada, which set an acceptable long-term exposure range (ALTER) of ≤ 3500 ppm for CO2 in residential indoor air. Since the publication of these guidelines, new information has become available regarding potential health effects of exposure to elevated CO2 levels (particularly epidemiological and controlled human exposure studies) and indoor concentrations of CO2 in Canada.
The document proposes a long-term exposure limit of 1000 ppm (based on a 24-hour average) to protect against increased risk of symptoms including eye irritation, rhinitis, headaches and tiredness, as well as decreased performance on tasks and tests. Levels of CO2 in Canadian homes may be above the long-term exposure limit, and accordingly, Health Canada recommends that individuals take actions to reduce indoor levels of CO2 by ensuring adequate ventilation and controlling indoor sources.
This document is available for a 60-day public consultation period. Please send comments (with rationale, where required) to Health Canada:
or
Water and Air Quality Bureau, Health Canada
269 Laurier Avenue West, A.L. 4903B
Ottawa, ON K1A 0K9
All comments must be received before October 21, 2020.
It should be noted that this document may be revised following the evaluation of comments received, and RIAQG for CO2 will be established, if required. This document should be considered a draft for comment only.
Preamble
Health Canada assesses the health risks posed by specific indoor pollutants in residential environments and provides recommendations on how to reduce those risks. Residential Indoor Air Quality Guidelines (RIAQG) summarize the known health effects, pollutant sources, and exposure levels in Canadian homes and characterize the risks to health, based on the best scientific data available. Proposed exposure limits (also referred to as guideline values) for short- and/or long-term exposure to the pollutant are developed, representing indoor air concentrations below which health effects are unlikely to occur. The proposed exposure limits take into account the reference concentrations (RfC) for the pollutant and the feasibility of achieving such levels through control of indoor sources. The RIAQG also include recommendations for controlling sources or other actions to reduce exposure to the pollutant.
For some pollutants, a proposed exposure limit may not be developed, although the available scientific evidence justifies reducing Canadians' exposure to the pollutant. In this case, a guidance document that focuses on actions to control sources and reduce exposure is developed.
The RIAQG and guidance documents serve as a scientific basis for activities to evaluate and reduce the risk from indoor air pollutants including, but not limited to:
- assessments by public health officials of health risks from indoor air pollutants in residential or similar environments;
- performance standards that may be applied to pollutant-emitting materials, products, and devices, so that their normal use does not lead to air concentrations of pollutants exceeding the proposed exposure limits; and
- communication products informing Canadians of actions they can take to reduce their exposure to indoor air pollutants and to help protect their health.
The RIAQG and guidance documents replace a series of exposure limit values for indoor air pollutants from a report entitled Exposure Guidelines for Residential Indoor Air Quality (Health Canada 1987). In addition to updates for the substances included in the 1987 report, guidelines or guidance documents will be developed for other substances that are identified as having the potential to affect human health in the indoor environment.
The focus of this document is carbon dioxide (CO2). In the 1987 Health Canada publication Exposure Guidelines for Residential Indoor Air Quality, an acceptable long-term exposure range (ALTER) of ≤ 3500 ppm was set for CO2 in residential indoor air. This value was derived from the lowest concentration at which direct physiological adverse health effects (i.e., increased blood acidity) had been observed in humans after several weeks of continuous exposure, based on the health and toxicological literature available at that time. Since the publication of these guidelines, new information has become available regarding potential health effects of exposure to elevated CO2 levels (particularly epidemiological and controlled human exposure studies) and indoor air exposure in Canada.
Table of contents
- List of tables
- List of figures
- Executive summary
- 1.0 Physical and chemical characteristics
- 2.0 Sources in the air
- 3.0 Concentrations in indoor and outdoor air
- 4.0 Metabolism and pharmacokinetics
- 5.0 Health effects
- 6.0 Risk characterization
- 7.0 Proposed guidelines
- 8.0 References
- Appendix A: List of acronyms and abbreviations
- Appendix B: Human studies on the health effects of CO2 exposure
- Appendix C: International guidelines and standards for CO2
List of tables
- Table 1. Physical and chemical properties of CO2
- Table 2. Concentrations of CO2 in indoor and outdoor air in Canada
- Table 3. Health effects associated with increasing CO2 concentrations in human studies
- Table 4. Proposed long-term exposure limit for CO2 in indoor environments
- Table B1. Summary of controlled exposure studies
- Table B2. Summary of epidemiological studies
- Table C1. Some international standards and guidelines for CO2
List of figures
- Figure 1. Comparison of CO2 concentrations in Canadian homes to CO2 concentrations associated with health effects
- Figure 2. Comparison of CO2 concentrations in a limited number of Canadian schools and daycare centres to CO2 concentrations associated with health effects
Executive summary
Proposed Residential Indoor Air Quality Guidelines for CO2
| Exposure Limit | Concentration | Critical effect(s)Table a Footnote 1 | |
|---|---|---|---|
| mg/m3 | ppm | ||
Long-term (24 h) |
1800 |
1000 |
As CO2 increases, there may be an increased risk of:
|
|
|||
The proposed long-term exposure limit for CO2 is 1000 ppm (based on a 24-hour average).
Background
Carbon dioxide is an odourless, colourless, and non-flammable gas continuously generated indoors by the respiration of occupants. In 1987, Health Canada published Exposure Guidelines for Residential Indoor Air Quality, which set an acceptable long-term exposure range (ALTER) of ≤ 3500 ppm for CO2 in residential indoor air. This value was derived from the lowest concentration at which adverse health effects had been observed in humans in the published literature available at that time. Since the publication of these guidelines, new information has become available regarding potential health effects of exposure to elevated CO2 levels (particularly epidemiological and controlled human exposure studies) and indoor concentrations of CO2 in Canada. The 1987 exposure guideline for CO2 is therefore being revisited to reflect the most up-to-date science on health effects and indoor exposure levels for CO2.
The proposed RIAQG are intended to provide a proposed long-term indoor air exposure limit for CO2 which would minimize risks to human health. The guideline document also shows that levels in some Canadian homes may exceed the proposed exposure limits, and recommends various risk mitigation measures to reduce exposure to CO2.
Sources and Exposure
Natural sources of atmospheric CO2 include animal and plant respiration, organic matter decomposition, outgassing from water surfaces, forest fires, and volcanic eruptions. Carbon dioxide is constantly being removed from air by its direct absorption into water and by vegetation through photosynthesis. Anthropogenic sources of CO2 emissions include the combustion of fossil fuels, building heating and cooling, land-use changes including deforestation, and some industrial processes (ECCC 2015). Normal ambient outdoor ground-level CO2 concentrations in the range of 328 to 442 ppm have been reported in North America, Europe, Australia, and Japan (MacNeill et al. 2016; Muscatiello et al. 2015; Haverinen-Shaughnessy, Moschandreas and Shaughnessy 2011; Simoni et al. 2010; Ziska et al. 2001).
Indoors, CO2 is mainly produced through the respiration of occupants, but can also originate from other sources, such as unvented or poorly vented fuel-burning appliances and cigarette smoking. Given that Canadians spend approximately 90% of their time indoors (including 70% at home and 19% at other locations including schools) (Matz et al. 2014), the concentration of CO2 in the indoor environment is an important consideration for their health. The level of CO2 in indoor air is a function of the following three main factors: the outdoor CO2 concentration; indoor sources of CO2; and the rate of removal or dilution of indoor CO2 with outdoor air by ventilation.
Ventilation describes the movement of air into and out of houses and is one of the key strategies to maintain good indoor air quality. Ventilation can be characterized by an air exchange rate (AER) expressed in air changes per hour (ACH), where low AERs (and low ACH) indicate low ventilation. Residential ventilation may occur naturally by pressure differences between the inside and the outside of the house, opening windows and doors, or mechanically through the use of fans, ducting, and designed openings in the building envelope.
Due to an increased focus on reducing energy costs for heating and air conditioning, buildings in Canada have generally become more airtight. This change has led to decreasing AER in residences (Allen et al. 2016). As ventilation is the primary means of removal of CO2 from indoor environments, poorly ventilated homes or homes with unvented or poorly vented fuel-burning appliances may have elevated CO2 concentrations, especially if several occupants are present.
Indoor CO2 concentrations are often used as a surrogate for ventilation rate and as an indicator for other occupant-derived pollutant (bioeffluent) concentrations and odours. Many building standards and guidelines for CO2 were established based on target CO2 concentrations that would indicate adequate ventilation for occupant comfort with respect to bioeffluents (odours) and not on the health effects of CO2 (ASHRAE 2016; ANSES 2013).
Exposure data used in this assessment were collected by Health Canada as part of various indoor air research studies in Canadian residences from multiple cities across the four seasons as well as in a limited number of schools and daycare centres. Median CO2 levels measured in Canadian homes in six cities ranged from 418 to 729 ppm, and 95th percentiles from 477 to 1483 ppm (Mallach et al. 2017; Health Canada 2016, 2013, 2012; Health Canada and INSPQ 2015; Wheeler et al. 2011). Based on existing data, overall, CO2 levels measured in on-reserve First Nations homes in Ontario and Manitoba and in Inuit communities in Nunavut were higher than those measured in other Canadian residences, with median and 95th percentiles ranging from 1058 to 1139 ppm, and from 2121 to 2436 ppm, respectively (Health Canada 2018a, 2007a; Weichenthal et al. 2012; Kovesi et al. 2007). Carbon dioxide levels measured in a limited number of schools and daycare centres fell within the range of residential values (MacNeill et al. 2016; St-Jean et al. 2012).
Health Effects
Human studies
Much of the human health literature explored CO2 exposure concentrations well above what would be expected indoors under normal circumstances (< 3000 ppm). However, some studies of prolonged or repeated exposure to CO2 explored exposure concentrations relevant to Canadian indoor environments. For example, mucous membrane or respiratory symptoms (e.g., eye irritation, sore or dry throat, stuffy, congested or runny nose, sneezing, and coughing) were more likely to be reported by individuals exposed to CO2 concentrations > 800 ppm than individuals exposed to lower CO2 levels (Tsai, Lin and Chan 2012; Norbärk et al. 2011). Carbon dioxide concentrations > 1000 ppm were associated with a higher risk of experiencing rhinitis (sneezing, or a runny or blocked nose) (Simoni et al. 2010). Other studies under controlled conditions or in school or office environments showed associations between increased prevalence of neurophysiological symptoms and elevated CO2 concentrations. Carbon dioxide levels > 984 ppm were associated with a lack of concentration (da Conceição Ferreira and Cardoso 2014) and those > 1500 ppm with increased prevalence of headaches, dizziness, heavy headedness, and tiredness (Myhrvold, Olsen and Lauridsen 1996). Lu et al. (2015) and Muscatiello et al. (2015) reported increased odds of experiencing neurophysiological symptoms with increased CO2 levels.
Associations between increasing CO2 concentration, starting at 1000 ppm (or decreased ventilation rate where that was the metric) and decreased performance in school or office settings (e.g., decision-making, task performance, standardized test scores) have also been observed (Mendell et al. 2016; Petersen et al. 2016; Dorizas, Assimakopoulos and Santamouris 2015; Haverinen-Shaughnessy and Shaughnessy 2015; Toftum et al. 2015; Bako-Biro et al. 2012; Twardella et al. 2012; Coley Greeves and Saxby 2007; Wargocki and Wyon 2007a, 2007b; Shaughnessy et al. 2006; Federspiel et al. 2004; Myhrvold, Olsen and Lauridsen 1996). Bioeffluents (i.e., contaminants generated by the human body, including volatile organic compounds) may also contribute to symptom reporting and task performance (Zhang et al. 2017; Allen et al. 2016). However, Allen et al. (2016) found ventilation rate and CO2 concentration to be independently associated with cognitive test performance and reported that on average a 400 ppm increase in CO2 (from a background concentration of 550 ppm) was associated with a 21% decrease in a typical participant's test score. Furthermore, effects on decision-making or task performance were observed for exposures to CO2 concentrations ≥ 1000 ppm relative to 600 ppm in studies conducted under controlled conditions (i.e., pure CO2 injected into a laboratory or chamber) (Satish et al. 2012).
Toxicological studies
Animal studies regarding short-term exposures to CO2 (at levels ranging from 50 000 to 350 000 ppm) reported adverse effects on the respiratory system as well as neurological, reproductive, and developmental effects (Schwartz et al. 2010; Sanna et al. 1992; Krystal et al. 1989; Nagai et al. 1987; VanDemark, Schanbacher and Gomes 1972; Schaefer et al. 1971; Grote 1965; Schaefer, Avery and Bensch 1964; Haring 1960).
With respect to longer term exposures (to CO2 levels up to 150 000 ppm), respiratory effects observed were minor lung changes, and abnormalities and changes in olfactory sensitivity and sensory cells in the nose (Hacquemand et al. 2010; Buron et al. 2009; Schaefer et al. 1979; Niemoleler and Schaefer 1962). Developmental effects included changes in the characteristics of the alveoli and gene regulation for lung development (Ryu et al. 2010; Das et al. 2009; Li et al. 2006). Changes in neuron excitability, indications of progressive neuropathy, and increased terminal deoxynucleotidyl transferase deoxyuridine triphosphate (dUTP) nick end labelling (TUNEL)-positive hippocampal cells have been observed in neonatal mice (Das et al. 2009; Gu et al. 2007; Gu, Xue and Haddad 2004). Changes in hormonal and enzymatic activity, increased apoptosis in hippocampus as well as impaired memory and learning, and increased anxious behaviour were also reported in rats (Kiray et al. 2014).
Vulnerable and susceptible populations
Indigenous people may be considered more vulnerable to the health effects of CO2, as crowding and inadequate ventilation have been identified as characteristics of First Nations and Inuit housing in certain communities (CMHC 2019, 2005; Statistics Canada 2017; Health Canada 2007b; Kovesi et al. 2007). Individuals living in low income housing are also considered to be more vulnerable to the health effects of air pollution in general, as they are more likely to live in homes with poor conditions.
Infants and children are also considered a vulnerable population, as they may be exposed to elevated indoor CO2 levels in environments outside of their home, such as schools and daycare centres. In addition, because of their size, children inhale more air in relation to their body weight than adults. Infants and children may also be more susceptible than adults to the health effects of air contaminants due to differences in their ability to metabolize, detoxify, and excrete contaminants, and because they undergo rapid growth and development (Suk, Murray and Avakian 2003; Faustman et al. 2000).
Individuals with pre-existing health conditions (such as allergies and asthma) were found to be more susceptible to the mucous membrane and respiratory effects of CO2 than those without these conditions (Erdmann and Apte 2004). Patients suffering from panic disorder were found to be more susceptible to the anxiogenic effects of CO2 compared to healthy subjects (Atli, Bayin and Alkin 2012; Roberson-Nay et al. 2010; Pine et al. 2000; Beck, Ohtake and Shipherd 1999; Antony, Brown and Barlow 1997; Woods et al. 1988). Due to the physiological and metabolic actions of CO2 in the body, it is expected that individuals with cardiovascular conditions may also be more susceptible to the health effects of elevated CO2 exposure.
Derivation of the proposed long-term exposure limit
Studies in school or office environments have shown associations between increases in CO2 levels and the odds of experiencing mucous membrane or respiratory symptoms (e.g., eye irritation, sore or dry throat, stuffy, congested or runny nose, sneezing, coughing, or rhinitis); an increased prevalence of neurophysiological symptoms (such as headache, tiredness, fatigue, dizziness or difficulty concentrating); and decreased performance (e.g., decision-making, task performance, standardized test scores).
There are significant limitations to the available human studies examining associations between health effects and CO2 concentrations relevant to indoor exposure (≤ 3000 ppm) (see section 5.3 for details), and no causality can be determined. However, despite database deficiencies and issues with the data collection and analysis of many of the human studies, available studies suggest a trend of increasing odds of symptoms with increasing indoor CO2 concentration.
No individual study was considered strong enough on its own to be selected as the basis for an exposure limit, however, taken as a whole, the database indicates that there are health benefits to reducing indoor CO2 concentrations, and that 1000 ppm could be considered a suitable exposure limit. This level is in line with the American Society of Heating, Refrigerating and Air-Conditioning Engineers (ASHRAE) standard, as well as other standards from other countries. It should be noted that these other existing standards use CO2 as a surrogate for comfort and overall indoor air quality, and were not derived based on direct health effects. Therefore, the proposed long-term exposure limit for CO2 is 1000 ppm.
When comparing a measured CO2 concentration with the long-term exposure limit, the sampling time should be at least 24 hours.
Risk Management Recommendations
Measured data confirms there are Canadian homes, schools, and daycare centres in which the proposed exposure limit for CO2 is exceeded. Therefore, there may be an increased risk of respiratory symptoms, decreased test performance, headaches, dizziness and tiredness. Based on existing data, on-reserve First Nations homes located in Ontario and Manitoba and in Inuit communities in Nunavut are more likely to have measured levels of CO2 that are above the proposed exposure limit than other Canadian homes.
The primary source of CO2 in Canadian homes is occupant respiration, and other sources include unvented or poorly vented fuel-burning appliances and cigarette smoking. In most residential situations, identifying potential sources of CO2 and reduction measures is more informative and cost-effective for improving indoor air quality than air testing and comparing measured concentrations to the proposed exposure limit. Therefore, Health Canada recommends that individuals take actions to reduce indoor levels of CO2 by ensuring adequate ventilation and controlling indoor sources. These strategies include the following:
- increasing natural ventilation by opening windows (taking into consideration ambient air quality);
- ensuring fuel-burning appliances are in good working order and properly vented;
- setting the mechanical ventilation system to a higher setting or letting it run longer;
- running the kitchen range hood exhaust fan when cooking;
- using the furnace fan or, if necessary, a separate fan or air supply to make sure air is distributed throughout the home;
- avoiding the use of unvented fuel-burning appliances (e.g., space heaters) indoors;
- not smoking indoors; and
- avoiding overcrowded living situations, if possible.
In terms of implementation of CO2 reduction strategies, specifically increased ventilation, ambient air quality must be considered. During periods of poor ambient air quality, such as those experienced during forest fire events, reducing air intake and thus infiltration of ambient air pollutants may be more beneficial from a health risk perspective, compared to reducing indoor CO2 levels to below the proposed exposure limit. The information contained within this document may be used to inform the development of additional scenario-specific CO2 exposure limits.
1.0 Physical and chemical characteristics
Carbon dioxide is a colourless, odourless, and non-flammable gas. At normal atmospheric temperatures and pressures, CO2 is a gas heavier than air, with a density of approximately one and a half times that of air. Carbon dioxide is relatively stable and inactive; however, it will react with water to form carbonic acid (H2CO3) (refer to section 4.1). Due to its small molecular size, CO2 diffuses readily through biological membranes and dissolves readily in aqueous solutions, including body fluids (Harper, Rodwell and Mayes 1979). Some of its physical and chemical properties are summarized in Table 1 (PubChem).
| Property | Value | Chemical Structure |
|---|---|---|
Molecular formula |
CO2 |
 |
Molecular weight |
44.01 g/mol |
|
CAS registry number |
124-38-9 |
|
Density |
1.976 g/L at 0 °C and 760 mm Hg |
|
Water solubility |
Miscible in water (2000 mg/L) as well as in hydrocarbons and most organic liquids |
|
Boiling point |
-78.464 °C at 101.3 kPa (sublimes) |
|
Common synonyms |
Carbonic acid gas, dry ice |
|
Conversion factors |
|
2.0 Sources in the air
2.1 Outdoor Sources
Natural sources of atmospheric CO2 include animal and plant respiration, organic matter decomposition, outgassing from water surfaces, forest fires, and volcanic eruptions. Carbon dioxide is constantly being removed from the air by its direct absorption into water and by vegetation through photosynthesis (ECCC 2015).
Anthropogenic sources of CO2 emissions include the combustion of fossil fuels, building heating and cooling, land-use changes including deforestation, and some industrial processes (ECCC 2015). The combustion of fossil fuels (e.g., power generation, transportation, and industry) is the main anthropogenic source of CO2 emissions in Canada. The National Inventory Report 1990–2016: Greenhouse Gas Sources and Sinks in Canada indicates that Canada's emissions of CO2 were about 559 megatonnes in 2016, and that CO2 emissions are the largest contributor to total greenhouse gas emissions (accounting for 79% of total emissions in 2016). Over the 2005–2016 period, national total greenhouse gas emissions have decreased by 3.8% in Canada (ECCC 2018).
2.2 Indoor Sources
The primary indoor source of CO2 is exhaled air from the occupants of the indoor space (Kiray et al. 2014). An average person will produce approximately 15 L/hr of CO2 at rest and approximately 45 L/hr of CO2 during moderate activity (Sundell 1982). The relative contribution of the occupants' respiration to indoor CO2 levels depends on the number of people in the building, their level of physical activity, the volume of air per person, and the length of time spent in the building (Bureau of Chemical Hazards 1985). Thus, indoor settings with greater occupant density (e.g., schools, office buildings, and daycare centres) are considered to be more likely to experience elevated CO2 levels, particularly if ventilation is inadequate.
Health Canada exposure data collected from homes in Ottawa, Edmonton, Halifax, Montreal, Quebec, and the Annapolis Valley (Health Canada 2016, 2013, 2012; Health Canada and INSPQ 2015; Wheeler et al. 2011) showed that an increase in CO2 levels correlated with an increase in the number of occupants, although this trend was not always statistically significant (Health Canada 2018b). In studies in Quebec (winter) and Halifax (winter), marginally higher levels of CO2 were also observed in households with pets (Health Canada and INSPQ 2015; Health Canada 2012). Other sources of CO2 in indoor air include unvented or poorly vented fuel-burning appliances (e.g., gas stoves, space heaters, water heaters, and furnaces) and cigarette smoking.
Properly vented (and maintained) water heaters and furnaces are not expected to release significant amounts of CO2 into the indoor environment. However, fuel-burning appliances may vent gases directly into the house if the air pressure indoors is less than that outdoors (e.g., in tightly sealed buildings or with the use of exhaust fans from other appliances pumping air outside, such as a dryer) (IEC Beak Consultants Ltd. 1983). Furthermore, poorly located vents may result in the re-entry of emissions (e.g., through windows, doors, and small cracks in the outside walls).
The use of a gas stove or a fuel-burning space heater can have a significant impact on indoor CO2 levels. Peak CO2 concentrations of up to 3000 ppm were measured in homes with a gas stove (Singer et al. 2017; Traynor 1984; Traynor et al. 1983). Similarly, the mean levels of CO2 were higher in the kitchens of homes during cooking with a gas stove as compared to an electric appliance (906 ppm vs. 744 ppm, respectively) (Willers et al. 2006). Marginal increases in the geometric mean concentrations of CO2 were observed with the daily use of a stove or oven (Health Canada 2018b) for homes in Edmonton (winter) or Halifax (summer), but no similar association was observed in other Health Canada studies (Wheeler et al. 2011; Health Canada 2013, 2012).
Carbon dioxide levels of up to 4500 ppm have been measured in homes during the use of kerosene space heaters (Hanoune and Carteret 2015; Richie and Oatman 1983; Traynor et al. 1983). Hanoune and Carteret (2015) investigated the indoor air quality of seven homes using kerosene space heaters and reported that all events of indoor CO2 levels > 1000 ppm observed could be attributed to combustion sources (i.e., kerosene heaters, gas stove cooking, or smoking). They indicated that the use of kerosene heaters was at the origin of all CO2 levels > 2500 ppm. They also found CO2 concentrations correlated with the duration of use of the space heaters. Whitmyre and Pandian (2018) conducted a probabilistic analysis to estimate the impact of vent-free gas heating appliances on indoor air pollutant concentrations in energy-efficient homes in the United States. Predicted CO2 concentrations (i.e., 50–100th percentile values estimated using the American Gas Association Research Division vent-free gas appliance model) ranged from 398 to 2147 ppm.
Cigarette smoking is also considered a source of CO2 in indoor air. The contribution of CO2 from two cigarettes smoked in a one-hour period (in a 40 m3 room with a ventilation rate of 0.5 air changes per hour [ACH]) was estimated to range from 9 to 27 ppm (Bureau of Chemical Hazards 1985). Halios et al. (2005) investigated the concentration of indoor pollutants, including CO2, generated by smoking in a controlled environment and reported that smoking (i.e., 10 cigarettes smoked in a six-hour period) increased indoor CO2 concentrations by up to 4-fold compared to the baseline level, reaching approximately 1900 ppm CO2. However, the study design does not make it possible to determine what proportion of the CO2 increase is attributable to smoking alone, as opposed to other sources such as the respiration of occupants.
2.2.1 Ventilation
Ventilation describes the movement of air into or out of houses and is one of the key strategies to maintaining good indoor air quality. Ventilation can be characterized by an air exchange rate (AER) expressed in ACH, where low AERs (and low ACH) indicate low ventilation.
Residential ventilation may occur naturally or mechanically. Natural ventilation is caused by pressure differences between the inside and the outside of the house, allowing movement of air through the building envelope (e.g., exterior walls, foundations, roof, windows, and doors). Mechanical ventilation is created through the use of fans, ducting, and designed openings in the building envelope (e.g., exhaust fans, clothes dryer exhausts, range hoods, and heat or energy recovery ventilators) (Health Canada 2018c).
Due to an increased focus on reducing energy costs for heating and air conditioning, buildings in Canada have generally become more airtight. This change has led to decreasing AER in residences (Allen et al. 2016). Air exchange rates also depend on other factors such as the presence of a mechanical ventilation system, use of exhaust fans, geographic location, season, and weather conditions as well as the extent to which windows and doors are opened. As ventilation is the primary means of removal of CO2 from indoor environments, poorly ventilated homes or homes with unvented or poorly vented fuel-burning appliances may have elevated CO2 concentrations, especially if several occupants are present (Health Canada 2018c).
Indoor CO2 concentrations are often used as a surrogate for ventilation rate and as an indicator for other occupant-derived pollutant (bioeffluent) concentrations and odours. It is in this context that many building standards and guidelines for CO2 were established (i.e., they are not based on the intrinsic health effects of CO2). For example, the American Society of Heating, Refrigerating and Air-Conditioning Engineers (ASHRAE) standard on ventilation for acceptable indoor air quality recommends maintaining indoor CO2 levels at no greater than 700 ppm above ambient levels to indicate adequate ventilation for occupant comfort with respect to bioeffluents. As the outdoor CO2 level is assumed to range between 300 and 500 ppm, the indoor air concentration of CO2 should be maintained below 1000 ppm (ASHRAE 2016). Similarly, other countries including France, Norway, Germany, Portugal, Korea, and Japan have established standards or guidelines for CO2 of 600 to 1000 ppm, based on general air quality rather than direct health effects. More details on international guidelines for CO2 can be found in Appendix C.
3.0 Concentrations in indoor and outdoor air
Canadian indoor and outdoor exposure concentrations of CO2 are presented in Table 2.
3.1 Outdoor Concentrations
In a Health Canada study, the median and 95th percentiles of average hourly CO2 concentrations measured outside of 4 schools located in Ottawa were 419 and 532 ppm, respectively (MacNeill et al. 2016) (see Table 2). In the published literature, normal ambient outdoor ground-level CO2 concentrations in the range of 328 to 442 ppm have been reported in the United States, Europe, Australia, and Japan (Muscatiello et al. 2015; Haverinen-Shaughnessy, Moschandreas and Shaughnessy 2011; Simoni et al. 2010; Ziska et al. 2001).
3.2 Indoor Concentrations
Results from the Canadian Human Activity Pattern Survey 2 indicate that Canadians spend approximately 90% of their time indoors (Matz et al. 2014), most of which (70%) is indoors at home, with less time (19%) spent at other indoor locations such as schools, public buildings, offices, factories, stores, and restaurants. Therefore, the concentration of CO2 in the indoor environment is an important consideration for the health of Canadians.
The level of CO2 in indoor air is a function of the following three main factors: the outdoor CO2 concentration; indoor sources of CO2; and the rate of removal or dilution of indoor CO2 with outdoor air by ventilation.
The concentrations of CO2 in Canadian homes, schools, and daycare centres reported in Heath Canada studies and the published literature are summarized in Table 2.
The median hourly average CO2 concentrations measured in Canadian residences located in Ottawa, Edmonton, Halifax, Montreal, Quebec, and the Annapolis Valley ranged from 418 to 729 ppm (Mallach et al. 2017; Health Canada 2016, 2013, 2012; Health Canada and INSPQ 2015; Wheeler et al. 2011). Measured 95th percentiles for hourly average CO2 concentrations ranged from 477 to 1483 ppm. Where residential measurements were taken in different seasons (i.e., Edmonton and Halifax), the winter indoor median average hourly CO2 concentrations were approximately 80 to 160 ppm higher than those measured in summer. As these Health Canada studies collected data from over 200 households in six cities across Canada in both summer and winter, they are considered to be the most recent and most representative data available for quantifying long-term levels of indoor exposure to CO2 in Canadian single-family homes.
Based on existing data, CO2 levels measured during winter in on-reserve First Nations homes located in Ontario and Manitoba and in Inuit communities in Nunavut were higher than those measured during winter in other Canadian residences, with median and 95th percentile hourly average CO2 concentrations ranging from 1058 to 1139 ppm, and from 2121 to 2436 ppm, respectively (Health Canada 2018a, 2007a; Weichenthal et al. 2012). Mean and maximum CO2 levels of 1358 ppm and 2327 ppm, respectively, were reported in another study measuring CO2 concentrations in 49 homes located in the Qikiqtaaluk (Baffin) Region in Nunavut (Kovesi et al. 2007).
Limited Health Canada data are available on CO2 concentrations in schools and daycare centres. A study conducted by Health Canada measured indoor and outdoor CO2 concentrations in four Ottawa elementary schools during school hours (MacNeill et al. 2016). The median and 95th percentiles of measured hourly average CO2 concentrations in the schools were 491 and 1171 ppm, respectively. Another Health Canada study measuring CO2 concentrations during operational hours in 21 daycare centres located in Montreal found that the mean CO2 concentration was 1333 ppm (standard deviation of 391) (St-Jean et al. 2012). The presence of a mechanical ventilation system and a large surface of play area per child were each significantly associated with lower CO2 levels; together they accounted for 44% of the variance in indoor CO2 concentrations.
The available Health Canada data on CO2 concentrations in schools and daycare centres are not expected to be representative of all of Canada. Therefore, data in the published literature on CO2 levels in Canadian schools and daycare centres were also considered. In the greater Montreal area, minimum, mean, and maximum CO2 levels of 861, 1505, and 2442 ppm, respectively, were measured during the winter of 1989 in 91 daycare centres, with 70% of these centres exceeding CO2 concentrations of 1000 ppm and 13% exceeding 2500 ppm (Daneault, Beausoleil and Messing 1992). Dionne and Soto (1990) also reported CO2 concentrations exceeding 1000 ppm in four daycare centres located in the Montreal area.
In order to better characterize exposure of Canadians to CO2 in schools and daycare centres, data from other countries were also considered. The CO2 concentrations reported in schools and daycare centres in Canada are within the ranges reported internationally in the public literature (Mendell et al. 2016; Dorizas, Assimakopoulos and Santamouris 2015; Muscatiello et al. 2015; da Conceição Ferreira and Cardoso 2014; Gaihre et al. 2014; Fromme, Bischof et al. 2013; Fromme, Lahrz et al. 2013, Norbäck, Nordström and Zhao 2013; Clausen et al. 2012, Myhrvold, Olsen and Lauridsen 1996), although it is recognized that climate, ventilation, and building characteristics could vary substantially.
No indoor CO2 exposure concentrations were found in Health Canada studies or in the published literature for emergency situations such as emergency shelters, which involve the non-routine use of municipal infrastructure. However, since the primary source of indoor CO2 is exhaled air from the occupants, and emergency shelters are likely to have high occupant density, it is anticipated that these environments may be more likely to experience elevated CO2 levels. This is particularly true if the ventilation is inadequate or if the outdoor air supply needs to be reduced or eliminated (i.e., to prevent outdoor air pollutants from entering the shelter, such as during a wildfire). In addition, an elevated outdoor air CO2 concentration could result in an increased indoor CO2 concentration from ventilation or infiltration in homes or emergency shelters.
| Location | Season | Average hourly concentration (ppm) | Reference | |||||||
|---|---|---|---|---|---|---|---|---|---|---|
| No. homes/ schools/ daycare centres | No. of samples | Mean | Minimum | Median | 75th percentile | 95th percentile | Maximum | |||
| Indoor – Residential | ||||||||||
| Edmonton, Alberta | Summer | 48 | 7992 | 612 | 321 | 537 | 715 | 1085 | 2160 | Health Canada (2013) |
| Winter | 32 | 5339 | 750 | 396 | 696 | 848 | 1258 | 2608 | ||
| Montreal, Quebec | Winter | 44 | 7301 | 813 | 407 | 729 | 948 | 1483 | 2000 | Health Canada and INSPQ (2015) |
| Ottawa, Ontario | Winter | 44 | 7396 | 688 | 407 | 658 | 760 | 995 | 2000 | |
| Quebec, Quebec | Winter | 46 | 7111 | 772 | 362 | 705 | 931 | 1338 | 2000 | |
| Halifax, Nova Scotia | Summer | 50 | 8253 | 695 | 294 | 623 | 775 | 1211 | 2691 | Health Canada (2012) |
| Winter | 50 | 8179 | 758 | 397 | 705 | 868 | 1201 | 2409 | ||
| Ottawa, Ontario | Fall | 2 | 48 | 421 | 388 | 418 | 440 | 477 | 485 | Health Canada (2016) |
| Ottawa, Ontario | Winter | 29 | 7900 | 679 | 372 | 667 | 771 | 930 | 2042 | Mallach et al. (2017) |
| Annapolis Valley, Nova Scotia | Winter | 32 | 2339 | 809 | 447 | 658 | 848 | 1282 | 10 000 | Wheeler et al. (2011) |
| Swan Lake, Manitoba | Winter | 20 | 8541 | 1248 | 393 | 1114 | 1546 | 2436 | 3828 | Weichenthal et al. (2012) |
| Nunavut | Winter | 18 | 1995 | 1225 | 395 | 1139 | 1451 | 2121 | 3739 | Health Canada (2007a) |
| Sioux Lookout, Ontario | Winter | 46 | 5792 | 1138 | – | 1058 | 1355 | 2140 | 4479 | Health Canada (2018a) |
| Qikiqtaaluk Region, Nunavut | Winter | 49 | 49 | 1358 (SD: 531) |
– | – | – | – | 2327 (SD: 1068) |
Kovesi et al. (2007) |
| Indoor – Schools or daycare centres | ||||||||||
| Ottawa, Ontario | Fall | 4 | 4736 | 583 | 338 | 491 | 610 | 1171 | 2750 | MacNeill et al. (2016) |
| Montreal, Quebec | Winter | 21 | – | 1333 (SD: 391) |
723 | – | – | – | 2252 | St-Jean et al. (2012) |
| Montreal, Quebec | Winter/ Spring |
91 | 1672 | 1505 | 861 | – | – | – | 2442 | Daneault, Beausoleil and Messing (1992) |
| Outdoor | ||||||||||
| Ottawa, Ontario (outside of schools) |
Fall | 4 | 5313 | 523 | 294 | 419 | 453 | 532 | 5047 | MacNeill et al. (2016) |
4.0 Metabolism and pharmacokinetics
4.1 Respiration
Carbon dioxide enters the body from the atmosphere through the lungs via external respiration. It is also formed in cells as an end-product of aerobic metabolism (i.e., internal or cellular respiration) (Guyton 1982). Following its production in the body, CO2 diffuses from tissue cells into the surrounding capillaries and is carried by the blood bound to hemoglobin or dissolved as CO2, carbonic acid or bicarbonate (HCO3-) ion, or as minor amounts of carbamino compounds (Guais et al. 2011).
Dissolved CO2 in the blood undergoes hydration in erythrocytes to form H2CO3, which then dissociates into hydrogen ions (H+) and HCO3- (Guais et al. 2011). This mechanism is represented by the following chemical reaction:
CO2 + H2O ↔ H2CO3 ↔ H+ + HCO3-
This reaction can interfere with the body's acid-base balance, as shown by the Henderson-Hasselbalch equation (Guais et al. 2011):
pH = pK + log (HCO-/CO2)
Under normal conditions, the partial pressure of CO2 in pulmonary capillary blood of approximately 6.75% (or 45 mm Hg) is greater than that in alveolar air (6% or 40 mm Hg). Thus, the gas is able to pass freely through the alveolar membrane into exhaled air by passive diffusion as there is a partial pressure gradient between blood and air in the alveoli (Guais et al. 2011).
4.2 Chemical Control of Respiration
Multiple sites in the brainstem (central chemoreceptors) and in the carotid and aortic bodies (peripheral chemoreceptors) are CO2/H+-chemosensitive (i.e., highly sensitive to changes in the concentration of either blood CO2 or H+ (Jiang et al. 2005; Lahiri and Forster 2003). Excess CO2 or H+ in the blood stimulates the respiratory centre in the brainstem, resulting in increased respiration and elimination of CO2 via exhalation. Increased respiration also removes H+ from the blood because of the decreased blood H2CO3 (Guyton 1982). An increase of the partial pressure of CO2 in arterial blood (PaCO2) as small as 0.015% (1 mm Hg) results in increased respiration (Jiang et al. 2005).
4.3 Responses to Elevated CO2 Levels in the Blood
As the CO2 concentration in air increases, the CO2 concentration gradient between blood and alveolar air decreases. Since less CO2 can diffuse into pulmonary alveoli from the blood during each breath, blood CO2 concentrations increase with increased exposure duration. Hypercapnia (or hypercarbia) defines the condition where there is too much CO2 in the blood (i.e., PaCO2 > 6.75% or > 45 mm Hg) (Guais et al. 2011).
The physiological responses of the body to an elevation of CO2 levels in blood depend on the duration of exposure to and the concentration of CO2.
Respiratory regulation
The elevation of CO2 levels in blood has a very strong short-term effect on respiratory control. Within seconds after PaCO2 increases (PaCO2 [increase]/pH [decrease]), central and peripheral chemoreceptors become stimulated and induce an increase in breathing depth (tidal volume) and breathing rate. This effect reaches its peak within about one minute and then declines over the following days (Guyton 1982).
Renal/cellular regulation
When the body is unable to expel excess CO2, the excess is converted to H+ and HCO3-, thus raising the body's concentration of H+ and decreasing the body's pH, which may result in acute or chronic acidosis (i.e., pH < 7.35). In addition to the respiratory regulation discussed above, the excess H+ can be neutralized by cellular buffering (occurring within minutes to hours) or renal compensation (occurring over three to five days) (Guais et al. 2011). Renal regulation of the blood pH is very active during chronic exposure to CO2 concentrations greater than 30 000 ppm in air, but occurs more slowly and is less effective during chronic exposure to CO2 concentrations below 30 000 ppm (Guais et al. 2011).
Bone buffering
As mentioned above, renal regulation of CO2-mediated acidosis is less effective when CO2 concentrations are below 30 000 ppm for a long period of time. At this level, bone buffering has been postulated to be the primary compensatory mechanism (Bureau of Chemical Hazards 1985). Drummer et al. (1998) investigated the effects of prolonged exposure to elevated CO2 concentrations on calcium metabolism in human subjects, and observed decreases in serum calcium concentrations and biomarkers of bone formation as well as mild bone resorption (as indicated by the excretion rate of deoxypyridinoline) at 12 000 ppm CO2.
5.0 Health effects
This section provides a brief summary of the health effects of inhaled CO2 in humans (see section 5.1) as well as relevant toxicological studies in experimental animals (see section 5.2). It focuses primarily on studies that examined the effects of relevant CO2 exposure concentrations (i.e., expected indoors under normal circumstances as seen in section 3.2). Studies examining the effects of CO2 at higher concentrations were also considered as they may be relevant to atypical exposure scenarios such as emergency shelters. Relevant information is drawn from a previous review of the health effects of inhalation exposure to CO2 conducted by Health Canada when developing the 1987 Exposure Guidelines for Residential Indoor Air Quality (Bureau of Chemical Hazards 1985). Relevant publications identified from a search of the literature published between 1986 and 2017 where inhalation was the route of exposure were also considered.
5.1 Effects in Humans
A summary of relevant studies on health effects in humans following prolonged or repeated exposure to CO2 is presented in Table B1 (controlled exposure studies) and Table B2 (epidemiological studies) in Appendix B.
5.1.1 Effects on blood chemistry
A decrease in blood pH (acidosis) was observed in subjects continuously exposed to elevated CO2 concentrations (i.e., 7000 to 15 000 ppm for a minimum of 20 days) in studies conducted in a submarine environment (Schaefer 1982; Messier et al. 1979; Schaefer et al. 1963). The ALTER for CO2 in residential indoor air of ≤ 3500 ppm was derived by Health Canada (1987) from the lowest concentration at which this effect had been observed in humans (i.e., 7000 ppm) after the application of an uncertainty factor of 2 for database uncertainties.
5.1.2 Respiratory effects
A number of epidemiological studies have investigated the relationship between respiratory effects and CO2 concentrations in indoor settings such as schools and office environments. Most of these studies used self-reporting symptom surveys to measure the adverse effects, with only two using clinical tests in addition to those surveys (Norbärk et al. 2011; Simoni et al. 2010). Half of the studies did not control for exposures to other pollutants, while others controlled for exposures to certain pollutants (e.g., particulate matter [PM], volatile organic compounds [VOCs], ozone, nitrogen dioxide) (Dorizas, Assimakopoulos and Santamouris 2015; Lu et al. 2015; Tsai, Lin and Chan 2012; Kim et al. 2011; Simoni et al. 2010).
Associations between CO2 concentration and respiratory and mucous membrane symptoms have been reported (Dorizas, Assimakopoulos and Santamouris 2015; Lu et al. 2015; Carreiro-Martins et al. 2014; Tsai, Lin and Chan 2012; Norbärk et al. 2011; Simoni et al. 2010; Erdmann and Apte 2004; Apte, Fisk and Daisey 2000; Myhrvold, Olsen and Lauridsen 1996). Effects such as eye irritation, sore or dry throat, stuffy, congested or runny nose, sneezing, and coughing were more likely to be reported by individuals exposed to CO2 concentrations > 800 ppm than by those exposed to lower CO2 levels (Tsai, Lin and Chan 2012; Norbärk et al. 2011). Carbon dioxide concentrations > 1000 ppm were associated with a higher risk of experiencing rhinitis (sneezing or a runny or blocked nose) (Simoni et al. 2010). Some authors have reported that a 100 ppm increase in CO2 concentration or in differential CO2 (i.e., the difference between indoor and outdoor CO2 concentrations) can increase the odds of experiencing various respiratory or mucous membrane symptoms (e.g., dry eyes, sore throat, nose/sinus symptoms, tight chest, sneezing, coughing, wheezing, and rhinitis) (Lu et al. 2015; Kim et al. 2011; Simoni et al. 2010; Erdmann and Apte 2004; Apte, Fisk and Daisey 2000).
Building-related symptoms include ocular, respiratory (e.g., nose or throat irritation, rhinitis, cough), and general (e.g., fatigue and headache) symptoms that are temporally related to time spent in a building, particularly offices (Burge 2004; Erdmann and Apte 2004). Carbon dioxide concentrations are generally considered a surrogate for other occupant-derived pollutant (bioeffluent) concentrations and ventilation rates in these studies. Individuals with certain health conditions (such as allergies and asthma) were found to be more likely to report experiencing building-related symptoms (sometimes referred to as sick building syndrome) than those without these conditions (Erdmann and Apte 2004).
Acute inhalation exposure to CO2 levels between 50 000 and 80 000 ppm decreases specific airway conductance (Tashkin and Simmons 1972) and was reported to cause respiratory symptoms (Maresh et al. 1997). Acute inhalation exposure to higher concentrations of CO2 produces nasal irritation (> 350 000 ppm) (Wise, Wysocki and Radil 2003) and can cause asphyxia (700 000 ppm) due to displacement of oxygen (Hill 2000).
Infants of mothers who smoked or misused substances during pregnancy were found to have a dampened ventilatory response and a lower increase in central respiratory drive in response to hypercapnia (i.e., induced by exposure to 20 000 and 40 000 ppm CO2) in the immediate newborn period compared with control subjects (Ali et al. 2014).
5.1.3 Neurological effects
A number of studies investigated the neurophysiological effects or effects on performance (e.g., decision-making, proofreading) in adults exposed to varying CO2 concentrations under controlled conditions. In these studies (discussed below), pure CO2 was injected into the room or chamber or the ventilation was adjusted to achieve specific occupant-generated CO2 concentrations.
Satish et al. (2012) studied decision-making performance under elevated CO2 concentrations (generated via injection of pure CO2) in an office-like chamber for 2.5 hours. A computer-based program called the Strategic Management Simulation (SMS) test was used to measure nine scales of decision-making performance. Effects on decision-making performance were observed for CO2 exposure at 1000 ppm compared to 600 ppm. Under similar conditions, Kajtar and Herczeg (2012) investigated the effects of CO2 concentration on some physiological parameters, subject comfort, and task performance via two series of experiments in a laboratory setting (70-minute exposure). Effects on subject comfort, task performance, and level of mental effort required to complete a task were observed at CO2 concentrations of 3000 ppm compared to 600 ppm. It is important to note that both of these studies were conducted with a small number of subjects (i.e., 10–22 individuals).
Other studies investigated the effects of variation in ventilation on perceived air quality, sick building syndrome symptoms, and task performance. Wargocki et al. (2000) reported improved task performance (i.e., text typing) with increasing ventilation (and corresponding decrease in CO2 concentration). In the experiment, CO2 levels under the various ventilation conditions ranged from 195 to 1266 ppm above outdoor levels, while other parameters, including total volatile organic compounds (TVOC), remained constant (275-minute exposure).
In some controlled exposure experiments, variations in ventilation affected TVOC levels and bioeffluents (i.e., compounds generated by the human body, including VOCs such as acetone and acetaldehyde) (Tsushima, Wargocki and Tanabe 2018; Tang et al. 2016) as well as CO2. Allen et al. (2016) simulated indoor environmental quality conditions in "green" (low VOC) and "conventional" (elevated VOC) office buildings with varying ventilation rates and CO2 levels (CO2 concentrations ranged from 550 to 1400 ppm; 8-hour exposure). The impacts on performance on nine cognitive function tests were evaluated using the SMS test. Ventilation rate and CO2 concentration were found to be independently associated with cognitive test performance. After adjustment for participants, it was estimated that a 400 ppm increase in CO2 was associated with a 21% decrease in a typical participant's test score and a 20 cubic feet per minute increase in ventilation rate was associated with an 18% increase in these scores. Volatile organic compound levels were also independently associated with performance on the cognitive tests.
Other authors have studied the effects of ventilation on perceived air quality, sick building syndrome symptoms, and cognitive performance and reported neurophysiological symptoms (e.g., headaches and sleepiness) or decreased performance under lower ventilation conditions for 4 hours (Maula et al. 2017; Vehviläinen et al. 2016; Maddalena et al. 2015). However, based on the study designs or uncontrolled conditions (e.g., variation in TVOCs, other bioeffluents, PM or relative humidity), it cannot be determined whether the effects observed resulted from the variation in CO2 or in any other parameters.
Zhang et al. (2017) explored the effects of exposure to CO2 with or without bioeffluents on symptoms reporting and task performance (255-minute exposures). Exposures to bioeffluents with CO2 at 3000 ppm reduced perceived air quality and increased the intensity of reported headache, fatigue, sleepiness, and difficulty in thinking clearly (compared to 500 ppm CO2). Exposure to 3000 ppm CO2 with bioeffluents also decreased speed of addition, increased response time in redirection, and decreased the number of correct linkages in a Tsai-Partington test for cue-utilization capacity. No statistically significant effects on perceived air quality, acute health symptoms or cognitive performance were seen during exposures of up to 3000 ppm CO2 without bioeffluents. Based on those findings, the authors suggested that CO2 alone did not affect task performance or symptoms to the same extent as bioeffluents.
Several epidemiological studies investigated the relationship between neurophysiological symptoms or academic/work performance and CO2 concentrations in schools and office environments. It is important to note that as the majority of these studies did not control for exposures to other pollutants (whose levels tend to be highly correlated with those for CO2), it is difficult to determine the direct effects of CO2 alone.
Associations between increased CO2 concentrations and increased prevalence of self-reported neurophysiological symptoms (such as headache, tiredness, fatigue, dizziness or difficulty concentrating) or increased risk of experiencing these symptoms have been reported (Dorizas, Assimakopoulos and Santamouris 2015; Lu et al. 2015; Muscatiello et al. 2015; da Conceição Ferreira and Cardoso 2014; Norbäck, Nordström and Zhao 2013; Myhrvold, Olsen and Lauridsen 1996). In addition, da Conceição Ferreira and Cardoso (2014) found an association between lack of concentration and CO2 levels of > 984 ppm (maximum reference level according to Portuguese law), compared to levels < 984 ppm, while Myhrvold, Olsen and Lauridsen (1996) reported an association between increased prevalence of headache, dizziness, heavy headedness, tiredness, and difficulty concentrating and CO2 levels > 1500 ppm, compared to < 1500 ppm. Other studies reported increased odds of experiencing neurophysiological symptoms for every 100 ppm rise in indoor CO2 levels (Lu et al. 2015; Muscatiello et al. 2015).
Increased CO2 concentrations have also been associated with decreased performance in school and office settings (e.g., lower standardized test results, power of attention or task performance speed) (Dorizas, Assimakopoulos and Santamouris 2015; Coley, Greeves and Saxby 2007; Wargocki and Wyon 2007a, 2007b; Myhrvold, Olsen and Lauridsen 1996). Several studies also reported associations between decreased ventilation rates in monitored classrooms or offices (estimated in most studies from CO2 measurements) and poorer academic or work performance (Mendell et al. 2016; Petersen et al. 2016; Haverinen-Shaughnessy and Shaughnessy 2015; Bako-biro et al. 2012; Haverinen-Shaughnessy, Moschandreas and Shaughnessy 2011; Wargocki and Wyon 2007a, 2007b; Shaughnessy et al. 2006; Federspiel et al. 2004).
Neurological effects, such as reported headache, fatigue, visual impairment, and difficulty concentrating as well as temporarily increased cerebral blood flow velocity (which gradually decreased) have been reported in studies investigating the effects of prolonged exposure to high concentrations of CO2 (i.e., 1 to 30 days at CO2 concentration between 6000 and 45 000 ppm) (Carr 2006; Manzey and Lorenz 1998; Sliwka et al. 1998; Radziszewski, Giacomoni and Guillerm 1988; Sinclair, Clark and Welch 1969). Acute inhalation exposure to high concentrations of CO2 (i.e., 17 000 to 80 000 ppm) has been shown to decrease depth perception (Sun, Sun and Yang 1996) and the ability to detect motion (Yang, Sun and Sun 1997). Symptoms such as tingling in the extremities, dizziness, and blurred or distorted vision have also been reported (Maresh et al. 1997).
Cerebrovascular reactivity (increased blood flow velocity) to hypercapnia has been observed in all blood vessels studied except the superior mesenteric artery (Miyaji et al. 2015; Sato et al. 2012). Dynamic cerebral autoregulation (i.e., maintenance of blood flow during changes in blood pressure) is also reduced (Ogoh et al. 2014). Increased anxiety and panic-like response have also been reported (Nillni et al. 2012; Pappens et al. 2012; Bailey et al. 2005), those suffering from panic or separation anxiety disorder being more likely to react and/or react more severely to CO2 exposure than those that do not (Atli, Bayin and Alkin 2012; Roberson-Nay et al. 2010; Pine et al. 2000; Beck, Ohtake and Shipherd 1999; Antony, Brown and Barlow 1997; Woods et al. 1988). At very high concentrations (> 150 000 ppm), CO2 is known to cause loss of consciousness and convulsions (Bove and Davis 2004). Inhalation of 350 000 ppm CO2 (one or two breaths) was found to activate the hypothalamus-pituitary-adrenal axis in the subjects and cause significant cardiovascular (increase of blood pressure) and psychological (anxiogenic) effects (Argyropoulos et al. 2002), and panic attacks in some individuals (Muhtz et al. 2010).
5.1.4 Cardiovascular effects
Vehviläinen et al. (2016) investigated the physiological and functional effects of indoor CO2 concentrations in four healthy male subjects in a meeting room located in an office building under ventilated and non-ventilated conditions, for 4 hours. Increases in blood CO2 concentration, changes in heart rate variability, and increased peripheral blood circulation were measured in participants in the non-ventilated room (CO2 concentrations of 2756 ± 1100 ppm). The observed changes were associated with concomitant increases in concentrations of CO2, VOCs, and PM as well as with increased temperature and relative humidity. As the data analysis did not control for confounders (i.e., other pollutants), it cannot be determined whether the effects observed resulted from the increase in CO2 or in the other parameters, or from a combination of factors.
Zhang, Wargocki and Lian (2017) explored the effects of CO2 and bioeffluents on physiological parameters. Four-hour exposures to CO2 at 3000 ppm without bioeffluents (obtained by adding pure CO2 to the outdoor air supply) resulted in higher end-tidal CO2 and heart rate compared to the reference CO2 condition (500 ppm; obtained from outdoor air supply only). Exposures to 1000 and 3000 ppm CO2 with bioeffluents (obtained by restricting ventilation) significantly increased diastolic blood pressure and reduced nasal peak flow compared to their pre-exposure levels, and increased heart rate compared to exposure to 500 ppm CO2. Based on the study results, the authors suggested that CO2 alone did not affect symptoms to the same extent as bioeffluents did.
Cardiovascular effects of prolonged inhalation exposure to elevated CO2 concentrations (7000 or 12 000 ppm for 23 days) in humans include reduced diffusing capacity for carbon monoxide (CO) and a fall in cardiac output (Sexton et al. 1998), increased ventilation (air exchange between the environment and the lungs) (Elliot et al. 1998; Hoffmann et al. 1998), and temporarily increased heart and respiratory rates (Gundel, Drescher and Weihrauch 1998).
Symptoms such as increased blood pressure and heart rate, heart palpitations, and chest pressure have been reported following acute inhalation exposure to CO2 (50 000 to 80 000 ppm) (Bailey et al. 2005; Maresh et al. 1997). Cooper et al. (1970) investigated the effects of inhalation of 50 000 ppm CO2 on stroke patients with and without hypertension, and reported a rise in systemic and pulmonary arterial blood pressure and in cardiac work in subjects exposed to CO2. At very high concentrations (300 000 ppm), CO2 is associated with clinically significant cardiac arrhythmia and significant but transient cardiopulmonary morbidity (Halpern et al. 2004; McArdle 1959).
5.1.5 Carcinogenic effects
No studies on the carcinogenic potential of inhaled CO2 in humans were identified in the literature.
5.2 Toxicological Studies
5.2.1 Respiratory effects
Acute inhalation exposure to CO2 (127 000–150 000 ppm for 1–6 hours) in rodents has been observed to cause an increase in lamellar bodies in alveolar lining cells, congestion, edema, and haemorrhage in lung tissue (Schaefer, Avery and Bensch 1964) as well as an inflammatory response in the lungs (Schwartz et al. 2010). Acute exposure at higher levels has been found to depress respiration, and cause posthypercapneic hypotension as a result of decreased cardiac output (at 500 000 ppm CO2) and complete respiratory and circulatory cessation (at 800 000–1 000 000 ppm CO2) (Ikeda et al. 1989).
With respect to longer term exposure (at CO2 levels ranging from 10 000 to 30 000 ppm), respiratory effects included minor lung changes (Schaefer et al. 1979) and abnormalities (such as incomplete expansion of part of the lung and hyaline membrane formation) (Niemoleler and Schaefer 1962). Statistically significant effects on the olfactory sensitivity to pheromone and the nasal structure (e.g., changes in the cell number and thickness of the vomeronasal or olfactory epithelium, a reduction in the mitotic activity of the basal epithelium cells, and an increase of mature olfactory neurons) were also observed in female mice exposed to 30 000 ppm CO2 for four weeks (for 5 h/day or 12 h/day for 5 days/week) (Hacquemand et al. 2010; Buron et al. 2009). The changes observed in the epithelium thickness suggested the effect was dependent on exposure duration.
5.2.2 Neurological effects
Toxicological studies investigating the neurological effects of CO2 exposure or its effects on the developing brain, albeit at very elevated exposure concentrations, support a line of evidence for effects reported in the epidemiological literature, in which those exposed to elevated CO2 levels indicated increased sleepiness and decreased neurocognitive performance. Possible modes of action could involve inhibitory effects of CO2 on the gamma-aminobutyric acid (GABAA) receptor (Sanna et al. 1992) and sodium ion (Na+) channel (Gu et al. 2007, see section 5.2.3) activity, both of which reduce neuronal activity.
Acute inhalation exposure to high levels of CO2 (i.e., 75 000 to 350 000 ppm) was found to reduce the function of the GABAA -ionophore receptor complex in various brain areas of rats (Sanna et al. 1992) and increase plasma levels of free norepinephrine metabolite (MHPG), growth hormone, prolactin, and cortisol in monkeys (Krystal et al. 1989). In addition, the findings of a study conducted by Itoh, Yoshioka and Kennotsu (1999) suggest that hypercapnia (induced in anaesthetized and artificially ventilated Wistar rats exposed to 130 000 ppm CO2 in inspired air) may suppress hippocampal synaptic transmission and its long-term potentiation.
Additional studies on the effects of CO2 on the developing brain are described in section 5.2.3.
5.2.3 Reproductive/developmental effects
Few studies have examined the reproductive and developmental effects of CO2 at relevant exposure concentrations. A series of experiments were conducted to investigate the neurological, reproductive, and developmental effects of inhalation exposure to CO2 concentrations ranging from 1000 to 25 000 ppm in rats—that is, a range-finding study (Hardt, James, Gut and Gargas 2011), a 28-day exposure study which included post-exposure mating (Hardt, James, Gut, Mcinturf, et al. 2011), and a 98-day, two-generation study modeled after the 1998 United States Environmental Protection Agency test guidelines for Reproduction and Fertility Effects (Hardt et al. 2015). The study results showed no reproductive or developmental effects and no adverse changes to estrous cycles or reproductive hormones. Neurotoxicity endpoints were also examined; there were no effects in motor activity or maze tests, and although there were some differences in pup distress vocalization and maternal retrieval in the 28-day study, the results were not consistent or dose-related.
Studies published prior to 1987 demonstrated that short-term exposure to very elevated concentrations of CO2 (i.e., 50 000 to 350 000 ppm) may result in reproductive (degenerative changes in testes, tubular disturbances, effects on spermatogenesis) and developmental (cardiac and skeletal malformations, increased tissue and cellular maturation in the lungs) effects in experimental animals (Nagai et al. 1987; VanDemark, Schanbacher and Gomes 1972; Schaefer et al. 1971; Grote 1965; Haring 1960). Developmental effects such as neovascularisation of the retina (Holmes et al. 1998, 1997; Holmes, Leske and Zhang 1997; Holmes, Duffner and Kappil 1994) and changes in the characteristics of the alveoli and gene regulation for lung development (Ryu et al. 2010; Das et al. 2009; Li et al. 2006) have also been reported in other neonatal rodent studies exploring the effects of exposure to high levels of CO2 (i.e., 60 000 to 100 000 ppm CO2).
Kiray et al. (2014) studied the effects of lower CO2 exposure on brain development (i.e., on the hippocampus, prefrontal cortex, and amygdala). They exposed rats to air containing 500 (control), 1000 or 3000 ppm CO2 in utero during the entire pregnancy and up to postnatal day 38 (adolescence). They reported statistically significant changes in hormonal and enzymatic activity, increased apoptosis in hippocampus as well as increased anxious behaviour and impaired memory and learning in pups. The study findings suggest a dose-dependent effect of CO2 on memory and learning. However, due to errors noted and limited information on the study protocol, the reliability of these findings are questionable.
Tachibana et al. (2013) exposed rat pups (7-day-old) to 130 000 ppm CO2 (for 2–4 hours), and studied hippocampal function at 10 weeks of age via learning ability (Morris water maze test) and long-term potentiation induction and paired-pulse responses in the hippocampus. Impaired induction of long-term potentiation in the synapses of the cornu ammonis 1 area was observed and paired-pulse responses of population spikes increased significantly in CO2-exposed rats, which suggest decreased recurrent inhibition in the hippocampus. The authors indicated that these long-lasting modifications in hippocampal synaptic plasticity may contribute to the learning impairments associated with perinatal hypoxic hypercapnia and acidosis. Spatial reference learning ability was also observed to be delayed, but the memory was retained after learning took place.
Gu, Xue and Haddad (2004) and Gu et al. (2007) found that exposure to elevated CO2 concentrations (75 000–120 000 ppm) can have an effect on the excitability of neurons in neonatal mice (as indicated by statistically significant changes to neuron properties); this effect was dependent on the duration and the level of CO2 exposure. Their investigation indicated that the difference in excitability observed at 120 000 ppm CO2 was related to a reduction of types I and III Na+ channel expression. Das et al. (2009) observed that exposure to 80 000 ppm CO2 resulted in a statistically significant increase in TUNEL-positive hippocampal cells, an indicator of apoptosis, necrosis or generalized deoxyribonucleic acid (DNA) injury compared to control conditions as well as a statistically significant increase in the expression of specific apoptotic mediators.
5.2.4 Cardiovascular effects
Thom et al. (2017) showed that mice exposed for two hours to 2000 or 4000 ppm CO2 had elevated neutrophil and platelet activation and diffuse vascular injury compared to controls.
5.2.5 Carcinogenicity and genotoxicity
No relevant studies on the carcinogenic potential of inhaled CO2 in experimental animals were identified in the literature. The few published in vivo animal studies examining a possible carcinogenic effect of CO2 were not considered relevant to this assessment as they used extremely high concentrations (450 000–1 000 000 ppm), and protocols involved exposure by intraperitoneal insufflation or in vitro tissue exposure followed by transplantation (ANSES 2013, Guais et al. 2011).
In vitro, some studies have shown that high CO2 concentrations (80 000–120 000 ppm) can promote division or proliferation in lung cells; and in bacteria, at concentrations as low as 40 to 1000 ppm, CO2 increased DNA damage and mutations caused by reactive oxygen species (ANSES 2013; Guais et al. 2011).
5.3 Summary of Health Effects
Epidemiological studies looking at CO2 concentrations and health effects in school or office environments showed that mucous membrane or respiratory symptoms (e.g., eye irritation, sore or dry throat, stuffy, congested or runny nose, sneezing, and coughing) were more likely to be reported by individuals exposed to CO2 concentrations > 800 ppm than by those exposed to lower CO2 levels (Tsai, Lin and Chan 2012; Norbärk et al. 2011). Carbon dioxide concentrations > 1000 ppm were associated with a higher risk of experiencing rhinitis (sneezing or a runny or blocked nose) (Simoni et al. 2010). Dose-response associations between increases in CO2 levels and the odds of experiencing various respiratory or mucous membrane symptoms (e.g., dry eyes, sore throat, nose/sinus symptoms, tight chest, sneezing, coughing, wheezing, and rhinitis) were also reported (Lu et al. 2015; Kim et al. 2011; Simoni et al. 2010; Erdmann and Apte 2004; Apte, Fisk and Daisey 2000).
The epidemiological data from school or office environments also showed associations between increased prevalence of self-reported neurophysiological symptoms (such as headache, tiredness, fatigue, dizziness or difficulty concentrating) or increased risk of experiencing these symptoms and elevated CO2 concentrations (Dorizas, Assimakopoulos and Santamouris 2015; Lu et al. 2015; Muscatiello et al. 2015; da Conceição Ferreira and Cardoso 2014; Norbäck, Nordström and Zhao 2013; Myhrvold, Olsen and Lauridsen 1996). Specifically, CO2 levels of > 984 ppm were associated with a lack of concentration (da Conceição Ferreira and Cardoso 2014; Myhrvold, Olsen and Lauridsen 1996), while CO2 levels > 1500 ppm were associated with increased prevalence of headaches, dizziness, heavy headedness, and tiredness, compared to levels < 1000 ppm (Myhrvold, Olsen and Lauridsen 1996). Other studies reported increased odds of experiencing neurophysiological symptoms for every 100 ppm increase in CO2 levels (Lu et al. 2015; Muscatiello et al. 2015). Individuals with certain health conditions (such as allergies and asthma) were found to be more likely to report experiencing neurophysiological symptoms than those without these conditions (Erdmann and Apte 2004).
Associations (not always but often statistically significant) between increased CO2 concentration (or decreased ventilation rate per person where that was the metric) and decreased performance in school or office settings (e.g., decision-making, task performance, standardized test scores) were also observed (Mendell et al. 2016; Petersen et al. 2016; Dorizas, Assimakopoulos and Santamouris 2015; Haverinen-Shaughnessy and Shaughnessy 2015; Toftum et al. 2015; Bako-Biro et al. 2012; Twardella et al. 2012; Coley, Greeves and Saxby 2007; Wargocki and Wyon 2007a, 2007b; Shaughnessy et al. 2006; Federspiel et al. 2004; Myhrvold, Olsen and Lauridsen 1996).
Controlled exposure studies on the effects of varying CO2 concentrations suggest that bioeffluents may have contributed to symptom reporting and task performance (Zhang et al. 2017; Allen et al. 2016), but this was not quantified. Allen et al. (2016) found ventilation rate, VOCs, and CO2 concentration to be independently associated with cognitive test performance and reported that a 400 ppm increase in CO2 was associated with a 21% decrease in a typical participant's test score. Furthermore, effects on decision-making or task performance were observed for exposures to CO2 ≥ 1000 ppm relative to 600 ppm in studies conducted under controlled conditions (i.e., pure CO2 injected into a laboratory or chamber) (Satish et al. 2012).
Reported health effects associated with increasing CO2 concentrations in human studies are presented in Table 3 below. Note that only studies which reported health effects at measured CO2 concentrations, or an association between health effects and increasing CO2 concentrations are shown. Studies which reported only a change in ventilation and not corresponding CO2 measurements were not included, nor were studies that reported only the difference between indoor and outdoor CO2 concentration rather than the absolute indoor concentration. More details on each study can be found in Appendix B.
| Health outcomes | Effects | CO2 level (ppm) | References and comments |
|---|---|---|---|
Respiratory effects or mucous membrane symptoms |
Eye irritation, sore or dry throat, stuffy, congested or runny nose, sneezing, coughing in the current work week |
> 800 compared to < 500 (mean levels were 431 and 876 on the first and second study days) |
Tsai, Lin and Chan (2012) Workers (n=111) were more likely to report these effects on the second study day compared to the first. No difference in other symptoms (including wheezing, shortness of breath, dizziness, tiredness) |
"Breathing difficulty" in the past hour |
867 compared to 655 (mean levels in the two classrooms) |
Norbäck et al. (2011) Students in one classroom (n=26) had a higher score (1.4 on a scale of 0-6) compared to the other (n=35, score 0.2). No difference in medical tests including rhinometry or other symptoms (including eye, nasal or throat symptoms, headache, tiredness) |
|
Dry cough, Rhinitis (sneezing or a runny or blocked nose) in the past 12 months |
> 1000 compared to < 1000 (The CO2 concentrations were divided into those above and those below the ASHRAE standard) |
Simoni et al. (2010) In a study of 654 children, those in classrooms with > 1000 ppm CO2 had a significantly higher prevalence of dry cough at night and rhinitis compared to those in classrooms with < 1000 ppm CO2 |
|
Wheeze |
Study range 907-4113 |
Kim et al. (2011) Increased odds of wheeze per 100 ppm increase in CO2 in a study of 1028 students |
|
Dry throat |
Study range 467-2800 |
Lu et al. (2015) Increased odds of dry throat per 100 ppm increase in CO2 in a study of 417 workers |
|
Allergies, nose irritation |
Study range 750-2100 |
Dorizas et al. (2015) Correlation between symptoms (allergies and nose irritation) and CO2 concentration in a study of 193 students |
|
Neurocognitive effects |
Decreased performance in school or office settings (e.g., decision-making, task performance, standardized test scores) |
945 compared to 550 (CO2 was added to increase the concentration by 400 ppm) |
Allen et al. (2016) In a controlled exposure study (n=24), SMS test scores were 15% lower on 7 of 9 tasks |
1000 compared to 600 (CO2 was added to increase the concentration by 400 ppm) |
Satish et al. (2012) In a controlled exposure study (n=22), mean SMS test scores were 11-23% lower for 7 of 9 tasks |
||
> 1000 compared to < 1000 (classroom CO2 concentrations were divided into those above and those below 1000 ppm) |
Myhrvold, Olsen and Lauridsen (1996) In a study of 550 students, there was a slight, non-statistically significant decrease in performance on a standardized test for children in classrooms with CO2 concentration > 1000 ppm compared to those < 1000 ppm |
||
1300 compared to 900 (ventilation changed) |
Wargocki and Wyon (2007a, 2007b) In a study of 46 students, performance (speed) on numerical or language-based tasks improved when ventilation increased (and therefore decreased CO2) |
||
1800 compared to 900 (ventilation changed) |
Maddalena et al. (2015) In a study of 16 subjects in a simulated office, decrease in score on decision-making performance test |
||
2115 compared to 1045 (ventilation changed) |
Twardella et al. (2012) In a study of 417 students, total number of errors on a test decreased when ventilation was improved (and therefore decreased CO2) |
||
2260 compared to 540 (ventilation changed) |
Maula et al. (2017) In a study of 36 subjects in a simulated office, decreased scores in 2 of 7 tests |
||
2909 compared to 690 (ventilation changed) |
Coley, Greeves and Saxby (2007) In a study of 18 students, significantly better results on several cognitive tests when windows were open (resulting in decreased CO2) compared to closed |
||
3000 compared to 500 (ventilation changed) |
Zhang et al. (2017) In a study of 25 subjects in a simulated office, decreased scores on 2 tests |
||
3000 compared to 600 (CO2 was added to increase the concentration) |
Kajtar and Herczeg (2012) In a study of 10 subjects in chamber study, decreased performance on mental task |
||
Study range 750-2100 |
Dorizas et al. (2015) Decreased test performance with increase in CO2 concentration in a study of 193 students |
||
Neurophysiological effects |
Headache, tiredness |
809 compared to 784 (ventilation changed) |
Norbäck Nordstrom and Zhao (2013) In a study of 62 students, more reports of headaches when the classroom CO2 concentration was 809 ppm compared to 784 ppm |
Lack of concentration |
> 984 compared to < 984 (the mean CO2 concentrations were divided into those above and those below the maximum reference level according to Portuguese law) |
da Conceição Ferreira and Cardoso (2014) Parents of students in classrooms with higher CO2 (n=856) were more likely to report a lack of concentration than those with lower classroom CO2 (n=163). There were no associations with CO2 and asthma or other respiratory diseases and symptoms, dizziness, headache |
|
Headaches, dizziness, heavy headedness, and tiredness |
> 1500 compared to < 1500 (classroom CO2 concentrations were divided into those above and those below 1500 ppm) |
Myhrvold, Olsen and Lauridsen (1996) In a study of 550 students, there was an increase in the grade and number of symptoms for children in classrooms with CO2 concentration > 1500 ppm compared to those < 1500 ppm |
|
Fatigue |
2260 compared to 540 (ventilation changed) |
Maula et al. (2017) In a study of 36 subjects in a simulated office, increased reports of fatigue |
|
Headache, sleepiness |
2756 compared to 906 (ventilation changed) |
Vehviläinen et al. (2016) In a study of 4 subjects in a simulated meeting room, increased reports of headache and sleepiness |
|
Headache, fatigue, sleepiness |
3000 compared to 500 (ventilation changed) |
Zhang et al. (2017) In a study of 25 subjects in a simulated office, increased reports of headache, fatigue and sleepiness |
|
Fatigue |
5000 compared to 600 (CO2 was added to increase the concentration) |
Kajtar and Herczeg (2012) In a study of 10 subjects in chamber study, increased reported fatigue |
|
Difficulty concentrating, headache, fatigue |
Study range 352-1591 |
Musciatello et al. (2015) Increased odds of difficulty concentrating, headache and fatigue per 100 ppm increase in CO2 in a study of 68 teachers |
|
Tiredness, dizziness |
Study range 467-2800 |
Lu et al. (2015) Increased odds of tiredness and dizziness per 100 ppm increase in CO2 in a study of 417 workers |
|
Fatigue |
Study range 750-2100 |
Dorizas et al. (2015) Correlation between symptoms (fatigue) and CO2 concentration in a study of 193 students |
|
Headaches, fatigue, visual impairment, temporarily increased cerebral blood flow velocity |
6000-45 000 |
Carr (2006); Manzey and Lorenz (1998); Sliwka et al. (1998); Radziszewski, Giacomoni and Guillerm (1988); Sinclair, Clark and Welch (1969) |
|
Cardiovascular or physiological effects |
Reduced diffusing capacity for CO, fall in cardiac output, increased ventilation (air exchange between the environment and the lungs), temporarily increased heart and respiratory rates |
7000-45 000 |
Elliot et al. (1998); Gundel, Drescher and Weihrauch (1998); Hoffmann et al. (1998); Sexton et al. (1998) |
Effect on blood chemistry |
Acidosis |
≥ 7000 |
Schaefer (1982); Messier et al. (1979); Schaefer et al. (1963) |
|
|||
As indicated in Table 3, based on the studies which investigated the effects of exposure to CO2 in humans at relevant concentrations (i.e., expected indoors under normal circumstances), it appears that the risk of experiencing health effects (such as mucous membrane, respiratory or neurophysiological symptoms, or decreased cognitive performance) begins to increase at CO2 concentrations greater than about 800 ppm. However, limitations with the available studies have been noted. For example, of all the studies which reported relationships between symptoms or task performance and elevated indoor CO2 concentrations, and which specified the CO2 exposures (rather than ventilation rates), only a handful were carried out at CO2 concentrations below 1000 ppm. In addition, co-pollutants and other confounding factors were not, for the most part, measured nor taken into account in the prolonged or repeated exposure studies. Another limitation of the available studies is the fact that many of the health outcomes were measured subjectively (e.g., self-reported symptoms) or using different methods (e.g., cognitive task evaluations included standardized knowledge tests, office-like tasks, and SMS tests). The relevance of these types of outcomes to long-term health effects is also not clear. Furthermore, many of the available studies were conducted with a small number of participants. Finally, in some studies, the CO2 concentration measurements did not align temporally with the administration of the questionnaire and/or cognitive task performance test.
Effects of repeated or prolonged inhalation exposure to higher CO2 concentrations (between approximately 6000 and 45 000 ppm for 1 to 30 days) in humans include cardiovascular effects such as a reduced diffusing capacity for CO and a fall in cardiac output (Sexton et al. 1998), increased ventilation (air exchange between the environment and the lungs) (Elliot et al. 1998; Hoffmann et al. 1998), temporarily increased heart and respiratory rates (Gundel, Drescher and Weihrauch 1998), and neurophysiological effects (e.g., headaches, fatigue, visual impairment, and difficulty concentrating) as well as temporarily increased cerebral blood flow velocity (Carr 2006; Manzey and Lorenz 1998; Sliwka et al. 1998; Radziszewski, Giacomoni and Guillerm 1988; Sinclair, Clark and Welch 1969).
Studies in laboratory animals were generally at high concentrations; however, the results from studies investigating the neurological effects of CO2 exposure or its effects on the developing brain support the observations from human studies.
5.4 Vulnerable and Susceptible Populations
Indigenous people may be considered more vulnerable to the health effects of CO2, as crowding and inadequate ventilation have been identified as characteristics of First Nations and Inuit housing in certain communities (CMHC 2019, 2005; Statistics Canada 2017; Health Canada 2007b; Kovesi et al. 2007). These factors could explain in part the higher levels of CO2 measured in homes of First Nations and Inuit communities (Health Canada 2018a; 2007a; Weichenthal et al. 2012; Kovesi et al. 2007) compared to the concentrations measured in other Canadian residences. Individuals living in low income housing are also considered to be more vulnerable to the health effects of air pollution in general, as they are more likely to live in homes with poor conditions.
Infants and children are also considered a vulnerable population, as they may be exposed to elevated indoor CO2 levels in environments outside of their home, such as schools and daycare centres. In addition, because of their size, children inhale more air in relation to their body weight than adults. Infants and children may also be more susceptible than adults to the health effects of air contaminants due to differences in their ability to metabolize, detoxify, and excrete contaminants, and because they undergo rapid growth and development (Suk, Murray and Avakian 2003; Faustman et al. 2000). Infants of mothers who smoked or misused substances during pregnancy were found to be more susceptible to the adverse effects of hypercapnia than control subjects (Ali et al. 2014).
Individuals with pre-existing health conditions (such as allergies and asthma) were found to be more susceptible to the mucous membrane and respiratory effects of CO2 than those without these conditions (Erdmann and Apte 2004). Due to the physiological and metabolic actions of CO2 in the body, it is expected that individuals with cardiovascular conditions may also be more susceptible to the health effects of elevated CO2 exposure. Patients suffering from panic disorder or separation anxiety disorder were found to be more susceptible to the anxiogenic effects of CO2 compared to healthy subjects (Atli, Bayin and Alkin 2012; Roberson-Nay et al. 2010; Pine et al. 2000; Beck, Ohtake and Shipherd 1999; Antony, Brown and Barlow 1997; Woods et al. 1988).
6.0 Risk characterization
6.1 Derivation of the Proposed Long-Term Exposure Limit
Epidemiological and controlled exposure studies examining CO2 concentrations and health effects in school or office environments have shown associations between increases in CO2 levels and the odds of experiencing mucous membrane or respiratory symptoms (e.g., eye irritation, sore or dry throat, stuffy, congested or runny nose, sneezing, coughing, and rhinitis); an increased prevalence of neurophysiological symptoms (such as headache, tiredness, fatigue, dizziness or difficulty concentrating); and decreased test performance (e.g., decision-making, task performance, standardized test scores) (see section 5.1). Studies in laboratory animals support the observations reported in human studies (see section 5.2).
There are significant limitations to the available human studies examining associations between health effects and CO2 concentrations relevant to indoor exposure (≤ 3000 ppm) (see section 5.3 for details). Although associations have been observed between increased CO2 concentrations and increased reporting of respiratory or neurophysiological symptoms and decreased performance on tasks and tests, no causality can be determined. However, despite database deficiencies and issues with the data collection and analysis of many of the human studies, available studies suggest a trend of increasing odds of symptoms with increasing indoor CO2 concentration. Although a few studies showed associations between effects and concentrations below 1000 ppm, most used test concentrations that were above this level.
No individual study was considered strong enough on its own to be selected as the basis for a proposed exposure limit, however, taken as a whole the database indicates that there may be health benefits to reducing indoor CO2 concentrations, and that 1000 ppm could be considered a suitable exposure limit. This level is in line with the ASHRAE standard for comfort. Therefore, the proposed long-term exposure limit for CO2 is 1000 ppm.
6.2 Exposure in Canadian Homes in Relation to Proposed Exposure Limit
Results from the Canadian Human Activity Pattern Survey 2 indicate that Canadians spend approximately 90% of their time indoors (Matz et al. 2014), most of which (70%) is indoors at home, with less time (19%) spent at other indoor locations such as schools, public buildings, offices, factories, stores, and restaurants. Given the proportion of time spent indoors and the fact that most of the CO2 indoors comes from indoor sources—primarily occupant respiration—the concentration of CO2 in the indoor environment is an important consideration for the health of Canadians.
Health Canada has completed several indoor exposure studies in multiple Canadian cities or regions. The results of these studies include residential indoor CO2 concentrations as well as levels in schools and daycare centres. Median CO2 levels measured in Health Canada studies in Canadian homes in six cities ranged from 418 to 729 ppm, and 95th percentiles from 477 to 1483 ppm (see Table 2). Based on existing data, overall, CO2 levels measured in on-reserve First Nations homes in Ontario and Manitoba and in Inuit communities in Nunavut were higher than those measured in other Canadian residences, with median and 95th percentiles ranging from 1058 to 1139 ppm, and from 2121 to 2436 ppm, respectively. Carbon dioxide levels measured in Health Canada studies in schools and daycare centres fell within the range of residential values (i.e., median and 95th percentile in four schools were 491 and 1171 ppm, respectively; mean in 21 daycare centres was 1333 ppm, with a standard deviation of 391 ppm).
Figures 1 and 2 show a comparison between CO2 concentrations measured in Health Canada studies in Canadian homes (including on-reserve First Nations homes located in Ontario and Manitoba and in Inuit communities in Nunavut), schools, and daycare centres (see Table 2), and the range of concentrations associated with health effects in human studies (see Table 3). Median CO2 levels measured in Canadian homes in six cities are below the lowest level at which there was an association with any effects. However, median CO2 levels in on-reserve First Nations homes located in Ontario and Manitoba and in Inuit communities in Nunavut are slightly above levels at which associations with respiratory and mucous membrane symptoms, decreased concentration and lower test scores in school and office settings were observed (see Figure 1). When considering the range of 95th percentiles, the upper end of the measured levels in six cities is slightly above levels at which these associations were observed. The 95th percentiles in on-reserve First Nations homes located in Ontario and Manitoba and in Inuit communities in Nunavut are also above the range of concentrations associated with increased reports of headache, dizziness and tiredness.
With respect to the small number of Canadian schools (4) and daycare centres (21) studied by Health Canada, the median CO2 level measured in occupied schools is below the CO2 concentrations associated with health effects. However, the 95th percentile CO2 level measured in schools and the mean CO2 level measured in daycare centres fall within the range of concentrations associated with increased reports of respiratory and mucous membrane symptoms, decreased concentration, lower test scores in school and office settings, headache, dizziness and tiredness (see Figure 2).
These results suggest that there are likely Canadian homes, schools, and daycare centres in which the proposed exposure limit of 1000 ppm is exceeded. On-reserve First Nations homes located in Ontario and Manitoba and in Inuit communities in Nunavut are more likely to have measured levels of CO2 that are above the proposed exposure limit than other Canadian homes. However, as noted in sections 5.3 and 6.1, interpretation of the studies on which the proposed exposure limit is based is limited by multiple factors. In addition, it cannot be determined from the available evidence whether CO2 or some other factor causes the observed effects. Nevertheless, as Figures 1 and 2 suggest, lowering CO2 concentrations in homes, schools, and daycare centres to below the proposed exposure limit could decrease the risk of symptoms associated with increased CO2 concentrations.
Atypical exposure scenarios, including during the use of emergency shelters, which involve non-routine use of municipal infrastructure, have also been considered. As no indoor CO2 exposure concentrations were found in Health Canada studies or in the published literature for emergency situations, CO2 exposure from atypical exposure scenarios could not be characterized as part of this assessment.
Figure 1. Comparison of CO2 concentrations in Canadian homes to CO2 concentrations associated with health effects
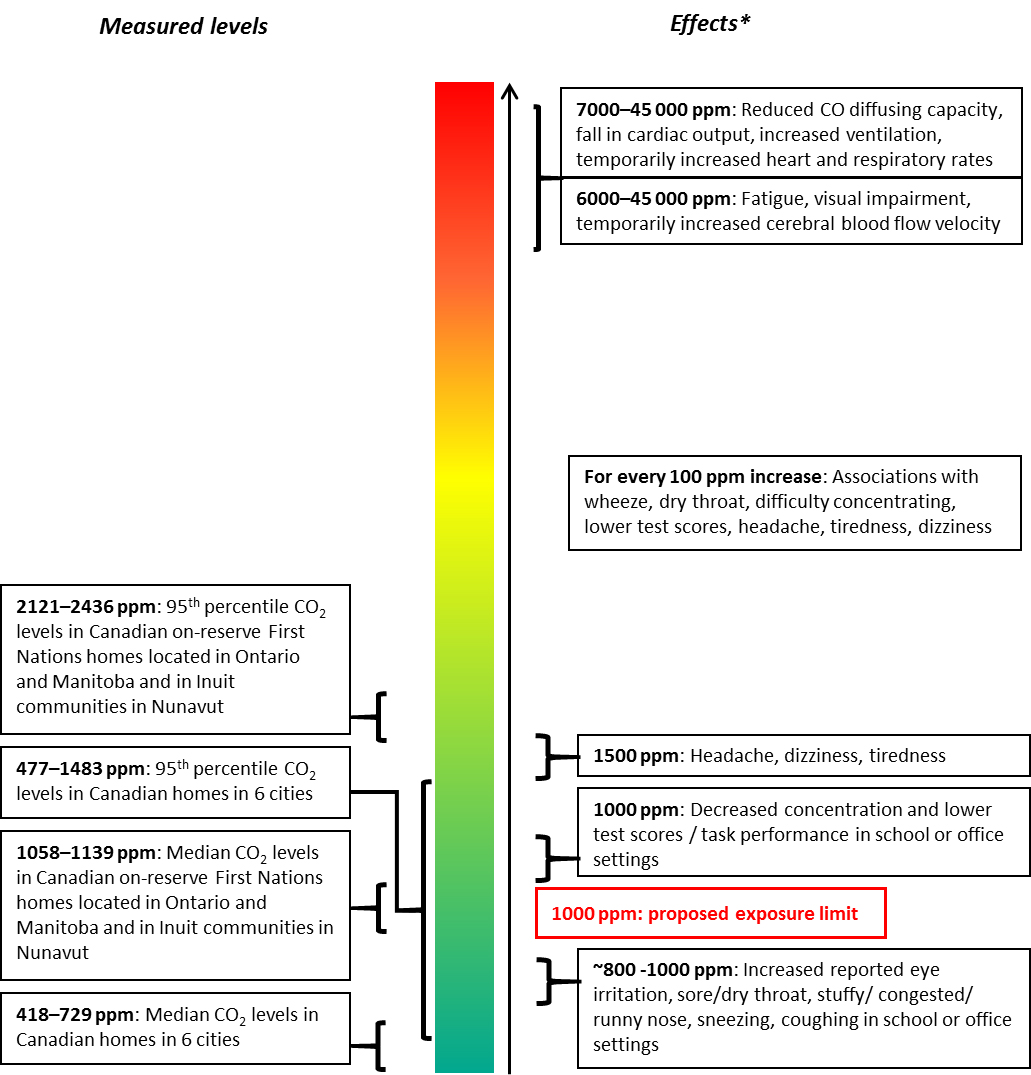
Effects: Some associations were observed in epidemiological studies (in offices and schools) and controlled exposure studies (generally 1- to 5-hour exposures). However, many study limitations were noted, and causality was not linked to CO2. Carbon dioxide levels closer to the bottom (green) represent the lowest potential risk of health effects.
Text description
This figure compares CO2 concentrations in Canadian homes and CO2 concentrations associated with health effects. In the middle there is a vertical bar filled with a colour gradient: at the top is red, changing to orange then yellow in the middle, and light to dark green at the bottom, indicating higher risk of health effects at the top and lower risk towards the bottom. To the left of the coloured bar the range of median and 95th percentiles of CO2 levels in homes are shown: the median levels (418 to 1139 ppm) are entirely in the dark green, about 10% of the vertical bar; the 95th percentiles (477 to 2436 ppm) are in the dark and light green and cover about 25% of the coloured bar. To the right of the coloured bar, the range of CO2 concentrations associated with health effects are shown, with effects observed at lower concentrations (800 to 1500 ppm) in the green area near the bottom, effects at higher concentrations (above 6000 ppm) in the red area at the top, and a box in the middle with effects showing associations with every 100 ppm increase. There is also a box on the right hand side of the vertical bar, in the green area, indicating the 1000 ppm proposed exposure limit. A note at the bottom of the figure says: "Some associations were observed in epidemiological studies (in offices and schools) and controlled exposure studies (generally 1- to 5-hour exposures). However, many study limitations were noted, and causality was not linked to CO2. Carbon dioxide levels closer to the bottom (green) represent the lowest potential risk of health effects."
Figure 2. Comparison of CO2 concentrations in a limited number of Canadian schools and daycare centres to CO2 concentrations associated with health effects
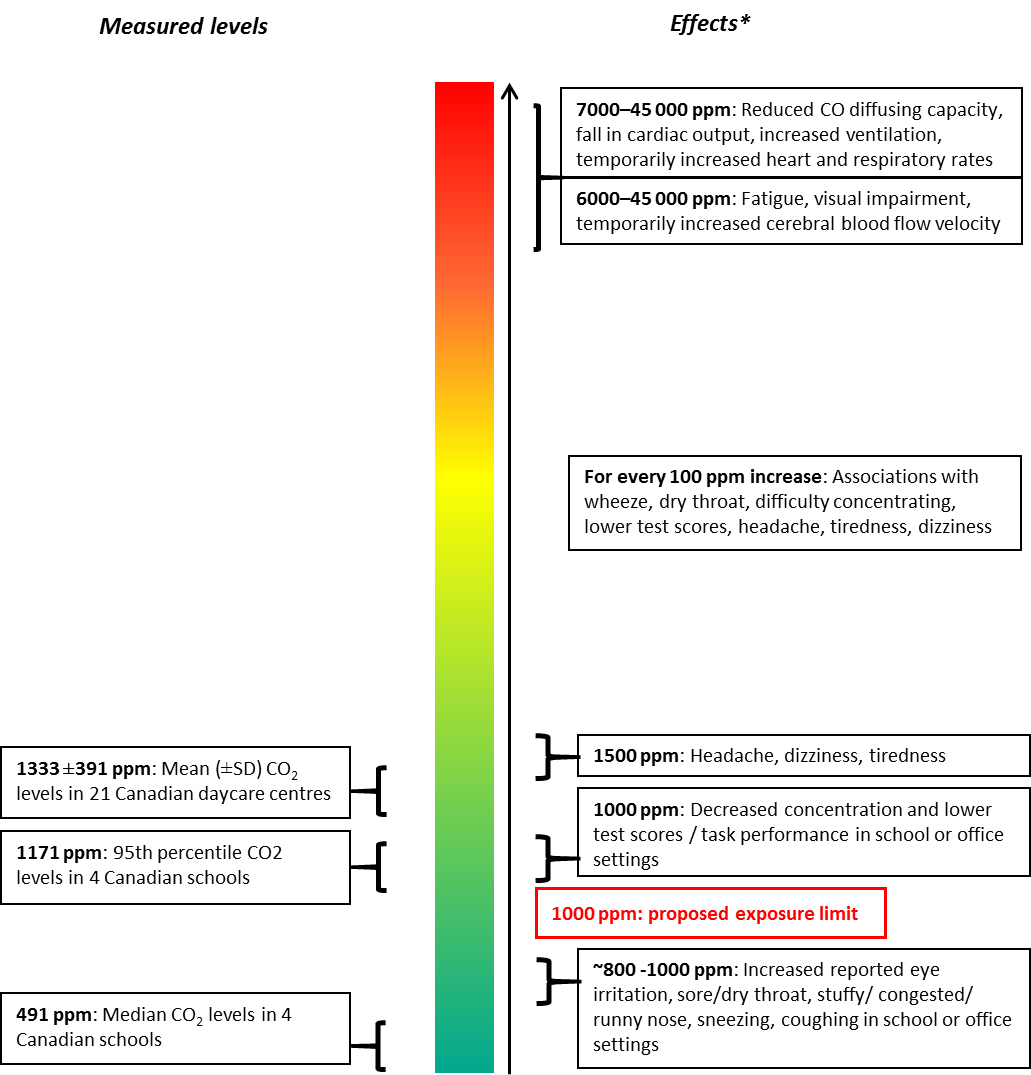
Effects: Some associations were observed in epidemiological studies (in offices and schools) and controlled exposure studies (generally 1- to 5-hour exposure). However, many study limitations were noted, and causality was not linked to CO2. Carbon dioxide levels closer to the bottom (green) represent the lowest potential risk of health effects.
Text description
This figure compares CO2 concentrations in a limited number of Canadian schools and daycare centres and CO2 concentrations associated with health effects. In the middle there is a vertical bar filled with a colour gradient: at the top is red, changing to orange then yellow in the middle, and light to dark green at the bottom, indicating higher risk of health effects at the top and lower risk towards the bottom. To the left of the coloured bar the CO2 levels in Canadian schools and daycare centres are shown: the median level in four schools (491 ppm) is in the dark green; the 95th percentile in four schools (1171 ppm) and the mean in 21 daycare centres (1333 ppm) are in the medium green. To the right of the coloured bar, the range of CO2 concentrations associated with health effects are shown, with effects observed at lower concentrations (800 to 1500 ppm) in the green area near the bottom, effects at higher concentrations (above 6000 ppm) in the red area at the top, and a box in the middle with effects showing associations with every 100 ppm increase. There is also a box on the right hand side of the vertical bar, in the green area, indicating the 1000 ppm proposed exposure limit. A note at the bottom of the figure says: "Some associations were observed in epidemiological studies (in offices and schools) and controlled exposure studies (generally 1- to 5-hour exposures). However, many study limitations were noted, and causality was not linked to CO2. Carbon dioxide levels closer to the bottom (green) represent the lowest potential risk of health effects."
6.3 Uncertainties and Areas of Future Research
Areas for future research that have been identified by this assessment include the following:
- Human studies investigating the health effects of indoor CO2 concentrations relevant to indoor environments (especially < 1000 ppm), which control for potential confounders, including other indoor pollutants, and use standard test methods.
- Studies exploring the relative contribution of CO2 and other pollutants on respiratory, mucous membrane, and neurophysiological symptoms or neurocognitive performance at CO2 exposure levels relevant to indoor environments.
- Studies in potentially sensitive populations (e.g., individuals with pre-existing health conditions) investigating the health effects of indoor CO2 concentrations relevant to indoor environments (especially < 1000 ppm).
- Characterization of the relative contributions of potential sources of indoor CO2.
- Characterization of indoor exposures to CO2 in non-residential indoor settings (such as schools and daycare centres) in Canada.
7.0 Proposed guidelines
7.1 Proposed Long-Term Exposure Limit
| Exposure Limit | Concentration | Critical effect(s)Table 4 Footnote 1 | |
|---|---|---|---|
| mg/m3 | ppm | ||
Long-term (24 h) |
1800 |
1000 |
As CO2 increases, there may be an increased risk of:
|
|
|||
When comparing a measured CO2 concentration with the long-term exposure limit, the sampling time should be at least 24 hours, taken under normal conditions. Moreover, the averaging of results of repeated samples taken at different times of the year will provide a more representative estimate of the long-term exposure.
7.2 Risk Management Recommendations
Measured data confirms there are Canadian homes, schools, and daycare centres in which the proposed exposure limit for CO2 is exceeded. Based on existing data, on-reserve First Nations homes located in Ontario and Manitoba and in Inuit communities in Nunavut are more likely to have measured levels of CO2 that are above the proposed exposure limit than other Canadian homes. Therefore, there may be an increased risk of respiratory symptoms, decreased test performance, headaches, dizziness and tiredness.
The primary source of CO2 in Canadian homes is occupant respiration, and other sources include unvented or poorly vented fuel-burning appliances and cigarette smoking. In most residential situations, identifying potential sources of CO2 and reduction measures is more informative and cost-effective for improving indoor air quality than air testing and comparing measured concentrations to the proposed exposure limit. Therefore, Health Canada recommends that individuals take actions to reduce indoor levels of CO2.
Carbon dioxide concentrations in indoor air are often used as a measure of ventilation, and ensuring adequate ventilation will help reduce CO2 levels in the home. Strategies to increase ventilation in the home include the following:
- increasing natural ventilation by opening windows (taking into consideration ambient air quality);
- setting the mechanical ventilation system to a higher setting or letting it run longer;
- having the ventilation system checked regularly by a qualified ventilation contractor;
- running the kitchen range hood exhaust fan when cooking; and
- using the furnace fan or, if necessary, a separate fan or air supply to make sure air is distributed throughout the home.
Additional information on measures to improve ventilation in homes can be found in the technical documentVentilation and the Indoor Environment (Health Canada 2018c).
In terms of source control, the production of residential indoor CO2 may be reduced by:
- ensuring fuel-burning appliances are in good working order and properly vented;
- avoiding the use of unvented fuel-burning appliances (e.g., space heaters) indoors;
- not smoking indoors; and
- avoiding overcrowded living situations, if possible.
In terms of implementation of CO2 reduction strategies, specifically increased ventilation, ambient air quality must be considered. During periods of poor ambient air quality, such as those experienced during forest fire events, reducing air intake and thus infiltration of ambient air pollutants may be more beneficial from a health risk perspective, compared to reducing indoor CO2 levels to below the proposed exposure limit. The information contained within this document may be used to inform the development of additional scenario-specific CO2 exposure limits, such as for homes during smog events or emergency shelters during wildfires.
8.0 References
- ACGIH (2001) Carbon Dioxide: TLV(R) Chemical Substances 7th Edition Documentation (2015). American Conference of Governmental Industrial Hygienists.
- Ali, K., Wolff K., Peacock, J.L., Hannam, S., Rafferty, G.F., Bhat, R. and Greenough, A. (2014) Ventilatory response to hypercarbia in newborns of smoking and substance-misusing mothers. Annals of the American Thoracic Society, 11(6): 933-938.
- Allen, J.G., MacNaughton, P., Satish, U., Santanem, S., Vallerino, J. and Spengler, J.D. (2016) Associations of cognitive function scores with carbon dioxide, ventilation, and volatile organic compound exposures in office workers: A controlled exposure study of green and conventional office environments. Environmental Health Perspectives, 124(6): 805-812.
- ANSES (2013) Concentrations de CO2 dans l'air intérieur et effets sur la santé. Avis de l'ANSES. Rapport d'expertise collective. Agence nationale de sécurité sanitaire de l'alimentation, de l'environnement et du travail, https://www.anses.fr/en/content/carbon-dioxide-CO2-indoor-air.
- Antony, M.M., Brown, T.A., and Barlow, D.H. (1997) Response to hyperventilation and 5.5% CO2 inhalation of subjects with types of specific phobia, panic disorder, or no mental disorder. Journal of Abnormal Psychology, 154: 1089-1095.
- Apte, M.G., Fisk, W.J., and Daisey, J.M. (2000) Associations between indoor CO2 concentrations and sick building syndrome symptoms in US office buildings: An analysis of the 1994-1996 BASE study data. Indoor Air, 10: 246-257.
- Argyropoulos, S.V., Bailey, J.E., Hood, S.D., Kendrick, A.H., Rich, A.S., Laszlo, G., Nash, J.R., Lightman, S. and Nutt, D.J. (2002) Inhalation of 35% CO2 results in activation of the HPA axis in healthy volunteers. Psychoneuroendocrinology, 27: 715-729.
- ASHRAE (2016) Ventilation for Acceptable Indoor Air Quality, ANSI/ASHRAE Standard 62.1. American National Standards Institute and American Society of Heating, Refrigerating and Air-Conditioning Engineers. Available from: https://www.ashrae.org/technical-resources/standards-and-guidelines/read-only-versions-of-ashrae-standards.
- Atli, O., Bayin, M. and Alkin, T. (2012) Hypersensitivity to 35% carbon dioxide in patients with adult separation anxiety disorder. Journal of Affective Disorders, 141: 315-323.
- Bailey, J.E., Argyropoulos, S.V., Kendrick, A.H. and Nutt, D.J. (2005) Behavioral and cardiovascular effects of 7.5% CO2 in human volunteers. Depress Anxiety, 21(1): 18-25.
- Bako-Biro, Z., Clements-Croome, D.J., Kochhar, N., Awbi, H.B. and Williams, M.J. (2012) Ventilation in schools and pupils' performance.Building and Environment, 48:215-223.
- Beck, J.G., Ohtake, P.J. and Shipherd, J.C. (1999) Exaggerated anxiety is not unique to CO2 in panic disorder: a comparison of hypercapnic and hypoxic challenges. Journal of Abnormal Psychology, 108: 473-482.
- Bove, A.A. and Davis, J.C. (2004) Bove and Davis diving medicine. Chapter 8: The toxicity of oxygen, carbon monoxide, and carbon dioxide by Thom, S. R., and Clark, J. M.
- Bureau of Chemical Hazards (1985) Report to the Federal-Provincial Working Group on indoor air quality - carbon dioxide. Report. pp. 48. (unpublished)
- Burge, P.S. (2004) Sick building syndrome. Occupational and Environmental Medicine, 61: 185-190.
- Buron, G., Hacquemand, R., Pourié, G. and Brand, G. (2009) Carbon dioxide effects on olfactory functioning: behavioral, histological and immunohistochemical measurements. Toxicology Letters, 188: 251-257.
- Carr, C. (2006) NASA White Paper. Houston, TX: National Aeronautics and Space Administration (as cited in NRC 2008).
- Carreiro-Martins, P., Viegas, J., Papiola, A.L., Aelenei, D., Caires, I., Araujo-Martins, J., Gaspar-Marques, J., Cano, M.M., Mendes, A.S., Virella, D., Rosado-Pinto, J., Leiria-Pinto, P., Annesi-Maesano, I. and Neuparth, N. (2014) CO2 concentration in day care centres is related to wheezing in attending children. European Journal of Pediatrics, 173: 1041-1049.
- Clausen, G., Høst, A., Toftum, J., Bekö, G., Weschler, C., Callesen, M., Buhl, S., Ladegaard, M. B., Langer, S., Andersen, B., Sundell, J., Bornehag, C.-G. and Sigsgaard, T. (2012) Children's health and its association with indoor environments in Danish homes and daycare centres – methods. Indoor Air, 22: 467–475.
- CMHC (2019) Housing Conditions of On-Reserve Aboriginal Households. Socio Economic Analysis: Housing Needs and Conditions. Canada Mortgage and Housing Corporation. July 2019. Available at: https://www.cmhc-schl.gc.ca/en/data-and-research/publications-and-reports/socio-economic-housing-conditions-on-reserve-aboriginal-households.
- CMHC (2005) Nunavut Housing Ventilation Research 2003-2005. Research Highlights, Canada Mortgage and Housing Corporation. November 2005, Technical Series 05-11. Available at: http://publications.gc.ca/collections/Collection/NH18-22-105-116E.pdf.
- Coley, D.A., Greeves, R., and Saxby, B.K. (2007) The effect of low ventilation rates on the cognitive function of a primary school class. International Journal of Ventilation, 6(2): 107-112.
- Cooper, E.S., West, J.W., Jaffe, M.E., Goldberg, H.I., Kawamura, J. and McHenry, L.C. (1970) The relation between cardiac function and cerebral blood flow in stroke patients. 1. Effect of CO2 Inhalation. Stroke, 1(5): 330-347.
- CSTB (2011) Évolution de la réglementation sanitaire des bâtiments: Ventilation et CO2. Rapport n°ESE/Santé-2011-098R, non publié. Centre Scientifique et Technique du Bâtiment, Champs-sur-Marne (as cited in ANSES 2013).
- da Conceição Ferreira, A.M. and Cardoso, M. (2014) Indoor air quality and health in schools. Jornal Brasileiro de Pneumologia, 40(3): 259-268.
- Daneault, S., Beausoleil, M. and Messing, K. (1992) Air quality during the winter in Québec day-care centers. American Journal of Public Health, 83(3): 432-434.
- Das, S., Du, Z., Bassly, S., Singer, L., and Vicencio, A.G. (2009) Effects of chronic hypercapnia in the neonatal mouse lung and brain. Pediatric Pulmonology, 44: 176-182.
- Dionne J.C. and Soto, J.C. (1990) Indoor air pollution study in six day-care centres located in metropolitan Montreal. In: Proceedings of the Indoor Air 1990, vol.1. Canada Mortgage and Housing Corporation. Toronto, pp.187-192 (as cited in St-Jean, 2012).
- Dorizas, P.V., Assimakopoulos, M-N., and Santamouris, M. (2015) A holistic approach for the assessment of indoor environmental quality, student productivity, and energy consumption in primary schools. Environmental Monitoring and Assessment, 187(5): 1-18.
- Drummer, C., Friedel, V., Boerger, A., Stoermer, I., Wolter, S., Zittermann, A., Wolfram, G. and Heer, M. (1998) Effects of elevated carbon dioxide environment on calcium metabolism in humans. Aviation Space and Environmental Medicine, 69(3): 291-298.
- ECCC (2018) National Inventory Report 1990-2016: Greenhouse Gas Sources and Sinks in Canada. Canada's Submission to the United Nations Framework Convention on Climate Change. Executive Summary. Environment and Climate Change Canada. Cat. No.: En81-4/1E-PDF.
- ECCC (2015) Carbon dioxide (CO2). Environment and Climate Change Canada. Available at: https://www.ec.gc.ca/toxiques-toxics/Default.asp?lang=En&n=98E80CC6-1&xml=DF76322C-49E3-4335-811F-D0E1DA54938A.
- Elliott, A.R., Prisk, G. K., Schöllmann, C. and Hoffmann, U. (1998) Hypercapnic ventilatory response in humans before, during, and after 23 days of low level CO2 exposure. Aviation Space and Environmental Medicine, 69(4): 391-396.
- Erdmann, C.A. and Apte, M.G. (2004) Mucous membrane and lower respiratory building related symptoms in relation to indoor carbon dioxide concentrations in the 100-building BASE dataset. Indoor Air, 14: 127-134.
- Faustman, E.M., Silbernagel, S.M., Fenske, R.A., Burbacher, T.M. and Ponce, R.A. (2000) Mechanisms underlying children's susceptibility to environmental toxicants. Environmental Health Perspectives, 108(suppl 1): 13-21.
- Federspiel, C.C., Fisk, W.J., Price, P.N., Liu, G., Faulkner, D., Dibartolomeo, D.L., Sullivan, D.P., and Lahiff, M. (2004) Worker performance and ventilation in a call center: analyses of work performance data for registered nurses. Indoor Air, 14(suppl 8): 41-50.
- FiSIAQ (2002) Classification of indoor climate 2000: Target values, design guidance and product requirements, Espoo, Finland. (Finnish Society of Indoor Air Quality and Climate. Available at: http://www.irbnet.de/daten/iconda/CIB7264.pdf.
- Fromme H., Bischof W., Dietrich S., Lahrz T., Schierl R. and Schwegler U. (2013) Airborne allergens, endotoxins, and particulate matter in elementary schools: Results from Germany (LUPE 2). Journal of Occupational and Environmental Hygiene, 10: 573-582.
- Fromme H., Debiak M., Sagunski H., Röhl C., Kraft M. and Kolossa-Gehring M. (2019) The German approach to regulate indoor air contaminants. International Journal of Hygiene and Environmental Health, 222(3): 347-354.
- Fromme H., Lahrz T., Kraft M., Fembacher L., Dietrich S., Sievering S., Burghardt R., Schuster R., Bolte G. and Volkel W. (2013) Phthalates in German daycare centers: Occurrence in air and dust and the excretion of their metabolites by children (LUPE 3). Environment International, 61: 64-72.
- Gaihre, S., Semple, S., Miller, J., Fielding, S. and Turner, S. (2014) Classroom carbon dioxide concentration, school attendance and educational attainment. Journal of School Health, 84(9): 569-574.
- Grote, W. (1965) Disturbances of embryonic development at elevated CO2 and O2 partial pressure at reduced atmospheric pressure. Zeitschrift für Morphologie und Anthropologie, 56: 165-194 (as cited in Guais et al. 2011; NRC 2008).
- Gu, X. Q., Kanaan, A., Yao, H. and Haddad, G.G. (2007) Chronic high-inspired CO2 decreases excitability of mouse hippocampal neurons. Journal of Neurophysiology, 97(2): 1833-1838.
- Gu, X. Q., Xue, J. and Haddad, G.G. (2004) Effect of chronically elevated CO2 on CA1 neuronal excitability. American Journal of Physiology - Cell Physiology, 287(3): C691-C697.
- Guais, A., Brand, G., Jacquot, L., Karrer, M., Dukan, S., Grévillot, G., Molina, T. J., Bonte, J., Regnier, M. and Schwartz, L. (2011) Toxicity of carbon dioxide: a review. Chemical Research in Toxicology, 24: 2061-2070.
- Gundel, A., Drescher, J. and Weihrauch, M.R. (1998) Joint NASA-ESA-DARA Study. Part three: cardiorespiratory response to elevated CO2 levels during sleep. Aviation Space and Environmental Medicine, 69(5): 496-500 (as cited in NRC 2008).
- Guyton, A.C. (1982) Human Physiology and Mechanisms of Disease, 3rd edition, W.B. Saunders Co., Philadelphia, PA. (as cited in Bureau of Chemical Hazards 1985).
- Hacquemand, R., Buron, G., Pouri‚, G., Karrer, M., Jacquot, L. and Brand, G. (2010) Effects of CO2 inhalation exposure on mice vomeronasal epithelium. Cell Biology and Toxicology, 26(4): 309-317.
- Halios, C.H., Assimakopoulos, V.S., Helmis, C.G. and Flocas H.A. (2005) Investigating cigarette-smoke indoor pollution in a controlled environment. Science of the Total Environment, 337: 183-190.
- Halpern, P., Raskin, Y., Sorkine, P. and Oganezov, A. (2004) Exposure to extremely high concentrations of carbon dioxide: A clinical description of a mass casualty incident. Annals of Emergency Medicine, 43(2): 196-199.
- Hanoune, B. and Carteret, M. (2015) Impact of kerosene space heaters on indoor air quality. Chemosphere, 134: 581-587.
- Hardt, D.J., James, R.A., Gut, C.P. and Gargas, M.L. (2011) Health risk assessment of women in submarines: reproductive and developmental toxicity evaluation of major submarine atmosphere components (CO, CO2 and O2) in rats (Rattus norvegicus) - Phase I (range finding study). Naval Medical Research Unit Dayton. Technical Report. Report No.: NAMRU-D-11-35. Report. pp. 38.
- Hardt, D.J., James, R.A., Gut, C.P., McInturf, S.M. and Gargas, M.L. (2011) Health risk assessment of women in submarines: reproductive and developmental toxicity evaluation of major submarine atmosphere components (CO, CO2 and O2) in rats (Rattus norvegicus) - Phase II (neurological and reproductive performance study). Naval Medical Research Unit Dayton. Technical Report. Report No.: NAMRU-D-12-03. Report. pp. 90.
- Hardt, D.J., James, R.A., Gut, Jr, C.P., McInturf, S.M., Sweeney, L.M., Sweeney, L.M., Erickson, R.P. and Gargas, M.L. (2015) Evaluation of submarine atmospheres: effects of carbon monoxide, carbon dioxide and oxygen on general toxicology, neurobehavioral performance, reproduction and development in rats. II. Ninety-day study. Inhalation Toxicology, 27(3): 121-137.
- Haring, O.M. (1960) Cardiac malformation in rats induced by exposure of the mother to carbon dioxide during pregnancy. Circulation research, 8: 1218-1227 (as cited in Guais et al. 2011).
- Harper, H.A., Rodwell, V.M. and Mayes, P.A. (1979) Review of Physiological Chemistry, 17th Edition. Large Medical Publishers, Los Altos, California (as cited in Bureau of Chemical Hazards 1985).
- Haverinen-Shaughnessy, U., Moschandreas, D.J., and Shaughnessy, R.J. (2011) Association between substandard classroom ventilation rates and students' academic achievement. Indoor Air, 21: 121-131.
- Haverinen-Shaughnessy, U. and Shaughnessy, R.J. (2015) Effects of classroom ventilation rate and temperature on students' test scores. PLoS ONE, 10(8): 1-14.
- Health Canada (2018a) Indoor Air Quality and the Effect on Children's Respiratory Health in First Nations Reserves in the Sioux Lookout Zone, Northern Ontario (Ongoing Study). (unpublished)
- Health Canada (2018b) Personal communication with L. Marro and M. Malowany. Ottawa, Ontario. 4 December 2018.
- Health Canada (2018c) Ventilation and the indoor environment. Government of Canada, Ottawa. Cat.: H144-54/1-2018E-PDF.
- Health Canada (2016) Ottawa New Homes Study. (unpublished)
- Health Canada (2013) Edmonton Exposure Assessment Study: VOC Sampling Data Summary (2010). Health Canada, Ottawa, Ontario.
- Health Canada (2012) Halifax Indoor Air Quality Study (2009): Volatile Organic Compounds (VOC) Data Summary. Health Canada, Ottawa, Ontario.
- Health Canada (2007a) Nunavut Study. (unpublished)
- Health Canada (2007b) Housing conditions that serve as risk factors for tuberculosis infection and disease. Available at: https://www.canada.ca/en/public-health/services/reports-publications/canada-communicable-disease-report-ccdr/monthly-issue/2007-33/housing-conditions-that-serve-risk-factors-tuberculosis-infection-disease.html.
- Health Canada (1987) Exposure Guidelines for Residential Indoor Air Quality. A Report of the Federal-Provincial Advisory Committee on Environmental and Occupational Health. Environmental Health Directorate, Health Protection Branch. Report. Revised July 1989.
- Health Canada and Institut national de santé publique du Québec (2015) Project for residential indoor air quality and ventilation characterization and intervention. (unpublished)
- Hill, P. M. (2000) Possible asphyxiation from carbon dioxide of a cross-country skier in eastern California: a deadly volcanic hazard. Wilderness and Environmental Medicine, 11: 192-195.
- Hoffmann, U., Schöllmann, C., Wackerhage, H., Leyk, D. and Wenzel, J. (1998) Effects of chronically increased ambient CO2 concentrations on aerobic capacity. Aviation Space and Environmental Medicine, 69(4): 397-402.
- Holmes, J.M., Duffner, L.A. and Kappil, J.C. (1994) The effect of raised inspired carbon dioxide on developing rat retinal vasculature exposed to elevated oxygen. Current Eye Research, 13(10): 779-782.
- Holmes, J.M., Leske, D.A. and Zhang, S. (1997) Short communication: The effect of raised inspired carbon dioxide on normal retinal vascular development in the neonatal rat. Current Eye Research, 16(1): 78-81.
- Holmes, J.M., Zhang, S., Leske, D.A. and Lanier, W.L. (1998) Carbon dioxide-induced retinopathy in the neonatal rat. Current Eye Research, 17(6): 608-616.
- Holmes, J.M., Zhang, S., Leske, D.A. and Lanier, W.L. (1997) The effect of carbon dioxide on oxygen-induced retinopathy in the neonatal rat. Current Eye Research, 16(7): 725-732.
- IEC Beak Consultants Ltd. (1983) Indoor Air Quality, Cambridge Sealed Homes, a report for the Ontario Ministry of Municipal Affairs and Housing, IEC Beak, 6870 Goreway Drive, Mississauga, Ontario, October, 1983 (as cited in Bureau of Chemical Hazards, 1985).
- Ikeda, N., Takahashi, H., Umetsu, K. and Suzuki, T. (1989) The course of respiration and circulation in death by carbon dioxide poisoning. Forensic Science International, 41(1-2): 93-99.
- Itoh, Y., Yoshioka, M., and Kennotsu, O. (1999) Effects of experimental hypercapnia on hippocampal long-term potentiation in anesthetized rats. Neuroscience Letters, 260: 201-203.
- Jeong, J.Y. (2008) Recently Issues on Indoor Air Quality in Korea, KOSHA. Available at: http://www.zyaura.com/quality/Archives/Recently%20issues%20on%20Indoor%20air%20quality%20in%20Korea[1].pdf (as cited in Abdul-Wahab et al. 2015).
- Jiang, C., Rojas, A., Wang, R. and Wang, X. (2005) CO2 central chemosensitivity: why are there so many sensing molecules? Respiratory Physiology & Neurobiology, 145(2-3): 115-126.
- Kajtar, L., and Herczeg, L. (2012) Influence of carbon dioxide concentration on human well-being and intensity of mental work. Quarterly Journal of the Hungarian Meteorological Service, 116(2): 145-169.
- Kim, J.L., Elfman, L., Wieslander, G., Ferm, M., Torén, K. and Norbäck, D. (2011) Respiratory health among korean pupils in relation to home; school and outdoor environment. Journal of Korean Medicine Science, 26:166-173.
- Kiray, M., Sisman, A.R., Camsari, U.M., Evren, M., Dayi, A., Baykara, B., Aksu, I., Atres, M. and Uysal, N. (2014) Effects of carbon dioxide exposure on early brain development in rats. Biotechnic and Histochemistry, 89(5): 371-383.
- Kovesi, T., Gilbert, N.L., Stocco, C., Fugler, D., Dales, R.E., Guay, M. and Miller J.M. (2007) Indoor air quality and the risk of lower respiratory tract infections in young Canadian Inuit children. Canadian Medical Association Journal, 177(2): 155-160.
- Krystal, J.H., Woods, S.W., Levesque, M., Heninger, C. and Heninger, G.R. (1989) The effects of carbon dioxide inhalation on plasma mhpg plasma hormones respiratory rate and behavior in the rhesus monkey. Life Sciences, 45(18): 1657-1664.
- Lahiri, S. and Forster, S.E. (2003) CO2/H+ sensing: peripheral and central chemoreception. The International Journal of Biochemistry & Cell Biology, 35(2003): 1413-1435.
- Li, G., Zhou, D., Vicencio, A.G., Ryu, J., Xue, J., Kanaan, A., Gavrialov, O. and Haddad, G.G. (2006) Effect of carbon dioxide on neonatal mouse lung: a genomic approach. Journal of applied physiology, 101(6): 1556-1564.
- Lu, C.Y., Lin, J.M., Chen, Y.Y. and Chen, Y.C. (2015) Building-related symptoms among office employees associated with indoor carbon dioxide and total volatile organic compounds. International Journal of Environmental Research and Public Health, 12: 5833-5845.
- MacNeill, M., Dobbin, N., St-Jean, M., Wallace, L., Marro, L., Shin, T., You, H., Kulka, R., Allen, R.W. and Wheeler, A.J. (2016) Can changing the timing of outdoor air intake reduce indoor concentrations of traffic-related pollutants in schools? Indoor Air, 26(5): 687-701.
- Maddalena, R., Mendell, M.J., Eliseeva, K., Chen, W.R., Sullivan, D.P., Russell, M., Satish, U., and Fisk, W.J. (2015) Effects of ventilation rate per person and per floor area and perceived air quality, sick building syndrome symptoms, and decision-making. Indoor Air, 25: 362-370.
- Mallach, G., St-Jean, M., MacNeill, M., Aubin, D., Wallace, L., Shin, T., Van Ryswyk, K., Kulka, R., You, H., Fugler, D., Lavigne, E. and Wheeler, A.J. (2017) Exhaust ventilation in attached garages improves residential indoor air quality. Indoor Air, 27(2): 487-499.
- Manzey, D. and Lorenz, B. (1998) Effects of chronically elevated CO2 on mental performance during 26 days of confinement. Aviation Space and Environmental Medicine, 69(5): 506-514 (as cited in NRC 2008).
- Maresh, C.M., Armstrong, L.E., Kavouras, S.A., Allen, G.J., Casa, D.J., Whittlesey, M. and LaGasse, K.E. (1997) Physiological and Psychological Effects Associated with High Carbon Dioxide Levels in Healthy Men. Aviation, Space, and Environmental Medicine, 68(1): 41-45.
- Matz, C.J., Stieb, D.M., Davis, K., Egyed, M., Rose, A., Chou, B. and Brion, O. (2014) Effects of age, season, gender and urban-rural status on time-activity: Canadian Human Activity Pattern Survey 2 (CHAPS 2). International Journal of Environmental Research and Public Health,11(2): 2108-2124.
- Maula, H., Hongisto, V., Naatula, V., Haapakangas, A., and Koskela, H. (2017) The effect of low ventilation rate with elevated bioeffluent concentration on work performance, perceived indoor air quality, and health symptoms. Indoor Air, 27: 1141-1153.
- McArdle, L. (1959) Electrocardiographic studies during the inhalation of 30 per cent carbon dioxide in man. British Journal of Anaesthesia, 31: 142-151 (as cited in Wong 1996).
- Mendell, M.J., Eliseeva, E.A., Davies, M.M. and Lobscheid, A. (2016) Do classroom ventilation rates in California elementary schools influence standardized test scores? Results from a prospective study. Indoor Air, 26: 546-557.
- Messier, A.A., Heyder, E., Braithwhaite, W.R., McCluggage, C., Peck, A. and Schaefer, K.E. (1979) Calcium, magnesium and phosphorus metabolism and parathyroid - calcitonin function during prolonged exposure to elevated CO2 concentrations on submarines. Undersea Biomedical Research, Submarine Supplement, S57.
- Miyaji, A., Ikemura, T., Hamada, Y. and Hayashi, N. (2015) Regional differences in the vascular response to CO2 among cerebral, ocular and mesenteric vessels. Artery Research, 12: 54-59.
- Muhtz, C., Daneshi, J., Braun, M. and Kellner, M. (2010) Carbon-dioxide-induced flashback in a healthy man with a history of near-drowning. Psychotherapy and Psychosomatics, 80(1): 55-56.
- Muscatiello, N., McCarthy, A., Kielb, C., Hsu, W.-H., Hwang, S.-A. and Lin, S. (2015) Classroom conditions and CO2 concentrations and teacher health symptom reporting in 10 New York State schools. Indoor Air, 25: 157-167.
- Myhrvold, A.N., Olsen, E. and Lauridsen, O. (1996) Indoor environment in schools - pupils health and performance in regard to CO2 concentrations. Proceedings, Indoor Air 1996: The 7th International Conference on Indoor Air Quality and Climate, Nagoya, Japan. 4: 369-374.
- Nagai, A., Thurlbeck, W.M., Deboeck, C., Ioffe, S., and Chernick, V. (1987) The effect of maternal CO2 breathing on lung development of fetuses in the rabbit. Morphologic and morphometric studies. American Review of Respiratory Disease, 135, 130-136 (as cited in Guais et al. 2011).
- NRC (2008) Spacecraft Maximum Allowable Concentrations for Selected Airborne Contaminants: Volume 5. Board on Environmental Studies and Toxicology. Carbon Dioxide. Chapter 7. Subcommittee on Emergency and Continuous Exposure Guidance Levels for Selected Submarine Contaminants, Committee on Toxicology, Board on Environmental Studies and Toxicology, Division on Earth and Life Studies, National Research Council of the National Academies. Report.
- Niemoleler H. and Schaefer, K.E. (1962) Development of hyaline membranes and atelectasis in experimental chronic respiratory acidosis. Proceedings of the Society for Experimental Biology and Medicine, 110: 804.
- Nillni, Y.I., Berenz, E.C., Rohan, K.J. and Zvolensky, M.J. (2012) Sex differences in panic-relevant responding to a 10% carbon dioxide-enriched air biological challenge. Journal of Anxiety Disorders, 26: 165-172.
- Norbäck, D., Nordström, K. and Zhao, Z. (2013) Carbon dioxide (CO2) demand-controlled ventilation in university computer classrooms and possible effects on headache, fatigue and perceived indoor environment: an intervention study. International Archives of Occupational and Environmental Health, 86: 199-209.
- Norbäck, D., Wieslander, G., Zhang, X. and Zhai, Z. (2011) Respiratory symptoms, perceived air quality and physiological signs in elementary school pupils in relation to displacement and mixing ventilation system: an intervention study. Indoor Air, 21: 427-437.
- Ogoh, S., Nakahara, H., Ueda, S., Okazaki, K., Shibasaki, M., Subudhi, A.W. and Miyamoto, T. (2014) Effects of acute hypoxia on cerebrovascular responses to carbon dioxide. Experimental Physiology, 99(6): 849-858.
- Pappens, M., De Peuter, S., Vansteenwegen, D., Van den Bergh, O. and Van Diest, I. (2012) Psychophysiological responses to CO2 inhalation. International Journal of Psychophysiology 84: 45-50.
- Petersen, S., Jensen, K.L., Pedersen, A.L.S., Rasmussen, H.S. (2016) The effect of increased classroom ventilation rate indicated by reduced CO2 concentration on the performance of schoolwork by children. Indoor Air, 26: 366-379.
- Pine, D.S., Klein, R.G., Coplan, J.D., Papp, L.A., Hoven, C.W., Martinez, J., Kovalenko, P., Mandell, D.J., Moreau, D., Klein, D.F. and Gorman, J.M. (2000) Differential carbon dioxide sensitivity in childhood anxiety disorders and non-ill comparison group. Archives of General Psychiatry, 57: 960-967.
- Portuguese Decree-law no. 79/2006 (as cited in da Conceição Ferreira and Cardoso, 2014).
- PubChem (Internet database) Available from: http://pubchem.ncbi.nlm.nih.gov. Bethesda (MD): U.S. National Library of Medicine.
- Radziszewski, E., Giacomoni, L. and Guillerm, R. (1988) Effets physiologiques chez l'Homme du confinement de longue durée en atmosphère enrichie en dioxyde de carbone. Proceedings of a Colloquium on 'Space & Sea', Marseille, France, 24-27 November 1987 (ESA SP-280, March 1988).
- Richie, I.M. and Otman, L.A., (1983) Residential air pollution from kerosene heaters. Journal of the Air Pollution Control Association. 33: 879 (as cited in Bureau of Chemical Hazards, 1985).
- Roberson-Nay, R., Klein, D.F., Klein, R.G., Mannuzza, S., Moulton III, J.L., Guardino, M. and Pine, D.S. (2010) Carbon dioxide hypersensitivity in separation-anxious offspring of parents with panic disorder. Biological Psychiatry, 67: 1171-1177.
- Ryu, J., Heldt, G.P., Nguyen, M., Gavrialov, O. and Haddad, G.G. (2010) Chronic hypercapnia alters lung matrix composition in mouse pups. Journal of Applied Physiology, 109: 203-210.
- Sanna, E., Cuccheddu, T., Serra, M., Concas, A. and Biggio, G. (1992) Carbon dioxide inhalation reduces the function of GABAA receptors in the rat brain. European Journal of Pharmacology, 216(3): 457-458.
- Satish, U., Mendell, M.J., Shekhar, K., Hotchi, T., Sullivan, D., Streufert, S., Fisk, W.J. (2012) Is CO2 an indoor pollutant? Direct effects of low-to-moderate CO2 concentrations on human decision-making performance. Environmental Health Perspectives, 120(12): 1671-1677.
- Sato, K., Sadamoto, T., Hirasawa, A., Oue, A., Subudhi, A.W., Miyazawa, T., Ogoh, S. (2012) Differential blood flow responses to CO2 in human internal and external carotid and vertebral arteries. Journal of Physiology, 590(14): 3277-3290.
- Schaefer, K.E. (1982) Effects of increased ambient CO2 levels on human and animal health. Experimentia, 38: 1163.
- Schaefer, K.E., Avery, M.E. and Bensch, K. (1964) Time course of changes in surface tension and morphology of alveolar epithelial cells in CO2-induced hyaline membrane disease. Journal of Clinical Investigation, 43: 2080-2093 (as cited in Wong, 1996).
- Schaefer, K.E., Douglas, W.H.J., Messier, A.A., Shea, M.L. and Gohman, P.A. (1979) Effect of prolonged exposure to 0.5% CO2 on kidney calcification and ultrastructure of lungs. Undersea Biomedical Research, S155-S161 (as cited in Wong, 1996).
- Schaefer, K.E., Hastings, B.J., Carey, C.R. and Nichols, G. (1963). Respiratory acclimatization to carbon dioxide, Journal of Applied Physiology, 18: 1071.
- Schaefer, K.E., Niemoller, H., Messier, A., Heyder, E. and Spencer, J. (1971) Chronic CO2 Toxicity: Species Difference in Physiological and Histopathological Effects. Report No 656, pp 1-26, US Navy Dept, Bureau of Medicine and Surgery, Naval Submarine Medical Center, Submarine Medical Research Laboratory, Groton, CT (as cited in ACGIH, 2001; Guais et al. 2011).
- Schwartz, L., Guais, A., Chaumet-Riffaud, P., Grévillot, G., Sasco, A.J., Molina, T.J. and Mohammad, A. (2010) Carbon dioxide is largely responsible for the acute inflammatory effects of tobacco smoke. Inhalation Toxicology, 22(7): 543-551.
- Sexton, J., Mueller, K., Elliott, A., Gerzer, D., Strohl, K.P. and West, J.B. (1998) Low level CO2 effects on pulmonary function in humans. Aviation, Space, and Environmental Medicine, 69(4): 387-390.
- Shaughnessy, R.J., Haverinen-Shaughnessy, U., Nevalainen, A. and Moschandreas, D. (2006) A preliminary study on the association between ventilation rates in classrooms and student performance. Indoor Air, 16: 465-468.
- Simoni, M., Annesi-Maesano, I., Sigsgaard, T., Norback, D., Wieslander, G., Nystad, D., Cancianie, M., Sestini, P. and Viegi, G. (2010) School air quality related to dry cough, rhinitis and nasal patency in children. European Respiratory Journal, 35: 742-749.
- Sinclair, R.D., Clark, J.M. and Welch, B.E. (1969) Carbon dioxide tolerance levels for space cabins. Proceedings of the Fifth Annual Conference on Atmospheric Contamination in Confined Spaces, Sept. 16-18, Wright-Patterson Air Force Base, Dayton, Ohio, R.D. O'Donnell, H.A. Leon, A. Azar, C.H. Wang, R.L. Patrick, W. Mautner, M.E. Umstead, and ML. Taylor, eds. Air Force Aerospace Medical Research Lab Wright-Patterson AFB, OH (as cited in NRC 2008).
- Singer, B.C., Zarin Pass, R., Delp, W.W., Lorenzetti, D.M. and Maddalena, R.L. (2017) Pollutants concentrations and emissions rates from natural gas cooking burners without and with range hood exhaust in nine California homes. Building and Environment, 122: 215-229.
- Sliwka, U., Kransney, J.A., Simon, S.G., Schmidt, P. and North, J. (1998) Effects of sustained low-level elevations of carbon dioxide on cerebral blood flow and autoregulation of the intracerebral arteries in humans. Aviation Space and Environmental Medicine, 69(3): 299-306 (as cited in NRC 2008).
- Statistic Canada (2017) The housing conditions of Aboriginal people in Canada. Available at: https://www12.statcan.gc.ca/census-recensement/2016/as-sa/98-200-x/2016021/98-200-x2016021-eng.pdf.
- St-Jean, M., St-Amand, A., Gilbert, N.L., Soto, J.C., Guay, M., Davis, K. and Gyorkos, T.W. (2012) Indoor air quality in Montréal area day-care centres, Canada. Environmental Research, 118: 1-7.
- Suk, W.A., Murray, K. and Avakian, M.D. (2003). Environmental hazards to children's health in the modern world. Mutation Research, 544: 235–242.
- Sun, M., Sun, C. and Yang, Y. (1996) Effect of low-concentration CO2 on stereoacuity and energy expenditure. Aviation Space and Environmental Medicine, 67(1): 34-39 (as cited in NRC 2008).
- Sundell, J. (1982) Guidelines for Nordic buildings regulations regarding indoor air quality. Environment International, 8: 17-20.
- Tachibana, K., Hashimoto, T., Takita, K., Ito, R., Kato, R. and Moromoto, Y. (2013) Neonatal exposure to high concentrations of carbon dioxide produces persistent learning deficits with impaired hippocampal synaptic plasticity. Brain Research, 1507: 83-90.
- Tang, X, Misztal, P.K., Nazaroff, W.W., and Goldstein, A.H. (2016) Volatile organic compound emission from humans indoors. Environmental Science and Technology, 50: 12686-12694.
- Tashkin, D.P. and Simmons, D.H. (1972) Effect of carbon dioxide breathing on specific airway conductance in normal and asthmatic subjects. American Review of Respiratory Disease, 106: 729-739 (as cited in Wong 1996).
- Thom, S.R., Bhopale, V.M., Hu, J., and Yang, M. (2017) Inflammatory responses to acute elevations of carbon dioxide in mice. Journal of Applied Physiology, 123: 297-302.
- Toftum, J., Kjeldsen, B.U., Wargocki, P., Menå, Hansen, E.M.N., and Clausen, G. (2015) Association between classroom ventilation mode and learning outcome in Danish schools. Building and Environment, 92: 494-503.
- Traynor, G.W. (1984) Person communication, Lawrence Berkeley Laboratory, Berkeley, CA (as cited in Bureau of Chemical Hazards 1985).
- Traynor, G.W., Apte, M.G., Dillworth, J.F. and Grimsrud, D.T. (1983) Indoor Air Pollution from Portable Kerosene-Fired Space Heaters, Lawrence Berkeley Laboratory, Berkeley, CA. LBL-15612, EEB Vent 83-2 (as cited in Bureau of Chemical Hazards 1985).
- Traynor, G.W., Apte, M.G., Dillworth, J.F., Hollowell, C.D. and Sterling, E.M. (1982) The effects of ventilation on residential air pollution due to emissions from a gas-fired range. Environment International, 8: 447 (as cited in Bureau of Chemical Hazards 1985).
- Tsai, D-H., Lin, J-S., and Chan, C-C. (2012) Office workers' sick building syndrome and indoor carbon dioxide concentrations. Journal of Occupational and Environmental Hygiene, 9(5): 345-351.
- Tsushima, S., Wargocki, P. and Tanabe, S. (2018) Sensory evaluation and chemical analysis of exhaled and dermally emitted bioeffluents. Indoor Air, 28: 146-163.
- Twardella, D., Matzen, W., Lahrz, T., Burghardt, R., Spegel, H., Hendrowarsito, L., Frenzel, A.C., Fromme, H. (2012) Effect of classroom air quality on students' concentration: Results of a cluster-randomized cross-over experimental study.Indoor Air, 22: 378-387.
- VanDemark, N.L., Schanbacher, B.D., and Gomes, W.R. (1972) Alterations in testes of rats exposed to elevated atmospheric carbon dioxide. Journal of Reproductive Fertility, 28: 457-459 (as cited in Guais et al. 2011).
- Vehviläinen, T., Lindholm, H., Rintamäki, H., Pääkkönen, R., Hirvonen, A., Niemi, O., and Vinha J. (2016) High indoor CO2 concentrations in an office environment increases the transcutaneous CO2 level and sleepiness during cognitive work. Journal of Occupational and Environmental Hygiene, 13(1): 19-29.
- Wargocki, P. and Wyon, D.P. (2007a) The effects of outdoor air supply rate and supply filter condition in classrooms on the performance of schoolwork by children. HVAC&R Research, 13(2): 165-191.
- Wargocki, P. and Wyon, D.P. (2007b) The effects of moderately raised classroom temperatures and classroom ventilation rate on the performance of schoolwork by children. HVAC&R Research, 13(2): 193-220.
- Wargocki, P., Wyon, D.P., Sundell, J., Clausen, G., and Fanger, P.O. (2000) The effects of outdoor air supply rate in an office on perceived air quality, sick building syndrome (SBS) symptoms and productivity. Indoor Air, 10: 222-236.
- Weichenthal, S., Mallach, G., Kulka, R., Black, A., Wheeler, A., You, H., St-Jean, M., Kwiatkowski, R., Sharp, D. (2012) A randomized double blind cross-over study of indoor air filtration and acute changes in cardiorespiratory health in a First Nations community. Indoor Air, 23(3): 175-184.
- Wheeler, A.J., Gibson, M., Ward, T.J., Allen, R.W., Guernsey, J.R., Seaboyer, M., Kuchta, J., Gould, R. and Stieb, D. (2011) Reductions in Residential Wood Smoke Concentrations and Infiltration Efficiency using Electrostatic Air Cleaner Interventions. Proceedings of the 12th International Conference on Indoor Air Quality and Climate 2011: Austin, Texas, USA, 5 - 10 June 2011 / [International Society of Indoor Air Quality and Climate (ISIAQ)]; Vol. 4.
- Whitmyre, G.K and Pandian M.D. (2018) Probabilistic assessment of the potential indoor air impacts of vent-free gas heating appliances in energy-efficient homes in the United States. Journal of the Air and Waste Management Association, 68(6): 616-625.
- Willers, S.M., Brunekreef, M., Oldenwening, H.A., Smit, M. Kerkhof, H. and De Vries. (2006) Gas cooking, kitchen ventilation, and exposure to combustion products. Indoor Air, 16: 65-73.
- Wise, P.M., Wysocki C.J. and Radil. T. (2003) Time-intensity ratings of nasal irritation from carbon dioxide. Chemical Senses, 28: 751-760.
- Wong, K.L. (1996) Spacecraft maximum allowable concentrations for selected airborne contaminants. Volume 2. B3. Carbon Dioxide.
- Woods, S.W., Charney, D.S., Goodman, W.K. and Heninger, G.R. (1988) Carbon dioxide-induced anxiety: Behavioral, physiologic, and biochemical effects of carbon dioxide in patients with panic disorders and healthy subjects. Archives of General Psychiatry, 45(1): 43-52.
- Yang, Y., Sun, C. and Sun, M. (1997) The effect of moderately increased CO2 concentration on perception of coherent motion. Aviation Space and Environmental Medicine, 68(3): 187-191 (as cited in NRC 2008).
- Zhang, X., Wargocki, P. and Lian, Z. (2017) Physiological responses during exposure to carbon dioxide and bioeffluents at levels typically occurring indoors. Indoor Air, 27: 65-77.
- Zhang, X., Wargocki, P., Lian, Z. and Thyregod, C. (2017) Effects of exposure to carbon dioxide and bioeffluents on perceived air quality, self-assessed acute health symptoms, and cognitive performance. Indoor Air, 27: 47-64.
- Ziska, I.H., Ghannoum, O., Baker, J.T., Conroy, J., Bunce, J.A., Kobayashi, K. and Okada, M. (2001) Global Change Biology, 7: 789-796.
Appendix A: List of acronyms and abbreviations
- ACH
- Air changes per hour
- AER
- Air exchange rate
- ALTER
- Acceptable long-term exposure range
- ANSES
- Agence nationale de sécurité sanitaire de l'alimentation, de l'environnement et du travail (France)
- ASHRAE
- American Society of Heating, Refrigerating and Air-Conditioning Engineers
- CO2
- Carbon dioxide
- CO
- Carbon monoxide
- DNA
- Deoxyribonucleic acid
- dUTP
- Deoxyuridine Triphosphate
- GABAA
- Gamma-aminobutyric acid
- H+
- Hydrogen ion
- H2CO3
- Carbonic acid
- HCO3-
- Bicarbonate ion
- MHPG
- 3-Methoxy-4-hydroxyphenylglycol
- Na+
- Sodium ion
- PaCO2
- Arterial partial pressure of carbon dioxide
- PM
- Particulate matter
- RIAQG
- Residential Indoor Air Quality Guidelines
- SMS
- Strategic Management System
- TUNEL
- Terminal deoxynucleotidyl transferase dUTP nick end labelling
- TVOC
- Total volatile organic compounds
- VOC
- Volatile organic compound
Appendix B: Human studies on the health effects of CO2 exposure
| Concentration (ppm) | Duration of exposure | Number of subjects | Study characteristics | Results | Reference |
|---|---|---|---|---|---|
600, 1000, 2500 |
2.5 hrs |
22 |
600 ppm: outdoor ventilation and occupant-generated CO2 1000 ppm, 2500 ppm: pure CO2 injected into chamber SMS test |
At 1000 ppm, 6 out of 9 scales of decision-making performance statistically were significantly reduced (relative to 600 ppm) (p < 0.05). At 2500 ppm, 7 out of 9 scales of decision-making performance were statistically significantly reduced (p < 0.01). |
Satish et al. (2012) |
600, 1500, 2500, 3000, 4000, 5000 |
2–3 × 70 min |
10 |
Pure CO2 injected into chamber Questionnaires, physiological measures, mental work (proofreading) |
Series 1: increased reported fatigue, and increased absolute and relative values of MF of HPV (used to measure mental effort required by the task) at 5000 ppm compared to 600 ppm (p < 0.05) Series 2: decreased performance on the mental task, and increased mental effort required by the task (as measured by MF of HPV) at 3000 and 4000 ppm compared to 600 ppm (p < 0.05) |
Kajtar and Herczeg (2012) |
1266, 477, 195 above outdoor levels (i.e., low, mid and high ventilation conditions) |
275 min |
30 |
Outdoor ventilation and occupant-generated CO2 Toluene-equivalent TVOC concentration not affected by the ventilation; temperature, relative humidity and noise kept constant Office performance tasks (proofreading, text typing, addition, and creative thinking) |
Increasing ventilation increased perceived air quality (p < 0.002), decreased symptom reporting (e.g., mouth and throat dryness) (p < 0.0006) and eased difficulty in thinking clearly (p < 0.001). Task performance improved with increasing ventilation; the effect only reached statistical significance (p < 0.03) for text typing |
Wargocki et al. (2000) |
550, 945, 1400 |
8 hrs |
24 |
Outdoor ventilation and occupant-generated CO2 Two ventilation conditions (20 and 40 cfm/person), three different CO2 concentrations (550, 945, and 1400 ppm), and two VOC conditions (low: TVOC < 60 µg/m3; elevated: TVOC ~ 500 µg/m3) were applied over the course of the study. Other parameters (e.g., temperature, humidity, PM levels, and noise) were maintained. SMS test |
Ventilation rate and CO2 concentration were independently associated with cognitive test performance (p < 0.0001). A 400 ppm increase in CO2 was associated with a 21% decrease in test scores and a 20 cfm increase in ventilation rate was associated with an 18% increase in test scores. VOC levels independently associated with performance on cognitive tests (p < 0.0001). Cognitive function scores were higher under the low-VOC condition for all nine functional domains. |
Allen et al. (2016) |
540, 2260 |
4 hrs |
36 |
Condition A: filtered outdoor air Condition B: occupant-generated CO2 and bioeffluents Seven cognitive performance tasks (i.e., typing, star counting, operation span, N-back, information retrieval, creative thinking, and long-term memory tasks) and questionnaires |
Condition B increased perceived workload and perceived fatigue, and decreased perceived air quality (p < 0.05) vs. Condition A. Condition B negatively affected performance on speed in information retrieval (p = 0.009) and trended negatively for accuracy in operation span test, with the other five tasks remaining unaffected. |
Maula et al. (2017) |
900, 1800 |
4 hrs |
16 |
Outdoor ventilation and occupant-generated CO2 Low ventilation condition: 2.6 l/sec-person (1100–1800 ppm CO2, ~ 50 mg/m3 TVOC) High ventilation condition: 8.5 l/sec-person (800–900 ppm CO2, ~ 125 mg/m3 TVOC) Temperature and relative humidity were consistent across all conditions and within each condition. SMS test and questionnaire |
Pair-wise analysis of variance revealed a modest but significant (p < 0.001–0.299 for the eight performance metrics) decrease in decision-making performance as the ventilation rate per person decreased. |
Maddalena et al. (2015) |
906 (±249), 2756 (±1100) |
3 × 4 hrs |
4 |
Outdoor ventilation and occupant-generated CO2 Condition A: ventilation system off for a one-week period Condition B: ventilation system on for a one-week period Questionnaires, physiological measures |
Increases in blood CO2 concentration, changes in heart rate variability, and increased peripheral blood circulation were measured under non-ventilated conditions. Increased reported headache and sleepiness symptoms under non-ventilated conditions. The observed changes were associated with concomitant increases in concentrations of CO2, VOCs, and PM as well as with increased temperature and relative humidity. |
Vehviläinen et al. (2016) |
500, 1000, 3000 |
255 min |
25 |
500 ppm CO2: outdoor ventilation 1000 and 3000 ppm CO2 without bioeffluents: pure CO2 injected 1000 and 3000 ppm CO2 with bioeffluents: fresh air intake reduced to allow CO2 and bioeffluents to build up Questionnaires, physiological measures, "office-like" tasks (e.g., text typing), cognitive tests (e.g., attention level), and neurobehavioral tests (e.g., grammatical reasoning) |
Compared to 500 ppm CO2: At 3000 ppm CO2 with bioeffluents: reduced perceived air quality, increased intensity of reported headaches, fatigue, sleepiness and difficulty in thinking clearly. At 3000 ppm CO2 with bioeffluents: decreased speed of addition, increased redirection response time, and decreased the number of Tsai-Partington correct linkages (cue-utilization capacity test). No effect of CO2 without bioeffluents on perceived air quality, headache, ability to think clearly, fatigue or cognitive performance. |
Zhang et al. (2017) |
500, 1000, 3000 |
255 min |
25 |
500 ppm CO2: outdoor ventilation 1000 and 3000 ppm CO2 without bioeffluents: pure CO2 injected 1000 and 3000 ppm CO2 with bioeffluents: fresh air intake reduced to allow CO2 and bioeffluents to build up Questionnaires, physiological measures, "office-like" tasks (e.g., text typing), cognitive tests (e.g., attention level) and neurobehavioral tests (e.g., grammatical reasoning) |
3000 ppm CO2 without bioeffluents increased end-tidal CO2 and heart rate compared to the reference CO2 condition (500 ppm). 1000 and 3000 ppm CO2 with bioeffluents significantly increased diastolic blood pressure and reduced nasal peak flow compared to pre-exposure levels, and increased heart rate compared to 500 ppm CO2 exposure. |
Zhang, Wargocki and Lian (2017) |
| Notes: HPV = heart period variability; MF = mid-frequency component | |||||
| Health outcomes | CO2 exposure concentration (Mean ± SD [range] ppm) | Population characteristics | Study characteristics | Results | Reference, study location |
|---|---|---|---|---|---|
Respiratory, ocular effects |
590–867 |
61 children |
Intervention, school setting 3 days/week for 3 weeks (one control and 2 intervention weeks) Questionnaires, medical testing (tear film stability, nasal patency) Not controlled for other pollutants |
When the ventilation system in the intervention classroom was changed from "mixing" (week 1) to "front ventilation," (week 2) mean CO2 concentration at desk level was reduced from 867 to 655 ppm. The control classroom (front ventilation) was at 590 for the first week and 625 ppm for the second. In week 1, dyspnea was greater in the intervention classroom compared to the control (p<0.001), and improved during week 2. |
Norbäck et al. (2011), Sweden |
Respiratory, ocular effects |
431 (± 19) 876 (± 48) (658–959) |
111 workers |
Cross-sectional (repeated), office setting Two study periods: 1 week in August, 1 week in November Questionnaires PM levels kept constant (i.e., air filters) |
Responses in week 1 (August): mean concentration 431 ppm compared to week 2 (November): mean 876 ppm Workers exposed to > 800 ppm indoor CO2 were more likely to report "eye irritation" (OR = 1.7; 95% CI = 1.1–2.7) and "upper respiratory symptoms" (OR = 1.7; 95% CI = 1.0–2.7) than those exposed to CO2 concentrations < 500 ppm. Workers exposed to > 800 ppm indoor CO2 were also likely to report more "tired or strained eyes" (OR = 1.7, 95% CI = 1.1–2.7), "dry, itching, or irritated eyes" (OR = 1.8, 95% CI = 1.2–2.8), and "difficulty in remembering things or in concentrating" (OR = 1.7, 95% CI = 1.0–2.9). Headache was marginally increased when the CO2 concentrations were greater than 800 ppm. |
Tsai, Lin and Chan (2012), Taiwan |
Respiratory effects |
1440 (median) |
Phase 1: 3186 children; mean age = 3.1 yrs Phase 2: 1196 children (sub-sample of phase 1 children) |
Cross-sectional, daycare centre setting Questionnaires Not controlled for other pollutants |
Phase 1: association between wheezing in the previous 12 months and indoor CO2 concentration (median value = 1440 ppm) (OR = 1.04; p = 0.008). No associations were found between CO2 level and reported diagnosis of asthma. Phase 2: the association between wheezing and CO2 concentration in classrooms was not found to be significant. |
Carreiro-Martins et al. (2014), Portugal |
Respiratory effects |
dCO2 (average indoor minus average outdoor) 6–418 ppm |
1970 workers |
Cross-sectional, office setting Assessment of data from the Building Assessment Survey and Evaluation study Not controlled for other pollutants |
Statistically significant dose-response relationship between differential CO2 concentration (i.e., difference between indoor and outdoor CO2) and respiratory symptoms (e.g., sore throat, nose/sinus symptoms, tight chest, and wheezing). For every 100 ppm increase in indoor CO2 relative to outdoor, ORs for those symptoms increased between 1.2 and 1.5 (p < 0.05). |
Apte, Fisk and Daisey (2000), United States |
Respiratory effects |
dCO2 (average indoor minus average outdoor) 40–610 ppm (mean 260) |
Not specified |
Cross-sectional, office setting Assessment of data from the Building Assessment Survey and Evaluation study Not controlled for other pollutants |
Association between elevated indoor CO2 levels and increased prevalence of certain mucous membrane and lower respiratory building related symptoms. Adjusted ORs per 100 ppm CO2 increase were statistically significant (p < 0.05) for: mucous membrane = 1.08 (95% CI = 1.02–1.15); dry eyes = 1.09 (95% CI = 1.02–1.17); sore throat = 1.21 (95% CI = 1.09‑1.34); nose/sinus = 1.11 (95% CI = 1.02–1.2); sneezing = 1.09 (95% CI = 1.00–1.19); and wheezing = 1.23 (95% CI = 1.01–1.48). Building occupants with certain environmentally mediated health conditions (e.g., allergies and asthma) were more likely to report that they experienced symptoms than those without these conditions (statistically significant ORs ranged from 1.5 to 11.1, p < 0.05). |
Erdmann and Apte (2004), United States |
Respiratory effects |
681–1954 (range: 525–3475) |
654 children; mean age = 10 ± 0.8 yrs |
Cross-sectional, school setting Questionnaires, clinical tests Controlled for PM10 |
Based on ASHRAE standard, exposures were grouped into those > 1000 and those Children exposed to CO2 levels > 1000 ppm showed a significantly higher risk of dry cough (OR = 2.99, 95% CI = 1.65–5.44) and rhinitis (sneezing or a runny or blocked nose) (OR = 2.07, 95% CI = 1.14–3.73). By two-level (child, classroom) hierarchical analyses, CO2 was significantly associated with dry cough (OR = 1.06, 95% CI = 1.00–1.13 per 100 ppm increment) and rhinitis (OR = 1.06, 95% CI = 1.00–1.11). Significant positive associations were found with small 100 ppm increments of CO2. |
Simoni et al. (2010), Italy, France, Norway, Sweden, and Denmark |
Respiratory effects |
2417 ± 839 (range: 907–4113) |
1028 children; mean age = 10 yrs |
Cross-sectional, school setting Questionnaires Controlled for co-pollutants (nitrogen dioxide, ozone, ultrafine particles, formaldehyde) |
Adjusted significant OR for a 100 ppm increase in CO2 of 1.03 (95% CI = 1.001–1.06) for wheeze. No significant ORs for other symptoms (e.g., headaches, tiredness). |
Kim et al. (2011), Korea |
Respiratory, neurological effects |
1160 ± 604 (range: 467–2800) |
417 workers |
Cross-sectional, office setting Questionnaires Controlled for TVOC |
Adjusted significant ORs for a 100 ppm increase in indoor CO2 of 1.10 (95% CI = 1.00–1.22) for dry throat, 1.16 (95% CI = 1.07–1.26) for tiredness and 1.22 (95% CI = 1.08–1.37) for dizziness. |
Lu et al. (2015), Taiwan |
Respiratory, neurological effects |
1250–1500 (median) (range: 750–2100) |
193 students, 11 years old |
Cross-sectional, school setting Questionnaires, performance tests Controlled for PM2.5, PM5, and PM10 |
Symptoms (such as allergies, nose irritation, and fatigue) were positively correlated to indoor CO2 concentration. An increase of 17.01% in indoor CO2 concentrations (CO2 range not specified) was determined to decrease performance on tests by 16.13%. |
Dorizas, Assimakopoulos and Santamouris (2015), Greece |
Respiratory, neurological effects |
601–3827 |
550 students |
Cross-sectional, school setting Questionnaires, performance tests Not controlled for other pollutants |
Exposures were grouped into those < 1000 ppm, 1000-1499 ppm and > 1500 ppm. Association between an increased prevalence of health symptoms (i.e., health index 1: headache, dizziness, heavy headedness, tiredness, difficulty concentrating, unpleasant odour) and classroom concentration > 1500 ppm. Association between increased classroom CO2 concentration and prevalence of upper airway irritation symptoms (i.e., throat/nose irritation, runny nose, coughing, short-winded, runny eyes). Association between decreased performance and increased CO2 level. Performance decreased at 1000–1499 ppm CO2 relative to < 999 ppm, and further decrease at CO2 concentrations > 1500 ppm. |
Myhrvold, Olsen and Lauridsen (1996), Norway |
Neurological effects |
812 (range 352–1591) |
68 teachers |
Cross-sectional, school setting Questionnaires Not controlled for other pollutants |
The odds of reporting neurophysiological symptoms (i.e., headache, fatigue, difficulty concentrating) significantly increased (OR = 1.30, 95% CI = 1.02–1.64) for every 100 ppm increase in maximum classroom CO2 concentrations. The calculated OR for symptom reporting was increased, but not statistically significant, in classrooms with above-median proportions of CO2 concentrations > 1000 ppm. |
Muscatiello et al. (2015), United States |
Neurological effects |
Not specified |
Students from 54 fifth grade classrooms (number of students not specified) |
Cross-sectional, school setting Linear regression analysis of standardized test scores for students who attended monitored classrooms (i.e., tests were not administered on the day of CO2 monitoring). |
Association between ventilation rate and mathematics test scores (p < 0.10). |
Shaughnessy et al. (2006), United States |
Neurological effects |
Fall/winter: 1578.16 (± 712.49) Spring/summer: 1152.80 (± 595.41) |
1019 students |
Cross-sectional, school setting Questionnaires Not controlled for other pollutants |
Exposures were grouped into those < 984 and those > 984 ppm (maximum reference level according to Portuguese law) Association between CO2 levels > 984 ppm and lack of concentration (p = 0.002) No statistically significant association was found for other symptoms/illness (such as asthma, bronchitis, wheezing, coughing, headache or stress). |
da Conceição Ferreira and Cardoso (2014), Portugal |
Neurological effects |
Maximum: 661–6000 |
87 fifth grade classrooms |
Cross-sectional, school setting Linear regression analysis of percentage of students scoring satisfactory or above in standardized tests in monitored classrooms and estimated ventilation rates (i.e., tests were not administered on the day of CO2 monitoring). |
A linear relationship (not statistically significant) was found between ventilation and academic achievement for ventilation rates in the range of 0.09 to 7.1 l/sec-person. |
Haverinen-Shaughnessy, Moschandreas and Shaughnessy 2011, United States |
Neurological effects |
Not specified |
3019 fifth grade students |
Cross-sectional, school setting Multivariate model analysis of standardized test scores for students who attended monitored classrooms and estimated ventilation rates (i.e., tests were not administered on the day of CO2 monitoring) |
Association between ventilation rates and mathematics scores. For each l/sec-person increase in ventilation, a 0.5% increase in test scores was observed. Similar but more variable effects were observed for reading and science scores. |
Haverinen-Shaughnessy and Shaughnessy (2015), United States |
Neurological effects |
range: 600–7000 |
5046 (English test) and 5455 (Math test) students from three school districts |
Cross-sectional, school setting Multivariate model analysis of standardized test scores for students who attended monitored classrooms and estimated average ventilation rates for 30 days prior to the test or proportion of daily ventilation rates above specified thresholds during the year |
Combined-school district models estimated statistically significant increases of 0.6 points (P = 0.01) on English tests for each 10% increase in prior 30-day ventilation rates. Estimated increases in Math scores were of similar magnitude but not statistically significant. |
Mendell et al. (2016), United States |
Neurological effects |
Phase 1, median: 1600 (range: 400–4000) Phase 2, median: 2875 (range: 900–4597) |
2192 records of class average test scores from 264 schools |
Cross-sectional, school setting Gaussian generalized linear model analysis of achievement indicators (calculated from standardized test scores adjusted for a socioeconomic reference index) and ventilation mode (i.e., mechanical balanced, mechanical exhaust and natural ventilation) |
Statistical analysis of phases 1 and 2 merged datasets indicated that the lowest achievement indicators for all subject areas were for students in naturally-ventilated classrooms. There was no consistent association between the achievement indicators and the person specific room volume, construction/renovation year or the occupancy. |
Toftum et al. (2015), Denmark |
Neurological effects |
Variable ventilation flow: 784 (9% of time > 1000) Constant ventilation flow: 809 (25% of time > 1000) |
62 students |
Intervention, school setting Two weeks (one week with variable flow ventilation, one week with constant flow ventilation) Questionnaires |
Reports of headaches and tiredness were increased under constant flow conditions (p = 0.003 and p = 0.007) vs. variable flow conditions. Perceived air quality was worse under constant flow conditions, but was not statistically significant (p = 0.09). |
Norbäck, Nordström and Zhao (2013), Sweden |
Neurological effects |
Estimated range: 365–965Table B2 Footnote a |
119 |
Intervention, office setting (call centre) Variations in ventilation conditions over a 3-month period. Differential CO2 between the return air and the outdoor air was used as a ventilation metric. Individual and group work performance indicators |
Association between decreased ventilation rates (i.e., less than 100% outdoor air) and lower work performance. |
Federspiel et al. (2004), United States |
Neurological effects |
690 (± 122)–2909 (± 474) |
18 |
Intervention, school setting Variations in ventilation conditions (i.e., window closed or opened) Cognitive function assessment test Not controlled for other pollutants |
Association between increased CO2 concentration (i.e., 2909 ppm vs 690 ppm) and decreased power of attention (p = 0.004), simple reaction time task (p = 0.02) and choice reaction time (p = 0.08). |
Coley, Greeves and Saxby (2007), England |
Neurological effects |
904–1296 |
Two classrooms of 10- to 12-year-old students (up to 46 students) |
Intervention, school setting Variations in ventilation conditions Exercises representing numerical- or language-based schoolwork tasks Not controlled for other pollutants |
Performance (mainly in terms of speed at which the tasks were performed rather than the error rate) improved when ventilation increased (as measured by decreased CO2 concentration, i.e., from ~ 1300 to ~ 900 ppm) (p = 0.001–0.039). |
Wargocki and Wyon (2007a, 2007b), Denmark |
Neurological effects |
Median: 1045–2115 |
417 students (grade 3 or 4) |
Intervention, school setting Variations in ventilation conditions Concentration performance test (i.e., d2-test) |
No significant effect on concentration performance or total number of characters processed was found, but the total number of errors increased significantly in "worse" compared to "better" ventilation condition. |
Twardella et al. 2012, Germany |
Neurological effects |
790–1610 peak: 1040–2780 |
Four classrooms of 10- to 12-year-old students (70–79 students) |
Intervention, school setting Variations in ventilation conditions (i.e., ventilation with outdoor air or recirculated air) Language and mathematic performance tests, questionnaires |
As outdoor fresh air supply rate was increased from an average of 1.7 to 6.6 l/sec-person (estimated by converting measured CO2 concentration to a per person ventilation rate), the number of correct answers increased by 6.3% in the addition test, by 4.8% in the number comparison test, by 3.2% in the grammatical reasoning test, and by 7.4% in the reading and comprehension test (p < 0.01–0.04). |
Pertersen et al. (2016), Denmark |
Neurological effects |
644–2822 peak: 1115–5000 |
332 students |
Intervention, school setting Variations in ventilation conditions (i.e., ventilation with outdoor air or recirculating air) Performance tests, questionnaires |
Performance on four of the tests (choice reaction [by 2.2%], colour word vigilance [by 2.7%], picture memory [by 8%], and word recognition [by 15%]) was improved significantly under higher ventilation conditions (from 1 to 8 l/sec-person) (p < 0.001–0.04). |
Bako-biro et al. (2012), United Kingdom |
Notes: CI = confidence interval; dCO2 = differential CO2 (inside minus outside); HPV = heart period variability; MF = mid-frequency component; OR = odds ratio; PM2.5 = particulate matter < 2.5 µm in diameter; PM5 = particulate matter < 5 µm in diameter; PM10 = particulate matter < 10 µm in diameter
|
|||||
Appendix C: International guidelines and standards for CO2
Indoor CO2 concentrations are often used as a surrogate for ventilation rate and as an indicator for other occupant-derived pollutant (bioeffluent) concentrations and odours. It is in this context that many building standards and guidelines for CO2 were established (i.e., they are not based on the intrinsic health effects of CO2). For example, the ASHRAE standard on ventilation for acceptable indoor air quality recommends maintaining indoor CO2 levels at no greater than 700 ppm above ambient levels to indicate adequate ventilation for occupant comfort with respect to bioeffluents (ASHRAE 2016). As the outdoor CO2 level is assumed to range between 300 and 500 ppm, the indoor air concentration of CO2 should be maintained below 1000 ppm (ASHRAE 2016).
Standards and guidelines for CO2 in residential, school, and office buildings were summarized as part of the Agence nationale de sécurité sanitaire de l'alimentation, de l'environnement et du travail (ANSES 2013) assessment of CO2 in indoor air. Table C1 presents standards and guidelines set for CO2 by organizations in member countries of the Organisation for Economic Co-operation and Development (OECD), as reported in ANSES (2013), as well as other standards reported in the published literature. For many countries (e.g., United States, France, Norway, Germany, Portugal, Korea, Japan), the standards or guidelines established for CO2 were ≤ 1000 ppm (ranging from 600 to 1000 ppm).
ANSES (2013) conducted an assessment of CO2 in indoor air and its health effects to support the updating of building ventilation regulations. Based on a review of the data available at that time, ANSES concluded that "the available epidemiological data do not enable setting a threshold value for CO2 that would protect individuals from the effects of closed spaces on health, on perceived comfort and on cognitive performance." On this basis, ANSES recommended that indoor air quality guideline values for CO2 not be set, neither for its intrinsic effects nor for closed space effects on health.
| Country | Value | Organization/ Standard/ Regulation | Reference | Note |
|---|---|---|---|---|
United States |
No more than about 700 ppm above outdoor ambient levels |
ASHRAE |
ASHRAE (2016) |
Ambient levels: immediate environment levels of air quality (odour) |
New Zealand |
1000 ppm |
Mechanical ventilation standard |
CSTB (2011) (cited in ANSES 2013) |
Standard/guideline for school buildings |
European Union |
< 400 ppm above outdoor level |
NF EN 13779 standard |
CSTB (2011) (cited in ANSES 2013) |
Excellent indoor air quality |
400–600 ppm above outdoor level |
Average indoor air quality |
|||
600–1000 ppm above outdoor level |
Moderate indoor air quality |
|||
> 1000 ppm above outdoor level |
Low indoor air quality |
|||
France |
1000 ppm |
Memorandum dated August 9, 1978. |
CSTB (2011) (cited in ANSES 2013) |
Standard/guideline for school and office buildings |
Austria |
1000 or 1500 ppm (under discussion) |
AIVC 2000 |
CSTB (2011) (cited in ANSES 2013) |
Standard/guideline for school buildings |
United Kingdom |
1500 ppm (school day average) 5000 ppm (maximum) |
Building Bulletin 101 |
CSTB (2011) (cited in ANSES 2013) |
Standard/guideline for school buildings |
Belgium (Flemish region) |
500 ppm |
Flemish government decree |
CSTB (2011) (cited in ANSES 2013) |
Standard/guideline for residential, school and office buildings |
Holland |
1000–1500 ppm |
Standard NEN 1087 |
CSTB (2011) (cited in ANSES 2013) |
Standard/guideline for residential buildings |
1200 ppm |
Standard NEN 1089 |
CSTB (2011) (cited in ANSES 2013) |
Standard/guideline for school buildings |
|
Denmark |
1000 ppm with an upper limit of 2000 ppm |
AIVC 2000 |
CSTB (2011) (cited in ANSES 2013) |
Standard/guideline for school buildings |
Norway |
1000 ppm |
Regulations for environmental health protection in schools |
CSTB (2011) (cited in ANSES 2013) |
Standard/guideline for school buildings |
Finland |
700 ppm as individual indoor climate (S1) |
FiSIAQTable C1 Footnote a |
FiSIAQ 2002 |
Category S1: it corresponds to the best quality. The indoor air quality of the space is very good and the thermal conditions are comfortable both in summer and winter. |
900 ppm as good indoor climate (S2) |
Category S2: the indoor air quality of the space is good and no draughts occur. The temperature may rise above comfortable levels during the hottest days of summer. |
|||
1200 ppm as satisfactory indoor climate (S3) |
Category S3: the indoor air quality and the thermal conditions of the space fulfill the requirements set by the building codes. The indoor air may occasionally feel stuffy and draughts may occur. The temperature usually rises above comfort levels on hot summer days. |
|||
1200 ppm |
D2 National Building Code |
CSTB (2011) (cited in ANSES 2013) |
Standard/guideline for residential, school, and office buildings |
|
Germany |
< 1000 ppm (harmless) 1000–2000 ppm (elevated) > 2000 ppm (unacceptable) |
German Committee on Indoor Guide Values |
Fromme et al. (2019) |
Indoor CO2 concentrations can be regarded as "harmless" if below 1000 ppm, "elevated" if between 1000 and 2000 ppm, and "unacceptable" if above 2000 ppm. |
1500 ppm |
DIN 1946 Standard |
CSTB (2011) (cited in ANSES 2013) |
Standard/guideline for school buildings |
|
Portugal |
≤ 984 ppm |
Portuguese Ministry of Public Works, Transport and Communications |
Portuguese Decree-law no. 79/2006 (cited in da Conceição Ferreira 2014) |
|
1000 ppm |
Regulation RSECE |
CSTB (2011) (cited in ANSES 2013) |
Standard/guideline for school and office buildings |
|
Korea |
1000 ppm |
KEITITable C1 Footnote b |
Jeong (2008); CSTB (2011) (cited in ANSES 2013) |
Standard/guideline for residential and office buildings |
Health act in school |
CSTB (2011) (cited in ANSES 2013) |
Standard/guideline for school buildings |
||
Japan |
1000 ppm |
CSTB (2011) (cited in ANSES 2013) |
Building standard law |
|
Note: Acute exposure (i.e., 15-minute average) standards and guidelines were not included in this table.
|
||||
Page details
- Date modified: