
Guidelines for Canadian Drinking Water Quality: Guideline Technical Document – Lead
Download the alternative format
(PDF format, 1 MB 113 pages)
Organization: Health Canada
Published: 2019-03-08
March, 2019
Table of Contents
- Part I. Overview and Application
- Part II. Science and Technical Considerations
- 4.0 Identity, use and sources in the environment
- 5.0 Exposure
- 6.0 Analytical methods
- 7.0 Treatment technology and distribution system considerations
- 8.0 Kinetics and metabolism
- 9.0 Health effects
- 10.0 Classification and assessment
- 11.0 Rationale
- 12.0 References
- Appendix A: List of acronyms
Part I. Overview and Application
1.0 Guideline
The maximum acceptable concentration (MAC) for total lead in drinking water is 0.005 mg/L (5 µg/L), based on a sample of water taken at the tap and using the appropriate protocol for the type of building being sampled. Every effort should be made to maintain lead levels in drinking water as low as reasonably achievable (or ALARA).
2.0 Executive summary
Lead is usually found in drinking water as a result of leaching from distribution and plumbing system components, particularly in aggressive (corrosive) waters. Historically, lead has been used extensively in service lines, solders and fittings, making its presence in drinking water more likely in older homes and neighbourhoods.
This guideline technical document reviews and assesses all identified health risks associated with lead in drinking water. It assesses new studies and approaches and takes into consideration the availability and limitations of appropriate treatment and analytical technologies. The information contained in this document is complementary to that found in Guidance on Controlling Corrosion in Drinking Water Distribution Systems.
2.1 Health effects
Inorganic lead compounds have been classified as probably carcinogenic to humans, based on findings in experimental animals. However, the cancer effects are not the main health effects of concern in humans.
The toxicity of lead has been extensively documented in humans, based on blood lead levels (BLLs). Effects that have been studied include increased blood pressure and renal dysfunction in adults, as well as adverse cognitive and behavioural effects in children. The strongest association observed to date is between increased BLLs in children and reductions in intelligence quotient (IQ) scores, which is the key health endpoint of concern. The threshold below which lead is no longer associated with adverse neurodevelopmental effects has not been identified. As the MAC exceeds the drinking water concentration associated with neurodevelopmental effects in children, every effort should be made to maintain lead levels in drinking water as low as reasonably achievable (or ALARA).
2.2 Exposure
Lead is commonly found in the environment, both naturally and as a result of human activities. Canadians are exposed to small amounts of lead in water, food, air, soil and consumer products. Lead has historically been used in drinking water distribution and plumbing systems, as well as in paints and as an additive in gasoline. Significant reductions of lead in products such as gasoline and paints mean that food and drinking water have become more important sources of lead exposure for average adult populations. Inhalation can also be an important source for individuals residing in the vicinity of point sources, such as racetracks and airports where leaded gasoline may still be used.
2.3 Analysis and treatment
The establishment of a drinking water guideline must take into consideration the ability to measure the contaminant. There are several methods available for the analysis of total lead in drinking water. Based on the capacity of commercial laboratories in Canada, analytical methods are available to reliably measure total lead in drinking water below the MAC. These methods require sample preparation steps to ensure that they are able to detect both dissolved and particulate lead.
The guideline development process also considers the ability to remove the contaminant from drinking water supplies to meet the MAC. Although there are treatment technologies that can remove lead efficiently at the treatment plant, municipal treatment alone is may not be an effective strategy to reduce lead to concentrations at the tap below the MAC. This is because materials used in the distribution and plumbing systems, such as service lines, solder and fittings, may contain lead, which may leach into the water and be found at the tap as a result of corrosion in these systems. Consequently, the best approach to minimize exposure to lead from drinking water at the municipal level is to remove the full service line and to control corrosion in the distribution and treatment systems.
As the primary source of lead in drinking water is the leaching from distribution and plumbing system components, drinking water treatment devices offer an effective option to lower exposure to lead from drinking water at the residential level. However, their use should not be considered to be a permanent solution because filters must be replaced regularly and the systems require ongoing maintenance. There are a number of certified residential treatment devices available that can remove lead from drinking water.
2.4 International considerations
Drinking water guidelines, standards and/or guidance from other national and international organizations may vary due to the age of the assessments as well as differing policies and approaches, including the choice of key study and the use of different consumption rates, body weights and allocation factors.
Various organizations have established values for lead in drinking water. The U.S. EPA has not established a maximum contaminant level for lead in drinking water, but has a maximum contaminant level goal of zero, and has established an action level of 0.015 mg/L (15 µg/L ) in its treatment-based Lead and Copper Rule, though a revision of this rule is currently underway. The World Health Organization has established a provisional drinking-water quality guideline of 0.01 mg/L (10 µg/L), the European Union directive includes a parametric value of 0.01 mg/L (10 µg/L), and the Australian National Health and Medical Research Council has established a guideline value of 0.01 mg/L (10 µg/L) for lead in drinking water.
3.0 Application of the guideline
Note: Specific guidance related to the implementation of drinking water guidelines should be obtained from the appropriate drinking water authority in the affected jurisdiction.
The MAC for lead is established based on feasibility rather than only health protection. This is because lead is introduced in drinking water in the distribution and plumbing systems, after the treated water leaves the treatment plant. As current science cannot identify a level under which lead is no longer associated with adverse health effects, lead concentrations in drinking water should be kept as low as reasonably achievable (ALARA). Since formula reconstituted with tap water can represent a major source of exposure to lead in infants, alternate sources should be used if the tap water contains lead.
Considering that lead levels at the consumer's tap may be significantly higher than levels at the treatment plant or in the distribution system, strategies to reduce exposure to lead will need to focus on controlling corrosion within the distribution and plumbing systems and on removing lead-containing components, such as lead service lines, from these systems. Although it is recognized that a utility's responsibility does not generally include residential plumbing systems, most of the established guidelines are intended to apply at the consumer's tap. Lead monitoring should focus on areas known or likely to have lead service lines or that have older buildings and should include zones supplied by potentially corrosive water (e.g., dead ends in a chloraminated system) and consecutive systems (i.e., public water systems whose drinking water supply is from another public water system).
An exceedance of the MAC should be investigated and followed by the appropriate corrective actions. These actions include, but are not limited to, resampling, public education, removal of lead service lines and corrosion control measures. It should be kept in mind that flushing the cold water tap has not been found to sufficiently reduce lead exposure in schools, multi-dwelling residences and large buildings in a consistent fashion. These actions should be based on an assessment of the cause of the exceedance using appropriate protocols, such as those found in the Health Canada publication Guidance on Controlling Corrosion in Drinking Water Distribution Systems.
Discoloration (red water) episodes are likely to be accompanied by the release of accumulated contaminants, including lead because dissolved lead is adsorbed onto iron deposits in the lead service line. Therefore, discolored water events should not be considered only as an aesthetic issue, but should trigger sampling for metals and possibly distribution system maintenance.
3.1 Monitoring
Sampling protocols will differ, depending on the desired objective (i.e., identifying sources of lead, controlling corrosion, assessing compliance, estimating exposure to lead). As monitoring of lead at the tap can be done using different sampling protocols, it is important that the selected protocol be appropriate to meet the desired objective.
The objective of sampling protocols in this document is to monitor for typical community exposure to total lead to determine whether there are concerns related to effects on human health. Compliance monitoring should be conducted at the consumer's tap, with priority given to identifying homes with lead service lines, as these are likely to have the highest lead concentrations. If the objective is to characterize whether distributed water is corrosive to the materials found in the distribution system and household plumbing, the Guidance on Controlling Corrosion in Drinking Water Distribution Systems should be used.
In order to identify zones with lead issues, sampling protocols should initially capture the entire distribution system. However, utilities that have already identified zones/areas of concern can focus on further characterization of these zones. The determination of the source of the lead issues can help select the most appropriate mitigation measures within identified zones. For example, the province of Québec currently uses a full flush protocol in areas with homes suspected of having lead service lines. The protocol compares the results from a fully flushed sample against a specified lead threshold, validated through studies, to confirm homes with lead service lines and subsequently prioritize for mitigation measures. A list of sample types, protocols and the objective of each of these protocols can be found in section 5.1 of this document.
Schools and daycare facilities should also be prioritized for monitoring to ensure that the most sensitive population (i.e., young children) is captured. However, a different sampling protocol may need to be considered for schools, daycare facilities and larger buildings or dwellings. It is difficult to assess exposure in these buildings because of their unique and complex plumbing configurations and the large number of pipes and plumbing components. Sampling should be conducted at least once per year, with the number of sites to be monitored determined based on the size of the drinking water system and the type of building, as discussed below.
3.1.1 Monitoring in residential dwellings
Random daytime (RDT) and 30 minute stagnation (30MS) sampling protocols can both be used for residential sites, as they capture typical exposures, including potential exposure to particulate lead. They are considered appropriate for identifying priority areas for actions to reduce lead concentrations and assessing compliance. Although both RDT and 30MS are suitable for evaluating the effectiveness of corrosion control strategies, RDT sampling is used system-wide and 30 MS sampling is typically used at sentinel sites. Due to its random nature, RDT sampling requires 2-5 times more samples than 30MS to be statistically robust. Whereas RDT sampling is relatively inexpensive, more practical to implement and generally more acceptable to the consumer than 30MS sampling, the 30MS sampling protocol can also be used for investigating the cause of exceedances and identifying appropriate mitigation measures.
Sampling programs should be conducted throughout the year to take into account seasonal effects on lead variability. Sampling should be conducted at the cold water tap in the kitchen or other appropriate location where water is used for drinking or food preparation. Regardless of the protocol used, all samples should be collected in wide-mouth sample bottles, and without removing the aerator. The samples need to be acidified using a 2% nitric acid solution (by volume) and held for a minimum of 16 hours after preservation with nitric acid before analysis. Each sample should be thoroughly mixed prior to analysis using an appropriate method (see Section 6.0).
For RDT sampling, the establishment of a lead service line inventory will help identify water supply zones (geographical areas within which the quality of drinking water is considered approximately uniform) that are more likely to have high lead concentrations. Monitoring programs are conducted within defined water supply zones, which can vary in size but generally should not exceed 50,000 residents each. It is recommended that total lead be monitored, at least once per year, at the tap of a minimum of 20 randomly selected residences in each water supply zone.
RDT sampling: A 1 L sample should be collected randomly during the day from a drinking water tap in each of the residences. Samples should be collected without prior flushing; no stagnation period is prescribed, to better reflect consumer use.
30MS sampling: The tap should be flushed for 5 minutes, allowed to stand for a 30-minute stagnation period, during which time no water should be drawn from any outlet within the residence (including flushing of toilets). Two 1 L samples should then be collected at a medium to high flow rate (greater than 5 L/minute). The lead concentration is determined by averaging the results from the two samples.
3.1.2 Monitoring for schools, multi-dwelling residences and large buildings
In schools and daycares, it is recommended that total lead be monitored, at least once per year, at each of the drinking water fountains or cold water taps where water is used for drinking or food preparation. Sampling should be conducted between the months of June and October, but when the buildings are fully occupied and functional, to capture typical exposure levels – recommended to be in either June or October for schools. Jurisdictions may choose to reduce monitoring if they have established that the lead issues have been identified and addressed.
In multi-dwelling (i.e., more than six residences) buildings or large buildings, it is recommended that total lead be monitored in a manner such that each of the drinking water fountains and a proportion of cold water taps where water is used for drinking or food preparation is sampled within a specified period. When sampling multi-dwelling buildings, priority should be given to sites suspected or known to have full or partial lead service lines. A RDT sampling protocol is recommended for these sites to capture typical exposures, including potential exposure to particulate lead.
RDT sampling should be conducted by collecting a sample at drinking water fountains or at cold water taps where water is used for drinking or food preparation, without a stagnation period and without prior flushing. Two 125 mL samples should be collected, preferably in wide-mouth sample bottles, at a medium to high flow rate without removing the aerator. The samples need to be held for a minimum of 16 hours after they are acidified using a 2% nitric acid solution (by volume) and prior to analysis. Each sample should be thoroughly mixed prior to being analyzed using an appropriate method (see Section 6.0). The lead concentration is determined by averaging the results from the two samples.
The sampling plan for schools and child care centres/facilities must consider that many occupants in these buildings are the most susceptible to the adverse health effects from lead exposure. Consequently, sampling plans for these facilities should prioritize every drinking water fountain and cold water outlet used for drinking or food preparation over infrequently used outlets. In other building types, sampling plans should also target drinking water fountains and cold water outlets used for drinking or food preparation, but with the number of sites sampled based on the size and population of the building.
Part II. Science and Technical Considerations SUPERSCRIPT STARTS
4.0 Identity, use and sources in the environment
Lead (Pb) is a dense, odourless, bluish-grey, lustrous metal that is malleable and insoluble. Lead (Chemical Abstracts Service No. 7439-92-1) has a molecular weight of 207.2 g/mole, a melting point of 327.4°C, a boiling point of 1740°C and a density of 11.34 g/cm3 at room temperature. There are no data pertaining to partition coefficients or Henry's Law constants for lead. Lead is a post-transition metal of Group IVA (14) of the periodic table. It can be found in three oxidation states: Pb0 (elemental lead), Pb2+ (as part of plumbous lead compounds) and Pb4+ (as part of plumbic lead compounds). Pb2+ and, to a lesser extent, Pb4+ are the dominant forms of lead found in the environment. Although elemental lead is insoluble, lead salts of the plumbous form can be highly water soluble (e.g., lead(II) nitrate) (ATSDR, 2007). Lead is highly reactive and readily alloys with other metals, such as tin, antimony, copper and zinc, to form more stable products. Assessment of lead levels in the environment generally focuses not on the form of the metal, but rather on the lead moiety contained within an unspecified substance.
Canada is an important producer and supplier of lead. In 2009, Canada ranked sixth in the world in terms of refined lead production (estimated production of 101 484 tonnes) (Panagapko, 2009). Owing to its low melting point and excellent corrosion resistance, lead has been used extensively in a variety of applications. When exposed to air and water, lead forms a protective film composed of lead sulphate, lead oxides and lead carbonates, thus making it an ideal building material for cable sheathing, circuit boards, chemical storage vessel linings, chemical transmission pipes, electrical components and radiation shielding.
Soluble and insoluble lead compounds can be used as flame retardants (lead chloride), heat stabilizers in nylon (lead nitrate), pigments in paints, plastics and rubber (lead chromate) and catalysts for various chemical reactions (lead carbonate, lead fluoride and lead fluoborate), among various other uses. They are also used in the manufacturing of varnishes and chrome pigments (lead acetate trihydrate), asbestos clutch and brake linings (lead chloride), matches and explosives (lead nitrate), munitions (lead azide and lead styphnate) and galvanic batteries (lead sulphate), as well as numerous other manufacturing processes (Health Canada, 2013c).
Lead service connections (lines) were installed in drinking water systems in many countries, including Canada. Widespread installation of lead service lines occurred in Canada until 1975. Additionally, the use of solder containing lead for new plumbing and in repairs to plumbing continued until 1986. As a result, plumbing and distribution system materials can be an important source of lead in tap water of homes built prior to the 1990s (Health Canada, 2009b). Lead may be found in brass and bronze fittings, such as faucets and valves, and fixtures, such as refrigerated water coolers and drinking water fountains commonly used in schools and other non-residential buildings. Selected components of water coolers, such as soldered joints within the fixtures or the lining of the tank, may contain lead alloys (U.S. EPA, 2006, 2018). Until recently, most brasses contained between 2% and 8% lead (Health Canada, 2009b). In the United States, legislation limiting the weighted average lead content of pipes, pipe fittings and plumbing fittings to 0.25% became effective in January 2014 (U.S. EPA, 2011b). The National Plumbing Code of Canada (NPC) was amended in November 2013 to reference plumbing standards with requirements for the 0.25% lead limit (NRCC, 2013).
Lead (lead(II) chromate) was also added in significant quantities (ranging from 10% to 50%) to household and industrial paints until the 1960s, as a pigment and drying agent. Although the lead content in indoor paint and paints used to coat furniture or products designed for children was further reduced to 90 mg/kg (0.009%) in 2010 (Government of Canada, 2010a; Health Canada, 2010a, 2010b), opportunities for lead exposure still exist in older homes and buildings.
Organic lead compounds (e.g., tetraethyl lead, tetramethyl lead) were also added to motor vehicle fuel until 1993, when this use of lead was prohibited in Canada, other than for piston engine aircraft and racing fuels for competition vehicles. Worldwide reductions of lead in fuels started in the early 1970s and were followed by a complete phasing out of leaded fuels for use in on-road vehicles for many countries in the 1990s (OECD/UNEP, 1999). Lead can also be present in some products used in recreational activities, including weights for fishing and diving, lead shot for hunting, artist-grade paints and glazes for pottery, as well as glass blowing and screen printing supplies. However, there are no permissible uses of lead in food or cosmetics in Canada (Health Canada, 2012a).
Since the prohibition of leaded fuels, the primary source of lead in the environment has been the mining and smelting of lead ores and ores in which lead is a by-product or contaminant (ATSDR, 2007). Release of lead also occurs from factories that use lead, lead alloys and other lead compounds. Other significant sources include air travel, owing to the use of leaded fuels in smaller aircraft, and electrical utilities that release lead as a result of burning coal and other lead-contaminated fuels. The release of lead in the environment has been monitored by Environment Canada's National Pollutant Release Inventory (NPRI). In 2009, lead release was estimated to be 260 000 kg in air, 16 000 kg in water and 160 000 kg on land, for a total of 436 000 kg (Health Canada, 2013a). However, these numbers are assumed to be underestimates of total release because of the number of facilities that are not required to report to the NPRI, as well as additional lead sources. Despite lead reduction measures, lead exposure remains a concern because of the presence of older lead-containing materials in the environment and ongoing uses of lead.
4.1 Environmental fate
Lead released in the atmosphere exists primarily in the form of particles. Small lead particles can travel considerable distances, whereas larger particles (i.e., > 2.5 μm) tend to settle out of the atmosphere rapidly and deposit relatively close to the emission source. Lead is removed from air primarily through rain, but it can also precipitate via dry deposition. Various compounds of lead are released in the atmosphere as a result of the many emission sources. The primary forms are lead(II) sulphate and lead(II) carbonate (ATSDR, 2007).
Additional lead can deposit onto soil from chipping and weathering of lead-based paints from housing, buildings and other structures. The association of lead with soil particles is very strong. For this reason, past uses of lead, including its addition to gasoline, represent an important contribution to lead levels measured in soils today (ATSDR, 2007). The mobility of lead in soil is generally limited; thus, deposited lead will tend to remain in the upper layer of the soil, with limited leaching to groundwater. However, the fate of lead will depend on many factors, including soil pH, soil type, organic matter content in soil and the concentration of lead within the soil (NSF, 1977; Reddy et al., 1995). Acidity greatly increases the solubility of lead and is considered the most important factor in determining lead mobilization. Solubilisation can occur at pH levels below 6 and increases substantially in more acidic conditions (U.S. EPA, 1986). In addition to acidic conditions, decreased organic matter onto which lead can be adsorbed and the presence of lead at concentrations that exceed or approach the cation exchange capacity of soil will also increase the mobility of lead, leading to potential runoff to surface water, leaching to groundwater or uptake by plants. Such environmental conditions are more likely to occur near lead smelting sites.
Lead can be found in surface water, but generally at low concentrations. Soluble lead concentrations will generally increase with acidic conditions (i.e., low pH). The dissolved salt content is another important factor in determining lead solubility and, thus, the concentration of lead in surface water. Above pH 5.4, the solubility of lead is approximately 500 μg/L in soft water, whereas it is only 30 μg/L in hard water (ATSDR, 2007). However, a significant portion of lead found in surface water consists of insoluble particles of lead compounds or lead-containing soil particulate resulting from erosion. The concentrations of lead in mountain drainage water were shown to be similar to levels from the weathering of bedrock and soil. Lead particles were shown to coprecipitate and adsorb onto surfaces of iron-rich particles, such as iron oxides. The resulting iron/lead ratio was found to be relatively constant in the bedrock, the soil, soil and rock leachates, unfiltered and filtered groundwater and filtered and unfiltered stream water (Erel et al., 1991; Erel and Morgan, 1992).
Lead compounds can be degraded or chemically transformed within air, soil and water. However, the elemental lead within these compounds cannot be broken down.
Lead does not biomagnify in aquatic or terrestrial food chains. However, bioconcentration can occur in plants and animals, especially in areas that are contaminated by lead. Older organisms tend to contain the greatest body burdens of lead. Organisms that are in contact with soil and sediment, such as aquatic benthic invertebrates and algae, tend to contain the highest levels of lead.
4.2 Sources of lead in drinking water
Lead is present in tap water principally as a result of dissolution (corrosion) from components of distribution and household plumbing systems that contain lead, such as pipes, fittings, solder or service connections to homes. Corrosion can be caused by several factors, including the type of materials used, the age of the piping and fittings, the stagnation time of the water in pipes and the water quality (e.g., pH and alkalinity) in the system (Health Canada, 2009b).
Lead service lines have been shown to be a consistently high source of lead for many years after being installed under various conditions (Britton and Richards, 1981; Schock et al., 1996; Sandvig et al., 2008; Cartier et al., 2011, 2012a; Xie and Giammar, 2011). Lead service lines can contribute 50–75% of the total lead at the tap after extended stagnation times (Sandvig et al., 2008). Lead concentrations at the tap originating from lead solders and brass fittings were thought to decline with age, with the highest lead concentrations appearing in the first year following installation (Birden et al., 1985; Boffardi, 1988, 1990; Schock and Neff, 1988; Boyd et al., 2008a). Studies, conducted under continuous flow conditions, have shown that when lead is released in the dissolved form from solder and fittings, concentrations diminish over time (Kirmeyer et al., 2007; Zhang and Edwards, 2011; Boyd et al., 2012). A number of studies have identified several factors that can result in the release of high levels of lead into the water long after installation of lead service lines, solders and brass fittings, including water quality characteristics (e.g., temperature, pH, alkalinity, chloride levels), stagnation time, water flow, lead content and surface area of lead and brass fittings (Lee et al., 1989; Maas et al., 1991; Dodrill and Edwards, 1995; Lytle and Schock, 1996, 2000; Oliphant and Schock, 1996; Schock et al., 1996; Reiber et al., 1997; Kimbrough, 2001, 2007, 2009; Sandvig et al., 2007, 2008; Elfland et al., 2010; Schock and Lytle, 2011; Deshommes et al., 2012b; Clark et al., 2014).
Lead release can be significant when particulate material is present in the water or is subsequently trapped in the tap aerator. The sources of these particulates include lead solder particles, pipe deposit solids, dezincification of brasses and adsorption onto iron or manganese particles originating from the distribution system (Hulsmann, 1990; Lytle et al., 1993; Triantafyllidou et al., 2007; Deshommes et al., 2010a; Zhang and Edwards, 2011; Cartier et al., 2012c; Schock et al., 2014).
The relative contribution of lead in dissolved lead and particulate forms is not clearly understood and likely varies with water chemistry, plumbing configuration, stagnation time, flow regime, age of the plumbing materials containing the lead and use patterns (Hulsmann, 1990; Deshommes et al., 2010a, 2012b; Schock and Lytle, 2011; Xie and Giammar, 2011; Cartier et al., 2012a, 2013; Wang et al., 2012; Welter et al., 2013; Clark et al., 2014). The presence of particulate lead in drinking water is sporadic, unpredictable and often associated with mechanical disturbances to the system; it has been shown to also result from galvanic corrosion (Sandvig et al., 2008; Deshommes et al., 2010, 2012b; Triantafyllidou and Edwards, 2010; Schock and Lytle, 2011; Cartier et al., 2012a, 2013; Wang et al., 2012, 2013; Clark et al., 2014).
Galvanic solder corrosion resulting from disinfectant or coagulant changes has been identified as an important factor leading to elevated lead levels (Edwards and Dudi, 2004; Edwards and Triantafyllidou, 2007; Nguyen et al., 2010). Several studies have identified changes in the chloride to sulphate mass ratio (CSMR) resulting from a coagulant change as the driver of lead release from brass due to galvanic corrosion (Edwards and Triantafyllidou, 2007; Nguyen et al., 2010; Triantafyllidou and Edwards, 2010; Cartier et al., 2012c, 2013). Galvanic corrosion resulting from partial lead service line replacement has also been shown to increase concentrations of both dissolved and particulate lead (Sandvig et al., 2008; Deshommes et al., 2010a, 2012b; Triantafyllidou and Edwards, 2010; Schock and Lytle, 2011; Cartier et al., 2012a, 2013; Wang et al., 2012, 2013; Clark et al., 2014).
Lead has also occasionally been found in drinking water as a result of the weathering of certain rock formations into the groundwater (Hamilton Health and Social Services, 2006). In 2006, a public health advisory was issued to all rural City of Hamilton residents located above the Niagara Escarpment whose drinking water supply was obtained from a drilled well. Residents were advised that there was a potential for high lead levels in some wells due to naturally occurring lead in the bedrock (Richardson, 2006). Sweeney et al. (2017) analysed lead from 2,750 fully flushed drinking water samples obtained from private wells (dug and drilled), municipal supplies and unknown sources. The authors found that drinking water obtained from dug wells had 4.4% of samples exceeding 10 µg/L compared to 1.8% for drilled wells and 0.7% for municipal water supplies. The authors did not determine if the source of lead was the water supply or the result of leaching lead from materials in the plumbing system.
5.0 Exposure
Lead is found ubiquitously in the environment as a result of its extensive anthropogenic use over a substantial period of time as well as its natural occurrence. Canadians are exposed to small amounts of lead through various environmental media, including water, food, air and soil, as well as consumer products. Water was historically assumed to account for 14–20% of lead exposures (U.S. EPA, 1991, 2005). However, food and drinking water have now become more important sources of lead exposure for average adult populations, because of significant reductions of lead in products such as gasoline and paints. Inhalation can also be an important route of exposure for individuals residing in the vicinity of point sources.
5.1 Water
Exposure to lead in drinking water can be properly assessed only by monitoring lead levels at the tap. This is because lead is present in tap water principally as a result of dissolution (corrosion) from components of distribution and household plumbing systems that contain lead. However, as discussed below, the concentration of lead can vary significantly both across a system and within an individual site as water use, flow rate and stagnation time between use vary (Karalekas et al., 1978; Bailey and Russell, 1981; AwwaRF, 1990; Schock, 1990; U.S. EPA, 1991; Triantafyllidou et al, 2007; Schock and Lemieux, 2010; Deshommes, 2010a; Cartier et al., 2011, 2012a; Schock and Lytle, 2011; Wang et al., 2012, 2013; Del Toral et al., 2013; Clark et al., 2014 ). This variability makes the assessment of lead exposure from drinking water challenging. Monitoring of lead at the tap (as discussed in Section 3) can be done using different sampling protocols; the selection of an appropriate protocol must take into consideration the desired objective, such as identifying sources of lead, effectively controlling corrosion or estimating exposure to lead. Table 1 provides a list of objectives and the type of sampling to undertake as well as a description of the protocols to achieve those objectives.
Sampling volumes vary in order to accommodate plumbing configurations as well as ensure the representativeness of the exposure. For example, in a single family home, typically a 1 L volume is drawn. However, for a 30MS sample, a 1 L sample would underestimate the lead concentration due to the limited contact time (stagnation). Therefore, it was determined two consecutive 1 L samples should be taken for this protocol (European Commission, 1999), which would permit the identification of the source of lead. Volumes ingested at a drinking water fountain in a school environment are typically much smaller. Collection of a sample volume that is smaller (250 mL) than those typically used in residential buildings (1 L) is considered important for sampling in non-residential buildings as it is more representative of potential exposure. In addition, these smaller samples represent the water from the fitting (fountain or faucet) and a smaller section of plumbing and has the added benefit of being more effective at identifying the source of lead at an outlet (U.S. EPA, 1994a, 2006a). For this reason, breaking down the smaller volume into smaller samples (two 125 mL samples, multiple smaller volumes, etc.) during the sampling event has the benefit of not having to return to the location to re-sample to identify the source of lead. However, the disadvantage is the added burden and cost of analyzing multiple samples that make up the 250 mL samples.
| Objective | Sampling type | Protocol |
|---|---|---|
| Regulatory compliance for lead and/or Corrosion control efficacy | First draw (U.S. EPA) | 6+ hr stagnation Collect 1 L |
| RDT (UK/EU) | Random sample collection without prior flushing Captures variable stagnation Collect 1 L |
|
| 30MS (Ontario) | 2–5 min. flush 30 min. stagnation Collect first two liters |
|
| Determination of lead sources (plumbing/lead service line) and/or Identification of type of lead | Profile (or sequential) sampling –traditional |
Defined stagnation time 10–20 sequential samples of a defined volume (125 mL, 250 mL, 1 L, etc.) |
| Profile sampling that stimulates particle release | Traditional profile sampling at increasingly higher water flow rate (low, medium and high) | |
| Fully flushed sampling | 5 min. flush Collect 1 L and compare to validated threshold for presence of LSL |
|
| 3T's for schools and childcare facilities: revised manual, U.S. EPA | Overnight stagnation Collect first 250 mL from all taps and fountains Sample results from each facility should be compared to prioritize follow-up sampling and remediation (done in consultation with the drinking water authority at the State level) |
|
| Exposure assessment | Composite proportional | Captures actual water use (and variability) Device collects 5% of every draw from the tap for consumption during 1 week |
| 30MS | 5 min. flush 30 min. stagnation; captures inter-use time Collect first two liters and average results |
|
| RDT | Random sample collection without prior flushing Captures variable stagnation and inter-use time Collect 1 L |
5.1.1 Canadian exposure to lead from drinking water
Lead concentrations were sampled at 65 sites in all provinces and territories in the summer and winter seasons during 2009–2010 for the National Survey of Disinfection By-Products and Selected Drinking Water Contaminants in Canadian Drinking Water (2009–2010) (Health Canada, 2014). However, the results are not statistically representative of Canadian population exposure. Samples were collected from the distribution system after 10 minutes of flushing, representing treated and distributed water, and analyzed after hot acid digestion by inductively coupled plasma–mass spectrometry (ICP-MS), with a method detection limit (MDL) of 0.5 µg/L. The average concentration in winter was 0.9 μg/L, with concentrations ranging from < 0.5 to 8.2 μg/L. The average concentration for summer samples was 1.27 μg/L, with concentrations ranging from < 0.5 to 24 μg/L.
Provincial, territorial and municipal databases that include lead concentrations in drinking water supplies are available. These compliance databases contain the results of water quality analyses, including the concentrations of lead. It must be recognized that many provinces and territories currently assess compliance for lead based on a flushed sample, which is not representative of exposure (European Commission, 1999).
The Ontario Drinking Water Surveillance Program database includes concentrations of lead in raw and treated water as well as concentrations of lead at the tap (OMOE, 2014). Between 2000 and 2007, the annual median lead concentrations measured in 5947 samples of treated and distributed water ranged from < 0.01 to 0.32 μg/L (OMOE, 2014). The lead concentrations ranged from below 0.01 to 359 μg/L. However, when the single sample site with the lead concentration of 359 μg/L was resampled three times, lead concentrations were all found to be below 1.68 μg/L. The Province of Ontario changed its regulatory requirements for sampling of lead in June 2007 and now requires that samples be collected after 30 minutes of stagnation from homes known or suspected to have lead service lines (Government of Ontario, 2014). In a Community Lead Testing Program conducted in 2007–2008, lead concentrations were analyzed in more than 37 000 samples collected in two sampling campaigns. During these sampling campaigns, it was determined that ≤ 3.1% of the samples exceeded the regulated level of 10 µg/L. Subsequent to these campaigns, eight communities were identified for another sampling round in 2009. The concentrations of lead in 3159 samples collected were reported to range from < 0.02 to 1320 μg/L (OMOE, 2014).
In Prince Edward Island, over 10,000 samples were collected from private wells between 2005 and 2010. Samples for this period had lead concentrations ranging from < 2 to 335 μg/L with 88% of all samples containing lead at concentrations below the MDL of 2 μg/L (Prince Edward Island Department of Environment, Energy and Forestry, 2011).
In Edmonton, Alberta, the reported median concentration of lead was < 0.5 μg/L (Alberta Department of Environment and Sustainable Resource Development, 2011). In Portage la Prairie, Manitoba, 159 samples were collected between 2008 and 2009, and lead concentrations ranged from 0.1 to 36 µg/L, with an average concentration of 0.7 µg/L (Manitoba Conservation and Water Stewardship, 2013). In Saskatchewan, the median lead concentration for 176 samples analyzed was reported to be 6.7 μg/L, with the concentrations ranging from < 0.1 to 60 μg/L (Saskatchewan Ministry of the Environment, 2011). Data from Quebec in 2013 and 2014 indicates that the annual median lead concentration from more than 23,000 samples was 1 μg/L (concentrations of lead in tap water ranged from 0,01 to 977 μg/L) (Ministère du Développement durable, de l'Environnement et de la Lutte contre les changements climatiques, 2017). In Newfoundland and Labrador, 5331 tap water samples were collected between 2005 and 2010 and reported to have lead concentrations ranging from < 0.1 to 60 μg/L (Newfoundland and Labrador Department of Environment and Conservation, 2011). In Yukon, lead concentrations ranging from < 0.1 to 7.6 μg/L were detected in 125 tap water samples collected between 2005 and 2010 (Yukon Environmental Health Services, 2011).
A number of corrosion studies have been undertaken since 2007. The studies used a variety of sampling protocols with highly variable results for lead in drinking water (Hayes and Croft, 2012; Health Canada, 2013c; Hayes et al., 2014).
In Alberta, a corrosion optimization study analyzed lead levels in 12 sequential 1 L samples from 12 homes supplied by a lead service line in Edmonton and Calgary (six homes in each city) after 30 minutes and 6 hours of stagnation. The peak lead concentrations for Edmonton ranged from 1.3 to 31.8 µg/L and from 3.0 to 62.7 µg/L after 30 minutes and 6 hours of stagnation, respectively. The peak lead concentrations for Calgary ranged from 5.7 to 39.6 µg/L and from 9.1 to 96.5 µg/L after 30 minutes and 6 hours of stagnation, respectively (Hayes et al., 2014).
In Manitoba, a study was conducted to assess worst case lead levels in water from homes and schools in the cities of Brandon and Portage la Prairie. Samples from homes supplied with a lead service line were collected after 6 hours of stagnation in four consecutive 1 L samples and subsequently after flushing for 5 minutes. For Brandon, the average lead concentrations were 39.2 µg/L (ranging from non-detect to 280 µg/L, n = 80) for the four 1 L stagnant samples and 21.62 µg/L (ranging from non-detect to 79 µg/L, n = 20) for the flushed samples. For Portage la Prairie, the average lead concentrations were 19.3 µg/L (ranging from 0.61 to 140 µg/L, n = 72) for the four 1 L stagnant samples and 3.62 µg/L (ranging from 0.55 to 21 µg/L, n = 14) for the flushed samples (Manitoba Conservation and Water Stewardship, 2013). This study also included the collection of first-draw, 30-second flushed and 5-minute flushed samples from schools in Brandon and Portage la Prairie (five schools in each city). For schools in Brandon, the average lead concentrations were 11 µg/L (range: 2.7–27 µg/L), 3.4 µg/L (range: 0.54–13 µg/L) and 1.33 µg/L (range: 0.59–2 µg/L) for first-draw, 30-second flushed and 5-minute flushed samples, respectively. For schools in Portage la Prairie, the average lead concentrations were 9.14 µg/L (range: 0.5–36 µg/L), 0.93 µg/L (range: 0.5–2.2 µg/L) and 0.55 µg/L (0.5–0.75 µg/L) for first-draw, 30-second flushed and 5-minute flushed samples, respectively. Total lead concentrations were decreased after 30 seconds of flushing in 9 of 10 schools and greatly decreased after 5 minutes of flushing in all schools (Manitoba Conservation and Water Stewardship, 2013).
Seven Canadian elementary schools and one high school built before 1970 were sampled to assess human exposure to lead and to develop a sampling protocol in large buildings (Doré et al., 2014). Samples were taken at drinking water fountains and classroom taps (6–10 sites per building) after 30 seconds and 5 minutes of flushing and 30 minutes and 8 hours of stagnation. The study found that 72.7% of the 356 samples had lead concentrations below 5 µg/L and that lead concentrations ranged from < 0.15 to 851 µg/L (average 11 µg/L). A large contribution of particulate lead to the total lead concentration was seen when water was left to stagnate for as little as 30 minutes. However, the authors also found that allowing the water to run for as little as 30 seconds before drinking significantly decreased the total lead concentration. Deshommes et al. (2016) gathered lead results from 78,971 water samples from 8,530 non residential buildings in four Canadian provinces, which included elementary schools and daycares, as well as universities, hospitals and penitentiaries. The data were gathered from samples taken from cold water taps used for consumption and using a variety of sampling protocols and volumes (6 h stagnation; 30 sec. flush; 5 min flush or 30MS). Maximum concentrations reached 13,200 and 3,890 µg/L, respectively, following long and short stagnation periods. High lead levels were persistent at all taps in some large buildings and at only a few taps in other buildings. The authors found that lead concentrations were generally low and, based on biokinetic modelling using the extensive database, anticipated that lead at the tap would not contribute to elevated BLLs in young children and adults at the majority of the taps monitored. However, the data also revealed some daycares and elementary schools presented system-wide lead release with extreme lead concentrations that had the potential to cause acute lead exposure (i.e., BLL far exceeding 5 µg/dL) in young children.
5.1.2 Sampling to assess exposure to lead from drinking water
Monitoring of lead at the tap can be done using different sampling protocols, but the selected protocol must take into consideration the desired objective. Sampling protocols can be used to identify sources of lead, effectively control corrosion, assess compliance and estimate exposure to lead. They will vary based on factors such as desired stagnation time, sample volume, sampling sites and sampling frequency (Schock, 1990; van den Hoven and Slaats, 2006; Schock and Lemieux, 2010). The variability of lead concentrations across a system and within an individual site represents the range of exposures that can occur in the population and must be captured in the design of a monitoring scheme that provides reliable information with which to evaluate exposure (Schock and Lytle, 2011).
For the purposes of this document, the objective of the sampling protocol is to represent the average or typical exposure to lead in drinking water for a population (i.e., within the water supply zone). It is important to note that a sampling protocol that assesses the average intake of lead will not capture the highest concentrations of lead or the full contribution of lead from the lead service line but will capture the variability of lead exposure. Currently, sampling protocols in the United States under the Lead and Copper Rule are treatment based, with the objective of using long stagnation times to capture the highest levels of lead (U.S. EPA, 1991). A similar protocol is suggested in the guidance for corrosion control document published by Health Canada (2009b). These high levels permit a system-wide assessment of the efficacy of corrosion control treatment before and after implementation, with the objective to minimize lead levels in drinking water and, thus, indirectly reduce exposure to lead. The United Kingdom (UK) has documented the effectiveness of system-wide RDT sampling for compliance monitoring and to assess the performance and optimization of corrosion control (Cardew, 2000, 2003; Hayes and Croft, 2012; Hayes et al., 2014).
The average intake of lead by an individual varies considerably as a result of several factors, including consumer behaviour, configuration of the plumbing system (e.g., single-family dwelling, apartment building, office building, school), water usage patterns (e.g., flow regime), contact time of the water with the plumbing, seasonal effects and water chemistry (Cardew, 2000, 2003; van den Hoven and Slaats, 2006; Schock and Lytle, 2011; Deshommes et al., 2016). Sampling methods used to assess exposure should ideally take these variations into account. Studies have demonstrated that composite proportional sampling captures the inherent variability of lead exposure from drinking water and is representative of this exposure (Anjou Recherche, 1994; van den Hoven and Slaats, 2006; Schock and Lytle, 2011). Composite proportional sampling is achieved with a consumer-operated device fitted to the drinking water tap that splits off a small, constant proportion of every volume of water drawn, typically over a period of 1 week. Composite proportional sampling requires equipment that is impractical for routine monitoring and is better suited for long-term sampling.
A number of studies evaluated RDT, fully flushed (FF) and 30MS sampling protocols to identify methods to estimate the average weekly concentration of lead at a consumer's tap (i.e., composite proportional sampling) (Baron, 1997, 2001; European Commission, 1999; van den Hoven and Slaats, 2006). In these studies, the RDT sampling consisted of the collection of a 1 L sample from a drinking water tap without any prior flushing; the FF protocol involved the flushing of approximately three plumbing (pipe) volumes of water (i.e., 5 minutes) before collecting a 1 L sample; and the 30MS protocol involved collecting two 1 L samples after flushing of three plumbing volumes of water and letting the water stagnate for 30 minutes prior to sampling.
The objective of the European Commission (1999) study was to determine which of these three common sampling protocols was the most representative of a weekly average amount of lead ingested by consumers. The performance of the tested protocols was evaluated in terms of representativeness (i.e., estimating the average lead concentration at a consumer's tap), cost, reproducibility, practicality and consumer acceptability. The study was conducted in five member countries and included a variety of water qualities (classified as low, medium and high corrosivity). Each country undertook sampling at a minimum of two areas, selecting sampling sites with at least 50% of the sites in each area/district being served by lead service lines.
The study determined that RDT sampling was representative and enabled the detection of a large proportion of sites with lead issues. It also found that RDT was relatively inexpensive, practical to implement and acceptable to consumers. RDT sampling was determined to have a stagnation time close to or higher than the actual average inter-use stagnation time (i.e., accounts for the water consumption pattern of the consumer) and to overestimate lead exposure. 30MS sampling was found to be representative, to enable the detection of almost as many problem sites as RDT sampling and to be more reproducible than RDT. However, 30MS sampling was found to be relatively expensive, less practical to implement and more inconvenient for consumers. FF sampling was not found to be representative and did not enable detection of sufficient problem sites (European Commission, 1999). In other studies (Bailey et al., 1986; van den Hoven and Slaats, 2006), RDT sampling was also found to be representative of the average inter-use stagnation time of water in a residential setting.
Baron (2001) confirmed these findings during a study in France comparing the same three types of sampling, but without undertaking composite proportional sampling. The author found that at the zonal level, RDT and 30MS samples have very similar results when sampled for a sufficient number of households. It was determined that random selection of properties appeared to be a good solution for assessing the situation in a zone and helping to prioritize and determine the types of actions to implement. RDT sampling was considered more practical and acceptable to consumers, whereas 30MS sampling was found to be more reproducible and equally representative. FF sampling was deemed to be unrepresentative of average concentrations and provided only an indication of the minimum lead levels at the tap (Baron, 2001; van den Hoven and Slaats, 2006). As such, sampling protocols using a fully flushed sample are not appropriate for assessing average exposure to lead in drinking water, although they may be suitable for other objectives, such as identifying the location or presence of lead service lines (Cartier et al., 2012b).The European Commission (1999) recommended that either RDT or 30MS sampling be used for compliance monitoring purposes and zone assessment and that corrosion control treatment be assessed using RDT sampling. Cardew (2003) concluded that RDT was better correlated to true exposure than 30MS and that RDT sampling had a tendency to give false positive (i.e., more conservative) lead exposure results. The study also found that corrosion control effectiveness could be assessed using the RDT compliance data, making it a useful tool for monitoring changes in lead levels over time and assessing the efficacy of corrective treatment system-wide. In addition, it established that optimization could be modeled to evaluate the point of diminishing returns for phosphate concentration on lead levels.
For the 30MS protocol, typical exposure is best reflected by taking the average lead concentration of two 1 L samples collected. The reproducibility of the 30MS sample also makes it a useful tool for monitoring changes in lead levels over time and assessing the efficacy of corrective treatment at sentinel sites (Jackson, 2000). However, 30MS has a tendency to underestimate lead exposure. When combined with profile sampling, 30MS can be used for investigative purposes at individual homes (Cartier et al., 2011) and is representative of household level exposure (Cardew, 2000). Results from RDT sampling are more variable than those from 30MS. Flushing prior to stagnation has been shown to eliminate accumulated particles (van den Hoven and Slaats, 2006; Deshommes et al., 2010a, 2012b). However, increased turbulent flow seen at higher flow rates has been associated with the presence of particulate lead (Cartier et al., 2012a; Clark et al., 2014). In consideration of this, sampling should be conducted at medium to high flow rates (> 5 L/minute) to capture particulate lead release for the sampling protocol.
Many factors contribute to the variability of lead concentrations, including the sampling method used and fluctuations in water quality (e.g., pH, NOM, temperature). Cardew (2003) assessed water quality fluctuations and their impact on the overall variability of lead levels using a Monte Carlo simulation and found that the coefficient of variation increased for both 30MS and RDT sampling because of water quality fluctuations. Generally, the number of samples needed for the RDT sampling protocol is higher than for the 30 MS protocol. However, it was determined that water quality fluctuations dramatically increase the number of samples needed to detect a change for 30MS sampling, thereby reducing the relative sample size needed for RDT by a factor of two. However, in the absence of water quality fluctuations, the number of samples required to detect a change with RDT sampling is ten times greater than for 30MS. Jackson (2000) determined that a RDT protocol would require 3–5 times the number of samples to provide equivalent information if used as an alternative to stagnation samples. Consequently, the perceived advantage of sampling at the same properties using 30MS is less significant in reality. Compliance sampling requires the collection of a set frequency and number of samples which will depend on the population served in a water supply zone. The frequency may be reduced if no failures have occurred in a defined period as determined by the regulator. The number of samples required depends on the actual level of non-compliance in the water supply zone and the variation in lead concentrations observed. There is a need to increase the number of samples when the level of compliance is high (i.e., 90%) to ensure that the zone is actually well characterized (European Commission, 1999; Baron, 2001).
Typically, a minimum of 20 samples is required in a water supply zone, regardless of sampling methodology. However, for small water systems, fewer samples may be appropriate, depending on local circumstances. Hayes et al. (2012) found that results from RDT sampling were adequately representative if at least 100 samples were taken per year and aggregated over several years.
Schools present particularly difficult sampling challenges for the following reasons: the complexity of use patterns, the variability in age of the plumbing, the variability in plumbing configuration between rooms and the lack of a detailed inventory of the plumbing products installed in the buildings. In a study in four Canadian provinces, water samples were collected in elementary schools, daycares, and other large buildings using different sampling protocols and analyzed for lead (Deshommes et al., 2016). The authors found high lead levels were highly variable (lead concentrations varied by a factor of 10–2000 between taps) within large buildings and system- wide. They also confirmed that concentrations of lead at a specific tap cannot predict the lead concentrations for other taps in a building and further support the need to sample every tap in schools and daycares. The study authors also stated that basing the estimation of exposure on concentrations after extensive flushing was not appropriate.
No representative sampling site can be established for most schools, thereby requiring the sampling of every drinking water location to assess exposure of children in the schools. Depending on the type of sampling site (i.e., school vs. multi dwelling building), smaller sample and smaller total volumes may be necessary ( Health Canada, 2009b; Schock and Lytle, 2011; U.S. EPA, 2018).
Maintaining stagnation in larger buildings can be very difficult. Studies have found that lead concentrations at the tap varied significantly even after carefully controlling for water use by all units connected to the service line, regardless of the type of multiple‐family dwelling—row, duplex, triplex or large building (Deshommes et al., 2013; Ngueta et al., 2014). Lead concentrations in drinking water from these dwellings were as high as those seen in single-family homes with similar lead service line configurations. These studies clearly demonstrate the challenges in assessing exposure using stagnant samples and provide support for using the RDT sampling protocol when multiple-family dwellings or large buildings are included in the sampling pool.
5.2 Food
The use of lead in food products is prohibited in Canada. However, small quantities of lead can be detected in food as a result of the trace amounts found in plants and animals, lead incorporation during food transport, past use of lead arsenate as a pesticide, processing and preparation, as well as the use of lead bullets to shoot wild game. Health Canada's Total Diet Study estimated the levels of various chemicals, including lead, in food in six studies that took place between 1969 and 1973, 1976 and 1978, 1985 and 1988, 1992 and 1999, 2000 and 2004 and 2005 and the present day (ongoing; data up to 2007 are available) (Health Canada, 2009a). The results of these studies show a significant decrease of lead concentrations in food since 1981. The current estimated dietary intake of lead from food for all ages of the general Canadian population is approximately 0.1 μg/kg body weight (bw) per day. Exposure is generally higher in children and decreases with age (Health Canada, 2011a). For the period 2003–2007, lead concentrations were highest in herbs and spices (i.e., 292–392 μg/kg), although the most significant contributions of lead to the diet were from beverages, such as beer, wine, coffee, tea and soft drinks, as well as cereal-based foods and vegetables. Traditional foods consumed by First Nations people residing on reserves in British Columbia contained only background levels of lead, except for beaver heart, Canada geese, deer and grouse meat, which contained higher lead concentrations (up to 61 μg/kg) (Chan et al., 2011). Lead levels in Canadian food have also been measured through the Canadian Food Inspection Agency's Children's Food Project and National Chemical Residue Monitoring Program (NCRMP). Data from the 2007–2008 Children's Food Project, in which 836 various processed foods were tested for lead content, indicate that grain-based products contained the most lead. Of the 365 grain-based products tested, 162 had detectable levels of lead, with a mean concentration of 25 μg/kg in these samples. In the previous assessment in 2006–2007, only 11 samples of the 350 foods tested had detectable levels of lead. The highest lead concentration was reported in organic vegetable baby food (140 μg/kg). The NCRMP detected lead concentrations of up to 2040 μg/kg in chicken muscle samples, although lead was not present at detectable levels in an additional 80 samples of chicken muscle (CFIA, 2010). Other foods with detectable levels of lead included fruits and vegetables as well as honey.
Breast milk can be a significant source of exposure to lead in infants. In a 1981 survey of chemicals found in the breast milk of 210 mothers across Canada, lead concentrations were shown to range from non-detectable to 15.8 μg/L, with a geometric mean concentration of 0.566 μg/L (Dabeka et al., 1986). Concentrations of lead in breast milk from 25 Cree mothers ranged from 0.41 to 8.33 μg/L, with an average concentration of 2.08 μg/L (Hanning et al., 2003). More up-to-date data on lead levels in breast milk are expected to be available upon final publication of the Maternal–Infant Research on Environmental Chemicals study, a national 5-year study that recruited approximately 2000 women across 10 Canadian cities. Formula reconstituted with tap water also represents a major source of exposure to lead in infants, as up to 90% of their diet by weight can be tap water, depending on how the formula is reconstituted (Shannon and Graef, 1989; Edwards et al., 2009; Triantafyllidou and Edwards, 2012). It has been estimated that feeding with formula can represent over 50% of total lead exposure in infants (Triantafyllidou and Edwards, 2012).
Additionally, foods prepared with water containing high concentrations of lead have been shown to significantly impact blood lead levels (BLLs). In Greenville, North Carolina, a study was initiated to investigate the source of lead poisoning of children where there was no apparent source of lead in the home. It was determined that pasta prepared with water from a tap that had lead particles trapped in the aerator was the most likely source of lead. During the investigative study, the authors measured a lead concentration of 535 µg/L in the water used to cook pasta. Subsequently, they demonstrated that 95% of the small, insoluble lead particles remained on the pasta after the water was poured off, resulting in a mass of 381 µg of lead in a single serving of pasta (Triantafyllidou et al., 2007). It is of interest to note that this mass is well above the U.S. Consumer Product Safety Commission's (CPSC) threshold for acute exposure health concerns of 175 µg of lead in children's jewellery, which is used by the CPSC as the basis for product recalls or other corrective measures (CPSC, 2005). Deshommes et al. (2012a) studied the impact of tap water as a source of lead in prepared foods consumed by children, including prepared beverages, rice or pasta. Sources of lead in the tap water included solder, lead(II) and lead(IV) pipe scales as well as lead originating from yellow and red brass. It was determined that both particulate and soluble lead from tap water can contribute to increased lead levels in beverages and food prepared in the home. The authors found that the tap water contributed 0.01–1 mg/L and 4–40 mg/L of soluble and particulate lead, respectively, resulting in an average load of 25 µg of lead per 100 g of cooked pasta or rice. The bioaccessibility of lead from food cooked with water was dependent on the form of lead. Lead particles from tap water did not dissolve to a great extent during cooking, but lead emitted from particles (dissolved) as well as dissolved lead from the lead sources were concentrated in the food. In addition, the authors found that small particles of lead would likely be ingested and become bioaccessible once in the stomach.
Certain sub-populations may receive additional exposure of lead through the consumption of wild game. For example, mean lead content in samples of white-tailed deer (n=35) and moose (n=37) harvested using lead ammunition were 0.28 and 0.17 mg/kg, respectively, as measured in a study conducted in Quebec (Fachehoun et al., 2015).
5.3 Air
5.3.1 Ambient air
Ambient air concentrations of lead on filter-collected particulate matter having an aerodynamic diameter of less than 2.5 μm (PM2.5) have been measured annually at 26 sites within Canada. This is part of Environment Canada's National Air Pollution Surveillance program, established in 1969. As a result of major restrictions in the use of leaded fuels worldwide that started in the 1970s, the concentrations of lead in air have been reduced considerably. In Canada, average concentrations of lead in ambient air declined by more than 99% from 1984 (0.1600 μg/m 3) to 2008 (< 0.0015 μg/m3) (Environment Canada, 2010b). Measurements done from 2000 to 2009 indicate that lead concentrations in ambient air have been fairly consistent, with 5th to 95th percentile concentrations of PM2.5 lead ranging from 0.0004 to 0.014 μg/m3 (Environment Canada, 2010a). Aviation gasoline used in small aircraft continues to be an important source of lead in ambient air. Children 9 months to 7 years of age living within 1000 m of airports in North Carolina were shown to have statistically higher BLLs compared with children residing farther from the airports, with the largest impact occurring in children residing within 500 m of an airport (mean BLL of 3.88 μg/dL in the study population) (Miranda et al., 2011).
5.3.2 Indoor air and dust
Ingestion of settled household dust can be a major source of exposure to lead for children, especially in older homes where lead-based paints have been applied (Lanphear et al., 1998). Behaviours observed in children, including crawling and frequent hand-to-mouth contact, can increase lead exposure through ingestion of paint chips and house dust. There is a significant relationship between exposure to household dust and BLLs in children (Dixon et al., 2009). Other sources of indoor lead include contamination from exterior soil, exposure to tobacco smoke and hobbies such as welding, pottery and stained glass making (HUD, 2001). In 2002, median PM2.5 lead concentrations in the indoor air of Ottawa homes with non-smoking residents were 0.0023 μg/m3 (0.0004–0.0027 μg/m3, n = 10) and 0.0015 μg/m3 (0.0010–0.0051 μg/m3, n = 10) for rural and urban residences, respectively (Rasmussen et al., 2006). In Windsor, Ontario, the median PM 2.5 lead concentration in matched personal, indoor and outdoor air samples was in the range of 0.001–0.010 μg/m3 (n = 8 in 2004 and n = 37 in 2005–2006); the highest concentrations of lead were measured in outdoor air in this study (Rasmussen et al., 2007, 2009). Several studies have examined lead levels in household dust by examining samples collected in vacuum cleaner bags. Median lead concentrations in household dust were 63 mg/kg (7.9–3916 mg/kg from 2007 to 2010) and 93 mg/kg (2.9–6898 mg/kg from 2010 to 2011) in 1025 homes across Canada and in 201 homes in four boroughs of Montréal, Quebec, respectively (Gauvin et al., 2011; Rasmussen et al., 2011). Other Canadian studies have investigated lead concentrations in household dust using wipe sampling over various areas within homes. Overall, median concentrations of lead found using the wipe sampling technique ranged from undetectable to 190 µg/m2 (McDonald et al., 2010; Bell et al., 2011; INSPQ, 2011; Richardson et al., 2011).
Older homes may have lead-based paint on the walls. Disturbing this paint through normal wear-and-tear (such as paint on doors, windows, stairs and railings) or through removal or repairing can contribute to indoor air and dust lead levels. The amount and type of lead will vary based on paint type (Health Canada, 2013c). Beauchemin et al. (2011) and Walker et al. (2011) investigated the speciation of lead in household dust samples from one 65-year-old two-storey home and one two-storey home of unidentified age in Ottawa, Ontario. Walker et al. (2011) reported that lead levels from dust in the upstairs bedrooms, where recent renovations had been completed, were substantially higher than in the living room (adult bedroom 14,000 mg/kg versus living room 240 mg/kg); lead particles in dust from the main floor living room were consistent with lead particles found in garden soil, whereas dust particles in the upstairs bedrooms were primarily consistent with the components of paint (including white lead and lithopone) (Walker et al. 2011). Beauchemin et al. (2011) analyzed samples of paint, plaster, and household dust in the same 65-year-old home and reported that paint was a major contributor to the lead content of household dust.
5.4 Consumer products
Lead-containing consumer products can include inexpensive jewellery, professional art supplies, leaded crystal and glazes on ceramics and pottery. The concentration of lead in consumer products is heavily restricted through regulations under the Canada Consumer Product Safety Act (CCPSA), especially in products intended for children. As of November 2010, the lead content of applied surface coatings on toys, jewellery, furniture and other products intended for children and on pencils and artists' brushes was restricted to 90 mg/kg total lead, although applied surface coatings on older products sold between 2005 and 2010 may have contained up to 600 mg/kg total lead, and those sold between 1976 and 2005 may have contained up to 5000 mg/kg lead. In addition, there is a 90 mg/kg total lead limit for all toys intended for children under 3 years of age and all products whose normal pattern of use involves mouth contact. The lead content of all jewellery items intended for children under 15 years of age is limited to 600 mg/kg total lead and 90 mg/kg migratable lead (Health Canada, 2010b, 2012b). There are also stringent leachable lead limits for glazed ceramics and glass foodware and for kettles (Government of Canada, 2010a). The Hazardous Products (Kettles) Regulations, which fall under the CCPSA, limit the amount of lead that may be released when water is boiled, in kettles or similar products, to 0.010 mg/L (Government of Canada, 2010b).
Health Canada issued a public advisory in September 2005 informing consumers about the potential exposure to lead through kohl, a traditional eye cosmetic of Middle Eastern, Asian and North African societies (Health Canada, 2011b). Kohl is also used in ways similar to a natural health product for general eye health, treatments to cuts, and is regarded as a general antibacterial substance. Health Canada has taken action to remove known lead-containing kohl from the market, however it is suspected that there may be more kohl products currently being sold in Canada which contain lead.
Codes of practice are in place for various other categories of products. The National Plumbing Code (NPC), established by the National Research Council of Canada, permitted the use of lead as an acceptable material for drinking water service pipes until 1975 and the use of lead solders in plumbing and distribution systems until 1986. The use of solder containing lead in new plumbing and in repairs to plumbing for drinking water supplies has been prohibited under the code since 1990 (NRCC, 2010). Changes to the NPC now include a requirement for plumbing fittings to meet the low lead requirement of 0.25% lead as a weighted average (NRCC, 2013).
5.5 Soil
Lead levels in soils tend to be higher in cities and in proximity to roads, industrial point sources, weapon firing ranges and buildings with deteriorating leaded paints. The levels of lead in residential and parkland soils across Canada were examined in several studies from 2003 to 2010. Mean lead concentrations were shown to range from 35.6 to 766 mg/kg (Rasmussen et al., 2001; Bowman and Bobrowsky, 2003; Ndzangou et al., 2006; Bell et al., 2010, 2011; Heidary-Monfard, 2011; Richardson et al., 2011), although most samples contained lead at concentrations below the current Canadian Council of Ministers of the Environment (CCME) soil quality guideline for human health (140 mg/kg; CCME, 1999). Mean lead concentrations in soil near point sources across Canada ranged from 13 to 750 mg/kg, although samples generally contained more lead than those collected from residential and parkland soils (OMOE, 2001; Hilts, 2003; Centre for Environmental Monitoring, 2004; Defence Research and Development Canada, 2004; Lambert and Lane, 2004; Manitoba Conservation, 2007; Aqua Terre Solutions Inc., 2009; Conestoga-Rovers and Associates, 2010; Fisher Environmental Ltd., 2010; Laird, 2010; Saint-Laurent et al., 2010). Of the 106 sites tested in Flin Flon and Creighton, Manitoba (influenced by mining), 41% contained lead at concentrations that exceeded the soil quality guideline established by the CCME (Manitoba Conservation, 2007). The background concentration of lead in soil is estimated to be 9.65 mg/kg, which is based on the mean concentration in 7398 glacial till samples collected throughout Canada (Rencz et al., 2006).
5.6 Blood lead levels in Canada
Biomonitoring of exposure to lead throughout the population is predominantly assessed by measurements of lead in blood samples. BLLs in the Canadian population have been assessed as part of the Canadian Health Measures Survey (CHMS), which consisted of 5319 participants aged 6–79 years in cycle 1 (2007–2009), 6070 participants aged 3–79 years in cycle 2 (2009–2011) and 5538 participants aged 3-79 years in cycle 3 (2012-2013). The CHMS is a nationally representative survey representing 96% of the Canadian population providing national baseline BLLs for many chemicals, including lead. Geometric mean BLLs of total participants were 1.3, 1.2 and 1.1 µg/dL for cycles 1, 2 and 3, respectively. In general, BLLs decreased slightly from 3 to 19 years, then increased with age, with the highest BLLs detected in the 60–79 years age group. For cycles 1, 2 and 3, respectively, geometric mean BLLs for each age group were as follows: not available, 0.93 and 0.77 µg/dL for 3–5 years; 0.90, 0.79 and 0.71 µg/dL for 6–11 years; 0.80, 0.71 and 0.64 µg/dL for 12–19 years; 1.1, 0.98 and 0.90 µg/dL for 20–39 years; 1.6, 1.4 and 1.3 µg/dL for 40–59 years; and 2.1,1.9 and 1.6 µg/dL for 60–79 years. For the most part, BLLs were slightly higher in males than in females (Health Canada 2015).
Higher BLLs can be measured in individuals residing in communities with atypical exposure sources, such as smelter communities or rural communities where significant amounts of game killed with lead shot are consumed. In these atypical circumstances, geometric mean BLLs have been shown to range from 1 to 5.6 µg/dL in children (2000–2010) and from 1.7 to 3.9 µg/dL in adults (2001–2005). Maximum BLLs of approximately 40 and 50 µg/dL have been observed in children and adults, respectively (SENES Consultants Ltd., 2012).
The ingestion of lead in drinking water is known to have a direct impact on BLLs. However, data from studies investigating this effect can be difficult to interpret as a result of different water sampling protocols used, variability in individual consumption of tap water, different practices followed, such as using filtered water or flushing tap water before use, and individual susceptibility factors that affect the bioavailability of lead, such as age, diet and genetics. Factors such as seasonal fluctuations in lead concentrations in water (e.g., higher lead concentrations in summer months) or significant decreases in lead concentrations in water have been associated with concomitant changes in BLLs (Sherlock et al., 1984; Deshommes et al., 2013; Ngueta et al., 2014). Triantafyllidou and Edwards (2012) noted the need for additional research on the associations between lead concentrations in water and BLLs to better characterize the health risks associated with this exposure to lead. Simulations using the Integrated Exposure Uptake Biokinetic Model for Lead in Children or IEUBK model (see Section 8.5.3) were done to assess the impact of different concentrations of lead in drinking water on BLLs for children 0–7 years of age. Data from previous studies were input into the model, and the resulting geometric mean percentages (percentage range) of children with BLLs exceeding 5 µg/dL were estimated to be 33.8% (6.8–55.1%), 9.4% (1.9–24.5%) and 2.2% (0.4–9.3%) when concentrations of lead in drinking water were 20, 10 and 5 µg/L, respectively (Deshommes et al., 2013). Children residing in homes with lead service lines were shown to have higher BLLs than those residing in housing with service lines not made of lead (Brown et al., 2011). There is evidence that even very low levels of lead in drinking water can significantly influence BLLs. In a group of 306 children aged 1–5 years, Levallois et al. (2014) demonstrated an association between elevated BLLs and lead concentrations in tap water after adjusting for risk factors associated with elevated BLL, including ethnicity, season and water consumption, as well as the other studied lead exposure variables (i.e., floor dust, windowsill dust and paint). The authors found that BLLs were elevated (> 1.78 µg/dL; corresponding to the 75th percentile) when lead concentrations in drinking water exceeded 3.3 µg/L.
It is important to note that BLLs have declined significantly over time. BLL reductions of over 70% have been observed since 1978–1979, when the mean BLL was approximately 4.79 µg/dL in people 6–79 years of age (Bushnik et al., 2010). Declines are due to significant reductions of lead in gasoline, paints, solder and food cans, as well as additional measures taken to reduce exposure to lead.
5.7 Multi-route exposure through drinking water
As the required physical/chemical properties (e.g., octanol–water partition coefficient, Henry's Law constant) are not available for lead, a multi-route exposure assessment as outlined by Krishnan and Carrier (2008) could not be performed.
As lead compounds are not volatile, inhalation of lead is limited to particle-bound lead, an exposure scenario that is not applicable to drinking water. Furthermore, lead is predominantly found in its inorganic form in drinking water, and inorganic lead is not readily absorbed by the skin. As such, the dermal and inhalation routes of exposure to lead in drinking water were not considered significant in this assessment.
6.0 Analytical methods
The U.S. Environmental Protection Agency (EPA) has two approved analytical methods (Method 200.8 Rev. 5.4 and Method 200.9 Rev. 2.2) for the analysis of total lead in drinking water. The following methods, developed by consensus by standards organizations and a commercial manufacturer, are also approved by the U.S. EPA for the analysis of lead: Standard Method (SM) 3113B (APHA et al., 2005); D3559-96 and D3559-03 (ASTM, 1996, 2003); and Palintest method 1001 (U.S. EPA, 1994c, 2009a, 2014). These methods are general methods for the determination of metals and use ICP followed by mass spectrometry (MS), graphite furnace atomic absorption spectroscopy (GFAAS) or differential pulse anodic stripping voltammetry (ASV) to analyze lead. Both U.S. EPA methods 200.8 Rev. 5.4 and 200.9 Rev. 2.2 provide procedures for the determination of dissolved and total recoverable lead. The methods applied use the same preservation and/or pretreatment steps, including acid pretreatment with nitric and/or hydrochloric acid. Hot digestion may be required, depending on the characteristics of the samples collected. The differences between these methods are the equipment used for the analysis.
Method 200.8 Rev. 5.4 (U.S. EPA, 2009a) uses ICP-MS and has MDL values ranging from 0.02 to 0.6 µg/L. The sample is atomized and ionized into radio-frequency plasma. The ions are extracted from the plasma by a vacuum interface and separated on the basis of their mass-to-charge ratio by a mass spectrometer. Separated ions are detected by an electron multiplier or Faraday detector (U.S. EPA, 1994).
Method 200.9 Rev. 2.2 (U.S. EPA, 2009a) uses stabilized temperature platform GFAAS and has an MDL of 0.7 µg/L. The technique includes a series of three heating steps to dry, char (to reduce interferences by other ions) and atomize lead from the pyrolytic graphite surface. The atomization raises lead into an atmosphere of high-purity argon, and light of a specific wavelength is passed through the atomic cloud. The attenuation of the intensity of light is measured (U.S. EPA, 1994).
The two ASTM International methods approved by the U.S. EPA for the analysis of lead in drinking water are the 1996 and 2003 versions of ASTM D3559 (U.S. EPA, 2014a). Both methods utilize atomic absorption spectrophotometry and differential pulse ASV. These ASTM methods (D3559-96 and D3559-03) are proprietary methods, and no MDLs were available (ASTM, 1996, 2003; U.S. EPA, 2014a).
SM 3113B has also been approved for the analysis of lead using GFAAS and has an MDL of 1 µg/L (APHA et al., 2005); the optimum lead concentration range reported for this method is 5–100 µg/L. The most recent version of this method has an estimated detection level of 0.7 µg/L (APHA et al., 2012).
Palintest method 1001 is a proprietary method for the analysis of lead in drinking water based on differential pulse ASV. This electrochemical technique electroplates metals when the electrode is immersed in the sample and a voltage is applied to the electrode. This step induces a small electric current to pass through the sample, and the dissolved metal ions (e.g., lead) are deposited onto the electrode surface. Once the plating phase is complete, an increasing reverse voltage is applied to the electrode to strip off the deposited metals. Each metal is stripped from the electrode in a defined order and at a precisely known voltage and is thus identified. The signal readings are captured by a scanning analyzer, and a processor interprets them to identify and quantify the metal of interest. An MDL of 2 µg/L was established for lead during U.S. EPA validation testing done by three laboratories (U.S. EPA, 1996) and confirmed in recent product literature (Palintest, 2014).
The practical quantitation limit (PQL) for the U.S. EPA-approved methods is 0.005 mg/L (5 µg/L), based on the capability of laboratories to measure lead within reasonable limits of precision and accuracy at the time of regulation (U.S. EPA, 1991). Current PQL assessments are based on two approaches: (1) the lowest value for which 75% of laboratories can quantitate within prescribed accuracy limits based on actual performance data, if the data are sufficient; or (2) multiplying the upper levels of the MDLs to account for the variability inherent to test methods and instruments used for analyses, when data are insufficient. In establishing the PQL, the U.S. EPA considers and prefers the laboratory performance data for methods approved at the time of the review over the MDL approach.
In the second six-year review of existing National Primary Drinking Water Regulations, the U.S. EPA determined that it could not lower the PQL for lead. Although data were collected for lead in the first six-year review, they were not analyzed at that time. The data sets for both six-year reviews were analyzed, which determined that there was a lack of data and a downward trend in laboratory passing rates below the current PQL for both six-year reviews and a lack of data below the current PQL for the second six-year review's proficiency testing results. It was concluded that it was not appropriate to recommend reducing the PQL (U.S. EPA, 2009b). There is no equivalent centralized program for the collection and rigorous statistical analysis of analytical data in Canada. As such, establishing a PQL for Canadian laboratories is not possible. However, currently available Canadian data support the ability of Canadian laboratories to achieve detection limits well below this PQL. It is important that analyses are undertaken by an accredited laboratory to ensure accurate results and appropriate quality assurance and quality control.
6.1 Sample preparation
Analysis of total lead requires sample preparation to ensure that both the particulate and dissolved fractions of lead are capable of being detected. Generally, all methods listed above follow the same preservation steps, including the use of 0.15% nitric acid, a 16-hour holding time and the addition of hydrochloric acid for hot digestion when the sample turbidity is above 1 nephelometric turbidity unit (NTU). The standard acid preservation (pH < 2) has been shown to quantify total lead in water samples where lead was predominantly in dissolved form or from very fine lead solder (Lytle et al., 1993; Deshommes et al., 2012b; Haas et al., 2013; Triantafyllidou et al., 2013). However, when particles of lead are present in a sample, they may not be well dispersed and may settle to the bottom of the sampling bottle, resulting in turbidity below 1 NTU. As such, the current protocol may underestimate total lead in drinking water when particulate lead is present, and a different approach for the preservation step should be used (Triantafyllidou et al., 2007, 2013; Deshommes et al., 2010a; Haas et al., 2013; Clark et al., 2014). Increasing the nitric acid strength to 2% for the preservation step resulted in substantially better recovery for most forms of particulate lead (Haas et al., 2013; Triantafyllidou et al., 2013; Clark et al., 2014). However, Haas et al. (2013) found that when particulate tetravalent lead was present, a more rigorous preservation step (i.e., hot digestion with both 2% nitric acid and 1% hydrochloric acid) was needed. Clark et al. (2014), on the other hand, found that the addition of 2% nitric acid by volume in the original bottle, followed by a holding time of 16 hrs and thorough shaking prior to taking an aliquot for analysis provided over 80% recovery of total lead. This recovery improved to almost 100% when the holding time increased to 48hrs.
Since the use of 0.15% nitric acid for preservation does not adequately capture particulate lead, it is recommended that 2% nitric acid by volume be used for the preservation step. Heated digestion, as outlined in EPA Method 200.8, could also be used when analyzing lead in drinking water samples. However, this method requires that only an aliquot of the original sample be digested and this would likely not capture particulate lead. This method also includes the criterion of 1 NTU which is insufficient for capturing colloidal or particulate lead, even if those particles are visible in the sample bottle or if the presence of particulates is suspected but they are not visible (e.g., presence of particles in the aerator, disturbance of lead service line). For this reason, if hot acid digestion is to be conducted, preservation with 2% nitric acid by volume (after the 16 hour holding time) and thorough sample mixing should be done prior to taking an aliquot for analysis.
Best practices leading to a better estimation of total lead include ensuring that no aliquot or volume transfers occur prior to preservation or analysis; in situ sample preservation to pH < 2 with 2% by volume; maintaining a minimum holding time of 16 hours after preservation; thoroughly mixing the sample prior to analysis and; taking the aliquot directly from the original sample bottle (Cartier et al., 2013; Haas et al., 2013; Triantafyllidou et al., 2013; Clark et al., 2014).
As noted above, it has been demonstrated that 2% nitric acid by volume greatly improves the recovery of particulate lead. It is important to note that the addition of 2% nitric acid should be undertaken by qualified personnel and using appropriate precautions. To this end, if sampling is conducted by homeowners, the sample should only be acidified and held upon arrival at the laboratory.
7.0 Treatment technology and distribution system considerations
Corrosion tends to increase the concentrations of many metals, including lead, in tap water. Lead in drinking water results primarily from the release of lead through corrosion of lead-bearing materials in plumbing and distribution systems. Corrosion control is the most effective treatment approach for minimizing lead concentrations at the point of consumption (Health Canada, 2009b). Although water treatment can reduce lead concentrations in tap water substantially, treatment alone may not be sufficient to reduce lead to concentrations below the MAC if water is supplied through a lead service line (Sandvig et al., 2008). As such, the removal of the full lead service line is likely the most effective and most permanent solution. Additionally, where lead-bearing fittings contribute significantly to lead in drinking water, the replacement of older fittings (faucets, etc.) with ones that meet low-lead content requirements can reduce lead concentrations in drinking water (Sandvig et al., 2007, 2009; Boyd et al., 2008a; Turković et al., 2014). Generally, strategies to reduce exposure to lead will need to focus on controlling corrosion within the distribution and plumbing systems and on removing lead-containing components. As some treatment technologies can increase lead in drinking water by changing water quality parameters that impact lead release, corrosion control and/or mitigation measures selected may also depend on the treatment processes in place.
7.1 Municipal scale
Lead levels in source water are typically very low. As lead is generally introduced into the drinking water after it leaves the treatment plant, the treatment approach for lead in drinking water is primarily focused on corrosion control (Health Canada, 2009b).The approaches used for corrosion control include water quality adjustments (pH, alkalinity, etc.) and the use of an orthophosphate corrosion inhibitor. Another strategy to reduce exposure to lead is the removal of the full lead service line.
It is important to characterize the sources of lead in order to select the appropriate approach for minimizing corrosion and, thus, lead exposure. The selection of an appropriate strategy for minimizing lead at the tap will depend on many factors, including the characteristics of the raw water supply and the source and concentration of lead, as well as the type of corrosion (Health Canada, 2009b).
Changes in a water system, either in the treatment processes or the quality of the source water, must be taken into consideration. In April 2014, the city of Flint, Michigan, changed its water supply from Detroit-supplied Lake Huron water to the Flint River to save money and as an interim solution while awaiting the completion of a new pipeline. The change in source water resulted in a significantly different treated water quality being supplied to residents with concomitant discolouration episodes; microbiological contamination issues due to lack of disinfection residual; and high disinfection by-products. These issues were further compounded by a more corrosive water — having higher chloride levels and chloride-to-sulfate mass ratio and no orthophosphate inhibitor — causing high lead levels. The Flint water distribution system was estimated to have anywhere from 10% to 80% lead service lines. Between February and September 2015, 252 homes were sampled and the 90th percentile for lead was determined to be 25 µg/L, well above the U.S. EPA lead action level of 15 µg/L, with several first draw sample samples having lead levels over 100 µg/L (Torrice, 2016). Subsequent to these results, Hanna-Attisha et al. (2016) analyzed differences in pediatric BLLs for children younger than 5 years before (2013) and after (2015) the source water change in Flint. The percentage of elevated BLLs during both time periods were assessed and geographical locations were identified through spatial analysis. The authors found the incidence of elevated BLLs increased from 2.4% to 4.9% ( P < .05) after the source water change, and neighborhoods with the highest water lead levels experienced a 6.6% increase. No significant change was seen outside the city.
Natural organic matter (NOM) can contain organic ligands that form soluble complexes with lead (Schock et al., 1996). NOM may also complex calcium ions and keep them from forming a protective CaCO3 coating (Schock and Lytle, 2011). The presence of NOM has been shown to: increase dissolved lead concentrations (Schock et al., 1996; Burlingame et al., 2006); increase total lead solubility and disperse colloidal lead (Korshin et al., 2005); reductively dissolve lead (IV) oxides (Lin and Valentine, 2008); and accelerate lead release via ligand-promoted dissolution (Korshin et al., 1999). In the United Kingdom, NOM is considered to be a challenge to controlling plumbosolvency (lead release) with orthophosphate (Colling et al., 1987; Hayes et al., 2008). Optimizing water treatment processes (i.e., coagulation and adsorption) to remove NOM is expected to result in the removal of the complexing ligands thus limiting the release of lead. Although research on this phenomenon is limited, the removal of NOM may play an important role in strategies to minimize the release of lead.
As noted above, corrosion control treatment can substantially reduce lead concentrations at the tap, but treatment alone may not be sufficient to reduce lead to concentrations below the MAC when water is supplied through a lead service line (Sandvig et al., 2008; Camara et al., 2013). In this instance, the removal of the full lead service line may be necessary to achieve lead reduction.
7.1.1 Treatment considerations
Conventional water treatment, including settling, aluminum sulphate (alum) or ferric sulphate coagulation and filtration, is reasonably effective at removing lead from drinking water. Lime softening at elevated pH is also effective for the removal of lead. For public water systems, the U.S. EPA has identified point-of-use (POU) ion exchange (using cationic resins) and reverse osmosis (RO) as small systems (i.e., serving fewer than 10 000 people) compliance technologies for lead removal (U.S. EPA, 1998). These technologies are also relevant for residential-scale treatment (see Section 7.2). Orthophosphate and zinc orthophosphate are generally the most successful corrosion inhibitors for reducing lead levels in drinking water (Dodrill and Edwards, 1995; Schock et al., 1995).
7.1.2 Distribution system considerations
Lead may leach into drinking water from lead service lines, lead compounds used to join pipe and solder joints, lead in brass plumbing fittings and lead in goosenecks, valve parts or gaskets used in water treatment plants or distribution mains. Lead was commonly used in brass components of distribution and plumbing systems for many decades, including the use of lead service lines to supply water to homes. The NPC allowed lead as an acceptable material for service lines until 1975 (NRCC, 2010), although their installation continued until 1980 in some provinces and territories. Galvanized pipes can also be a source of lead, as lead is present as an impurity (Leroy et al., 1996). The NPC permitted the use of galvanized steel for pipes in plumbing systems until 1980 (NRCC, 2010). All provinces and territories use the NPC as the basis for their plumbing regulations.
7.1.2.1 Lead service lines
Lead service lines have been shown for many years to be a consistently high source of lead and to contribute 50–75% of the total lead at the tap after extended stagnation times. As such, the removal of the full lead service line is likely the most effective and most permanent solution to reducing lead at the tap.
Although the majority of lead released under stagnant conditions is dissolved lead (van den Hoven and Slaats, 2006; Sandvig et al., 2008; Xie and Giammar, 2011; Cartier et al., 2012a), water flow can increase the release of both dissolved and particulate lead through the mass transfer of lead out of pipe scales and by physically dislodging the pipe scales (Xie and Giammar, 2011).
The full replacement of a lead service line (i.e., utility and homeowner portions) can significantly reduce lead concentrations at a consumer's tap. Although partial lead service line replacement (i.e., replacing only the utility or consumer's portion) can also reduce lead concentrations, it does not result in a proportional decrease in lead levels when compared with full service line replacement (U.S. EPA, 2011; Camara et al., 2013; Cartier et al., 2013). Replacing the lead service line can disturb or dislodge existing lead scales or sediments containing lead, resulting in a significant increase in lead levels at the tap. This increase has been shown to continue for 3 or more months after the lead service line replacement (Renner, 2007; Sandvig et al., 2008; U.S. EPA, 2011; Cartier et al., 2013; Del Toral et al., 2013). A study in Providence, Rhode Island, showed a consistently large decline in the total mass of lead released (concentration adjusted for actual volume) after partial lead service line replacement. The average reduction of the total mass of lead was 62% (210 μg). The study also showed the expected spike immediately following partial replacement of the lead service line, but lead levels declined after 3 days and 2 weeks. After 4 months, first-draw and flushed samples showed a large, consistent reduction in the lead concentrations and the time needed to flush the lead-bearing water out of the internal plumbing (Commons, 2011). Del Toral et al. (2013) found that disturbances to the lead service line increased lead concentrations in the water in 11 of 13 sites. These disturbances included meter installation or replacement, automated meter installation, service line leak or external service shut-off valve repair, and significant street excavation in proximity to the home.
Stagnation times, flow regime and water chemistry have been shown to influence the release of particulate lead from lead service line scales. Particulate lead has been observed to increase under flowing (Kim et al., 2011; McFadden et al., 2011; Xie and Giammar, 2011) and stagnant water conditions (Triantafyllidou and Edwards, 2010; Cartier et al., 2013) as well as low-flow conditions (Del Toral et al., 2013; Welter et al., 2013); in the presence of orthophosphate (McFadden et al., 2011); in the presence of orthophosphate with increasing stagnation time (Xie and Giammar, 2011); and at higher pH under flowing water conditions (Kim et al., 2011). Of particular interest is that studies have consistently shown that moderate to high flow rates typical of turbulent flow or flow disturbances can increase the mobilization of lead and result in significant contributions of particulate lead to the total lead concentration (Triantafyllidou et al, 2007; Deshommes, 2010a; Cartier et al., 2011, 2012a; Schock and Lytle, 2011; Wang et al., 2012, 2013; Del Toral et al., 2013; Clark et al., 2014). This is an important consideration when sampling, as low flow rates are not considered to be common homeowner behaviour and therefore not representative of typical use patterns.
Studies have also correlated increased lead concentrations with galvanic corrosion resulting from partial lead service line replacement where new copper piping is connected to the remaining lead pipe (Triantafyllidou and Edwards, 2010; Schock and Lytle, 2011; Xie and Giammar, 2011; Cartier et al., 2012a, 2013; Wang et al., 2012; Welter et al., 2013; Clark et al., 2014). However, when the galvanic connection was removed (i.e., no contact between metals, use of non-metallic coupling to connect pipes), lower lead levels were observed (Triantafyllidou and Edwards, 2010; Wang et al., 2013; Welter et al., 2013). Increased lead levels were also noted when a galvanic connection between lead and copper pipes occurred under conditions of high CSMR (i.e., greater than 0.58) (Edwards and Triantafyllidou, 2007).
Galvanic corrosion can result in increased concentrations of both dissolved and particulate lead (Sandvig et al., 2008; Deshommes et al., 2010a, 2012b; Triantafyllidou and Edwards, 2010; Schock and Lytle, 2011; Xie and Giammar, 2011; Cartier et al., 2012a, 2012c; Wang et al., 2012; Welter et al., 2013; Clark et al., 2014). Research shows that under continuous flow conditions, dissolved lead predominates (Welter et al., 2013), but that particulate lead is more prevalent under stagnant conditions, with particulate lead levels increasing by greater than 50% after 6 hours of stagnation (Triantafyllidou and Edwards, 2010; Wang et al., 2012, 2013).
There is evidence that low water usage resulting from water efficiency and conservation initiatives is causing increased concentrations of lead in drinking water (Elfland et al., 2010). Lower water use is related to increased stagnation time of the water in pipes and correlated with increased lead concentrations.
7.1.2.2 Correlation between particulate lead and iron
Contaminants may accumulate within or on top of iron and lead corrosion products and scale deposits in distribution systems (Lytle et al., 2004; Schock, 2005; Schock et al., 2008, 2014; Friedman et al., 2009). Subsequently, scales can be dislodged and released back to the water in the distribution system with these accumulated contaminants (Schock, 2005; U.S. EPA, 2006). Studies have shown that both iron and manganese scales can act as a sink for, and persistent source of, lead in drinking water (Friedman et al., 2009; Schock et al., 2014). Iron release was seen after both full and partial lead service line replacement (Deshommes et al., 2010a; McFadden et al., 2011; Camara et al., 2013). These studies established a correlation between particulate lead at the tap and metals such as iron, zinc, tin and copper.
Schock et al. (2014) were able to elucidate, through scale analysis and historical data, the mechanism for the release of high levels of lead after full lead service line replacement in Madison, Wisconsin. It was postulated that manganese and iron accumulation onto pipe walls of premise plumbing provided a sink for lead. The scale analysis provided a plausible explanation for historical observations relating to particulate lead, which continued to be released for 4 years after complete lead service lines were removed. These findings were also consistent with the subsequent reduction in lead release once better control of manganese (particulate and dissolved) entering the household plumbing was achieved. Deshommes et al. (2010a) found that particulate lead was highly correlated with iron owing to the adsorption of dissolved lead onto iron deposits in the lead service line and premise plumbing. Spikes in particulate lead concentrations occurred simultaneously with spikes in concentrations of particulate zinc, tin, iron or copper, alone or in combination. An investigation of sustained lead release after full lead service line replacement found that the lead release could be attributed to the adsorption of lead onto iron corrosion scales from old galvanized iron plumbing. The extent of the release was found to vary based on the home's unique history, but factors included flow velocity and stagnation (McFadden et al., 2011). A case study found that cast iron water mains exacerbated the release of lead when lead service lines were replaced. Camara et al. (2013) found that lead service lines connected to tuberculated (i.e., corroded) iron pipes increased lead concentrations after both partial and full service line replacement. The authors determined that iron scales detached from the cast iron water main and adsorbed lead from the service line and lead-containing components of the plumbing system. Ultimately, lead was released in the consumer's drinking water through desorption or dissolution from iron scales. It was shown that full replacement of the service line consistently produced lower lead release compared with partial replacement.
It is important to note that discoloration (red water) episodes are likely to be accompanied by the release of accumulated contaminants, including lead. Therefore, such events should not be considered only as an aesthetic issue, but should trigger sampling for metals and potentially additional distribution system maintenance.
7.1.2.3 Brass alloys
In Canada, copper plumbing with lead–tin solders (widely used until 1989) as well as brass faucets and fittings are prevalent in domestic plumbing systems (Churchill et al., 2000). The NPC officially prohibited lead solders from being used in new plumbing or in repairs to plumbing for drinking water supplies in the 1990 version (NRCC, 2010). Under the NPC, all fittings must comply with the American Society of Mechanical Engineers (ASME) 112.18.1 / Canadian Standards Association (CSA) B125.1 standard for plumbing supply fittings. This standard requires that fittings meet the low lead requirement of 0.25% lead as a weighted average.
Typically, non-leaded brass alloys contain lead in the range of 0.1–0.25% by weight as an incidental impurity from the recycled materials or ores used as source metals. Bismuth or a combination of bismuth and selenium replaces lead in these alloys to improve mechanical characteristics (Sandvig et al., 2007). Brass alloys that contain as little as 0.25% lead are now available for plumbing fittings and in-line devices.
Laboratory experiments were conducted to quantify the levels of lead leached from seven commercially available low-lead brass alloys containing lead at 0.25% or less. The tests were conducted with two different waters, including an NSF International (NSF) / American National Standards Institute (ANSI) Standard 61 section 9 test water and a low-pH, low-alkalinity, chloraminated water expected to be aggressive with respect to lead leaching. The concentrations of lead leached from all low-lead alloys were below 1 µg/L under both leaching conditions for the 4-week duration of the experiment (Triantafyllidou and Edwards, 2010).
A study was undertaken to assess the effect of various water quality parameters (i.e., pH, alkalinity, chlorine, chloramine) on the performance of these low-lead brasses, including their potential to leach metals. Normalized lead levels obtained under NSF/ANSI Standard 61 section 8 test waters indicated very low lead concentrations for the devices with a lead content of 0.25% or less (Sandvig et al., 2012).
Another study evaluated the effect of changes in key water quality parameters (i.e., hard and soft water; high chloride; low, medium and high pH; low, moderate and high alkalinity) on the performance and leaching of non-leaded brasses (lead content of 0.25% or less). Low concentrations of lead were observed for all of the non-leaded brasses, under all test water conditions, for both the short-term and long-term leaching tests. The measured lead concentrations were all below 1 μg/L, with the majority of results less than the MDL of 0.16 μg/L (Turković et al., 2014).
7.1.2.4 Mitigation strategy for lead service lines
Generally, utilities should encourage consumers to replace their portion of the lead service line when the utility is undertaking to replace the public portion.This ensures a full replacement of the lead service line and minimizes the consumer's exposure to lead (Renner, 2007; Sandvig et al., 2008; U.S. EPA, 2011; Camara et al., 2013; Cartier et al., 2013). Mitigation measures that include partial or full replacement of the lead service line should ensure that appropriate flushing is conducted after the replacement and that debris is subsequently cleaned from the screens or aerators of outlets (Triantafyllidou et al., 2007; Sandvig et al., 2008; Deshommes et al., 2010a; Cartier et al., 2013; Del Toral et al., 2013). Extensive initial flushing by the consumer should be encouraged and other mitigation measures, such as point-of-use filtration, public education and/or weekly or biweekly sampling until lead levels stabilize, should be considered by the utility. The water quality at the consumer's tap should be monitored closely following both full and partial lead service line replacement for several months after replacement. The importance of regularly cleaning outlet aerators should be communicated to consumers to ensure that any lead-containing particles are removed as part of ongoing maintenance (Triantafyllidou et al., 2007; Sandvig et al., 2008; Deshommes et al., 2010a; Cartier et al., 2013; Del Toral et al., 2013). Seasonal variations in lead concentrations have been observed, with increased lead concentrations frequently associated with the summer months (Britton and Richards, 1981; Karalekas et al., 1983; Colling et al., 1987, 1992; Douglas et al., 2004). Douglas et al. (2004) reported a strong seasonal variation in lead concentration, with the highest lead levels seen during the months of May to November. However, more recent information indicates that routine sampling should be conducted during the same period every year from June to October, especially for monitoring of homes with lead service lines, as levels of lead are expected to be highest in those months, (INSPQ, 2011; Del Toral et al., 2013; Ngueta et al., 2014 ).
Galvanic corrosion caused by partial lead service line replacement can be mitigated by the use of plastic couplings to connect the old lead service line with new copper pipe (Wang et al., 2013; Clark et al., 2014). Similarly, it is expected that connecting polyvinyl chloride piping to the lead service line in a partial replacement scenario would also prevent galvanic corrosion.
Reducing exposure to lead can also be achieved, as an interim measure, by the use of drinking water treatment devices. It must be noted that in situations where high levels of lead are possible after replacement of lead service lines, drinking water treatment devices may have reduced capacity and require more frequent replacement.
7.1.2.5 Mitigation strategy for distribution and plumbing systems
As discoloration (red water) episodes can be accompanied by the release of accumulated contaminants, including lead, they should trigger maintenance actions, such as systematic unidirectional flushing of the distribution system, to ensure that all particles are flushed out before the water reaches the consumer (Vreeburg, 2010).
The level of trace metals increases upon stagnation of the water. Flushing the water present in the plumbing system can significantly reduce the levels of lead and is therefore considered a mitigation strategy. However, flushing the cold water tap in buildings may not be sufficient to reduce the levels of lead (Singh and Mavinic, 1991; Murphy, 1993). It has been shown that lead concentrations in samples from school drinking fountains and faucets increased significantly a few hours after a 10-minute flush. The study found that periodic flushing throughout the day would be necessary to adequately reduce lead concentrations (Murphy, 1993).
A number of studies found that drinking water fountains, chillers and faucets were the sources of lead in drinking water (Gnaedinger, 1993; Bryant, 2004; Sathyanarayana et al., 2006; Boyd et al., 2008a, b). Fountains or faucet and plumbing components can be major contributors to elevated lead concentrations at outlets in non-residential buildings (Bryant, 2004; Boyd et al., 2008b). As such, identifying and replacing the problematic components with non-leaded ones can be the most effective mitigation strategy in schools and buildings as well as residences.
7.1.2.6 Mitigation strategy for impacts resulting from treatment
Some treatment technologies can increase lead in drinking water by changing water quality parameters that impact lead release. In the anion exchange process, used for removal of contaminants such as uranium, freshly regenerated ion exchange resin removes bicarbonate ions, causing reductions in pH and total alkalinity during the initial 100 bed volumes (BVs) of a run. Raising the pH of the treated water may be required at the beginning of a run (100–400 BVs) to avoid corrosion (Clifford, 1999; Wang et al., 2010; Clifford et al., 2011). Similarly, frequent regeneration of an ion exchange resin can have an impact on corrosion. In a case study in Maine, frequent regeneration of the ion exchange resin was instituted to reduce the levels of uranium in the waste stream (residuals). This resulted in a significant and continual decrease of pH and subsequent leaching of copper and lead into the drinking water (Lowry, 2009, 2010). Since reverse osmosis (RO) continually and completely removes alkalinity in water, it will continually lower the pH of treated water and increase its corrosivity. Therefore, the product water pH must be adjusted to avoid corrosion issues in the distribution system such as the leaching of lead and copper (Schock and Lytle, 2011; U.S. EPA, 2012).
7.2 Residential scale
It is not generally recommended that drinking water treatment devices be used to provide additional treatment to municipally treated water. However, as the primary source of lead in drinking water is the leaching from plumbing and distribution system components, a private residential drinking water treatment device is the best option for reducing lead concentrations in drinking water at the tap. However, the use of such devices should not be considered to be a permanent solution since these systems require ongoing maintenance and filters must regularly be replaced, in accordance with the manufacturer's instructions.
Before a treatment device is installed, consumers should have the water tested to determine general water chemistry and to verify the concentration of lead. Periodic testing by an accredited laboratory should be conducted on both the water entering the treatment device and the finished water to verify that the treatment device is effective. Products that use adsorption technology can lose removal capacity through usage and time and need to be maintained and/or replaced. Consumers should verify the expected longevity of the adsorption media in their treatment device as per the manufacturer's recommendations and service the device when required. They may also wish to consult a qualified treatment specialist to help in selecting the system best suited for their needs and water quality.
Health Canada does not recommend specific brands of drinking water treatment devices, but it strongly recommends that consumers use devices that have been certified by an accredited certification body as meeting the appropriate NSF/ANSI drinking water treatment unit standard(s). These standards have been designed to safeguard drinking water by helping to ensure the material safety and performance of products that come into contact with drinking water. Certification organizations provide assurance that a product conforms to applicable standards and must be accredited by the Standards Council of Canada (SCC). In Canada, the following organizations have been accredited by the SCC to certify drinking water devices and materials as meeting NSF/ANSI standards (SCC, 2018):
- CSA Group (www.csagroup.org);
- NSF International (www.nsf.org);
- Water Quality Association (www.wqa.org);
- UL LLC (www.ul.com);
- Bureau de normalisation du Québec (www.bnq.qc.ca – available in French only);
- International Association of Plumbing & Mechanical Officials (www.iapmo.org) and
- Truesdail Laboratories Inc. (www.truesdail.com).
An up-to-date list of accredited certification organizations can be obtained directly from the SCC (2018).
Drinking water treatment devices can be installed at the faucet (POU) or at the location where water enters the home (point-of-entry or POE) in residential settings to reduce contaminant concentrations. POU systems are preferred for the removal of lead, as lead levels may increase in the plumbing system and because exposure to these contaminants from drinking water is a concern only if the contaminants are ingested (i.e., inhalation and dermal absorption are not significant routes of exposure and thus, bathing, showering and similar water uses do not pose a substantial lead exposure risk). As such, POU treatment devices installed at individual drinking water taps are considered to be the best approach to reduce concentrations to safe levels immediately before consumption or for preparation of food or beverages.
A number of certified residential treatment devices are available that can remove lead from drinking water. Adsorption (i.e., carbon block/resin), RO and distillation technologies are effective treatment technologies at the residential scale for the removal of lead at the tap. Certified residential treatment devices using adsorption and RO are currently available for the reduction of lead (dissolved and particulate forms) in drinking water. There are currently no certified distillation systems.
For a drinking water treatment device to be certified to NSF/ANSI Standard 53 (Drinking Water Treatment Units—Health Effects) for the removal of lead, the device must be capable of reducing an influent lead concentration of 150 µg/L to a maximum final (effluent) lead concentration of less than 10 µg/L (NSF/ANSI, 2017a). Treatment devices that are certified to remove lead under NSF/ANSI Standard 53 are generally based on activated carbon adsorption technology.
RO systems certified to NSF/ANSI Standard 58 (Reverse Osmosis Drinking Water Treatment Systems) may also be certified for the reduction of lead to achieve a final concentration below 10 µg/L (NSF/ANSI, 2017b). RO systems certified to this standard are intended for POU installation only. This is because water treated by an RO system may be corrosive to internal plumbing components. RO requires larger quantities of influent water to obtain the required volume of drinking water, because these systems reject part of the influent water. A consumer may need to pretreat the influent water to reduce fouling and extend the service life of the membrane.
Distillation systems certified to NSF/ANSI Standard 62 (Distillation Drinking Water Treatment Systems) can also be certified for the reduction of lead to achieve a final concentration below 10 µg/L (NSF/ANSI, 2017c). Distillation systems that would be certified to this standard are also intended for POU installation, for the same reasons described above. The distillation process is effective for the reduction of inorganic contaminants, but requires an electrical energy input.
Generally, all of the above-listed technologies are expected to be capable of removing lead to concentrations well below10 µg/L and capable of achieving the MAC. Deshommes et al. (2012b) studied the removal of lead using POU filtration devices certified to NSF/ANSI Standard 53 in a large building. The authors found that the devices removed both particulate and dissolved lead to well below the concentration of lead for which they were certified. All devices reduced total lead concentrations to 2.2 µg/L or less, even with an influent total lead concentration as high as 270 µg/L (median concentration 111 µg/L) in the field, and under different use patterns.
As noted previously, lead may leach from materials used in drinking water systems, such as plumbing components and fittings. An important consideration for reducing exposure to lead is to address leaching from these materials by specifying that they meet health-based and plumbing standards. NSF/ANSI Standard 61 (Drinking Water System Components—Health Effects) limits the leaching of lead into drinking water. The standard ensures that materials meet health-based leaching requirements and are safe for use in potable water applications. When materials are certified to the standard, the total concentration of lead from all materials must not exceed the total allowable concentration of 5 µg/L (NSF/ANSI, 2017d). NSF/ANSI Standard 372 (Drinking Water System Components—Lead Content) evaluates the lead content of components such as plumbing fittings (NSF/ANSI, 2016). Components and materials must not contain more than 0.25% lead, as a weighted average, to comply with this standard. A number of studies have demonstrated that the use of components such as faucets and other fittings with a low lead content can result in a reduced concentration of lead at the tap (Sandvig et al., 2007, 2009; Boyd et al., 2008b; Turković et al., 2014).
Pieper et al. (2015) reported on the analysis of 2,146 samples submitted by private system homeowners. The authors found that close to 20% of first draw samples submitted contained lead concentrations above the U.S. EPA action level of 15 μg/L, suggesting that corrosion may be a significant concern for well owners. The correlations between lead, copper and zinc suggested brass components as the most likely source of lead. Similarly to the PATH study (Sweeney et al., 2017), dug/bored wells had significantly higher lead concentrations as compared to drilled wells. A random subset of samples selected found that, on average, 47% of lead in the first draw samples was in particulate form. Whereas flushing the tap reduced lead levels below15 μg/L for most systems, some systems experienced an increase that may have been a result of either particulate lead or the presence of lead-bearing components (i.e., valves, pumps) upstream of the faucet (Pieper et al., 2015). A study exposed brass and galvanized steel meeting the low-lead requirements (i.e., NSF/ANSI Standard 372) to more aggressive waters typically found in groundwaters. The authors found that low-lead brass released non-detectable concentrations of lead when exposed to aggressive conditions. Leaching from C36000 brass (non low-lead) was found to increase with decreasing pH and alkalinity. The study also found that galvanized steel may still release significant lead in aggressive waters as a result of the sorption of lead to plumbing. The authors concluded that although lead-free brass products protect private wells, elevated lead from legacy materials and galvanized steel will remain an issue for systems without corrosion control. As such, it is important for private well owners to test for lead and to ensure that replacement parts and components meet the low-lead requirements.
Currently, the NPC requires that components (i.e., fittings) used for potable water applications meet relevant standards for plumbing fittings (NRCC, 2013). The relevant standards, namely ASME A112.18.1/CSA B125.1 and CSA B125.3, include requirements to comply with both NSF/ANSI Standard 61 and NSF/ANSI Standard 372 (CSA, 2018a, 2018b).
8.0 Kinetics and metabolism
8.1 Absorption
The absorption of lead from the gastrointestinal tract following oral exposure will depend on the physiological state of exposed individuals (e.g., age, fasting, calcium and iron intake) as well as physicochemical characteristics of the ingested lead (e.g., particle size, solubility and lead species) (ATSDR, 2007). Two studies have investigated lead uptake from drinking water. In one study, 0.37 MBq of 203Pb-labelled lead chloride in 100 mL water was administered to 10 healthy male volunteers, aged 25–35 years, who had eaten a light breakfast 2 hours prior to exposure. Average whole-body retention at 96 hours after exposure was approximately 21% and ranged from 10% to 65% (the highest percentage represents an average of two samples, as the measurement was repeated) (Blake, 1976). In a second study, three individuals from the Blake (1976) study were administered 0.37 MBq of 203Pb-labelled lead chloride with 300 μg of unlabelled lead chloride in 100 mL distilled water after 18 hours of fasting and with 6 additional hours of fasting after exposure (Blake et al., 1983). Whole-body lead retention at 96 hours post-exposure demonstrated that fasting significantly increased lead uptake, as shown by mean absorption levels of approximately 70% (67–76%) and 15% (11–23%) for fasted and non-fasted individuals, respectively (Blake, 1976; Blake et al., 1983). In two subjects who were administered 203Pb and carrier in a control meal prepared with distilled water with and without minerals (also with fasting 18 hours prior to and 6 hours after exposure), mineral content was shown to significantly affect absorption. With minerals, whole-body lead retention after 96 hours in the two individuals was 0.94% and 1.5%, whereas it was 65.4% and 71.6% without minerals (Blake et al., 1983). Additional experiments indicated that decreasing dietary consumption of calcium and phosphorus increased lead retention (Blake and Mann, 1983). In a study of exposure to lead through sherry stored in a lead crystal container, 70% of the dose was shown to be absorbed in fasted individuals (Graziano et al., 1996). The absorption of lead from food has been evaluated according to age. In adults, levels of absorbed lead varied widely (from 9.7% and up to 61%) and increased with fasting and low dietary intake of calcium and phosphate (Rabinowitz et al., 1976, 1980; James et al., 1985). Some data suggest that lead is more readily absorbed by infants and children than by adults. Without any fasting, lead absorption in infants and children aged 3 months to 8 years and 14–746 days was 41.5% and 53%, with an estimated retention of 31.7% and 18%, respectively (Alexander, 1974; Ziegler et al., 1978).
An in vitro test was developed to determine the bioaccessibility of lead particles from tap water, based on a Relative Bioaccessibility Leaching Procedure used for soils, to assess the hazard associated with the ingestion of various types of particulate lead. Bioaccessibility was evaluated for particles representative of those found in drinking water distribution systems. Particles were either laboratory‐generated or collected from the aerators of taps during field sampling. Particles from field-sampled taps contained significant amounts of lead (0.003–71%, median 4.7%). The bioaccessibility of the laboratory‐generated particles ranged from 2% to 96%, depending on the type of particle (lead(II) > brass > lead(IV) > solder), whereas that of the field-collected particles was homogeneously distributed between 1.5% and 100% (median 41%). The hazard of particulate ingestion was found to depend on the amount and concentration ingested as well as the bioaccessibility of the particulate forms of lead. The impact of particulate lead on the exposure of children aged 0.5–7 years was estimated using the IEUBK model. The model found that the exposure was most significant for lead particles originating from large buildings in the distribution system under study (Deshommes et al., 2012c). In another study, Deshommes et al. (2012a) assessed the impact of tap water as a source of lead in prepared foods consumed by children, including prepared beverages, rice or pasta. The authors found that the range of bioaccessibility of lead from food cooked with water varied with the lead form. Although lead particles did not dissolve during cooking, the dissolved lead from the lead sources and emitted from these particles was found to concentrate in the food. It was also determined that small particles of lead would likely be ingested and become bioaccessible once in the stomach.
Data on absorption following oral exposure in humans are further supported by observations in experimental animals. Absorption of 210 Pb-labelled lead acetate administered by oral gavage (6.37 mg/kg bw) was approximately 38% in juvenile rhesus monkeys, whereas it was only 26% in adult females (Pounds et al., 1978; ATSDR, 2007). Rat pups also absorbed more lead via diet than their adult counterparts (Forbes and Reina, 1972; Kostial et al., 1978). Gastrointestinal absorption of lead following oral uptake from soil is generally less than absorption of dissolved lead due to factors in addition to fasting and nutritional status, including those that affect lead's mobility in soil (e.g. pH, organic carbon content and cation exchange capacity) (ATSDR, 2007).
Particle-bound lead can be inhaled at various respiratory depths, and thus absorption will depend on the lead deposition within the lung. Lead associated with larger particles will be deposited in the upper respiratory tract, resulting in mucociliary clearance and leading to swallowing and thus gastrointestinal absorption of lead. Small particles (i.e., < 1 μm in diameter) can reach the lower respiratory tract, where they can enter the circulation or be engulfed by phagocytic macrophages. Virtually all particulate lead reaching the deeper lung is absorbed. In adults, deposition within the deeper lung was shown to range from 14% to 40%, with near complete retention of the deposited dose in blood (Chamberlain et al., 1975; Wells et al., 1975).
Dermal absorption of lead is significantly less than absorption through the oral and inhalation exposure routes. Application of 203 Pb-labelled lead acetate in a cosmetic preparation to the skin of eight male volunteers over 12 hours demonstrated that absorption was less than 0.3%, based on whole-body counts and urinary radioactivity normalized to 203Pb-labelled lead chloride administered in blood (Moore et al., 1980). Another study indicated that soluble forms of lead, such as lead nitrate and lead acetate, can be absorbed superficially into skin and potentially through the skin upon dermal application of lead filter paper for 6 hours on the forearm at levels of up to 29.5% (Stauber et al., 1994). In vitro experiments using human skin indicate that absorption of organic lead depends on the lead compound. Tetrabutyl lead was the most readily absorbed, followed by lead nuolate, lead naphthenate and lead acetate. Organic lead compounds appear to be more readily absorbed than inorganic lead compounds. Similar observations were made in in vitro experiments with guinea pig skin tissue (Bress and Bidanset, 1991). Application of inorganic and organic lead (i.e., lead naphthenate, lead nitrate, lead stearate, lead sulphate, lead oxide and lead metal powder) to the shaved backs of rats resulted in absorption at rates ranging from 0.002% to 0.17%, as based on dose recovered in urine. Although absorption was low for all compounds, it was especially low for inorganic lead compounds (Sun et al., 2002; ATSDR, 2007).
8.2 Distribution
The distribution of lead is very similar to the distribution of calcium, owing to the molecular similarities of the two substances. Lead distribution is essentially the same regardless of the route of exposure. Once in the body, lead will primarily partition to blood, soft tissues and bone. The half-life of lead in blood is approximately 35 days (Rabinowitz et al., 1976). However, bones act as a reservoir for lead, with a biological half-life of approximately 20–30 years (Patrick, 2006). Thus, bone represents 80–95% of the total retained lead in adults and approximately 70% of the total retained lead in children (Patrick, 2006). For this reason, measurement of lead in bone, which can be done using a non-invasive procedure (i.e., X-ray), is an excellent method for determining lead body burdens. Uptake and release of lead from bone can significantly affect BLLs.
Under normal conditions, most lead (> 98%) is bound to cellular proteins within red blood cells. Thus, this lead is not available for crossover to other tissues (Schütz et al., 1996; Bergdahl et al., 1997, 1999; Hernández-Avila et al., 1998; Manton et al., 2001; Smith et al., 2002). The remaining lead can be found as complexes with low molecular weight sulphydryl compounds (e.g., cysteine and homocysteine) within serum and as protein-bound lead (e.g., to albumin and γ-globulins) within plasma. Although present in only small quantities, the lead in plasma is the most biologically available for uptake by other tissues (Ambrose et al., 2000). Small amounts of lead have been found to permeate several tissues, including liver, kidney, skeletal muscle, pancreas, ovary, spleen, prostate, adrenal gland, brain, fat, testis and heart, with higher levels observed in bone, hair and nails. Of the soft tissues, aorta, liver and kidney retained the most lead, as shown in human cadavers (Barry and Mossman, 1970; Barry, 1975; Gross et al., 1975). Levels of lead in soft tissues are relatively constant in adults, with no accumulation over time (Gross et al., 1975).
Lead accumulation will occur in bone, generally in regions undergoing active calcification at the time of exposure. As a result of lead's accumulation in bone, bone biokinetics will play an important role in determining BLLs. Bone resorption that occurs with aging can significantly affect BLLs, as suggested by significant associations between the blood lead index (time-weighted average BLL corresponding to total exposure) and bone lead levels (Fleming et al., 1997; Chettle, 2005). It is estimated that lead stored in bones can contribute up to 70% of total BLLs in adults (Smith et al., 1996; Gulson et al., 1997). Endogenous bone lead can also be a significant source of blood lead in children. Estimated contributions of endogenous bone lead to BLLs in children were shown to range from 12% to 66% (Gulson et al., 1997), and contributions up to 96% were found in one 46-month-old child (Gwiazda et al., 2005). There is also evidence that exposure to lead in early childhood can lead to elevated BLLs at the ages of 19 and 29 years (McNeill et al., 2000).
Two life stages in women, menopause and pregnancy, can significantly affect BLLs. This is due to increased bone resorption in menopausal women and increased calcium demands in pregnant and nursing women, leading to the release of lead stored within the skeleton. Postmenopausal women who were former smelter employees have shown significantly higher BLLs than premenopausal smelter workers (Popovic et al., 2005). Mean BLLs have been shown to increase by 20% in pregnant and postpartum women (Gulson et al., 2003). It is estimated that 79–90% of the mobilized lead in pregnant women can reach the fetus via cord blood (Mahaffey, 1991; Gulson et al., 2003). In pregnant women, BLLs have been shown to follow a nonlinear "U-shaped" pattern during pregnancy (Hertz-Picciotto et al., 2000; Schell et al., 2000, 2003; Sowers et al., 2002; Gulson et al., 2004a). In a study of 105 healthy women in Mexico City, maternal BLLs were measured at 12, 20, 28, 36 months and at delivery; throughout pregnancy, BLLs averaged 7.0 μg/dL with an observed decline of about 1 μg/dL between weeks 12 and 20 and an increase of 1.6 μg/dL observed between week 20 and delivery (Rothenberg et al., 1994). Lead will accumulate mostly in fetal bone, but can also be distributed to fetal soft tissues, including liver, heart and brain, later during the gestational period (Mahaffey, 1991). Postpartum BLLs can be particularly elevated. These were shown to increase by 30–95% (mean 65%) in postpartum women in comparison with the minimum value observed during late pregnancy (Gulson et al., 2004b). The levels of lead in breast milk and blood of mothers are significantly correlated to infant BLLs (Ettinger et al., 2004; Koyashiki et al., 2010). Concentrations of lead in breast milk will significantly impact infant BLLs; thus, long-term maternal exposure prior to pregnancy and breastfeeding can increase lead exposure in children (Gulson et al., 1998; Ettinger et al., 2004).
8.3 Metabolism
Inorganic lead primarily forms complexes with proteins and non-protein ligands. The majority of lead partitions to serum, where the primary ligand formed is γ-aminolevulinic acid dehydratase (ALAD), followed by low molecular weight sulphydryl compounds, such as cysteine and homocysteine (Gonick, 2011). Of the remaining lead found in plasma, 90% is bound to the albumin fraction (Gonick, 2011). Proteins with high affinity for lead have been identified in soft tissues (high-affinity cytosolic lead-binding proteins). These include acyl-coenzyme A binding protein in brain in addition to thymosin β4 in kidney of exposed humans (Quintanilla-Vega et al., 1995; Smith et al., 1998), as well as a cleavage product of microglobulin in kidney of male rats (Fowler and DuVal, 1991).
The metabolism of organic lead compounds has been less studied. Alkyl lead compounds are metabolized by oxidative dealkylation via cytochrome P450 enzymes in liver (ATSDR, 2007). Several metabolites have been detected in the urine of workers exposed to tetraethyl lead, including triethyl lead, diethyl lead, ethyl lead and inorganic lead (Turlakiewicz and Chmielnicka, 1985; Zhang et al., 1994; Vural and Duydu, 1995). Increased levels of the metabolite triethyl lead were measured in liver, kidney, pancreas, brain and heart in three individuals who died of acute tetraethyl lead poisoning (Bolanowska et al., 1967).
8.4 Excretion
Lead is primarily excreted through urine and feces; other minor pathways include hair, nails and breast milk. The proportions of lead excreted through each of these pathways will vary according to the exposure route.
Intravenous injection of lead in humans, as a representation of internalized lead, demonstrates that approximately one third and two thirds of circulating lead are excreted via the fecal and urinary routes, respectively (Chamberlain et al., 1978). Minor pathways of excretion included sweat, saliva, hair, nails and breast milk (Hursh and Suomela, 1968; Hursh et al., 1969; Griffin et al., 1975; Rabinowitz et al., 1976; Chamberlain et al., 1978, 1979; Kehoe, 1987; Stauber et al., 1994; ATSDR, 2007).
Following oral exposure, most lead is eliminated via the fecal route. Excretion of lead following daily oral exposure of five men to stable isotope–labelled lead at approximately 210–360 μg/day (for up to 210 days) was 12% in urine (7–17%) and 90% in feces (87–94%) (Rabinowitz et al., 1976; ATSDR,2007). Ingestion of 1–3 mg lead per day over 208 weeks was associated with urinary lead excretion, representing 5% of the total ingested dose (Kehoe, 1987; ATSDR, 2007).
The ratio of fecal to urinary excretion of inhaled lead particles depends largely on the size of the particles. Approximately two thirds of submicrometre particles that reach the bronchiolar and alveolar regions of the respiratory tract are excreted in urine, whereas an estimated one third are excreted in feces (Hursh et al., 1969; Chamberlain et al., 1978; ATSDR, 2007). The proportion of lead excreted in feces is expected to increase with particle size as a result of ingestion of lead-containing phlegm. Lead that is associated with tetraethyl and tetramethyl lead can be excreted through exhaled air, urine and feces. Inhalation of 203 Pb-labelled tetraethyl and tetramethyl lead resulted in 37% and 51% deposition in the respiratory tract, respectively, of which 20% and 40% were exhaled in the following 48 hours (ATSDR, 2007). The remaining lead was excreted in urine and feces. Dermal exposure to lead acetate and lead nitrate has been associated with detectable levels of lead in sweat and urine (Kehoe, 1987), although dermal absorption of lead is generally negligible.
8.5 PBPK models
The majority of studies that have investigated the toxicity of lead in humans have used BLL as a metric of exposure. However, oral doses provide a more flexible toxicological reference value for setting environmental quality guidelines for drinking water. Three established and validated physiologically based pharmacokinetic (PBPK) models are available to estimate the chronic oral dose of lead that would result in specific BLLs (i.e., O'Flaherty, Leggett and IEUBK models). All three models have been considered in this assessment of lead. Thus, the three models are described below, along with more specific details pertaining to the methodologies employed. It should be noted that simpler slope factor models based on linear epidemiological relationships between BLL and either lead uptake or lead intake are also available to estimate oral doses from BLLs (JECFA, 2011; EFSA, 2013).
8.5.1 O'Flaherty model
The O'Flaherty model simulates lead absorption and disposition from birth through adulthood (O'Flaherty, 1993, 1995b). It was originally calibrated to predict blood, bone and tissue lead concentrations in the rat (O'Flaherty, 1991) and was subsequently modified to reflect the anatomical and physiological characteristics of children (O'Flaherty, 1995b) and adults (O'Flaherty, 1993, 1998). The models relevant to adults and children were shown to accurately reproduce BLL observations, except in cases where lead was ingested at very high concentrations (O'Flaherty, 1993, 1995b). Uptake of lead by the gastrointestinal tract following ingestion and uptake from the respiratory tract following inhalation are considered in the model, along with exchanges of lead between various compartments, including blood plasma, well-perfused tissues (e.g., tissues of the gastrointestinal tract), poorly perfused tissues (i.e., muscle, fat), bone (i.e., cortical and trabecular bone), liver and kidney. Elimination from urine and feces is also considered. Several components of the model are dependent on age-specific pharmacokinetic differences, including rates of absorption of lead from the gastrointestinal tract, bone formation and resorption, tissue growth and body weight. Gastrointestinal absorption of lead from drinking water or diet declines from an ingestion rate of 58% at birth to 8% after 8 years of age. The model can be modified to simulate the pharmacokinetics of lead in the bodies of sensitive individuals, such as pregnant women and fetuses.
The version of the O'Flaherty model used in this assessment was a 1997 C++ version of the ACSL source code for the O'Flaherty model for humans (O'Flaherty, 1993, 1995a, 1995b, 2000). Only a limited number of input parameters can be adjusted in the C++ model. Outputs of the C++ version of the O'Flaherty model are limited to the concentration of lead in blood and bone and do not include intermediate values, such as the intake or uptake of lead from environmental exposures. The input parameters for the O'Flaherty model were set to model lead exposure and kinetics from 0 to 5 years of age. Input parameters to the C++ O'Flaherty model related to lead exposure are limited to environmental concentrations. In order to determine the corresponding oral dose to be used as a point of departure for risk assessment purposes, the concentrations of lead in all environmental exposure media except drinking water were set to zero. Concentration in drinking water was varied between iterative model runs until the model output for BLL in a 5-year-old was equal to the target BLL. Separate modelling exercises were computed using the male and female versions of the O'Flaherty model. Body weights of 18.8 kg and 18.9 kg, drinking water rates of 0.80 and 0.95 L/day and oral bioavailabilities of 17% and 17% for males and females, respectively, were calculated using the model codes described in O'Flaherty (2000). Specific input and output parameters as well as calculated intermediate values using the O'Flaherty C++ model are presented in a supporting technical report (Healey, 2014).
8.5.2 Leggett model
The Leggett model was developed from a biokinetic model put forth by the International Commission on Radiological Protection for calculating radiation doses from radionuclides present in the environment, including radioisotopes of lead (ICRP, 1993). Additional parameters specific to lead were used to adjust the model for lead PBPK modelling applications in children and adults (Leggett, 1993). The model can simulate lead intakes from ingestion, inhalation and intravenous injection. It consists of a central compartment for diffusible plasma together with its interactions with the skeleton (cortical and trabecular bone), liver, kidney, brain and other soft tissues (intermediate turnover, rapid turnover and tenacious retention). The bone portions of the model each contain a surface compartment and a non-exchange/exchange compartment. Lead enters the exchangeable portion of bone volume through bone surface, from which it can either move to the non-exchangeable portion of bone (stored lead) or return to the surface, where it can re-enter the bloodstream upon bone resorption. Liver and kidney are also further compartmentalized to take into account rapid lead uptake and transfer and more gradual transfer and accumulation. Transfer rate constants between compartments in the Leggett model vary with age and BLL. Elimination from urine, feces and sweat as well as hair, nails and skin is considered. In this model, the absorption fraction of ingested lead from drinking water changes with age, declining from 0.45 at birth to 0.3 at 1 year of age and 0.15 past the age of 25. Validation of the model appeared to predict BLLs of adults, but there are insufficient data to assess the model's accuracy in predicting BLLs of exposed children (ATSDR, 2007). At low doses, the Leggett model has a tendency to overestimate BLLs (Pounds and Leggett, 1998; U.S. EPA, 2007). The model allows the simulation of lifetime exposures to lead.
For the purposes of this assessment, an enhanced Leggett model developed by Dr. Joel Pounds was used. This model is consistent with Leggett (1993), but includes some changes to the FORTRAN source code for the model to facilitate modelling chelation. The Leggett model is written in FORTRAN and distributed as an executable DOS program. Model inputs are defined in an ASCII input file and read into the DOS executable program. In contrast to other PBPK models, the Leggett model does not include environmental lead concentrations as input parameters. Thus, the ingestion route of exposure was specified in the input parameters. The uptake of lead from the gastrointestinal tract into blood is determined by input values for the gastrointestinal absorption fraction. The input rate of chronic lead ingestion was varied between iterative model runs until the average of model outputs for BLLs in 5-year-old children was equal to the targeted BLL. The input value for the gastrointestinal absorption fraction was 100% for all model runs. The Leggett model does not include body weight as a model parameter; thus, the default body weight for 4- to 5-year-old children from the IEUBK model (18.2 kg) was used. Specific input and output parameters using the enhanced Leggett model are presented in a supporting technical report (Healey, 2014).
8.5.3 IEUBK model
The IEUBK model was developed for children ages 0–7 years and designed to predict the probability of elevated BLLs in children (U.S. EPA, 1994a, 1994b; White et al., 1998). The model is divided into four submodels, including an exposure model, an uptake model, a biokinetic model and a blood lead probability model. The exposure model simulates intake of lead through drinking water, air, soil-derived dust or diet, whereas the uptake model simulates absorption through the gastrointestinal and respiratory tracts. It is assumed that the absorption fraction of lead through drinking water and diet at 30 months of age is 0.5, with subsequent decreases to 0.11. The biokinetic model includes a central plasma compartment and its interactions with bone (i.e., trabecular and cortical), red blood cells, kidney, liver and other soft tissues, as well as three elimination pools (i.e., urine, feces, skin/hair/nails). The model is age dependent and simulates growth of body tissues, compartment volumes and lead concentrations in each compartment. The BLL at birth is assumed to be 85% of maternal BLL. The blood lead probability model is used to estimate BLLs of children exposed under specific conditions. Because BLLs in children with similar exposure can vary significantly, the model simulates the combined impact of the sources of variability as a lognormal distribution of BLL from which the geometric mean is used in the derivation of the blood lead probability model. Alternatively, an extension of the IEUBK model that includes Monte Carlo simulations can be used to simulate variability and uncertainty in exposure and absorption (Goodrum et al., 1996). Considerable effort has gone into validating the IEUBK model. Model predictions of BLLs in children were compared with observations from epidemiological studies of four hazardous waste sites (Hogan et al., 1998). Predicted geometric mean BLLs were within 0.7 µg/dL of the observed geometric mean BLLs for each of the sites. Moreover, the prediction of the percentage of children with BLLs higher than 10 µg/dL was within 4% of the observed percentage for each site. An additional study that compared water lead levels with actual BLL data and IEUBK estimations also confirms the validity of the model, with some degree of overestimation for children who lived in dwellings with a lead service line (Deshommes et al., 2013). Concordance of model-predicted BLLs and actual BLLs can be influenced by multiple factors, including the extent to which exposure and blood lead measurements are adequately matched and site-specific factors that may affect lead intake or uptake (Bowers and Mattuck, 2001). The computer code for the IEUBK model (IEUBK version 0.99d) has been shown to accurately implement the conceptual model, as shown through independent validation and verification (Zaragoza and Hogan, 1998).
The version of the IEUBK model used in this assessment was the IEUBK for Windows version 1.1 build 11. In order to determine the corresponding oral dose to be used as a point of departure for risk assessment purposes, the concentration of lead in all environmental exposure media except drinking water was set to zero. The concentration of lead in drinking water was varied between iterative model runs until the model output for the geometric mean BLL in 4- to 5-year-old children and 5- to 6-year-old children was equal to the targeted BLL. The IEUBK default drinking water consumption rate of 0.55 L/day and default bioavailability of lead in drinking water of 50% were used. The model's assumed body weight of 4- to 5-year-old children was 18.2 kg. The lead uptake values reported in the IEUBK outputs were consistently approximately 93–97% of the lead uptake values that were calculated as intermediate values from the model input parameters. It is unclear whether this 3–7% has been accounted for in the model; thus, it is possible that the oral equivalent dose to reach the targeted BLL may in reality be slightly higher. Specific input and output parameters as well as calculated intermediate values using the IEUBK model are presented in a supporting technical report (Healey, 2014).
9.0 Health effects
Lead has long been known to cause a variety of health problems. Thus, many studies have documented adverse health endpoints in exposed humans and experimental animals. As environmental lead levels have declined considerably in recent times, more epidemiological data have become available on the low-dose effects of lead. These have demonstrated that lead-induced toxicities can occur at much lower exposure levels than previously estimated. In many cases, lead toxicities can be observed at BLLs below 10 µg/dL (corresponding to intervention levels currently under revision; Health Canada, 2013a). In light of this new evidence, the literature overview presented herein focuses on the low-dose effects of lead in humans and experimental animals. In the case of epidemiological studies, emphasis was placed on longitudinal studies and meta-analyses when possible, as these studies carry more weight in the interpretation of lead toxicity. The toxicity of lead in humans and experimental animals has also been reviewed in detail (IARC, 2006; ATSDR, 2007; Health Canada, 2013c).
9.1 Effects in humans
9.1.1 Acute toxicity
Signs of lead intoxication are mostly neurological and gastrointestinal effects, including dullness, irritability, poor attention span, headache, dizziness, weakness and memory loss, as well as epigastric pain, constipation, vomiting, anorexia, paresthesia, anemia and convulsions (ATSDR, 2007). In severe cases, encephalopathy, coma and death can occur (ATSDR, 2007). Encephalopathy has been reported at relatively high BLLs of 100–120 μg/dL in adults and 80–100 μg/dL in children (Smith et al., 1938; NAS, 1972; WHO, 2011). However, acute neurological, gastrointestinal and musculoskeletal symptoms can occur at BLLs below 40 μg/dL (Baker et al., 1979; Hänninen et al., 1979; Awad El Karim et al., 1986; Holness and Nethercott, 1988; Marino et al., 1989; Matte et al., 1989; Rosenman et al., 2003). Acute gastrointestinal and musculoskeletal effects have been shown to occur at BLLs as low as 30–39 μg/dL and possibly at levels as low as 25–30 μg/dL for neurological effects (Rosenman et al., 2003). Severe acute lead toxicity is also associated with effects on proximal renal tubules, as demonstrated by Fanconi syndrome–like symptoms in children and adults, including excretion of amino acids, glucose and phosphates in urine (Chisolm et al., 1955; Goyer et al., 1972; Loghman-Adham, 1998).
9.1.2 Subchronic and chronic toxicity and carcinogenicity
9.1.2.1 Neurological effects
Epidemiological data strongly support an association between lead exposure and various adverse neurological effects in adults. Adverse neurological effects have been observed in cross-sectional studies of lead workers with elevated BLLs, ranging from 40 to 80 μg/dL. These effects include saccadic eye movements (Baloh et al., 1979; Glickman et al., 1984), changes in sensory evoked potential (Araki et al., 1987; Counter and Buchanan, 2002), signs of decreased cognitive performance, including loss of memory, delayed reaction time and problems with verbal concept formation (Haenninen et al., 1978; Arnvig et al., 1980; Mantere et al., 1982; Baker et al., 1983; Hogstedt et al., 1983; Campara et al., 1984; Stollery et al., 1989, 1991; Stollery, 1996), as well as altered psychological state, such as depressed mood and fatigue (Baker et al., 1983; Maizlish et al., 1995). Peripheral nerve function, measured by the conduction velocity of electrically stimulated nerves, was affected at BLLs as low as 30 μg/dL (Seppalainen et al., 1983; Chia et al., 1996), whereas other studies found no significant association between nerve function and BLL (Spivey et al., 1980; Ishida et al., 1996).
The strongest support for lead-induced adverse neurological effects is from prospective studies that have followed populations over many years, as well as bone lead studies that reflect lead storage over time. In a study of Canadian lead smelter workers exposed on average for 17.1 years (range of 0.2–26 years) and for which BLLs were assessed several times per year, cumulative BLL (mean = 728.2 ± 434.36 (μg/dL)·year) and the average BLL over the period of employment (mean = 39.0 ± 12.32 μg/dL) were associated with alterations in auditory verbal learning; these included effects on memory storage and retrieval, but not on immediate learning, attention or memory span (Bleecker et al., 2005). Moreover, it was demonstrated in 54 Finnish storage battery workers with well-documented long-term exposure to lead (1–30 years of employment) that BLLs exceeding approximately 50 μg/dL can lead to long-lasting adverse effects on central nervous system functions (Hänninen et al., 1998). There are some data to suggest that adverse neurological effects in adults can be reversed to a certain extent when occupational exposure to lead is reduced. This was shown in lead glaze factory workers, whose BLLs were reduced from 26.3 to 8.3 μg/dL over a period of 4 years resulting in significant improvements in neurobehavioural performance (finger tapping, pattern comparison reaction time, and memory testing), and in lead smelter workers whose verbal memory performance improved when BLLs that exceeded 40 μg/dL prior to 1980 were reduced thereafter (Lindgren et al., 2003; Chuang et al., 2005). Studies of tibial lead levels, as an indicator of long-term exposure to lead, have consistently been associated with adverse neurological effects at levels ranging from 10.5 to 57.0 μg/g (Khalil-Manesh et al., 1993; Shih et al., 2006; Weuve et al., 2009). Tibia lead levels were also shown to correlate with decreased cognitive function and reduced volume of the total brain, the frontal and total grey matter as well as the parietal white matter in lead workers (Stewart et al., 2006).
Several studies have investigated the effects of lead at very low BLLs (e.g., < 10 μg/dL) (Muldoon, 1996; Nordberg et al., 2000; Louis et al., 2003; Wright et al., 2003; Krieg et al., 2005). A modest association between BLL and essential tremor diagnosis was observed in a case–control study of patients with essential tremor (100 patients, mean BLL = 3.3 ± 2.4 μg/dL, mean age = 70.7 years) and controls (143 controls, mean BLL = 2.6 ± 1.6 μg/dL, mean age = 66.2 years) (Louis et al., 2003). The lifetime occupational exposure to lead was similar in patients and control groups, and the association was significant after adjusting for potential confounding effects (odds ratio [OR] = 1.19, 95% confidence interval [CI] = 1.03–1.37). Effects on essential tremor are further supported in two case–control studies in separate environmentally exposed populations that showed an association between BLLs and incidences of essential tremor (Louis et al., 2005; Dogu et al., 2007). Furthermore, it was shown that individuals carrying the ALAD-2 allele may be more susceptible to lead-induced essential tremor (Louis et al., 2005). It was not entirely known whether elevated BLLs preceded or followed diagnosis. This would require further investigations with regards to lead-induced cerebral damage over time and the development of essential tremor. However, the prevalence of essential tremor would likely be higher than 1–6% if a BLL of 3.3 μg/dL alone were associated with this adverse neurological effect.
Two studies have used a battery of neurobehavioural and neuropsychological tests to investigate adverse cognitive effects in adults when BLL was below 10 μg/dL (Muldoon, 1996; Krieg et al., 2005). Muldoon (1996) conducted a wide range of neurological tests to measure memory, language, visual-spatial ability, intellectual status and sensorimotor action in 325 female rural dwellers (mean age = 71.1 years) and 205 female urban dwellers (mean age = 69.4 years) as part of an osteoporotic fracture study. The rural and urban dwellers had mean BLLs of 4.5 μg/dL and 5.4 μg/dL, respectively. A significant association was found only in the rural dwellers at levels of 4–7 μg/dL for the trailmaking and digit symbol tests and > 7 μg/dL for reaction time tests. However, urban dwellers did not exhibit any adverse neurological effects, even at BLLs of 8 μg/dL and above. The study controlled for important confounding effects, such as age, education, and tobacco and alcohol consumption, in non-occupationally exposed individuals. The reasons for negative effects in urban dwellers may be related to other, unknown factors. In contrast to these findings in female rural dwellers, no significant effects occurred in simple reaction time, symbol–digit substitution and serial-digit learning in a population aged 20–59 years and in which BLLs ranged from 0.7 to 41.8 μg/dL (mean BLL = 3.30 μg/dL) (4937 participants, data from the third U.S. National Health and Nutrition Examination Survey [NHANES III]) (Krieg et al., 2005). It was noted that this was likely related to the lack of low-dose effects in adults or alternatively that specific tests or sample size did not allow detection of such subtle low-dose effects.
Two additional studies have examined the performance of elderly populations on the mini-mental status exam (MMSE). The MMSE assesses various endpoints related to orientation in place and time, memory, attention, language and reasoning. Low scores, typically 23 or less on a scale of 30, are associated with reduced cognitive function and increased risk for dementia (Folstein et al., 1975; Santacruz and Swagerty, 2001). Wright et al. (2003) examined an elderly population in the Normative Aging Study, in which 1031 individuals were administered the MMSE with concomitant BLL measurements. A significant association was found between BLL and MMSE scores below 24 (OR = 1.21, 95% CI = 1.07–1.36), after adjustments for covariates, in the study group that had a mean BLL of 4.5 μg/dL. Significant interactions between BLL and age suggest that mean BLLs of 5.9 μg/dL and above can accelerate age-related neurodegeneration. Bone lead, however, was not significantly associated with poor outcomes in the MMSE or with age-related neurodegeneration, except for a significant age interaction with patella lead in the 57.6 μg/g group. In another study, however, no association between BLL and MMSE score was found in a population of 762 elderly men (average age = 88.4 years) with a mean BLL of 3.7 μg/dL (Nordberg et al., 2000). Thus, there are some data to suggest that BLLs below 10 μg/dL may accelerate neurodegeneration and dementia in aging populations. Nonetheless, it should be noted that any gradual neurodegeneration occurring earlier in life as a result of past lead exposure has not been fully addressed in these studies.
Thus, there is evidence of adverse neurological effects at BLLs below 10 μg/dL. Generally, though, the association of low BLLs with adverse neurological endpoints was equivocal, and there were a significant number of data that did not support lead-induced adverse neurological effects. Moreover, the analyses were based on single BLL measurements at the time of examination. This hampers our understanding of the implications of low BLLs on long-term adverse neurological effects.
9.1.2.2 Cardiovascular effects
Epidemiological data from blood and bone lead studies suggest an association between lead exposure and several adverse cardiovascular effects, including increased blood pressure and risk of hypertension, development of peripheral arterial disease as well as increased risk of coronary- and cerebrovascular-related morbidity and mortality (Navas-Acien et al., 2007; Vaziri and Gonick, 2008).
Of the cardiovascular effects examined, increases in systolic blood pressure have been the most studied endpoint and represent the strongest weight of evidence for a causal relationship. Statistically significant associations, although generally weak, have been found in three meta-analyses examining blood lead effects on blood pressure (Staessen et al., 1994a; Schwartz, 1995; Nawrot et al., 2002) as well as in another meta-analysis of bone lead effects on blood pressure (Navas-Acien et al., 2008). Five important longitudinal studies have also examined the association between BLL and systolic blood pressure (Weiss et al., 1986; Moller and Kristensen, 1992; Staessen et al., 1996; Glenn et al., 2003, 2006). This association was reported as significantly positive after adjustments for covariates in three of the five studies, although these studies examined populations with current or previous occupational exposure to lead. Glenn et al. (2006) examined blood lead and tibia lead in 575 workers with a mean baseline BLL of 31.4 μg/dL and followed over 3 years. Every 10 μg/dL increase in BLL was associated with an annual increase in systolic blood pressure of 0.9 mmHg (0.12 kPa), although no association was found with tibia lead. Another longitudinal study of 70 occupationally exposed policemen followed over 5 years revealed a significant association with systolic blood pressure, but only at BLLs exceeding 30 μg/dL (Weiss et al., 1986). The study by Glenn et al. (2003) was considered the most relevant, because exposure occurred an average of 18 years prior and mean blood and tibia lead levels in the 496 individuals were considered to be in the normal range of 4.6 μg/dL (baseline) and 14.7 μg/g (year 3), respectively. Measurements were taken 3–4 times for each participant and corrected for various confounding effects, including age, body mass index, alcohol consumption, smoking and education. An average annual increase in systolic blood pressure of 0.64 mmHg (0.085 kPa) was reported for every standard deviation increase in blood lead (2.6 μg/dL) from baseline BLL. The significant association between baseline BLL and annual changes in systolic blood pressure was stronger in individuals with lower past peak tibia lead, suggesting that the relationship observed is less likely to be related to previous occupational exposure.
The two studies that did not support a significant association between BLL and systolic blood pressure included one study of an environmentally exposed population (Staessen et al., 1996). This study examined systolic and diastolic blood pressure as well as hypertension in 339 men and 345 women. BLLs and multiple blood pressure readings were taken at baseline (mean BLL = 8.7 μg/dL) and after a median follow-up time of 5.2 years, at which time the mean BLL had declined to 2.9 μg/dL. At follow-up, blood pressure was also measured using a 24-hour ambulatory monitoring system to collect the most accurate information. It was determined that BLL had no consistent effect on blood pressure and also did not increase risk of hypertension at the levels studied (< 30 μg/dL). In an additional longitudinal study of aging males (from the Normative Aging Study) that examined hypertension (but not blood pressure), higher BLLs were not associated with an increased incidence of hypertension, although the relationship between bone lead and hypertension was significant (Cheng et al., 2001). In the second non-occupational longitudinal study, no significant effects on systolic blood pressure were found in individuals with baseline BLLs of 13.6 μg/dL for men and 9.6 μg/dL for women upon follow-up examinations at 5 and 11 years, respectively, once adjustments for covariates were done (Moller and Kristensen, 1992).
There is evidence to suggest that specific populations and lifestages, including African Americans, pregnant and menopausal women as well as children, may be more sensitive to lead-induced adverse cardiovascular effects. One study examined BLLs and blood pressure in 10 548 Caucasian and 4404 African American individuals (Vupputuri et al., 2003). After adjustments for various potential confounding effects, an increased OR of 1.39 (95% CI = 1.21–1.61) was measured in African American females. No effects on blood pressure were attributed to blood lead in Caucasians. BLLs of ≥ 5 μg/dL were significantly associated with higher systolic and diastolic blood pressure in African American men and women. Significant effects on systolic blood pressure in African Americans, but not Caucasians, were also reported in Den Hond et al. (2002) using the same cohort, as well as in Scinicariello et al. (2011). Lead has also been associated with pregnancy-related increases in blood pressure. BLLs were significantly higher in women with pregnancy-induced hypertension than in non-hypertensive pregnant women during the second and third trimesters of pregnancy (mean BLLs were 2.2 μg/dL in hypertensive subjects and 1.9 μg/dL in non-hypertensive subjects). Another study showed a significant association between maternal blood pressure and umbilical BLL at very low levels (mean maternal BLL was estimated to be 0.86 μg/dL from umbilical cord data) (Wells et al., 2011). However, definitive conclusions cannot be drawn from these data, because blood pressure measurements were taken during labour and delivery, a time of significant stress, with expected impacts on blood pressure. Nash et al. (2003) examined blood pressure and hypertension prevalence in 2165 premenopausal and postmenopausal women and determined that hypertension was significantly increased in the women at BLLs ranging from 4.0 to 31.1 μg/dL, with stronger associations observed in the postmenopausal women. Also, testing of 122 children (all 9.5 years of age) with cord blood and early childhood BLL data demonstrated that BLLs in excess of 2.9 μg/dL can increase vascular resistance responses to stress in children (Gump et al., 2005) and that lead exposure is associated with autonomic and cardiovascular dysregulation in children (Gump et al., 2011).
Few studies have carefully examined cardiovascular disease–related morbidity and mortality upon prolonged exposure to lead. Mortality resulting from cardiovascular disease and stroke, as well as all causes, was significantly increased at BLLs of 3.6 μg/dL and above in a large prospective study of 13 946 adults in the U.S. NHANES monitored over up to 12 years (Menke et al., 2006). After multivariable adjustment for age, sex, body mass index, smoking, alcohol consumption, socioeconomic status and additional indicators of overall health, hazard ratios were 1.25 (95% CI = 1.04–1.51) and 1.55 (95% CI = 1.08–2.24) for all-cause and cardiovascular mortality, respectively. In a subset of the same cohort (2125 participants over 40 years of age at baseline), ORs of peripheral artery disease were only marginally increased at a BLL of 2.9 μg/dL and above (OR = 2.88, 95% CI = 0.87–9.47) after adjustments for demographic and cardiovascular risk factors (Navas-Acien et al., 2004). Schober et al. (2006) also demonstrated in 9757 participants of the same cohort that were over 40 years of age that BLLs exceeding 10 μg/dL were associated with cardiovascular disease–related mortality (relative risk [RR] = 1.55; 95% CI = 1.16–2.07).
The relationship between stress, lead and blood pressure has been studied by a few authors. Zota et al. (2013) conducted a cross-sectional study to determine whether allostatic load (AL), a composite measure of physiologic response to chronic exposure to stress, amplifies the effect of lead exposure on blood pressure among middle-aged adults. Associations between BLLs and blood pressure in 8,194 U.S. adults (aged 40-65 years) participating in NHANES between 1999-2008 were analysed using logistic regression models revealing a linear dose-response relationship for BLLs and elevated systolic blood pressure in the high AL group (p = 0.03) but not the low AL group (p = 0.24); similarly, the relationship between BLLs and elevated diastolic blood pressure was stronger among the high AL group compared to the low AL group. Peters et al. (2007) examined whether psychological stress modified the impact of cumulative lead exposure (measured as tibia and patella lead levels) on hypertension and blood pressure in lead exposed men from a Boston community participating in the Normative Aging Study. Cross-sectional analysis showed positive interactions between stress and tibia lead on systolic blood pressure, after adjusting for confounders (i.e. age, body mass index, family history of high blood pressure, education, smoking, alcohol consumption, physical activity, and nutritional factors); individuals reporting high stress had 2.66 (95% CI, 1.43-4.95) times the risk of developing hypertension per standard deviation increase in tibia lead and had 2.64 (95% CI, 1.42-4.92) times the risk per standard deviation increase in patella lead.
Although epidemiological data are somewhat inconsistent, there is sufficient evidence to conclude that lead exposure is related to adverse cardiovascular effects and to support a causal relationship between BLL and systolic blood pressure. Although the increases in blood pressure reported were relatively small, they can potentially lead to substantive population-level health impacts. Using distributions of systolic blood pressure in Canadians, it was estimated that a 1% increase in systolic blood pressure across the population would result in a sex- and age-adjusted added risk of coronary heart disease mortality of 1 in 2000 in adults 35–74 years of age (although males were more susceptible, representing approximately 80% of the deaths) (Healey et al., 2010). As such, even subtle increases in blood pressure should be considered as a potentially important lead-related adverse health effect.
9.1.2.3 Renal effects
There is consistent evidence of adverse renal effects from lead exposure. Severe deficits in function and pathological changes can be observed at BLLs exceeding 50 µg/dL (ATSDR, 2007), although much lower BLLs are associated with renal dysfunction. A review of the epidemiological literature has concluded that lead contributes to nephrotoxicity even at BLLs below 5 µg/dL, especially in sensitive populations, such as hypertensive and diabetic individuals and those already affected by chronic kidney disease (Ekong et al., 2006).
Markers of renal dysfunction, including reduced glomerular filtration rate and creatinine clearance (estimated from creatinine in serum and in urine collected over 24 hours) as well as increased serum creatinine, have been reported at environmentally relevant BLLs. Of these markers, glomerular filtration rate is considered the most reliable and was examined in 820 Swedish women with a median BLL of 2.2 µg/dL (Åkesson et al., 2005). Although the study actually focused on cadmium exposure, the use of lead as a confounding variable revealed significant associations of increased BLL with reduced glomerular filtration rate as well as creatinine clearance. No significant interaction between blood lead and blood cadmium was observed.
Additional epidemiological studies pertaining to environmentally relevant BLLs have focused on creatinine levels exclusively. In Kim et al. (1996), frozen blood samples taken from 459 men from the Normative Aging Study every 3–5 years between 1979 and 1994 were used to determine the association of BLL with serum creatinine over time. A significant association was found even among subjects whose BLL had never exceeded 9.9 µg/dL throughout the study period. A 10-fold increase in BLL also predicted a serum creatinine increase of 0.08 mg/dL, which corresponds to approximately 20 years of aging. Two additional studies have reported significant reductions in creatinine clearance upon environmental exposure to lead, although creatinine levels were not examined over time (Staessen et al., 1992; Payton et al., 1994). This was shown in a population of 965 men and 1016 women with mean BLLs of 11.4 µg/dL and 7.5 µg/L, respectively, and for which data were adjusted for co-exposure to cadmium and other covariates. A 10-fold increase in BLL was associated with a reduction of 10–13 mL/minute in creatinine clearance (Staessen et al., 1992). The second cohort (same as Kim et al., 1996), in which a positive association was made, examined 744 men with a mean BLL of 8.1 µg/dL (Payton et al., 1994).
There is evidence to indicate that sensitive populations may be especially vulnerable to adverse renal effects. Muntner et al. (2003) studied renal effects in 4813 hypertensive (mean BLL = 4.21 µg/dL) and 10 398 non-hypertensive (mean BLL = 3.30 µg/dL) adults. Although no association was made in non-hypertensive individuals, those with hypertension had significantly or marginally significantly increased ORs for elevated serum creatinine (OR = 1.47, 95% CI = 1.03–2.10) and chronic kidney disease (OR = 1.44, 95% CI = 1.00–2.09) after adjustments for appropriate confounding effects at BLLs as low as 2.5–3.8 µg/dL. Higher adjusted ORs for both serum creatinine and chronic kidney disease were reported for two additional groups with higher BLLs (3.9–5.9 µg/dL and 6.0–56.0 µg/dL) in a dose–response trend. Evidence suggesting that specific subgroups may be more sensitive to developing adverse renal effects as a result of lead exposure was also shown in Tsaih et al. (2004) through significant associations between lead levels (both blood and bone) and serum creatinine in diabetic and hypertensive individuals, but not in the overall study population. It is not clear whether children are more susceptible than adult populations to adverse renal effects. Reduced glomerular filtration rate was reported in a population of 769 healthy adolescents with a median BLL of 1.5 µg/dL (Fadrowski et al., 2010).
Thus, there is consistent evidence of adverse renal effects occurring at low BLLs, with some evidence that BLLs that are chronically below 10 µg/dL can lead to renal dysfunction. Sensitive populations, including those with hypertension or diabetes, may be specifically vulnerable to lead-induced adverse renal effects. The lowest BLL associated with an effect was 2.5–3.8 µg/dL in a hypertensive population, with suggestive evidence of effects occurring at BLLs as low as 2.2 µg/dL. It should be noted that there is a possibility that reduced kidney function can result in altered lead clearance, thus leading to higher BLLs. Although this is most likely to occur only upon substantive renal damage, it cannot be ruled out as a potential confounder in renal toxicity studies.
9.1.2.4 Cancer
The epidemiological studies that have examined the relationship between long-term exposure to lead and cancer incidence and mortality have reported both positive and negative findings. Epidemiological studies provide suggestive evidence that lead may be carcinogenic at high doses.
A number of studies have examined cancer occurrence in occupationally exposed populations. Two meta-analyses have been conducted. One of the meta-analyses examined all of the available cancer studies where occupational exposure to inorganic lead occurred, including studies where lead exposure was known, but not quantifiable (Fu and Boffetta, 1995). RRs were 1.1 (95% CI = 1.05–1.17), 1.33 (95% CI = 1.18–1.49), 1.29 (95% CI = 1.10–1.50) and 1.41 (95% CI = 1.16–1.71) for overall cancers, stomach cancer, lung cancer and bladder cancer, respectively. Restricting the meta-analysis to studies with heavy lead exposure (battery and smelter industry workers only) resulted in an increase in RRs for cancers of the stomach (RR = 1.50, 95% CI = 1.23–1.83) and lung (RR = 1.44, 95% CI = 1.29–1.62). This provides some evidence of a dose-related increase in cancer for exposure to inorganic lead compounds. The second meta-analysis considered only eight studies that had reported specific measurements of exposure level or BLL (average BLL range of 26–80 µg/L) (Steenland and Boffetta, 2000). There was evidence of increased lung cancer (RR = 1.30, 95% CI = 1.15–1.46) and stomach cancer (RR = 1.34, 95% CI = 1.14–1.57). The association for lung cancer remained significant after exclusion of one study that may have been confounded by exposure to arsenic (RR = 1.14, 95% CI = 1.04–1.73). Increases in cancer at other sites, including kidney and brain, were not significant. It must be noted that these studies could not take into account potential confounders, including smoking, dietary habits and exposure to certain chemicals. Thus, the results of the studies are unreliable with respect to drawing any conclusions on the risks of cancer following exposure to lead.
Liao et al. (2016) investigated the relationship between occupational lead exposure and the incidence of stomach, lung, kidney, brain and meninges cancers in two prospective cohorts in Shanghai, China. Estimates of cumulative exposure to lead fumes and lead dust were derived by the statistical modeling of expert lead intensity ratings with inspection measurements, which was then applied to the lifetime work histories of participants from the Shanghai Women's Health Study (SWHS; n = 73,363) and the Shanghai Men's Health Study (SMHS; n = 61,379); exposure metrics for men and women were then combined into an overall occupational lead exposure variable. The proportions of SWHS and SMHS participants with estimated occupational lead exposure were 8.9% and 6.9%, respectively. Lead exposure was positively associated with meningioma risk in women (n = 38 unexposed and 9 exposed cases; relative hazard ratio (RR) = 2.4; 95% CI: 1.1, 5.0), particularly in the case of above median cumulative exposure (RR = 3.1; 95% CI: 1.3, 7.4); in men, all 12 observed meningioma cases were not due to lead exposure. In addition, the authors also observed non-significant associations for kidney (n = 157 unexposed and 17 ever exposed cases; RR = 1.4; 95% CI: 0.9, 2.3) and brain (n = 67 unexposed and 10 ever exposed cases; RR = 1.8; 95% CI: 0.7, 4.8) cancers for males and females combined, as well as elevated risks of lung and stomach cancers with high lead exposure in the male cohort (no associations were observed in the female cohort). These findings suggest an association between lead exposure and the risk of several cancers, however, the small numbers of cases, particularly for kidney and brain cancer, limit the interpretation of these results.
Studies that have examined cancer occurrence following exposure of workers in industrial settings known to be high in lead or by BLL measurements have reported both positive and negative associations. Of the studies that have reported positive associations, significant effects have been found for lung, central nervous system, brain, kidney, stomach and all-sites cancers (IARC, 2006). Stronger and more consistent evidence for causality were made for lung (Sheffet et al., 1982; Gerhardsson et al., 1986; Ades and Kazantzis, 1988; Anttila et al., 1995; Lundström et al., 1997; Wong and Harris, 2000; Englyst et al., 2001), stomach (Sheffet et al., 1982; Gerhardsson et al., 1986; Wong and Harris, 2000) and all-sites cancers (Jemal et al., 2002; Lustberg and Silbergeld, 2002; Schober et al., 2006) than for other cancers. However, the associations made were often equivocal and involved co-exposure to other chemicals, including zinc chromate, arsenic, cadmium or other potential carcinogens. The lack of information available in most studies also did not enable appropriate controlling for additional covariates.
Few of the studies cited above demonstrated a strong association between cancer risk and exposure to lead at environmentally relevant doses. Schober et al. (2006) examined 9757 members of the general public in the U.S. NHANES with single BLL measurements. Taking all age groups into consideration (≥ 40 years), the RR for all-cancer mortality was 1.44 (95% CI = 1.12–1.86) and 1.69 (95% CI = 1.14–2.52) for those with BLLs of 5–9 µg/dL and ≥ 10 µg/dL, respectively, in comparison with the referent group (BLL < 5 µg/dL). The study was a large cohort that adjusted for sex, race/ethnicity, education level and smoking status. Menke et al. (2006) analysed the same cohort using adults 20 years of age and over instead of 40 years of age and over and observed no significant association between cancer mortality and BLL at BLLs below 10 µg/dL. As the Schober et al. (2006) study examined a broader BLL range and also as lead exposure–related cancer mortality is unlikely to occur in lower age groups, this study was considered more sensitive than the study by Menke et al. (2006). Still, only one BLL measurement was taken, and this lack of monitoring over time reduces our ability to conclusively determine that the cancers are related to lead exposure. One study investigated lung cancer following long-term monitoring of BLL (cumulative BLLs following annual measurements in smelter workers) (Englyst et al., 2001); although a significant number of lung cancer cases were observed in the lead-exposed workers, the study is confounded by substantive exposure to arsenic.
Many of the studies reported negative effects on cancer, and interpretation of the positive studies was often hampered by co-exposure to other substances and lack of controlling for other confounding factors. However, cancer mortality was slightly increased in one environmentally relevant study (Schober et al., 2006) that assessed the dose–response relationship and controlled for important confounders. In conclusion, the data on cancer in humans is suggestive that lead exposure may be associated with carcinogenic outcomes, especially at higher exposures, such as in occupational settings.
9.1.3 Developmental and reproductive toxicity
9.1.3.1 Reproductive effects
Adverse reproductive effects of lead exposure included delays in sexual maturation among men and women, increases in spontaneous abortions and preterm births, reduced birth weights as well as decreased sperm concentrations.
There was consistent evidence of delayed puberty in women following environmental exposure to lead. The effects of environmental lead exposure on sexual maturation were investigated in 600 Caucasian, 805 African American and 781 Mexican American girls aged 8–18 years. Significant delays in breast and pubic hair development as well as age at menarche were observed in African American girls at a mean BLL of 3 µg/dL in comparison with a BLL of 1 µg/dL. These same BLLs were also associated with delayed breast and pubic hair development in Mexican American girls, although Caucasian girls were not significantly affected (Selevan et al., 2003). In another study that examined the same population of girls, BLLs higher than 2.1 µg/dL were associated with delays in pubic hair development and age to menarche, but not breast development (Wu et al., 2008). The significance of these delays increased with higher doses, and both studies were adjusted for important confounding effects. Breast and pubic hair development as well as attainment of menarche at 13 years of age were all significantly affected in African girls with BLLs above 5 µg/dL in comparison with those with BLLs below 5 µg/dL (mean BLL in the 1683 girls was 4.9 µg/dL) (Naicker et al., 2010). In a smaller study that examined exposure to multiple chemicals, including lead, mercury, hexachlorobenzene and polychlorinated biphenyls, age at menarche in girls with BLLs above the median of 1.2 µg/dL was 10.5 months later than that for girls with BLLs below the median (Denham et al., 2005). Increases in BLL were not associated with delayed breast development in an urban study of 192 9-year-old girls with a mean BLL of 2.4 µg/dL, although the lack of association may be related to the small study population size (Wolff et al., 2008).
There is additional evidence to suggest that exposure to lead may be associated with younger age at menopause. Higher BLLs were measured in menopausal women in comparison with women still menstruating after adjustments for bone turnover, age and other covariates at levels as low as 1.4–2.1 µg/dL (Mendola et al., 2013). In a study of bone lead, as a measure of cumulative exposure to lead, tibia lead concentrations exceeding 13 µg/g were associated with a reduction of 1.21 years of age at menopause. No associations were found for patella lead or blood lead (median BLL was 3 µg/dL) (Eum et al., 2012). The effects reported for puberty and menopause collectively suggest that exposure to lead may shorten a woman's reproductive lifespan.
Increased levels of lead in pregnant women have been associated with increases in spontaneous abortions and preterm births, as well as decreases in birth weights. However, the epidemiological evidence for these endpoints is inconsistent. One well-conducted study investigated spontaneous abortions in 668 pregnant women who enrolled in the study in their first trimester. After multiple adjustments for covariates, it was found that every increase in BLL of 5 µg/dL (5–9, 10–14, and ≥15 µg/dL) was associated with an OR for spontaneous abortion of 1.8 (95% CI = 1.1–3.1) (Borja-Aburto et al., 1999). Another study estimated that a 0.1% increase in plasma to blood lead ratio (plasma containing the toxicologically active fraction of lead) was associated with a 12% greater incidence of spontaneous abortion (Lamadrid-Figueroa et al., 2007). However, Vigeh et al. (2010) found that BLLs of women who had a spontaneous abortion in comparison with BLLs of women with ongoing pregnancies did not differ significantly (3.51 µg/dL and 3.83 µg/dL, respectively). Increases in bone lead have been associated with reduced birth weight and length (González-Cossío et al., 1997; Hernandez-Avila et al., 2002). Increased maternal BLLs in the first and second trimesters (means of 7.2 µg/dL and 6.3 µg/dL, respectively) were associated with premature delivery (Cantonwine et al., 2010).
Reproductive effects, including reduced fertility following paternal exposure and reduced sperm concentrations, have also been reported for males, but generally at higher BLLs (> 30 µg/dL) (Alexander et al., 1996; Sallmén et al., 2000; Shiau et al., 2004). The dose–response relationship was examined in all three studies but was demonstrated in only two of the populations. It should be noted that these studies did not always measure and control for important confounding effects. One environmental exposure study examined puberty in 489 boys at 8–9 years of age. BLLs above 5 µg/dL were associated with delayed markers of pubertal development based on genitalia staging and testicular volume (Hauser et al., 2008; Williams et al., 2010).
Thus, lead exposure can affect the reproductive system in both men and women. Delayed puberty in females appears to be the most sensitive endpoint, with evidence suggesting effects at BLLs as low as 1.2 µg/dL. However, the strength of this association is limited by the few studies that have investigated the effect. Both studies that reported a significant effect were done in the same population, and there is an additional negative study in urban girls.
9.1.3.2 Neurodevelopmental effects
Neurodevelopmental effects related to decreased intelligence, attention and performance have long been reported in infants and children exposed to lead early in life as well as in utero. There are a significant number of data implicating low levels of exposure (BLLs < 10 µg/dL) in these adverse effects. The deleterious effects of lead exposure manifested in developing children can potentially have lifelong health and socioeconomic implications.
Epidemiological studies have associated BLL, tooth/dentin lead level and, in some cases, cord BLL and maternal BLL with adverse neurodevelopmental effects in infants and children, including inferior neuromotor function (Dietrich et al., 1993b; Wasserman et al., 2000; Ris et al., 2004; Després et al., 2005; Fraser et al., 2006; Boucher et al., 2012), poorer academic achievement and reading or math skills (Needleman and Gatsonis, 1990; Fergusson et al., 1997; Lanphear et al., 2000; Al-Saleh et al., 2001; Wang et al., 2002; Miranda et al., 2007; Chandramouli et al., 2009; Huang et al., 2012), abnormal behaviour (Fergusson et al., 1993; Bellinger et al., 1994a; Needleman et al., 1996; Dietrich et al., 2001; Parajuli et al., 2013, 2014), decreased attention or executive functions (Bellinger et al., 1994b; Canfield et al. 2003b; Chiodo et al., 2004, 2007; Braun et al., 2006; Nigg et al., 2008; Wang et al., 2008; Bouchard et al., 2009; Froehlich et al., 2009; Ha et al., 2009; Cho et al., 2010; Kim et al., 2010; Nicolescu et al., 2010) as well as impairments of auditory and visual function (Schwartz and Otto, 1991; Dietrich et al., 1992; Fox et al., 1997; Osman et al., 1999; Rothenberg et al., 2002; Canfield et al., 2004; Fox et al., 2008). In most cases, the associations were reported at BLLs below 10 µg/dL after controlling for confounding effects (Osman et al., 1999; Lanphear et al., 2000, 2005; Canfield et al., 2003a; Chiodo et al., 2004, 2007; Després et al., 2005; Fraser et al., 2006; Téllez-Rojo et al., 2006; Miranda et al., 2007; Chandramouli et al., 2009).
There is evidence to suggest that exposure to lead is associated with alterations in attention-related behaviour, such as attention deficit hyperactivity disorder (ADHD), in studies of children 3–18 years of age, at BLLs below 5 µg/dL (Chiodo et al., 2004, 2007; Braun et al., 2006; Nigg et al., 2008, 2010; Wang et al., 2008; Froehlich et al., 2009; Ha et al., 2009; Cho et al., 2010; Kim et al., 2010; Boucher et al., 2012). One meta-analysis determined that there was a small but significant association between lead exposure, as measured by blood, tooth and hair lead levels, and ADHD symptoms, including inattention and hyperactivity/impulsivity (Goodlad et al., 2013). Braun et al. (2006) examined ADHD prevalence in 4704 children aged 4–15 years and determined that BLLs exceeding 2 µg/dL were associated with a 4.1-fold increase in risk of ADHD (95% CI = 1.2–14.0), with an association that remained significant when the BLLs used for the analysis were restricted to below 5 µg/dL. In the same cohort of children, but only those aged 8–15 years, BLLs higher than 1.3 µg/dL were associated with a 2.3-fold increase in the risk of ADHD (95% CI = 1.5–3.8) (Froehlich et al., 2009). An association between BLL and ADHD (combined type but not predominantly inattentive type) was found in 236 children aged 6–17 years with very low BLLs (maximum BLL of 2.2 µg/dL) after controlling for confounding effects (Nigg et al., 2010). It was shown in one cohort study that a 1 µg/dL increase in BLL in children aged 3–5 years (mean BLL = 6.4 µg/dL) resulted in increases in teacher-reported behaviour scores of 0.32 in emotional reactivity (95% CI = 0.058–0.587), 0.25 in anxiety problems (95% CI = 0.016–0.500) and 0.30 in pervasive developmental problems (95% CI = 0.046–0.560) (Liu et al., 2014). It is possible that effects on attention may be the underlying cause of lead's effects on intelligence quotient (IQ). Additional longitudinal studies will be helpful in determining the actual effect of lead on attention.
Performance on psychometric tests of intelligence (i.e., IQ testing) is by far the most documented neurodevelopmental endpoint with the greatest weight of evidence for effects at low levels of exposure. Decreases in IQ have been reliably associated with limitations in academic achievements and earning potential, and thus IQ can serve as a surrogate for the many other adverse neurological consequences beyond the immediate implications of reduced performance on intelligence tests. Studies of 12 cohorts have examined the effects of BLL on IQ of children following multiple BLL measurements from birth to evaluation. Data from four of the cohorts provide strong evidence of decreased IQ following early-life exposure to lead, although these were generally in highly exposed individuals or in children who had high and low exposures to lead throughout their lifetimes (Baghurst et al., 1992; Tong et al., 1996; Factor-Litvak et al., 1999; Wasserman et al., 2000; Canfield et al., 2003a; Chen et al., 2005; Jusko et al., 2008). However, one of these cohorts provided strong evidence for effects at BLLs below 10 µg/dL. In a study of 172 mostly African American children, concurrent, lifetime average, average in infancy and peak BLLs were significantly associated with reductions in IQ scores after adjustments for confounding effects and remained significant when the population was restricted to individuals with peak BLLs that never exceeded 10 µg/dL (Canfield et al., 2003a). In the same cohort, adverse impacts on IQ were measured at the lowest peak BLL of 2.1 µg/dL (Jusko et al., 2008). Six of the other cohorts supported the association between BLL and reduction in IQ in children, without reaching statistical significance (Bellinger et al., 1992; Dietrich et al., 1993a; Shen et al., 1998; Schnaas et al., 2000; Gomaa et al., 2002; Ris et al., 2004; Téllez-Rojo et al., 2006), whereas only two cohorts showed no association (Ernhart et al., 1987, 1989; Cooney et al., 1989a, 1989b). Nonetheless, the overall evidence for effects on IQ decrements is strong when considering the persistence of the effect through childhood and early adulthood. Although one study confirmed that lower IQ scores occur in adults 28–30 years of age following childhood exposure to lead (Mazumdar et al., 2011), further longitudinal studies that extend into adulthood would be needed to firmly conclude that IQ decrements persist over a lifetime.
Overall, four meta-analyses have examined the relationship between prenatal and postnatal BLLs and performance on psychometric tests using data from the above-mentioned longitudinal studies and additional cross-sectional studies (Needleman and Gatsonis, 1990; Thacker et al., 1992; Pocock et al., 1994; Schwartz, 1994a). These meta-analyses are unanimous in their conclusions that the epidemiological evidence supports an association between increases in BLL and decrements in IQ. One study in particular investigated the effects of lead exposure on IQ decrements using longitudinal data exclusively (Lanphear et al., 2005). The pooled data set included 1333 subjects from diverse backgrounds comprising four American cohorts—Boston, Massachusetts (Bellinger et al., 1992), Cincinnati and Cleveland, Ohio (Ernhart et al., 1989; Dietrich et al., 1993a), and Rochester, New York (Canfield et al., 2003a)—as well as three other cohorts from Mexico City (Schnaas et al., 2000), Port Pirie, Australia (Baghurst et al., 1992), and Kosovo, Yugoslavia (Wasserman et al., 2000). All of the studies measured IQ using the same approach (i.e., the Wechsler Intelligence Scales for Children), and information on the same covariates was available (i.e., maternal IQ, marital status, prenatal alcohol and tobacco use, quality of the home environment as measured by the Home Observation for Measurement of the Environment [HOME] inventory score, sex, birth order and birth weight). Information on ethnicity was available for the U.S. data, although socioeconomic status, nutrition and paternal IQ were not assessed. The analysis included children with BLLs below 10 µg/dL (approximately 18% of the children never exceeded BLLs of 10 µg/dL) and various BLL measurements, including concurrent BLL (taken closest to IQ testing, median = 9.7 µg/dL), maximum BLL (median = 12.7 µg/dL), average lifetime BLL (mean from 6 months to concurrent BLL, median = 12.4 µg/dL) and childhood BLL (mean BLL from 6 to 24 months, median = 12.7 µg/dL). Overall, concurrent BLL was most strongly associated with decreases in IQ, and the severity of the effect increased at a higher rate at lower BLLs than at higher BLLs. Increases in BLL from 2.4 to 10 µg/dL and from 10 to 20 µg/dL resulted in IQ point decrements of 3.9 (95% CI = 2.4–5.3) and 1.9 (95% CI = 1.2–2.6), respectively (changes in IQ from 20 to 30 µg/dL were not significant). Moreover, IQ was more substantially affected by an increase in BLL in children with maximal BLLs < 7.5 µg/dL then in those with maximal BLLs ≥ 7.5 µg/dL, indicating that the dose–response relationship for lead exposure is likely more sensitive at lower doses and confirming that effects on IQ can occur at very low BLLs. Data from Lanphear et al. (2005) have been used by the European Food Safety Authority (EFSA) and by the Joint FAO/WHO Expert Committee on Food Additives (JECFA) to establish benchmark doses (BMDs) associated with a 1% change in response (BMDL01s) of 1.2 and 0.8 µg/dL, respectively (JECFA, 2011; EFSA, 2013). A statistical re-evaluation of the data was undertaken by Crump et al. (2012). Although the authors noted potential issues with some of the key assumptions and small errors, the reanalysis confirmed the validity of the conclusions put forth by Lanphear et al. (2005).
There is also evidence of an association between in utero exposure to lead, as measured by maternal BLL or cord BLL, and effects on neurodevelopment in children, although these associations are not as strong as the evidence measured for postnatal BLLs. Maternal BLLs and cord BLLs below 5 µg/dL have both been associated with adverse effects on intelligence, memory and cognition in infants aged 7–36 months (Emory et al., 2003; Jedrychowski et al., 2009; Parajuli et al., 2013). However, negative associations have been reported in many of the studies that have examined maternal BLLs below 10 µg/dL (Baghurst et al., 1992; Bellinger et al., 1992; Dietrich et al., 1993b; Parajuli et al., 2014). One study reported that a mean maternal BLL of 7.8 µg/dL at 28–36 weeks of pregnancy was associated with reduced performance on IQ tests in children 6–10 years of age (Schnaas et al., 2006). However, the strength of the association is limited by mean postnatal BLLs that exceeded 10 µg/dL in the children. Although some data suggest that the developing fetus may not be affected at the very low doses at which effects were observed in children, there is no basis to determine that the fetus is less sensitive than the developing child to the effects of lead. An association between lead exposure in utero and the risk of schizophrenia has also been reported by Opler et al. (2004, 2008) in 2 different cohorts. Maternal BLLs ≥15 μg/dL (estimated via delta-aminolevulinic acid, a biologic marker of lead exposure) was found to be associated with a doubling of the risk of schizophrenia in the offspring when compared to offspring from mothers with BLLs <15 μg/dL.
Thus, BLLs as low as 0.8 µg/dL have been associated with adverse neurodevelopmental effects in children. The effects are particularly related to decreases in intelligence and may also include alterations in attention and behaviour. Although the available data to assess the reversibility of these effects are insufficient, there are studies to suggest permanent alterations in the brain of adults exposed to lead as infants and children (Yuan et al., 2006; Cecil et al., 2008, 2011; Brubaker et al., 2009). Most studies that have examined the effects of BLLs below 5 µg/dL on the IQ of children cannot identify a threshold below which lead no longer exerts an adverse effect. It should be noted that one study that investigated effects on IQ in the largest number of children with BLLs below 5 µg/dL did not report a significant inverse relationship between BLLs and IQ at levels below 5 µg/dL and indicated a significant effect on IQ only at 5–10 µg/dL using children with BLLs of 1–2 µg/dL as a referent group (Surkan et al., 2007). However, taking into consideration all of the available studies, the weight of evidence suggests that the BLL considered to cause no harm is unknown.
Relatively small changes in IQ can potentially lead to substantive population-level health impacts. It is estimated that a 1% decrement in population IQ (corresponding to 1 IQ point decrement) is associated with an added risk of mild mental retardation of 1 in 250 individuals (Healey et al., 2010). As such, even subtle changes in population IQ should be considered to be an important lead-related adverse health effect.
9.2 Effects on experimental animals
9.2.1 Acute toxicity
There is very little information on the acute toxicity of lead in animals. The lowest oral doses of lead capable of causing death were reported as 191–1366 mg/kg bw in dogs, 313–20 500 mg/kg bw in guinea pigs and 160 mg/kg bw in pigeons (Sax and Lewis, 1989; ATSDR, 1999). The lowest intraperitoneal injection dose reported to cause death in rats was 1000 mg/kg bw (Sax and Lewis, 1989).
9.2.2 Short-term exposure
9.2.2.1 Neurological effects
The neurological effects of exposure to lead have been investigated in a few studies in monkeys and rats. Adult monkeys were shown to exhibit neurological impairments relating to spatial learning and short-term memory deficits when exposed from birth onwards to lead acetate at doses of 50 and 100 μg/kg bw per day (Rice and Karpinski, 1988). This resulted in steady-state BLLs of 11 and 13 μg/dL at 50 and 100 μg/kg bw per day, respectively (unexposed animals had BLLs of 3 μg/dL). A series of additional tests were conducted on monkeys exposed orally to vehicle or lead acetate at 2.1 mg/kg bw per day, 5 days/week, according to three different exposure scenarios: dosed with lead from birth onwards, dosed with lead from birth to 400 days of age and vehicle thereafter and dosed with vehicle from birth to 300 days of age and lead thereafter (Rice, 1990, 1992b, 1992c; Rice and Gilbert, 1990a, 1990b). The animals exhibited BLLs ranging from 19 to 26 μg/dL during dosing and up to 32–36 μg/dL when treatment occurred in addition to nutrition through infant formula (BLLs of controls ranged from 3 to 6 μg/dL). Various neurobehavioural tests pertaining to spatial and non-spatial discrimination as well as fixed-interval testing in which reward for a response was delayed for a specific amount of time were conducted from ages 6 to 9 years. For the most part, the tests were significant for all exposure scenarios (Rice, 1990, 1992b; Rice and Gilbert, 1990a), with one exception for one nonspatial discrimination test in which no effects were observed when exposure occurred in infancy only (Rice and Gilbert, 1990b). These results suggest that exposures that are exclusive to adulthood or infancy are sufficient in producing persistent adverse neurobehavioural effects in non-human primates. Markers of Alzheimer's disease, including altered expression of disease-related genes (amyloid precursor protein [APP], β-site APP cleaving enzyme and transcription factor specificity protein 1 [Sp1]) and increased β-amyloid proteins and plaques in the frontal association cortex, were observed in the same animals exposed from birth to 400 days of age and tested at 23 years of age (BLL = 19–26 μg/dL) (Wu et al., 2008). These data suggest that exposure early in life can result in latent neurological effects in adulthood.
Adverse neurobehavioural effects of lead exposure have also been observed in rats. Rats that were 21 days, 8 months or 16 months of age, to represent young, adult and old animals, respectively, were exposed to 0, 2 or 10 mg lead acetate per day through drinking water (Cory-Slechta and Pokora, 1991; Cory-Slechta et al., 1991). BLLs were fairly consistent at 3, 6 and 9 months and were similar in all animals for the 2 mg/day (BLL range of 10.8–18.3 μg/dL) and the 10 mg/day (BLL range of 22.6–45.2 μg/dL) lead acetate doses. Young and old animals exhibited increased response rates, whereas adult rats demonstrated decreased response rates in fixed-interval behavioural testing (Cory-Slechta and Pokora, 1991). However, delayed spatial alternation performance was actually shown to improve in the lead-exposed young and old rats, with no significant effects observed in the adults (Cory-Slechta et al., 1991). In another study, levels of β-APP gene expression, a marker of Alzheimer's disease development, were monitored over the lifetime of rats exposed to lead acetate only during infancy (mean BLL of 46.43 μg/dL during exposure and reduced to background levels thereafter). Expression was shown to be increased 20 months after exposure ceased, suggesting that effects observed later in adulthood may be related to previous exposure (Basha et al., 2005).
Thus, there is sufficient evidence in experimental animals that implicate lead exposure in adverse neurological effects. Adverse effects in adulthood were observed in exposed mature animals as well as in older animals exposed during infancy following a substantive latency period. None of the studies addressed neurotoxicity of lead at BLLs below 10 μg/dL, and thus it is unknown whether these effects persist at lower exposures.
9.2.2.2 Cardiovascular effects
There is strong and consistent evidence in experimental animals that chronic and subchronic exposure to lead causes sustained increases in blood pressure, even at environmentally relevant doses. These effects have been observed in multiple species, including rats, dogs and pigeons (Staessen et al., 1994b). Older data published in this field have been criticized for methodological issues, including stress in the animals capable of increasing blood pressure as well as the use of genetically susceptible animal models. However, these issues have been addressed in more recent subchronic studies of rats in which statistically significant increases in blood pressure were observed at BLLs below 20 μg/dL (Khalil-Manesh et al., 1994; Gonick et al., 1997; Vaziri et al., 1997, 1999a, 1999b; Ding et al., 1998, 2001; Attri et al., 2003; Fiorim et al., 2011; Silveira et al., 2014).
Studies have reported increases in blood pressure in rats with very low BLLs (< 5 μg/dL). Attri et al. (2003) studied rats that were fed lead acetate at 100 mg/L in water (orally using a syringe) over 3 months. Mean BLLs of 2.4 μg/dL and 4.1 μg/dL that were measured after 2 and 3 months of exposure, respectively, were associated with significant increases in systolic blood pressure, and the rats demonstrated signs of obvious oxidative stress. In another study of rats that were exposed to 0.01%, 0.05%, 0.1%, 0.5%, 1% and 2% lead acetate through drinking water alongside controls over 60 days, effects on systolic and diastolic blood pressure were seen at the lowest exposure level (corresponding to a BLL of 2.15 μg/dL) and increased with dose (Tsao et al., 2000). Ding et al. (1998) showed that exposure of rats to drinking water containing 0.01% lead acetate over 12 weeks resulted in significant increases in blood pressure as of week 8 and continued to rise until the end of the exposure period, at week 12. Discontinuation of the exposure for an additional 2 weeks resulted in sustained increases in blood pressure. Mean BLL was measured at the 14-week time point and was 3.2 μg/dL in the treated animals.
Lead-induced increases in blood pressure are thus strongly supported in animal experimental models at BLLs below 5 μg/dL.
9.2.2.3 Renal effects
Studies in laboratory animals with BLLs exceeding 45 μg/dL have reported decreases in glomerular filtration rate, increases in serum creatinine and kidney weight as well as alterations in renal histopathology (Khalil-Manesh, 1992a, 1992b). Few studies, however, have examined the effects of environmentally relevant lead exposures on renal function.
Rats that were administered lead acetate in drinking water at 150 mg/L over 16 weeks (BLL at 16 weeks was 26.4 μg/dL, and kidney remnant surgery was done at the 4-week time point) developed microvascular and tubular injury and exhibited reduced creatinine clearance (Roncal, 2007). In another study of rats, administration of lead acetate at 100 mg/L in drinking water over 12 months resulted in mild tubular atrophy and interstitial fibrosis (Khalil-Manesh et al., 1993). The highest mean BLL observed in the study was 29.4 μg/dL and was observed at the 3-month post-exposure time point (mean BLL was slightly above 20 μg/dL after 12 months).
9.2.3 Long-term exposure and carcinogenicity
Studies in experimental animals using various species and exposure routes have consistently demonstrated that exposure to inorganic lead is associated with the formation of tumours and cancer, although there is an inadequate amount of information to assess the carcinogenicity of organic lead (IARC, 2006). For inorganic lead forms (e.g., lead acetate, lead subacetate, lead chromate, lead phosphate), there is some evidence of cancers of the lung, adrenal gland, testes, prostate and brain (IARC, 2006). However, the most sensitive site and the one for which the association between lead exposure and carcinogenesis is the strongest and most consistent is undoubtedly the kidney.
Numerous mouse and rat studies have shown that lead is associated with increased incidences of renal proliferative lesions, adenomas or carcinomas following oral exposure. This includes studies of lead acetate (Boyland et al., 1962; Zawirska, 1968, 1981; Azar et al., 1972; Zawirska and Medras, 1972; Waszynski, 1977; Fears et al., 1989; Waalkes et al., 1995, 2004) and lead subacetate (van Esch et al., 1962; Mao and Molnar, 1967; van Esch and Kroes, 1969; Oyasu et al., 1970; Ito et al., 1971; Ito, 1973; Kasprzak et al., 1985) at levels as low as 0.05% in diet for lead acetate and 0.1% in water for lead subacetate. Injection (intramuscular, subcutaneous and intraperitoneal) of lead chromate and lead phosphate in rats also induced renal tumours when administered at total doses exceeding 70 mg for lead chromate and 120 mg for lead phosphate (Zollinger, 1953; Tonz, 1957; Baló et al., 1965; Roe et al., 1965; Furst et al., 1976).
The few studies that have examined multiple exposure levels have reported dose–response trends with regards to renal proliferative lesions. Waalkes et al. (2004) examined kidney histopathology in male mice exposed to lead acetate at 0, 1000, 2000 or 4000 mg/L in drinking water (corresponding to approximately 0, 200, 400 and 800 mg/kg bw per day). Exposures occurred as of 8 weeks of age and persisted up to 112 weeks of age. Incidences of renal proliferative lesions in adult male mice, including atypical tubular hyperplasia and tumours, were reported as 0%, 4%, 12% and 21% for the control, 1000, 2000 and 4000 mg/L treatment groups, respectively. Significance was reached only in the 4000 mg/L dose group. Male metallothionein I/II double knockout mice were also tested using the same exposure regimen. Renal proliferative lesions were more common and more severe in these mice (0%, 40%, 52% and 60% for the control, 1000, 2000 and 4000 mg/L dose groups, respectively). An additional mouse study demonstrated that maternal exposure of mice to lead acetate at 0, 500, 750 or 1000 mg/L in drinking water (corresponding to approximately 0, 100, 150 and 200 mg/kg bw per day) as of gestational day 12 and up to 4 weeks postpartum during lactation resulted in increased incidences of renal proliferative lesions in offspring at 112 weeks of age. Increases in males were 4%, 16%, 24% and 48% for the control, 500, 750 and 1000 mg/L treatment groups, respectively (in females, increases were 0%, 0%, 4% and 16% for the same groups). The renal tumours observed occurred in the absence of significant lead-induced chronic nephropathy, suggesting that chronic renal damage may not be the cause of tumour development (Waalkes et al., 1995).
Thus, there are data in experimental animal models that support inorganic lead–induced renal tumorigenesis and carcinogenesis. Data in mice also suggest that exposure in utero and early in life can lead to renal cancers in adulthood. Additional data suggest that lead-induced cancer can occur at other sites, although the most sensitive and most consistent cancer endpoint by far was renal cancer. Although none of the studies met the stringent guidelines recommended for the chronic rodent cancer bioassay (two species, both sexes, three dose groups plus control and minimum of 50 animals per treatment group) (U.S. Department of Health and Human Services, 2006), the Waalkes et al. (1995, 2004) studies provide adequate evidence that renal tumorigenesis occurs in mice following lead exposure and that incidences increase with dose.
9.2.4 Genotoxicity
There is sufficient evidence that implicates inorganic lead in deoxyribonucleic acid (DNA) damage, although it is unclear if this damage is related to direct or indirect genotoxicity or potentially to alterations in DNA repair processes. The genotoxicity and mutagenicity of lead have been reviewed extensively in IARC (2006) and are briefly described below.
9.2.4.1 In vitro findings
The genotoxicity and mutagenicity of several lead compounds have been assessed in various in vitro test systems.
In bacterial assays, mutagenicity was observed only following treatment with lead chromate and lead bromide, and it is unclear if the lead component of the substance was even involved in the induction of mutations (Nestmann et al., 1979; Maslat and Haas, 1989). However, most tests done in mammalian cell lines revealed that various lead compounds (lead acetate, lead bromide, lead chloride, lead nitrate and lead sulphide) did induce genetic mutations, although the concentrations at which mutagenicity occurred varied significantly with the different cell types and experimental approaches used (Zelikoff et al., 1988; Roy and Rossman, 1992; Yang et al., 1996; Ariza et al., 1998; Ariza and Williams, 1999).
Lead acetate, lead chromate and lead nitrate were tested for their ability to induce DNA strand breaks. These tests in various treated cells derived from humans and experimental animals were consistently positive (Robison et al., 1984; Hartwig et al., 1990; Roy and Rossman, 1992; Xu et al., 1992; Robbiano et al., 1999; Wozniak and Blasiak, 2003). Micronucleus formation also occurred following treatment of mammalian cells derived from Chinese hamsters (ovary cells and fibroblasts) with lead acetate, lead chloride and lead nitrate, generally at lower concentrations compared with DNA strand breaks (Lin et al., 1994; Thier et al., 2003). The results for sister chromatid exchanges and chromosomal aberrations, however, were much more varied (IARC, 2006).
9.2.4.2 In vivo findings
There are in vivo genotoxicity data from both experimental animal and human studies. Genotoxicity studies in animals have reported mixed findings that varied considerably depending on the lead compound studied, the route of exposure, the dose and the test endpoint. In a multigenerational study in which mice drank water containing lead acetate at 1 µg/mL, significant DNA damage in lymphocytes was reported in the second and third generations, suggesting a cumulative effect of exposure from one generation to the next (Yuan and Tang, 2001). DNA damage and micronucleus induction were observed in the kidneys of rats exposed to three successive oral doses of lead acetate at 78 mg/kg bw (Robbiano et al., 1999). Micronucleus induction has also been reported in bone marrow and leukocytes following the administration of high oral and intraperitoneal injection doses of lead acetate (Muro and Goyer, 1969; Deknudt and Gerber, 1979; Tachi et al., 1985). Studies of lead nitrate exposure through intravenous or intraperitoneal injection in mice have reported sister chromatid exchanges in bone marrow as well as chromosomal aberrations and aneuploidy in maternal bone marrow and foetal liver cells at doses as low as 10 mg/kg bw (Nayak et al., 1989; Dhir et al., 1993). None of the studies took into account the BLLs of these animals.
The results of in vivo genotoxicity studies pertaining to human exposures were largely positive. However, it is difficult to draw firm conclusions with regard to the human studies because of considerable co-exposure to other chemicals. All five studies examining DNA strand breaks using the comet assay in leukocytes of lead-exposed workers were positive; the BLLs of these workers ranged from 13 to 98.5 µg/dL (Ye et al., 1999; De Restrepo et al., 2000; Fracasso et al., 2002; Danadevi et al., 2003; Palus et al., 2003). Similarly, induction of micronuclei in blood lymphocytes of exposed workers was significant at BLLs ranging from 40 to 61 µg/dL (Vaglenov et al., 1998, 2001; Hamurcu et al., 2001; Palus et al., 2003). The data for sister chromatid exchanges and chromosomal aberrations are also mostly positive, although some studies have reported negative findings (IARC, 2006). The lack of association does not appear to be related to dose. Studies that have examined non-occupationally exposed populations did not report significant genotoxicity (IARC, 2006).
9.2.5 Reproductive and developmental toxicity
9.2.5.1 Reproductive effects
The strongest evidence of adverse reproductive effects in experimental animals is related to delayed sexual maturation. There are also data to suggest that exposure to lead during gestation can induce malformations in offspring and that exposure of males can affect the reproductive system.
There is consistent evidence that exposure to lead can delay sexual maturation in experimental animals. One study examined dietary exposure to lead acetate in female mice at several doses ranging from 0.02 to 40 mg/kg (corresponding BLLs ranged from 0.7 to 13.2 μg/dL). Lead exposure significantly delayed puberty in the female mice in a dose–response trend, as shown by delays in age at vaginal opening, estrus, vaginal plug formation and first parturition. In comparison with the 0.2 mg/kg level of exposure (BLL = 1.9 μg/dL), the dose considered to represent the typical background BLL, only the highest exposure levels, corresponding to BLLs of 8.4 and 13.2 μg/dL, were statistically significant (Iavicoli et al., 2004). Very similar findings were made in the second and third generations of the same mice exposed to the same levels throughout gestation and lactation, with subsequent exposure of female offspring at the same levels through feed. BLLs in the two highest dose groups (8.1/12.7 μg/dL and 8.1/12.9 μg/dL in the second and third generations, respectively) were statistically significant for the 0.2 mg/kg exposure level (BLL = 0.7 μg/dL for both second and third generations). It appears that additional exposure in utero and early in life does not increase the propensity towards delayed puberty in exposed mice (Iavicoli et al., 2006). Conversely, delayed onset of puberty as well as decreases in puberty-related hormones (insulin-like growth factor 1, luteinizing hormone and estradiol) were observed in female rats exposed to lead acetate in utero exclusively, as well as those exposed during gestation/lactation and lactation only (Dearth et al., 2002).
Several effects were also observed in males. Barratt et al. (1989) examined sperm concentration and abnormalities in rats administered lead acetate at 0.3–300 mg/kg bw per day over 9 weeks, with BLLs ranging from 2 to 80 μg/dL. A significant effect on sperm abnormality was observed at the very highest dose, corresponding to a BLL of 80 μg/dL (Barratt et al., 1989). Sperm count and sperm motility were not affected in rats treated with 5 mg/kg bw via intraperitoneal injection (BLL = 7 μg/dL), although structural changes in spermatids and Sertoli cells were evident (Murthy et al., 1995). Gestational exposure also resulted in effects on the male reproductive system, as shown through structural damage to seminiferous tubules and reduced prospermatogonia in male rats, although elevated BLLs (17.8–31.6 μg/dL) in the rat pups may have been directly responsible for these effects (Corpas et al., 1995).
There is limited evidence to indicate that lead is teratogenic in experimental animals. Maternal BLLs as low as 10 μg/dL in pregnant rats have resulted in increased external malformations, with increased fetal resorptions occurring at maternal BLLs of 14 μg/dL and above (Flora and Tandon, 1987).
Studies in experimental animals indicate that lead can induce reproductive effects, particularly with respect to sexual maturity in female animals. These effects may potentially occur at BLLs below 2 μg/dL.
9.2.5.2 Neurodevelopmental effects
Although no test is available to assess IQ in experimental animals, several neurodevelopmental endpoints, including the ability to learn specific tasks, motor coordination skills and changes in behaviour, have been examined in several species. The majority of the evidence indicates that exposure to lead via the oral route is associated with adverse neurodevelopmental effects and that the severity of these effects increases with the administered dose. Moreover, cessation of exposure was in most cases not associated with a reversal to a normal healthy state even long after exposure, suggesting that the neurodevelopmental effects of lead are permanent and persist into adulthood. There is, however, a possibility that lead remobilization from bone can occur at a later time following cessation of exposure and that this may be associated with the observed effects.
The most compelling evidence of adverse neurodevelopmental effects is from studies of non-human primates. At least 17 studies have investigated adverse neurobehavioural effects of lead exposure in non-human primates, with only one of these studies reporting primarily negative results (Laughlin et al., 1999). The studies that reported adverse effects at the lowest doses were done in cynomolgus monkeys orally exposed 5 days a week to lead acetate at 0, 50 or 100 µg/kg bw per day, from birth onwards. This resulted in peak BLLs of 3.5, 15.4 and 25.3 µg/dL, with subsequent steady-state BLLs of 2.9, 10.9 and 13.1 µg/dL for the 0, 50 and 100 µg/kg bw per day doses, respectively. The treated monkeys exhibited delays in learning specific tasks at the lowest exposure dose (BLLs 10.9–15.9 µg/dL) in a series of tests conducted between the ages of 3 and 10 years (Rice, 1984, 1985; Gilbert and Rice, 1987; Rice and Karpinski, 1988). When monkeys were exposed continuously or during infancy exclusively to lead acetate at 1.5 mg/kg bw per day, significant impairments on some of the neurobehavioural tests were found in both groups relative to controls at up to 9 years of age, with increased severity in the continuously exposed group. This provides some evidence that early-life exposure to lead can cause neurobehavioural effects that persist into adulthood, even after cessation of lead exposure (Rice, 1990, 1992b). Performance on a series of neurobehavioural tests was also affected in monkeys that were continuously exposed to high doses of lead (2000 µg/kg bw per day, resulting in a peak BLL of 115 µg/dL and steady-state BLL of 33 µg/dL), then assessed as infants, juveniles and adults (Rice, 1992a). The effects of BLLs below 10 µg/dL were not examined in non-human primates.
There is a large body of evidence for adverse neurodevelopmental effects in various rat strains. Prenatal and postnatal oral exposures to lead resulting in BLLs as low as 10 µg/dL have resulted in impaired ability to learn, as shown by poor performance on specific learning tasks, decreased memory, as shown by evasion of repeated stresses, such as shocks to the foot, and altered conduct, including changes in rearing behaviour (Cory-Slechta and Thompson, 1979; Cory-Slechta et al., 1981, 1983, 1985, 2013; Cory-Slechta, 1986; Chen et al., 1997, 2001; Gong and Evans, 1997; Morgan et al., 2000; Stangle et al., 2007). There is additional evidence of altered neurobehavioural effects in many other species. These include impaired learning and motor coordination in herring gull chicks (Burger and Gochfeld, 1997, 2005), impaired learning in prenatally exposed lambs (Carson et al., 1974), altered spatial exploration in offspring of paternally exposed rabbits (Nelson et al., 1997) and aggressive behaviour in offspring of maternally exposed mice (Donald et al., 1987).
Overall, there is sufficient evidence to conclude that prenatal and postnatal exposures to lead to adverse neurobehavioural effects in experimental animals of various species, including non-human primates. Data from many of the studies indicate significant interindividual variations, suggesting that individual animals can be especially vulnerable to the effects of lead, whereas others may be more tolerant. There is a lack of data to assess the effects of BLLs below 10 µg/dL in experimental animals. The lowest level of exposure associated with neurobehavioural effects in experimental animals cannot be clearly established.
9.3 Mode of action
Lead is known to disrupt numerous biological processes, which can induce several adverse effects. These include calcium mimicry, cell death, oxidative stress and interference with vital biochemical processes. As there is no unifying mechanism of lead toxicity, it is likely that several of these mechanisms operate in unison to induce the adverse effects observed upon chronic exposure. However, it should be noted that modes of action for the various adverse effects of lead are generally poorly understood.
Most of the known adverse health effects of lead, other than renal tumours, have been clearly established in human populations. As human relevance has already been strongly established for most endpoints, the mode of action information presented below is provided only to add to the weight of evidence for lead-induced toxicities. Modes of action have been examined for endpoints considered critical in this assessment (i.e., developmental neurotoxicity and cancer) as well as for increases in blood pressure, as a larger amount of information was available for this endpoint. Additional information pertaining to the relevance of renal tumours in humans is discussed briefly.
9.3.1 Neurodevelopmental effects
At this time, there is insufficient information to clearly establish the mode of action involved in reductions in IQ and other neurodevelopmental effects. However, there is evidence that developmental neurotoxicity may involve alterations in cellular functioning and signalling as well as direct damage to the brain and central nervous system, as reviewed in Lidsky and Schneider (2003).
Lead has been shown to interact with all cell types in the central nervous system and is known to induce cellular oxidative stress and cause apoptosis. Depletion of antioxidant enzymes was observed in mice following in utero exposure to lead (Wang et al., 2006). Moreover, neuronal apoptosis was observed in the developing mouse brain following two intraperitoneal injections of 350 mg/kg bw (Dribben et al., 2011). It is thus plausible that lead can cause direct tissue damage that may affect neurodevelopment and cognitive function.
However, lead can also induce an array of biochemical changes that can alter development or functioning of the central nervous system. Lead has long been known to alter cellular functioning by mimicry of calcium and zinc. Lead's ability to mimic calcium can cause disruption of Ca 2+ homeostasis and lead to the stimulation of kinases, cyclic adenosine monophosphate and phosphodiesterase, affecting the functioning of voltage-dependent calcium channels (Gu et al., 2005). Lead's ability to mimic calcium also enables it to cross the blood–brain barrier, thus reaching critical tissues associated with developmental neurotoxicity (Kerper and Hinkle, 1997a, 1997b). Alterations in calcium homeostasis are hypothesized to interfere with neurotransmitter synthesis, release, turnover and uptake (Lidsky and Schneider, 2003). Lead has been shown to alter the release of dopamine, γ-aminobutyric acid and other neurotransmitters (Lasley et al., 1999; Devoto et al., 2001) and causes alterations in synaptosomes (Regunathan and Sundaresan, 1985; Jablonska et al., 1994) and neurotransmitter receptors (McCoy et al., 1997; Lasley et al., 2001) capable of interfering with normal neurotransmission processes. However, these responses can be dose dependent, as low doses of lead have been shown to stimulate exocytosis of neurotransmitters (Bressler and Goldstein, 1991). Mimicry of zinc has also been shown to interfere with DNA binding of transcription factors, including Sp1, transcription factor IIIA and early growth response protein 1, with associated changes in gene expression (Zawia et al., 1998; Hanas et al., 1999; Reddy and Zawia, 2000; Zawia, 2003). It is unclear exactly how mimicry of calcium and zinc translates to adverse effects. However, critical processes involved in neurodevelopment, including cellular growth, differentiation and chromosome structure, are likely to be affected.
Other biochemical changes may also be involved in IQ decrements and other neurodevelopmental effects. Lead has been shown to affect long-term potentiation (LTP) by altering glutamate release, postsynaptic N-methyl-D-aspartate activation and neurogenesis. Prenatal and postnatal exposures of rats to lead were shown to increase the threshold for LTP induction, decrease the magnitude of LTP and accelerate LTP decay in specific hippocampal regions (Gilbert and Rice, 1987; Gutowski et al., 1997, 1998; Gilbert and Mack, 1998; Gilbert et al., 1999a, 1999b). In addition, lead may delay differentiation of glial progenitors and cause hypomyelination and demyelination in glial cells, adversely affecting their ability to support and protect neurons (Sauer et al., 1970; Coria et al., 1984; Deng et al., 2001). The hypothalamic–pituitary–adrenal axis, which can alter cognitive function through regulation of glucocorticoids, can also be significantly affected by lead. Prenatal and lactational exposures in rats have been shown to significantly alter blood corticosterone concentrations in adulthood (Cory-Slechta et al., 2004). Finally, there is evidence that lead may operate via an epigenetic mechanism. Early-life exposure to lead in monkeys and rats has been shown to increase brain gene expression of β-APP and production of associated proteins later in life (Basha et al., 2005; Wu et al., 2008). The effect occurred with a decrease in methyltransferase activity, suggesting that epigenetic demethylation of the APP promoter region may be responsible.
There is evidence that the neurodevelopmental effects of lead in children are persistent, as shown through lifetime studies in non-human primates and deficits in academic achievement and intelligence that extend at least until 17 years of age in humans. It is important to note that no threshold for this effect can be identified.
9.3.2 Cancer
The exact mechanisms linking lead to cancer are not well understood. In general, lead is not expected to induce direct DNA damage at levels that represent relevant environmental exposures. However, there is evidence to suggest that lead can cause indirect genotoxicity via oxidative stress and that lead may increase susceptibility to cancer via non-genotoxic mechanisms. Potential mechanisms have been described in Silbergeld et al. (2000) and Silbergeld (2003).
There is sufficient evidence to determine that lead causes genotoxicity and clastogenicity, as shown by induction of DNA strand breaks, micronuclei, chromosomal aberrations and sister chromatid exchanges in exposed cultured cells and experimental animals, as well as in leukocytes of occupationally exposed humans (see Section 9.2.4). Such genotoxic events are considered essential in the development of lead-induced cancers. At very high concentrations, lead can induce direct DNA damage via DNA cross-linking (Silbergeld, 2003). However, these doses were generally cytotoxic and much higher than those necessary to induce cancer (Silbergeld, 2003). Moreover, lead has been shown to induce renal tumours in the absence of any significant tissue damage (Waalkes et al., 1995). As such, direct genotoxicity is not likely to be associated with tumour formation observed in experimental animals. There is more substantive evidence, however, that indirect genotoxicity via oxidative stress may be responsible for damage to DNA at more relevant doses. Lead exposure at non-cytotoxic doses has been shown to result in glutathione depletion in rat liver (Daggett et al., 1998) and upregulation of glutathione S-transferase in rat kidney and liver (Columbano et al., 1988; Suzuki et al., 1996; Daggett et al., 1998), thus rendering cells more sensitive to oxidative stress. These responses are often accompanied by lipid peroxidation, as measured by increases in malondialdehyde (Daggett et al., 1998). In vitro, lead increases levels of hydrogen peroxide (Ariza et al., 1998). Like many other metals, there is evidence that lead can augment oxidative stress conditions by participating in Fenton reactions, in which hydrogen peroxide is converted to the more reactive superoxide radical. Cells treated with hydrogen peroxide and lead acetate alone did not exhibit substantive DNA damage. However, co-treatment of lead with hydrogen peroxide resulted in DNA nicks and strand breaks as well as oxidative stress–related DNA adducts, including 8-hydroxyguanine (Roy and Rossman, 1992; Yang et al., 1999). Therefore, lead-mediated Fenton reactions are likely to be responsible for lead-induced oxidative DNA damage.
There is some evidence to suggest that non-genotoxic modes of action may mediate lead-induced cancers. However, only limited information was available. In vitro, co-exposures to lead and ultraviolet radiation, hydrogen peroxide, X-rays and most chemical genotoxins have been shown to increase the DNA-damaging impact of these agents (Silbergeld, 2003). In animals, dietary co-exposure to lead and 2-acetylaminofluorene, N-ethyl-N-hydroxyethylnitrosamine or N-(4′-fluoro-4-biphenyl)acetamide resulted in an increased incidence of renal tumours in rats, and a study in humans suggests that exposure to lead increases lung cancer risk among smokers (Lustberg and Silbergeld, 2002; Healey, 2014). These data collectively suggest that lead may inhibit DNA repair mechanisms, making genetic material more vulnerable to damage from other sources. This may be due to lead's ability to substitute for zinc in zinc binding proteins, including DNA binding proteins, histones, protamines and transcription regulators. Lead binding to zinc binding proteins can also alter their conformational structure and function. The impact of lead on proteins can alter cellular signalling pathways, which may result in DNA repair inhibition, repair errors and other responses involved in the progression of cancer. Indeed, lead has been suggested to alter the expression of oncogenes and tumour suppressor genes (Silbergeld, 2003). There is also evidence that alterations in cellular signalling pathways may be affected by epigenetic changes to DNA (alterations in DNA methylation status) (Senut et al., 2014). Additional research will be needed to further elucidate the potential roles of these non-genotoxic modes of action in lead-induced carcinogenesis. There is some speculation that exposure to lead may lead to cancer by increasing cellular proliferation in specific tissues. However, this is thought to occur only at higher levels of exposure, and thus increased cellular proliferation leading to higher mutation frequencies is not likely to be involved in lead-induced cancers.
Compared with cancers at other sites (e.g., lung and brain), the development of renal tumours was most consistently observed in lead-exposed experimental animals and occurred at lower exposure doses. There are, however, questions surrounding the relevance of renal tumours in humans, considering that only a few studies have established a positive association between lead exposure and renal cancers and that these studies are limited by methodological issues, such as a lack of appropriate exposure monitoring and failure to consider confounding effects (Steenland et al., 1992; Pesch et al., 2000). It has been argued that only elevated cytotoxic doses may be responsible for the induction of renal tumours. However, renal proliferative lesions, including tubular cell carcinomas, have been shown to occur in male offspring of mice exposed to lead acetate in the absence of extensive chronic nephropathy and lead inclusion bodies (Waalkes et al., 1995). Moreover, the induction of α2u-globulin, leading to hyaline droplet nephropathy, a process commonly observed in chemical-exposed male rats, has been proposed as the main driver of renal tumours. However, as renal tumours also occur in male and female mice, which do not produce α2u-globulin, this mechanism leading to renal tumours is not relevant (Waalkes et al., 1995, 2004).
In conclusion, there are several plausible modes of action for lead-induced cancers. However, there is insufficient information available to clearly identify a single mode of action responsible for tumour induction. With the limited information available at this time, the default assumption is that the mechanisms leading to renal tumours in animals are plausible in humans.
9.3.3 Increases in blood pressure
Multiple biological mechanisms have been linked to the lead-induced increases in blood pressure observed in humans and experimental animals. These include oxidative stress, alterations in the levels of nitric oxide or nitric oxide signalling, as well as effects on the adrenergic and paracrine systems. These mechanisms are described thoroughly in Vaziri (2008) and are presented briefly below.
Deactivation, depletion or sequestration of nitric oxide, a vasodilator that plays a significant role in regulating blood pressure, is the most plausible mechanism leading to increases in blood pressure and hypertension. Lead-induced hypertension in rats exposed to 100 mg/L lead in drinking water has been shown to be accompanied by a reduction of available nitric oxide in plasma and increased urinary excretion of nitric oxide metabolites (Vaziri et al., 1997, 1999b; Dursun et al., 2005). This is likely due to a lead-related induction of oxidative stress. Induction of hypertension in rats exposed to 100 mg/L lead in drinking water is associated with increased plasma and tissue concentrations of malondialdehyde, a marker of lipid peroxidation, and increased concentrations of nitrotyrosine, a marker of nitric oxide oxidation (Gonick et al., 1997; Vaziri et al., 1999a; Attri et al., 2003). Moreover, lead-treated hypertensive rats demonstrate a compensatory upregulation of endothelial and inducible nitric oxide synthase (Gonick et al., 1997; Vaziri et al., 1997, 1999a, 2001), and treatment with antioxidants (e.g., vitamin E, vitamin C) has been reported to reduce blood pressure and increase nitric oxide availability (Vaziri et al., 1997, 1999b; Attri et al., 2003). Lead exposure is also attributed to changes in nitric oxide signalling. Exposure to lead through diet has been shown to lower cyclic guanosine monophosphate, an important molecule in nitric oxide–mediated vasodilation, in plasma and urine of rats (Khalil-Manesh et al., 1993). Furthermore, oxidative stress can initiate inflammatory responses that are known to contribute to the pathogenesis of hypertension.
There is also evidence that lead may affect the adrenergic system, either directly or through the oxidative stress–mediated effects on nitric oxide. Stimulation of the sympathetic nervous system can result in a "fight or flight" response, which is known to affect blood pressure. Occupationally exposed humans and exposed rats have been shown to exhibit increased plasma norepinephrine, which is associated with an increase in vascular tone (Chang et al., 1996; Tsao et al., 2000). Additional adrenergic effects related to blood pressure observed in rats include an increase in plasma catecholamines and reduced density of β-adrenergic receptors in vascular and cardiac tissues (Chang et al., 1997; Carmignani et al., 2000; Tsao et al., 2000). There is evidence that the adrenergic responses leading to vascular smooth muscle contraction may be mediated through protein kinase C (Watts et al., 1995).
Additional mechanisms associated with lead-induced increases in hypertension include altered levels of prostaglandins and endothelins, endothelial damage as well as inhibition of sodium–potassium adenosine triphosphate in erythrocyte membranes (Vaziri, 2008). Physiological stress has also been shown to act as an effect modifier in the relationship between BLLs and blood pressure effects in humans (see Section 9.1.2.2). It is likely that multiple mechanisms working simultaneously lead to the increases in blood pressure observed in exposed humans and experimental animals.
10.0 Classification and assessment
There is extensive evidence of an association between low BLLs and both adverse neurodevelopmental effects in children and increased blood pressure in adults, with data in experimental animals to support these outcomes of exposure. Furthermore, lead has been shown to induce tumours in experimental animals. Thus, both cancer and non-cancer risk assessments were conducted.
10.1 Cancer risk assessment
Inorganic lead compounds have been classified as probably carcinogenic to humans (Group 2A) by IARC (2006) and by the U.S. EPA (2004). This is based on conclusive evidence in experimental animals and suggestive evidence in humans (see Sections 9.1.2.4 and 9.2.3). As lead in drinking water is primarily found in the inorganic form, a cancer risk assessment was considered appropriate.
No human studies were suitable for deriving a health-based value (HBV). The two best animal studies available have been conducted in adult male mice chronically exposed to lead acetate (Waalkes et al., 2004) and in male and female offspring of female mice exposed to lead acetate during gestation and lactation (Waalkes et al., 1995) (see Section 9.2.3). BMD modelling using total renal adenomas and carcinomas as the endpoint of concern was employed to estimate the benchmark dose associated with a default 10% change in response (BMD10) and its 95% lower confidence limit (BMDL10) for each study. Of the two studies, the more conservative BMD10 and BMDL10 of 159.6 mg/kg bw per day and 103.8 mg/kg bw per day, respectively, were derived from renal tumours in male offspring in the Waalkes et al. (1995) study, using the best fit model (second-degree multi-stage cancer). The BMDL10 was used as our point of departure.
There are currently no PBPK models available to adequately estimate BLLs in mice following oral exposure to lead and corresponding internal and external doses in humans. As such, the point of departure was adjusted using allometric scaling, in order to more properly represent human exposures:
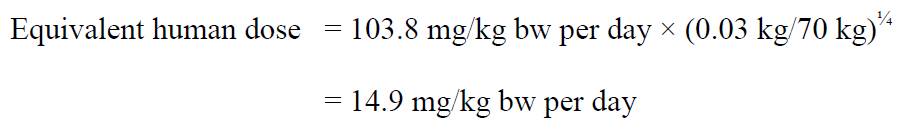
Text Description
The equivalent human dose is 14.9 mg/kg bw per day. This is calculated by multiplying the BMDL10 related to renal adenoma and carcinoma in lead acetate-exposed male mice (103.8 mg/kg bw per day) by the term (0.03 kg / 70 kg)1/4.
where:
- 103.8 mg/kg bw per day is the BMDL10 associated with renal adenoma and carcinoma in lead acetate–exposed male mice (Waalkes et al., 1995);
- 0.03 kg is the default average body weight of a mouse (Health Canada, 1994);
- 70 kg is the default average body weight of a human adult (Health Canada, 1994); and
- ¼ is the allometric scaling factor to account for toxicokinetic differences between mice and humans.
The mode of action of lead-induced carcinogenesis is poorly understood (see Section 9.3.2), and thus the default non-threshold approach for cancer endpoints was used. Using a benchmark response of 10%, the adjusted oral dose of 14.9 mg/kg bw per day would correspond to the dose associated with a 10−1 lifetime risk of cancer. Using a low-dose linear extrapolation, a slope factor of 0.0067 (mg/kg bw per day)−1 was calculated and used to determine the oral doses of 1.5 × 10⁻², 1.5 × 10⁻³ and 1.5 × 10⁻⁴ mg/kg bw per day, associated with respective risk levels of 10−4, 10−5 and 10−6. These oral doses can then be used to calculate corresponding concentrations in drinking water using the following equation:

Text Description
The concentrations in drinking water are calculated by multiplying the dose by the body weight. This product is then divided by the average daily intake of water.
where:
- the doses are 1.5 × 10⁻², 1.5 × 10⁻³ and 1.5 × 10⁻⁴ mg/kg bw per day, which are associated with a 10 −4, 10−5 and 10−6 lifetime risk of developing cancer, respectively;
- 70 kg is the average body weight for an adult (Health Canada, 1994); and
- 1.5 L is the daily water intake for an adult (Health Canada, 1994).
The concentrations corresponding to lifetime human cancer risks of 10 −4, 10−5 and 10−6 can be estimated as 700, 70 and 7 µg/L, respectively. An excess lifetime cancer risk of 10 −6 or below is used when intake from other sources is significant (Krishnan and Carrier, 2013). As there are other significant sources of exposure to lead (i.e., ambient air, indoor air, household dust, soil, food), the excess lifetime cancer risk of 10−6 was used to derive a concentration of 7 µg/L. However, it is not deemed appropriate to establish an HBV through this assessment, due to the following limitations:
- Although there is adequate information in experimental animals, epidemiological evidence is limited.
- The type of tumour observed in exposed animals has been reported in only a few occupational studies with known methodological limitations. The relevance of renal tumours to humans exposed to lead remains to be elucidated.
- A perinatal study (Waalkes et al., 1995) was used instead of a longer-term study in older animals because this provided a more conservative number. The exact implications of this are unknown.
- In addition, the effect in the Waalkes et al. (1995) study was subtle and required the pooling of adenomas and carcinomas together for the analysis. Consequently, there are some questions around whether or not a true effect was observed in the study.
Nevertheless, this assessment provides an indication of the levels at which cancer effects would become a consideration in the assessment of exposure to lead in drinking water.
10.2 Non-cancer risk assessment
BLLs below the current intervention level of 10 μg/dL have been associated with several adverse health effects in humans, including: reduced cognition in adults, especially seniors (see Section 9.1.2.1); increased systolic blood pressure in adults, especially in African Americans and postmenopausal women (see Section 9.1.2.2); decreased renal function, especially in diabetic and hypertensive individuals (see Section 9.1.2.3); reproductive effects, including delayed puberty and early menopause in women (see Section 9.1.3.1); and developmental neurotoxicity, including decreased intelligence and attention in infants and children (see Section 9.1.3.2). There is extensive evidence in experimental animals to support the observations made in humans (see Section 9.2). Of the endpoints considered, developmental neurotoxicity has been the most widely studied effect of lead exposure. The relationship between IQ and BLLs in school-aged children specifically was the most sensitive endpoint and can be characterized with greatest certainty due to the large database of relevant information. Effects on IQ represent an important social determinant of health, as lowered IQ in children has been conclusively linked to poorer academic achievement and earning potential later in life (Herrnstein and Murray, 1994; Schwartz, 1994b; Nevin et al., 2000; Gross et al., 2002; Health Canada, 2013a). Given the strong weight of evidence for lead-induced decreases in IQ and the lack of a known threshold of toxicity for this endpoint, IQ loss in children was selected as the critical health effect on which to base the non-cancer risk assessment.
The loss of IQ points is not expected to be distributed equally across the population, due to inter-individual variability in intellectual functioning. Variances in IQ within the population follow a normal distribution, in which an IQ of 100 represents average intelligence and approximately 2% of the population exhibits an intellectual disability (see Figure 10.1). A mild intellectual disability (MID) is defined as having an IQ of 70 ± 5 points, among other diagnostic criteria, and is characterized by delayed learning as well as cognitive and behavioral problems that can greatly affect an individual's quality of life (American Psychiatric Association, 2013). By decreasing the average population IQ even slightly, the number of children expected to be diagnosed with a MID will increase and children with an existing disability may exhibit more significant intellectual impairments. This assessment focuses on increased cases of children with a MID due to small population shifts in IQ associated with exposure to lead through drinking water. Population decreases of 1 IQ point or 1% shift in population IQ levels are associated with significant impacts on society and was determined to be the most appropriate benchmark response by international authorities including the European Food Safety Authority (EFSA, 2013) and the Joint FAO/WHO Expert Committee on Food Additives (JECFA, 2011).
Figure 1. Normal distribution of IQ presented as frequency within the population vs. IQ score (modified from Weiss, 1988). The hashed line section under the curve represents the 2.27% of the population with an intellectual disability.
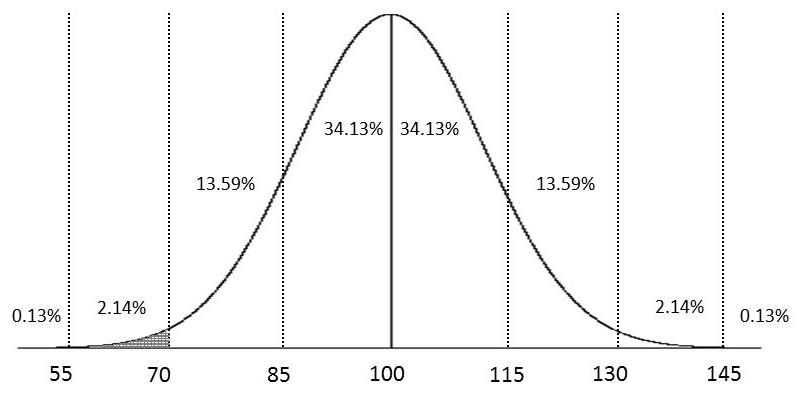
Text Description
A graph shows the normal distribution of IQ scores presented as a frequency within the population, with the vertical axis as % of population vs. IQ score as the horizontal axis. The average IQ of 100 is at the mid-point of the horizontal axis and aligns with the peak of the curve. The curve shows equivalent proportions of the population below (left) and above (right) the mid-point IQ score of 100, respectively. The proportions of the population shown are: 34.13% (IQ of 85 – 100) and 34.13% (IQ of 100 – 115), 13.59% (IQ of 70 – 85) and 13.59% (IQ of 115 – 130), 2.14% (IQ of 55-70) and 2.14% (IQ of 130 – 145) and 0.13% (IQ below 55) and 0.13% (IQ above 145). The area under the curve and to the left of IQ 70 is shaded, depicting 2.27% (2.14% plus 0.13%) of the population.
The critical study selected for this assessment consists of an analysis of pooled data from seven longitudinal prospective studies initiated prior to 1995, which followed children from birth or infancy until 5–10 years of age (Lanphear et al., 2005). The study involved 1333 children from Boston, Massachusetts, Cincinnati and Cleveland, Ohio, Rochester, New York, Mexico City, Mexico, Port Pirie, Australia, and Kosovo, Yugoslavia. Of the existing studies on IQ decrements in children (see Section 9.1.3.2), the meta-analysis performed by Lanphear et al. (2005) has the highest number of individuals and diversity of subjects. Full-scale IQ was assessed using age- and language-appropriate versions of the Wechsler Intelligence Scales for Children. Ten covariates were examined overall and were available for most subjects, including maternal IQ, education, marital status, prenatal alcohol use, prenatal tobacco use, HOME inventory score, sex, birth order, birth weight and ethnicity. Four blood lead indices were used in the analysis: (1) concurrent BLL (closest to testing), (2) maximum BLL, (3) lifetime average BLL and (4) early-childhood BLL (mean BLL from 6 months to 2 years of age). Concurrent BLL was selected by Lanphear et al. (2005) as the primary lead exposure index because it exhibited the strongest relationship with IQ; in a comparative analysis of the coefficients of determination (R2) of the linear regression models for each of the blood lead indices, concurrent blood lead was observed to explain the greatest variance in IQ. Health Canada agrees with the choice of concurrent BLL as the dose metric for further analysis.
Individual data from concurrent BLLs of the Lanphear et al. (2005) study have been acquired by EFSA (2013) and by JECFA (2011) to establish BMDs associated with a 1% change on human intellectual function. Overall, EFSA provided extensive detail pertaining to its BMD analyses with thorough justification for the choice of the piece-wise linear model as the best fit model associated with the least uncertainty (EFSA, 2013; Budtz-Jorgensen et al., 2010). Thus, the BMDL01 of 1.2 μg/dL associated with a benchmark response of 1 IQ point was used to estimate the corresponding oral dose.
In order to determine corresponding external oral doses associated with exposure from drinking water, PBPK modelling was done using all three of the available models (i.e., IEUBK, Leggett, and O'Flaherty) (see Section 8.5). Equivalent oral administered doses for a five year old child were determined to be 0.4, 0.2 and 0.8 μg/kg bw per day for the IEUBK, Leggett and O'Flaherty models, respectively. Because the Leggett model has been shown to overestimate BLLs at lower exposures (Pounds and Leggett, 1998), it was not considered any further in our analysis. The IEUBK model, however, was considered to be an excellent model, as it is specific to children and has been more extensively validated than other models; the external oral dose of 0.4 μg/kg bw per day (or 0.0004 mg/kg bw per day) was thus used as a point of departure in this assessment and corresponds to the external oral dose associated with the average loss of 1 IQ point.
At the population level, the average loss of 1 IQ point, or an approximate change of 1% in human intellectual functioning, is associated with significant public health implications. These include substantive increases in cases of children with a MID, increased severity of existing intellectual disabilities and decreases in "gifted" children, as well as impacts on socioeconomic status and productivity in general (EFSA, 2013; Health Canada, 2013a). As discussed in section 9.1.3.2, lead exposure significantly affects IQ even at very low BLLs and the lowest BLL associated with adverse neurodevelopmental effects in children has not been identified (section 9.1.3.2). Moreover, data suggest that the damage caused by lead at very low doses is completely, or at the very least mostly, irreversible (WHO, 2010). For these reasons, it was determined appropriate to calculate a slope factor. A slope factor of 2500 (mg/kg bw/day) -1 was derived by dividing the benchmark response by the external oral dose of 0.0004 mg/kg bw/day.
The average loss of intelligence associated with various drinking water concentrations of lead can be calculated using the following equation:

Text Description
Average IQ loss is calculated by multiplying the concentration in drinking water by the daily water intake, then dividing this product by the body weight. This result is then multiplied by the slope factor.
Where:
- 0.9 L is the daily water intake for children 5-11 years of age (Health Canada, 1994)
- 18.2 kg is the average body weight for a 5-year-old child, as determined using data from the IEUBK PBPK model (U.S. EPA, 1994a, 1994b; White et al., 1998); and
- 2500 (mg/kg bw per day)-1 is the slope factor
The standardized normal distribution of IQ presented in Figure 10.1 is used as a reference for variances in intelligence across the Canadian population. The anticipated average IQ loss associated with various drinking water concentrations of lead is used to estimate the corresponding proportion of individuals with IQ scores expected to drop below 70 IQ points and hence to estimate the resulting additional cases of children with an intellectual disability above background (Health Canada, 2017), as provided in Table 2.
| DW concentration (µg/L) | % children expected to develop an MIDTable 2 Footnote a | Estimated increase in number of children expected to develop an MIDTable 2 Footnote a |
|---|---|---|
| 0.1 | 0.004 | 5 in 100,000 |
| 1.0 | 0.045 | 5 in 10,000 |
| 3.0 | 0.137 | 1 in 1,000 |
| 5.0 | 0.232 | 2 in 1,000 |
| 10.0 | 0.483 | 5 in 1,000 |
| ||
The consensus in the scientific literature is that a safe level of exposure to lead in children has not been identified. The estimates presented above provide an indication of cases of intellectual disabilities in children above background associated with the respective levels of lead in drinking water in order to inform risk assessment and/or risk management decisions. Although this assessment focuses on intellectual disabilities in a sensitive sub-set of the population (i.e., children with a borderline MID), it should be noted that there are significant health and socioeconomic implications of even small generalized losses in IQ regardless of intellectual functioning (Health Canada, 2013a). Moreover, this assessment focuses on children as the most sensitive population but it should be noted that reduced intellectual functioning, among other health effects, is expected to occur in all age groups at low levels of exposure.
10.3 Comparison of cancer and non-cancer risk assessments
Although both the cancer and non-cancer risk assessments are not deemed appropriate to allow the calculation of an HBV for lead in drinking water, they provide an indication of the levels at which these effects would become a consideration in the assessment of exposure to lead in drinking water.
Neurodevelopmental effects were found to be associated with much lower concentrations in drinking water than cancer effects.
10.4 International considerations
This section presents the various drinking water guidelines and standards from international organizations. Variations in these limits can be attributed to the age of the assessments or to differing policies and approaches, including the choice of key study and the use of different consumption rates, body weights and allocation factors.
The U.S. EPA regulates levels of lead through the Lead and Copper Rule (U.S. EPA, 1991, 2000), a treatment based rule, which established an action level of 0.015 mg/L (15 µg/L) for lead in drinking water. The U.S. EPA has not established a maximum contaminant level for lead in drinking water, but has a maximum contaminant level goal of zero (U.S. EPA, 2014b). Large water systems (with more than 50 000 connections), unless determined to be non-corrosive, are required to install "optimal corrosion control treatment" and meet specified water quality operating limits requirements. If the 90th percentile of lead concentrations in samples taken at customer taps at sites distributed with a specified prioritization (first-draw samples that have stagnated for at least 6 hours) exceeds the action level of 0.015 mg/L, the system must undertake a number of additional actions to control corrosion and provide public education. The number of sites, frequency of monitoring and scope of required actions vary with system size. Currently, a major revision of the Lead and Copper Rule is under way, but is not expected to be finalized until after 2019.
WHO reviewed the drinking water guideline value for lead in 2011and updated it in 2016, maintaining it at 10 µg/L. The guideline value is considered provisional on the basis of treatment performance and analytical achievability (WHO, 2011, 2017). In the past, HBVs for lead for organizations such as WHO were based on the provisional tolerable weekly intake (PTWI) of 0.025 mg/kg bw developed by JECFA. However, in 2011, JECFA reviewed the lead data and withdrew the PTWI, as JECFA concluded that it was not possible to establish a PTWI that would be considered health protective (JECFA, 2011).
In 2018, the European Union (EU) adopted the proposed revisions to the EU Drinking Water Directive for lead, reducing the parametric value for lead to 5 µg/L (sampled at the tap). This reduction was based on the WHO recommendation that concentrations should be as low as reasonably practical. The new value will be implemented over a period of 10 years beginning after the Directive is finalized. However, the current value of 10 µg/L will be maintained during the transitional period (European Union 2015, 2018).
In Australia, the National Health and Medical Research Council established a drinking water guideline of 0.01 mg/L (10 µg/L) for lead (NHMRC, 2011).
The California Environmental Protection Agency (OEHHA, 2009) established a public health goal of 0.2 ppb (µg/L) for lead in drinking water on the basis of new studies relating neurobehavioural deficits to lower lead concentrations in the blood than previously reported. The public health goal was calculated using a lower level of concern of 2.86 μg/day, primarily based on the review and slope factor work done by Carlisle and Dowling (2006) and their analysis of Lanphear et al. (2005) (OEHHA, 2007), using a relative source contribution of 0.2, an uncertainty factor of 3 and a drinking water consumption rate for a child of 1 L/day. The California Department of Public Health (OEHHA, 2009) established an action level of 15 ppb for lead in drinking water in 1995 based on the U.S. EPA (1991) action level.
11.0 Rationale
Lead is ubiquitous in our environment. With significant reductions of lead in consumer products such as paints and gasoline over the past several years, food and water are now more important sources of exposure to lead. Its presence in drinking water varies greatly and is more likely in older homes and neighbourhoods, built when lead-containing materials were routinely used in distribution and plumbing systems.
The toxicity of lead has been extensively documented in humans using blood lead indices as a measure of exposure. Epidemiological studies suggest a wide array of toxicity endpoints, including reduced cognition, increased blood pressure and renal dysfunction in adults, as well as adverse neurodevelopmental and behavioural effects in children. The strongest association observed to date is between increased BLLs in children and reductions in IQ scores. The threshold below which lead is no longer associated with adverse neurodevelopmental effects cannot be identified.
Data in experimental animals corroborate findings in humans and also suggest a risk of cancer from exposure to inorganic lead. Based on findings in animals, the International Agency for Research on Cancer (IARC) has classified inorganic lead compounds as probably carcinogenic to humans (Group 2A). However, a guideline based on decreased IQ would be more conservative and considered protective for all cancer- and non-cancer-related effects of exposure to lead. Lead in drinking water is not a concern by inhalation or dermal absorption, so a multi-route exposure assessment was not performed.
A MAC of 0.005 mg/L (5 µg/L) is established for lead in drinking water, based on the following considerations:
- The MAC must be measurable. The U.S. EPA has established a PQL of 0.005 mg/L, based on the ability of laboratories to measure lead within reasonable limits of precision and accuracy using approved methods. There is no similar process in place to establish a PQL specific to Canada. However, in Canada, analytical methods are available to reliably measure total lead in drinking water below the MAC.
- The MAC must be achievable at reasonable cost. Municipal-scale treatment technologies can remove lead from drinking water; however, lead is mostly present in drinking water from leaching in the distribution and plumbing systems. Consequently, strategies for minimizing lead at the tap should focus on controlling corrosion and removing lead-containing components. The use of materials certified to the appropriate NSF/ANSI standards, such as Standard 61 (Drinking Water System Components—Health Effects) and Standard 372 (Drinking Water System Components—Lead Content), will help reduce the concentration of lead at the tap.
- The MAC will have a significant impact on the BLLs of children, the most vulnerable population. It is estimated that reducing the MAC from 0.01 to 0.005 mg/L would lower the geometric mean percentage of children with BLLs exceeding 5 µg/dL by 7.2 percentage points (from 9.4% to 2.2%).
- As the primary source of lead in drinking water is the leaching from plumbing and distribution system components, a private residential drinking water treatment device, certified to the appropriate NSF/ANSI standard, is the best option for reducing lead concentrations in drinking water at the tap. However, the use of such devices should not be considered a permanent solution.
In considering both treatment and analytical achievability and the health risks associated with exposure to lead from drinking water, the Federal-Provincial-Territorial Committee on Drinking Water has established a MAC of 0.005 mg/L (5 µg/L) for total lead in drinking water, based on a sample of water taken at the consumer's tap, using the appropriate protocol for the type of building being sampled. As this value exceeds the drinking water concentration associated with neurodevelopmental effects in children, every effort should be made to maintain lead levels in drinking water as low as reasonably achievable (or ALARA).
As part of its ongoing guideline review process, Health Canada will continue to monitor new research in this area and recommend any change to the guideline that is deemed necessary.
12.0 References
- Ades, A.E. and Kazantzis, G. (1988). Lung cancer in a non-ferrous smelter: the role of cadmium. Br. J. Ind. Med., 45(7): 435–442.
- Åkesson, A., Lundh, T., Vahter, M., Bjellerup, P., Lidfeldt, J., Nerbrand, C., Samsioe, G., Strömberg, U. and Skerfving, S. (2005). Tubular and glomerular kidney effects in Swedish women with low environmental cadmium exposure. Environ. Health Perspect., 113(11): 1627–1631.
- Alberta Department of Environment and Sustainable Resource Development (2011). Personal communication with D. Reid.
- Alexander, B.H., Checkoway, H., van Netten, C., Muller, C.H., Ewers, T.G., Kaufman, J.D., Mueller, B.A., Vaughan, T.L. and Faustman, E.M. (1996). Semen quality of men employed at a lead smelter. Occup. Environ. Med., 53(6): 411–416.
- Alexander, F.W. (1974). The uptake of lead by children in differing environments. Environ. Health Perspect., 7: 155–159.
- Al-Saleh, I., Nester, M., Devol, E., Shinwari, N., Munchari, L. and Al-Shahria, S. (2001). Relationships between blood lead concentrations, intelligence, and academic achievement of Saudi Arabian schoolgirls. Int. J. Hyg. Environ. Health, 204(2–3): 165–174.
- Ambrose, T.M., Al-Lozi, M. and Scott, M.G. (2000). Bone lead concentrations assessed by in vivo X-ray fluorescence. Clin. Chem., 46(8 Pt. 1): 1171–1178.
- American Psychiatric Association (2013). Diagnostic and statistical manual of mental disorders, fifth edition (DSM 5). Neurodevelopmental Disorders. Washington, DC.
- Anjou Recherche (1994). Étude des phénomènes de solubilisation du plomb par l'eau distribuée et des moyens pour les limiter. Rapport de synthèse. Paris, France.
- Anttila, A., Heikkila, P., Pukkala, E., Nykyri, E., Kauppinen, T., Hernberg, S. and Hemminki, K. (1995). Excess lung cancer among workers exposed to lead. Scand. J. Work Environ. Health, 21(6): 460–469.
- APHA, AWWA and WEF (2005). Standard methods for the examination of water and wastewater. 21st edition. American Public Health Association, American Water Works Association and Water Environment Federation, Washington, D.C.
- APHA, AWWA and WEF (2012). Standard methods for the examination of water and wastewater. 22nd edition. American Public Health Association, American Water Works Association and Water Environment Federation, Washington, D.C.
- Aqua Terre Solutions Inc. (2009). Soil and groundwater sampling, Lakeshore Boulevard East, Toronto, Ontario. Prepared for City of Toronto, Toronto, Ontario.
- Araki, S., Murata, K. and Aono, H. (1987). Central and peripheral nervous system dysfunction in workers exposed to lead, zinc and copper. A follow-up study of visual and somatosensory evoked potentials. Int. Arch. Occup. Environ. Health, 59(2): 177–187.
- Ariza, M.E. and Williams, M.V. (1999). Lead and mercury mutagenesis: type of mutation dependent upon metal concentration. J. Biochem. Mol. Toxicol., 13(2): 107–112.
- Ariza, M.E., Bijur, G.N. and Williams, M.V. (1998). Lead and mercury mutagenesis: role of H2O2, superoxide dismutase, and xanthine oxidase. Environ. Mol. Mutagen., 31(4): 352–361.
- Arnvig, E., Grandjean, P. and Beckmann, J. (1980). Neurotoxic effects of heavy lead exposure determined with psychological tests. Toxicol. Lett., 5(6): 399–404.
- ASTM (1996). Standard test methods for lead in water D3559-96. In: 1996 Annual book of ASTM standards. Vol. 11.01. ASTM International, West Conshohocken, Pennsylvania.
- ASTM (2003). Standard test methods for lead in water D3559-03. In: 2003 Annual book of ASTM standards. Vol. 11.01. ASTM International, West Conshohocken, Pennsylvania.
- ATSDR (1999). Toxicological profile for lead. Agency for Toxic Substances and Disease Registry, Public Health Service, U.S. Department of Health and Human Services, Atlanta, Georgia.
- ATSDR (2007). Toxicological profile for lead. Agency for Toxic Substances and Disease Registry, Public Health Service, U.S. Department of Health and Human Services, Atlanta, Georgia. Available at: www.atsdr.cdc.gov/ToxProfiles/tp13.pdf
- Attri, J., Dhawan, V., Mahmood, S., Pandhi, P., Parwana, H.K. and Nath, R. (2003). Effect of vitamin C supplementation on oxidative DNA damage in an experimental model of lead-induced hypertension. Ann. Nutr. Metab., 47(6): 294–301.
- Awad El Karim, M.A., Hamed, S., Elhaimi, Y.A.A. and Osman, Y. (1986). Effects of exposure to lead among lead-acid battery factory workers in Sudan. Arch. Environ. Health, 41(4): 261–265.
- AwwaRF (1990). Lead control strategies. AWWA Research Foundation and American Water Works Association, Denver, Colorado.
- Azar, A., Trochimowicz, H. and Maxfield, M. (1972). Review of lead studies in animals carried out at Haskell laboratory—two year feeding study and response to hemorrhage study. In: Environmental health aspects of lead: proceedings of an international symposium, October 2–6, 1972. Commission of European Communities, Luxembourg.
- Baghurst, P.A., McMichael, A.J., Wigg, N.R., Vimpani, G.V., Robertson, E.F., Roberts, R.J. and Tong, S.L. (1992). Environmental exposure to lead and children's intelligence at the age of seven years—the Port Pirie cohort study. N. Engl. J. Med., 327(18): 1279–1284.
- Bailey, R.J. and Russell, P.F. (1981). Predicting drinking water lead levels. Sci. Technol. Lett., 2: 57–66.
- Bailey, R.J., Holmes, D., Jolly, P.K. and Lacey, R.F. (1986). Lead concentration and stagnation time in water drawn through lead domestic pipes. Water Research Centre, Medmenham, UK (Environment Report TR 243).
- Baker, E.L., Jr., Landrigan, P.J., Barbour, A.G., Cox, D.H., Folland, D.S., Ligo, R.N. and Throckmorton, J. (1979). Occupational lead poisoning in the United States: clinical and biochemical findings related to blood lead levels. Br. J. Ind. Med., 36(4): 314–322.
- Baker, E.L., Feldman, R.G., White, R.F. and Harley, J.P. (1983). The role of occupational lead exposure in the genesis of psychiatric and behavioral disturbances. Acta Psychiatr. Scand. Suppl., 303: 38–48.
- Baló, J., Bajtai, A. and Szende, B. (1965). [Experimental adenomas of the kidney produced by chronic administration of lead phosphate.] Skagyar Onkol., 9: 144–151 (in Hungarian) [cited in IARC, 2006].
- Baloh, R.W., Spivey, G.H., Brown, C.P., Morgan, D., Campion, D.S., Browdy, B.L., Valentine, J.L., Gonick, H.C., Massey, F.J., Jr. and Culver, B.D. (1979). Subclinical effects of chronic increased lead absorption—a prospective study. II. Results of baseline neurologic testing. J. Occup. Med., 21(7): 490–496.
- Baron, J. (1997). La mesure du plomb au robinet de l'usager. Étude des méthodes d'échantillonage. Tech. Sci. Meth. Gen. Urbain Gen. Rural, 92(5): 47–54.
- Baron, J. (2001). Monitoring strategy for lead in drinking water at consumer's tap: field experiments in France. Water Sci. Technol. Water Supply, 1(4): 193–200.
- Barratt, C.L.R., Davies, A.G., Bansal, M.R. and Williams, M.E. (1989). The effects of lead on the male rat reproductive system. Andrologia, 21(2): 161–166.
- Barry, P.S. (1975). A comparison of concentrations of lead in human tissues. Br. J. Ind. Med., 32(2): 119–139.
- Barry, P.S. and Mossman, D.B. (1970). Lead concentrations in human tissues. Br. J. Ind. Med., 27(4): 339–351.
- Basha, M.R., Wei, W., Bakheet, S.A., Benitez, N., Siddiqi, H.K., Ge, Y.W., Lahiri, D.K. and Zawia, N.H. (2005). The fetal basis of amyloidogenesis: exposure to lead and latent overexpression of amyloid precursor protein and β-amyloid in the aging brain. J. Neurosci., 25(4): 823–829.
- Beauchemin, S., MacLean, J.C.W. and Rasmussen, P.E. (2011). Lead speciation in indoor dust: A case study to assess old paint contribution in a Canadian urban house. Environ. Geochem. Health, 33(4): 343–352.
- Bell, T., Campbell, S., Liverman, D.G.E., Allison, D. and Sylvester, P. (2010). Environmental and potential human health legacies of non-industrial sources of lead in a Canadian urban landscape—the case study of St John's, Newfoundland. Int. Geol. Rev., 52(7–8): 771–800.
- Bell, T., Allison, D.J., David, J., Foley, R., Kawaja, M., Mackey, S., Parewick, K., Pickard, F., Stares, J. and Valcour, J. (2011). Biomonitoring for environmental lead exposure in children from pre-1970s housing in St. John's, Newfoundland and Labrador. Memorial University of Newfoundland, Eastern Health and Health Canada, St. John's, Newfoundland and Labrador.
- Bellinger, D.C., Stiles, K.M. and Needleman, H.L. (1992). Low-level lead exposure, intelligence and academic achievement: a long-term follow-up study. Pediatrics, 90(6): 855–861.
- Bellinger, D., Hu, H., Titlebaum, L. and Needleman, H.L. (1994a). Attentional correlates of dentin and bone lead levels in adolescents. Arch. Environ. Health, 49(2): 98–105.
- Bellinger, D., Leviton, A., Allred, E. and Rabinowitz, M. (1994b). Pre- and postnatal lead exposure and behavior problems in school-aged children. Environ. Res., 66(1): 12–30.
- Bergdahl, I.A., Grubb, A., Schütz, A., Desnick, R.J., Wetmur, J.G., Sassa, S. and Skerfving, S. (1997). Lead binding to d-aminolevulinic acid dehydratase (ALAD) in human erythrocytes. Pharmacol. Toxicol., 81(4): 153–158.
- Bergdahl, I.A., Vahter, M., Counter, S.A., Schütz, A., Buchanan, L.H., Ortega, F., Laurell, G. and Skerfving, S. (1999). Lead in plasma and whole blood from lead-exposed children. Environ. Res., 80(1): 25–33.
- Birden, H.H., Calabrese, E.J. and Stoddard, A. (1985). Lead dissolution from soldered joints. J. Am. Water Works Assoc., 77(11): 66–70.
- Blake, K.C.H. (1976). Absorption of 203Pb from gastrointestinal tract of man. Environ. Res., 11(1): 1–4.
- Blake, K.C.H. and Mann, M. (1983). Effect of calcium and phosphorus on the gastrointestinal absorption of 203Pb in man. Environ. Res., 30(1): 188–194.
- Blake, K.C.H., Barbezat, G.O. and Mann, M. (1983). Effect of dietary constituents on the gastrointestinal absorption of 203Pb in man. Environ. Res., 30(1): 182–187.
- Bleecker, M.L., Ford, D.P., Lindgren, K.N., Hoese, V.M., Walsh, K.S. and Vaughan, C.G. (2005). Differential effects of lead exposure on components of verbal memory. Occup. Environ. Med., 62(3): 181–187.
- Boffardi, B.P. (1988). Lead in drinking water—causes and cures. Public Works, 119(11): 67–70.
- Boffardi, B.P. (1990). Minimization of lead corrosion in drinking water. Mater. Perform., 29(8): 45–49.
- Bolanowska, W., Piotrowski, J. and Garczynski, H. (1967). Triethyllead in the biological material in cases of acute tetraethyllead poisoning. Archiv. Toxikol., 22(4): 278–282.
- Borja-Aburto, V.H., Hertz-Picciotto, I., Lopez, M.R., Farias, P., Rios, C. and Blanco, J. (1999). Blood lead levels measured prospectively and risk of spontaneous abortion. Am. J. Epidemiol., 150(6): 590–597.
- Bouchard, M.F., Bellinger, D.C., Weuve, J., Matthews-Bellinger, J., Gilman, S.E., Wright, R.O., Schwarz, J. and Weisskopf, M.G. (2009). Blood lead levels and major depressive disorder, panic disorder, and generalized anxiety disorder in US young adults. Arch. Gen. Psychiatry, 66(12): 1313–1319.
- Boucher, O., Burden, M.J., Muckle, G., Saint-Amour, D., Ayotte, P., Dewailly, E., Nelson, C.A., Jacobson, S.W. and Jacobson, J.L. (2012). Response inhibition and error monitoring during a visual go/no-go task in Inuit children exposed to lead, polychlorinated biphenyls, and methylmercury. Environ. Health Perspect., 120(4): 608–615.
- Bowers, T.S. and Mattuck, R.L. (2001). Further comparisons of empirical and epidemiological data with predictions of the Integrated Exposure Uptake Biokinetic Model for Lead in Children. Hum. Ecol. Risk Assess., 7(6): 1699–1713.
- Bowman, C. and Bobrowsky, P.T. (2003). Health and the urban geochemical environment, Victoria, BC. In: Proceedings of the International Symposium on Environmental Geochemistry, Edinburgh, UK. p. 140 [cited in Bell et al., 2010].
- Boyd, G.R., Pierson, G.L., Kirmeyer, G.J. and English, R.J. (2008a). Lead variability testing in Seattle public schools. J. Am. Water Works Assoc., 100(2): 53–64.
- Boyd, G.R., Pierson, G.L., Kirmeyer, G.J., Britton, M.D. and English, R.J. (2008b). Lead release from new end-use plumbing components in Seattle public schools. J. Am. Water Works Assoc., 100(3): 105–114.
- Boyd, G.R., McFadden, M.S., Reiber, S.H., Sandvig, A.M., Korshin, G.V., Giani, R. and Frenkel, A.I. (2010). Effects of changing disinfectants on distribution system lead and copper release: Part 2—research results. Water Research Foundation, Denver, Colorado.
- Boyd, G.R., Reiber, S.H., McFadden, M.S. and Korshin, G.V. (2012). Effects of changing water quality on galvanic coupling. J. Am. Water Works Assoc., 104(3): E136–E149.
- Boyland, E., Dukes, C.E., Grover, P.L. and Mitchley, B.C. (1962). The induction of renal tumors by feeding lead acetate to rats. Br. J. Cancer, 16: 283–288.
- Braun, J.M., Kahn, R.S., Froehlich, T., Auinger, P. and Lanphear, B.P. (2006). Exposures to environmental toxicants and attention deficit hyperactivity disorder in U.S. children. Environ. Health Perspect., 114(12): 1904–1909.
- Bress, W.C. and Bidanset, J.H. (1991). Percutaneous in vivo and in vitro absorption of lead. Vet. Hum. Toxicol., 33(3): 212–214.
- Bressler, J.P. and Goldstein, G.W. (1991). Mechanisms of lead neurotoxicity. Biochem. Pharmacol., 41(4): 479–484.
- Britton, A. and Richards, W.N. (1981). Factors influencing plumbosolvency in Scotland. J. Inst. Water Eng. Sci., 35(4): 349–364.
- Brown, M.J., Raymond, J., Homa, D., Kennedy, C. and Sinks, T. (2011). Association between children's blood lead levels, lead service lines,and water disinfection, Washington, DC, 1998–2006. Environ. Res., 111(1): 67–74.
- Brubaker, C.J., Schmithorst, V.J., Haynes, E.N., Dietrich, K.N., Egelhoff, J.C., Lindquist, D.M., Lanphear, B.P. and Cecil, K.M. (2009). Altered myelination and axonal integrity in adults with childhood lead exposure: a diffusion tensor imaging study. Neurotoxicology, 30(6): 867–875.
- Bryant, S.D. (2004). Lead contaminated drinking waters in the public schools of Philadelphia. J. Toxicol., 42(3): 287–294.
- Budtz-Jorgensen, E., Bellinger, D., Lanphear, B. and Grandjean, P. (2013). An international pooled analysis for obtaining a benchmark dose for environmental lead exposure in children. Risk Anal., 33(3): 450–461.
- Burger, J. and Gochfeld, M. (1997). Lead and neurobehavioral development in gulls: a model for understanding effects in the laboratory and the field. Neurotoxicology, 18(2): 495–506.
- Burger, J. and Gochfeld, M. (2005). Effects of lead on learning in herring gulls: an avian wildlife model for neurobehavioral deficits. Neurotoxicology, 26(4): 615–624.
- Burlingame, G.A., Schock, M.R. and Edwards, M.A. (2006). Knowing chemistry can help get the lead out. Opflow, 32(9): 24–26.
- Bushnik, T., Haines, D., Levallois, P., Levesque, J., Van Oostdam, J. and Viau, C. (2010). Lead and bisphenol A concentrations in the Canadian population. Health Analysis Division, Statistics Canada, Ottawa, Ontario (Health Reports, 21(3); Statistics Canada Catalogue No. 82-003-XPE). Available at: www.statcan.gc.ca/pub/82-003-x/2010003/article/11324-eng.htm
- Camara, E., Montreuil, K.R., Knowles, A.K. and Gagnon, G.A. (2013). Role of the water main in lead service line replacement:a utility case study. J. Am. Water Works Assoc., 105(8): E423–E431.
- Campara, P., D'Andrea, F., Micciolo, R., Savonitto, C., Tansella, M. and Zimmermann-Tansella, C. (1984). Psychological performance of workers with blood-lead concentration below the current threshold limit value. Int. Arch. Occup. Environ. Health, 53(3): 233–246.
- Canfield, R.L., Henderson, C.R., Jr., Cory-Slechta, D.A., Cox, C., Jusko, T.A. and Lanphear, B. (2003a). Intellectual impairment in children with blood lead concentrations below 10 µg per deciliter. N. Engl. J. Med., 348(16): 1517–1526.
- Canfield, R.L., Kreher, D.A., Cornwell, C. and Henderson, C.R., Jr. (2003b). Low-level lead exposure, executive functioning, and learning in early childhood. Child Neuropsychol., 9(1): 35–53.
- Canfield, R.L., Gendle, M.H. and Cory-Sletcha, D.A. (2004). Impaired neuropsychological functioning in lead-exposed children. Dev. Neuropsychol., 25(1): 513–540.
- Cantonwine, D., Hu, H., Sánchez, B.N., Lamadrid-Figueroa, H., Smith, D., Ettinger, A.S., Mercado-García, A., Hernández-Avila, M., Wright, R.O. and Téllez-Rojo, M.M. (2010). Critical windows of fetal lead exposure: adverse impacts on length of gestation and risk of premature delivery. J. Occup. Environ. Med., 52(11): 1106–1111.
- Cardew, P. (2000). Simulation of lead compliance data. Water Res., 34(8): 2241–2252.
- Cardew, P. (2003). A method for assessing the effect of water quality changes on plumbosolvency using random daytime sampling. Water Res., 37(12): 2821–2823.
- Carlisle, J.C. and Dowling, K. (2006). Child-specific health guidance for lead. Presented at the Annual Meeting of the Society of Toxicology, March 2006. Toxicologist, 90(1):449 (Abstract 2191). Available at: www.toxicology.org/AI/Pub/Tox/2006Tox.pdf
- Carmignani, M., Volpe, A.R., Boscolo, P., Qiao, N., Di Gioacchino, M., Grilli, A. and Felaco, M. (2000). Catecholamine and nitric oxide systems as targets of chronic lead exposure in inducing selective functional impairment. Life Sci., 68(4): 401–415.
- Carson, T.L., Van Gelder, G.A., Karas, G.C. and Buck, W.B. (1974). Slowed learning in lambs prenatally exposed to lead. Arch. Environ. Health, 29(3): 154–156.
- Cartier, C., Laroche, L., Deshommes, E., Nour, S., Richard, G., Edwards, M. and Prévost, M. (2011). Investigating dissolved lead at the tap using various sampling protocols. J. Am. Water Works Assoc., 103(3): 53–67.
- Cartier, C., Arnold, R., Triantafyllidou, S., Prévost, M. and Edwards, M. (2012a). Effect of flow rate and lead/copper pipe sequence on lead release from service lines. Water Res., 46(13): 4142–4152.
- Cartier, C., Bannier, A., Pirog, M., Nour, S. and Prévost, M. (2012b). A rapid method for lead service line detection. J. Am. Water Works Assoc., 104(11): E596–E607.
- Cartier, C., Nour, S., Richer, B., Deshommes, E. and Prévost, M. (2012c). Impact of water treatment on the contribution of faucets to dissolved and particulate lead release at the tap. Water Res., 46(16): 5205–5216.
- Cartier, C., Doré, E., Laroche, L., Nour, S., Edwards, M. and Prévost, M. (2013). Impact of treatment on Pb release from full and partially replaced lead service lines (LSLs). Water Res., 47(2): 661–671.
- CCME (1999). Canadian soil quality guidelines for the protection of environmental and human health: Lead. In: Canadian environmental quality guidelines. Canadian Council of Ministers of the Environment, Winnipeg, Manitoba. Available at: http://ceqg-rcqe.ccme.ca/download/en/269/
- Cecil, K.M., Brubaker, C.J., Adler, C.M., Dietrich, K.N., Altaye, M., Egelhoff, J.C., Wessel, S., Elangovan, I., Hornung, R., Jarvis, K. and Lanphear, B.P. (2008). Decreased brain volume in adults with childhood lead exposure. PLoS Med., 5(5): e112. Available at: www.ncbi.nlm.nih.gov/pmc/articles/PMC2689675/
- Cecil, K.M., Dietrich, K.N., Altaye, M., Egelhoff, J.C., Lindquist, D.M., Brubaker, C.J. and Lanphear, B.P. (2011). Proton magnetic resonance spectroscopy in adults with childhood lead exposure. Environ. Health Perspect., 119(3): 403–408.
- Centre for Environmental Monitoring (2004). Metal levels in the soils of the Sudbury smelter footprint. A report to INCO Ltd., Copper Cliff, Ontario, and Falconbridge Ltd., Falconbridge, Ontario. Available at: www.sudburysoilsstudy.com/EN/media/Volume_I/SSS_Vol_I_b_App_C%20_CEM.pdf
- CFIA (2010). Children's food project – 2007-2008 report on sampling. Canadian Food Inspection Agency. Available from: www.inspection.gc.ca/food/chemical-residues-microbiology/chemical-residues/children-s-food-project/eng/1389125104073/1389125105323
- Chamberlain, A.C., Clough, W.S., Heard, M.J., Newton, D., Stott, A.N. and Wells, A.C. (1975). Uptake of lead by inhalation of motor exhaust. Proc. R. Soc. Lond. Biol. Sci., 192(1106): 77–110.
- Chamberlain, A.C., Heard, M.J., Little, P., Newton, D., Wells, A.C. and Wiffen, R.D. (1978). Investigations into lead from motor vehicles. United Kingdom Atomic Energy Research Establishment, Harwell, UK (AERE-9198).
- Chamberlain, A.C., Heard, M.J., Little, P., Wiffen, R.D., Harrison, R.M., Megaw, W.J. and Butler, J.D. (1979). The dispersion of lead from motor exhausts [and discussion]. Philos. Trans. R. Soc. Lond. Ser. A Math. Phys. Eng. Sci., 290: 557–589.
- Chan, L., Reveveur, O., Sharp, D., Schwartz, H., Ing, I. and Tikhonov, C. (2011). First Nations Food, Nutrition & Environment Study (FNFNES): results from British Columbia (2008/2009). University of Northern British Columbia, Prince George, B.C. Available at: www.fnfnes.ca/docs/BC%20Reports/FNFNES_Report_BC_FINAL_PRINT_v2.pdf
- Chandramouli, K., Steer, C.D., Ellis, M. and Emond, A.M. (2009). Effects of early childhood lead exposure on academic performance and behaviour of school age children. Arch. Dis. Child., 94(11): 844–848.
- Chang, H.R., Chen, S.S., Chen, T.J., Ho, C.H., Chiang, H.C. and Yu, H.S. (1996). Lymphocyte β2-adrenergic receptors and plasma catecholamine levels in lead-exposed workers. Toxicol. Appl. Pharmacol., 139(1): 1–5.
- Chang, H.R., Chen, S.S., Tsao, D.A., Cheng, J.T., Ho, C.K. and Yu, H.S. (1997). Change of cardiac β-adrenoceptors in lead-exposed rats. Toxicology, 123(1–2): 27–32.
- Chen, A., Dietrich, K.N., Ware, J.H., Radcliffe, J. and Rogan, W.J. (2005). IQ and blood lead from 2 to 7 years of age: are the effects in older children the residual of high blood lead concentrations in 2-year-olds? Environ. Health Perspect., 113(5): 597–601.
- Chen, H.H., Ma, T., Paul, I.A., Spencer, J.L. and Ho, I.K. (1997). Developmental lead exposure and two-way active avoidance training alter the distribution of protein kinase C activity in the rat hippocampus. Neurochem. Res., 22(9): 1119–1125.
- Chen, H.H., Ma, T. and Ho, I.K. (2001). Effects of developmental lead exposure on inhibitory avoidance learning and glutamate receptors in rats. Environ. Toxicol. Pharmacol., 9(4): 185–191.
- Cheng, Y., Schwartz, J., Sparrow, D., Aro, A., Weiss, S.T. and Hu, H. (2001). Bone lead and blood lead levels in relation to baseline blood pressure and the prospective development of hypertension. The Normative Aging Study. Am. J. Epidemiol., 153(2): 164–171.
- Chettle, D.R. (2005). Three decades of in vivo x-ray fluorescence of lead in bone. X-Ray Spectrom., 34(5): 446–450.
- Chia, S.E., Chia, K.S., Chia, H.P., Ong, C.N. and Jeyaratnam, J. (1996). Three-year follow-up of serial nerve conduction among lead-exposed workers. Scand. J. Work Environ. Health, 22(5): 374–380.
- Chiodo, L.M., Jacobson, S.W. and Jacobson, J.L. (2004). Neurodevelopmental effects of postnatal lead exposure at very low levels. Neurotoxicol. Teratol., 26(3): 359–371.
- Chiodo, L.M., Covington, C., Sokol, R.J., Hannigan, J.H., Jannise, J., Ager, J., Greenwald, M. and Delaney-Black, V. (2007). Blood lead levels and specific attention effects in young children. Neurotoxicol. Teratol., 29(5): 538–546.
- Chisolm, J.J., Jr., Harrison, H.C., Eberlein, W.R. and Harrison, H.E. (1955). Amino-aciduria, hypophosphatemia and rickets in lead poisoning. Arch. Pediatr. Adolesc. Med., 89(2): 159–168.
- Cho, S.C., Kim, B.N., Hong, Y.C., Shin, M.S., Yoo, H.J., Kim, J.W., Bhang, S.Y., Cho, I.H. and Kim, H.W. (2010). Effect of environmental exposure to lead and tobacco smoke on inattentive and hyperactive symptoms and neurocognitive performance in children. J. Child Psychol. Psychiatry, 51(9): 1050–1057.
- Chuang, H.Y., Chao, K.Y. and Tsai, S.Y. (2005). Reversible neurobehavioral performance with reductions in blood lead levels—A prospective study on lead workers. Neurotoxicol. Teratol., 27(3): 497–504.
- Churchill, D.M., Mavinic, D.S., Neden, D.G. and MacQuarrie, D.M. (2000). The effect of zinc orthophosphate and pH–alkalinity adjustment on metal levels leached into drinking water. Can. J. Civil Eng., 27(6): 33–43.
- Clark, B., Masters, S. and Edward, M. (2014). Profile sampling to characterize particulate lead risks in potable water. Environ. Sci. Technol., 48(12): 6836–6843. doi: 10.1021/es501342j
- Clifford, D.A. (1999). Ion exchange and inorganic adsorption. Chapter 9 in: Letterman, R.D.(ed). Water quality and treatment: a handbook of community water supplies, 5th edition American Water Works Association. Denver, Colorado. McGraw-Hill, New York, New York.
- Clifford, D., Sorg, T. and Ghurye, G. (2011). Ion exchange and adsorption of inorganic contaminants. Chapter 12 in: Edzwald, J.K. (ed.).Water quality and treatment: a handbook of community water supplies. 6th edition. American Water Works Association,Denver, Colorado. McGraw-Hill, New York, New York.
- Colling, J.H., Whincup, P.A.E. and Hayes, C.R. (1987) The measurement of plumbosolvency propensity to guide the control of lead in tapwaters. J. Inst. Water Environ. Manage., 1(3): 263–269.
- Colling, J.H., Croll, B.T., Whincup, P.A.E. and Harward, C. (1992) Plumbosolvency effects and control in hard waters. J. Inst. Water Environ. Manage., 6(6): 259–269.
- Columbano, A., Ledda-Columbano, G.M., Ennas, M.G., Curto, M., De Montis, M.G., Roomi, M.W., Pani, P. and Sarma, D.S.R. (1988). Modulation of the activity of hepatic γ-glutamyl transpeptidase, adenosine triphosphatase, placental glutathione S-transferase and adenylate cyclase by acute administration of lead nitrate. Basic Appl. Histochem., 32(4): 501–510.
- Commons, C. (2011). Effect of partial lead service line replacement on total lead at the tap. Office of Drinking Water Quality, Rhode Island Department of Health. Available at: www.health.ri.gov/publications/projectreports/EffectOfPartialLeadServiceLineReplacementOnTotalLeadAtTheTap.pdf
- Conestoga-Rovers and Associates (2010). Human health risk assessment, Town of Buchans, Newfoundland and Labrador. Conestoga-Rovers and Associates, Waterloo, Ontario.
- Cooney, G.H., Bell, A., McBride, W. and Carter, C. (1989a). Low-level exposures to lead: the Sydney Lead Study. Dev. Med. Child Neurol., 31(5): 640–649.
- Cooney, G.H., Bell, A., McBride, W. and Carter, C. (1989b). Neurobehavioural consequences of prenatal low level exposures to lead. Neurotoxicol. Teratol., 11(2): 95–104.
- Coria, F., Berciano, M.T., Berciano, J. and Lafarga, M. (1984). Axon membrane remodeling in the lead-induced demyelinating neuropathy of the rat. Brain Res., 291(2): 369–372.
- Corpas, I., Gaspar, I., Martinez, S., Codesal, J., Candelas, S. and Antonio, M.T. (1995). Testicular alterations in rats due to gestational and early lactational administration of lead. Reprod. Toxicol., 9(3): 307–313.
- Cory-Slechta, D.A. (1986). Prolonged lead exposure and fixed ratio performance. Neurobehav. Toxicol. Teratol., 8(3): 237–244.
- Cory-Slechta, D.A. and Pokora, M.J. (1991). Behavioral manifestations of prolonged lead exposure initiated at different stages of the life cycle: I. Schedule-controlled responding. Neurotoxicology, 12(4): 745–760.
- Cory-Slechta, D.A. and Thompson, T. (1979). Behavioral toxicity of chronic postweaning lead exposure in the rat. Toxicol. Appl. Pharmacol., 47(1): 151–159.
- Cory-Slechta, D.A., Bissen, S.T., Young, A.M. and Thompson, T. (1981). Chronic postweaning lead exposure and response duration performance. Toxicol. Appl. Pharmacol., 60(1): 78–84.
- Cory-Slechta, D.A., Weiss, B. and Cox, C. (1983). Delayed behavioral toxicity of lead with increasing exposure concentration. Toxicol. Appl. Pharmacol., 71(3): 342–352.
- Cory-Slechta, D.A., Weiss, B. and Cox, C. (1985). Performance and exposure indices of rats exposed to low concentrations of lead. Toxicol. Appl. Pharmacol., 78(2): 291–299.
- Cory-Slechta, D.A., Pokora, M.J. and Widzowski, D.V. (1991). Behavioral manifestations of prolonged lead exposure initiated at different stages of the life cycle: II. Delayed spatial alternation. Neurotoxicology, 12(4): 761–776.
- Cory-Slechta, D.A., Virgolini, M.B., Thiruchelvam, M., Weston, D.D. and Bauter, M.R. (2004). Maternal stress modulates the effects of developmental lead exposure. Environ. Health Perspect., 112: 717–733.
- Cory-Slechta, D.A., Merchant-Borna, K., Allen, J.L., Liu, S., Weston, D. and Conrad, K. (2013). Variations in the nature of behavioral experience can differentially alter the consequences of developmental exposures to lead, prenatal stress, and the combination. Toxicol. Sci., 131(1): 194–205.
- Counter, S.A. and Buchanan, L.H. (2002). Neuro-ototoxicity in Andean adults with chronic lead and noise exposure. J. Occup. Environ. Med., 44(1): 30–38.
- CPSC (2005). Interim enforcement policy for children's metal jewelry containing lead. Office of Compliance, U.S. Consumer Product Safety Commission, Washington, D.C. Available at: www.cpsc.gov/PageFiles/64485/pbjewelgd.pdf
- Crump, K.S., van Landingham, C., Bowers, T.S., Cahoy, D. and Chandalia, J.K. (2013). A statistical reevaluation of the data used in the Lanphear et al. (2005) pooled-analysis that related low levels of blood lead to intellectual deficits in children. Crit. Rev. Toxicol., 43(9): 785–799.
- CSA (2018a). American Society of Mechanical Engineers/Canadian Standards Association ASME A112.18.1-2018/CSA B125.1-18—Plumbing supply fittings. Canadian Standards Association, Mississauga, Ontario.
- CSA (2018b). Canadian Standards Association CSA B125.3-18—Plumbing supply fittings. Canadian Standards Association, Mississauga, Ontario.
- Dabeka, R.W., Karpinski, K.F., McKenzie, A.D. and Bajdik, C.D. (1986). Survey of lead, cadmium and fluoride in human milk and correlation of levels with environmental and food factors. Food Chem. Toxicol., 24(9): 913–921.
- Daggett, D.A., Oberley, T.D., Nelson, S.A., Wright, L.S., Kornguth, S.E. and Siegel, F.L. (1998). Effects of lead on rat kidney and liver: GST expression and oxidative stress. Toxicology, 128(3): 191–206.
- Danadevi, K., Rozati, R., Saleha Banu, B., Hanumanth Rao, P. and Grover, P. (2003). DNA damage in workers exposed to lead using comet assay. Toxicology, 187(2–3): 183–193.
- Dearth, R.K., Hiney, J.K., Srivastava, V., Burdick, S.B., Bratton, G.R. and Dees, W.L. (2002). Effects of lead (Pb) exposure during gestation and lactation on female pubertal development in the rat. Reprod. Toxicol., 16(4): 343–352.
- Defence Research and Development Canada (2004). Evaluation of the contamination by explosives and metals in soils, vegetation, surface water and sediment at Cold Lake Air Weapons Range (CLAWR), Alberta, Phase II final report. Defence Research and Development Canada, Valcartier, Quebec (TR 2004-204).
- Deknudt, G. and Gerber, G.B. (1979). Chromosomal aberrations in bone-marrow cells of mice given a normal or a calcium-deficient diet supplemented with various heavy metals. Mutat. Res., 68(2): 163–168.
- Del Toral, M.A., Porter, A. and Schock, M.R. (2013). Detection and evaluation of elevated lead release from service lines: a field study. Environ. Sci. Technol., 47(16): 9300–9307.
- Deng, W., McKinnon, R.D. and Poretz, R.D. (2001). Lead exposure delays the differentiation of oligodendroglial progenitors in vitro. Toxicol. Appl. Pharmacol., 174(3): 235–244.
- Denham, M., Schell, L.M., Deane, G., Gallo, M.V., Ravenscroft, J. and DeCaprio, A.P. (2005). Relationship of lead, mercury, mirex, dichlorodiphenyldichloroethylene, hexachlorobenzene, and polychlorinated biphenyls to timing of menarche among Akwesasne Mohawk girls. Pediatrics, 115(2): e127–e134.
- Den Hond, E., Nawrot, T. and Staessen, J.A. (2002). The relationship between blood pressure and blood lead in NHANES III. J. Hum. Hypertens., 16(8): 563–568.
- De Restrepo, H.G., Sicard, D. and Torres, M.M. (2000). DNA damage and repair in cells of lead exposed people. Am. J. Ind. Med., 38(3): 330–334.
- Deshommes, E., Laroche, L., Nour, S., Cartier, C. and Prévost, M. (2010a). Source and occurrence of particulate lead in tap water. Water Res., 44(12): 3734–3744.
- Deshommes, E., Zhang, Y., Gendron, K., Sauvé, S., Edwards, M., Nour, S. and Prévost, M. (2010b). Lead removal from tap water using POU devices. J. Am. Water Works Assoc., 102(10): 91–105.
- Deshommes, E., Tachet, A. and Prévost, M. (2012a). Does food prepared with tap water contribute more than tap water to children's exposure to lead? In: Proceedings of the American Water Works Association Water Quality Technology Conference, Toronto, Ontario, November 4–8, 2012. American Water Works Association, Denver, Colorado.
- Deshommes, E., Nour, S., Richer, B., Cartier, C. and Prévost, M. (2012b). POU devices in large buildings: lead removal and water quality. J. Am. Water Works Assoc., 104(4): E282–E297.
- Deshommes, E., Tardif, R., Edwards, M., Sauvé, S. and Prévost, M. (2012c). Experimental determination of the oral bioavailability and bioaccessibility of lead particles. Chem. Cent. J., 6(1): 138. doi: 10.1186/1752-153X-6-138
- Deshommes, E., Prévost, M., Levallois, P., Lemieux, F. and Nour, S. (2013). Application of lead monitoring results to predict 0–7 year old children's exposure at the tap. Water Res., 47: 2409–2420.
- Deshommes, E., Andrews, R., Gagnon, G., McCluskey, T., McIlwain, Doré, E., Nour, S. and Prévost, M. (2016). Evaluation of exposure to lead from drinking water in large buildings. Water Res., 99: 46–55.
- Després, C., Beuter, A., Richer, F., Poitras, K., Veilleux, A., Ayotte, P., Dewailly, E., Saint-Amour, D. and Muckle, G. (2005). Neuromotor functions in Inuit preschool children exposed to Pb, PCBs, and Hg. Neurotoxicol. Teratol., 27(2): 245–257.
- Devoto, P., Flore, G., Ibba, A., Fratta, W. and Pani, L. (2001). Lead intoxication during intrauterine life and lactation but not during adulthood reduces nucleus accumbens dopamine release as studied by brain microdialysis. Toxicol. Lett., 121(3): 199–206.
- Dhir, H., Roy, A.K. and Sharma, A. (1993). Relative efficiency of Phyllanthus emblica fruit extract and ascorbic acid in modifying lead and aluminium-induced sister-chromatid exchanges in mouse bone marrow. Environ. Mol. Mutagen., 21(3): 229–236.
- Dietrich, K.N., Succop, P.A., Berger, O.G. and Keith, R.W. (1992). Lead exposure and the central auditory processing abilities and cognitive development of urban children: the Cincinnati Lead Study cohort at age 5 years. Neurotoxicol. Teratol., 14(1): 51–56.
- Dietrich, K.N., Berger, O.G. and Succop, P.A. (1993a). Lead exposure and the motor developmental status of urban six-year-old children in the Cincinnati Prospective Study. Pediatrics, 91(2): 301–307.
- Dietrich, K.N., Berger, O.G., Succop, P.A., Hammond, P.B. and Bornschein, R.L. (1993b). The developmental consequences of low to moderate prenatal and postnatal lead exposure: intellectual attainment in the Cincinnati Lead Study cohort following school entry. Neurotoxicol. Teratol., 15(1): 37–44.
- Dietrich, K.N., Douglas, R.M., Succop, P.A., Berger, O.G. and Bornschein, R.L. (2001). Early exposure to lead and juvenile delinquency. Neurotoxicol. Teratol., 23(6): 511–518.
- Ding, Y., Vaziri, N.D. and Gonick, H.C. (1998). Lead-induced hypertension: II. Response to sequential infusions of L-arginine, superoxide dismutase, and nitroprusside. Environ. Res., 76(2): 107–113.
- Ding, Y., Gonick, H.C., Vaziri, N.D., Liang, K. and Wei, L. (2001). Lead-induced hypertension. III. Increased hydroxyl radical production. Am. J. Hypertens., 14(2): 169–173.
- Dixon, S.L., Gaitens, J.M., Jacobs, D.E., Strauss, W., Nagaraja, J., Pivetz, T., Wilson, J.W. and Ashley, P.J. (2009). Exposure of U.S. children to residential dust lead, 1999–2004: II. The contribution of lead-contaminated dust to children's blood lead levels. Environ. Health Perspect., 117(3): 468–474.
- Dodrill, D.M. and Edwards, M. (1995). Corrosion control on the basis of utility experience. J. Am. Water Works Assoc., 87(7): 74–85.
- Dogu, O., Louis, E.D., Tamer, L., Unal, O., Yilmaz, A. and Kaleagasi, H. (2007). Elevated blood lead concentrations in essential tremor: a case–control study in Mersin, Turkey. Environ. Health Perspect., 115(11): 1564–1568.
- Donald, J.M., Cutler, M.G. and Moore, M.R. (1987). Effects of lead in the laboratory mouse. Development and social behaviour after lifelong exposure to 12 µM lead in drinking fluid. Neuropharmacology, 26(4): 391–399.
- Doré, E., Deshommes, E., Nour, S. and Prévost, M. (2013). Measuring Lead Levels at the Tap of Canadian Schools : the Importanceof Consideringparticulate Lead. 2013 Water Quality Technology Conference and Exposition, WQTC 2013.
- Douglas, I., Guthmann, J., Muylwyk, Q. and Snoeyink, V. (2004) Corrosion control in the City of Ottawa-Comparison of alternatives and case study for lead reduction in drinking water. In: W. Robertson and T. Brooks (eds.), 11th Canadian National Drinking Water Conference and 2nd Policy Forum, April 3-6, Calgary, Alberta. Canadian Water and Wastewater Association, Ottawa, Ontario.
- Dribben, W.H., Creeley, C.E. and Farber, N. (2011). Low-level lead exposure triggers neuronal apoptosis in the developing mouse brain. Neurotoxicol. Teratol., 33(4): 473–480.
- Dursun, N., Arifoglu, C., Süer, C. and Keskinol, L. (2005). Blood pressure relationship to nitric oxide, lipid peroxidation, renal function, and renal blood flow in rats exposed to low lead levels. Biol. Trace Elem. Res., 104(2): 141–149.
- Edwards, M. and Dudi, A. (2004). Role of chlorine and chloramine in corrosion of lead-bearing plumbing materials. J. Am. Water Works Assoc., 96(10): 69–81.
- Edwards, M. and Triantafyllidou, S. (2007). Chloride-to-sulfate mass ratio and lead leaching to water. J. Am. Water Works Assoc., 99(7): 96–109.
- Edwards, M., Triantafyllidou, S. and Best, D. (2009). Elevated blood lead in young children due to lead-contaminated drinking water: Washington, DC, 2001–2004. Environ. Sci. Technol., 43: 1618–1623.
- EFSA (2013). Scientific opinion on lead in food. EFSA Panel on Contaminants in the Food Chain (CONTAM), European Food Safety Authority, Parma, Italy. EFSA J., 8(4): 1570. Available at: www.efsa.europa.eu/en/efsajournal/doc/1570.pdf
- Ekong, E.B., Jaar, B.G. and Weaver, V.M. (2006). Lead-related nephrotoxicity: a review of the epidemiologic evidence. Kidney Int., 70(12): 2074–2084.
- Elfland, C., Scardina, P. and Edwards, M. (2010). Lead-contaminated water from brass plumbing devices in new buildings. J. Am. Water Works Assoc., 102(11): 66–76.
- Emory, E., Ansari, Z., Pattillo, R., Archibold, E. and Chevalier, J. (2003). Maternal blood lead effects on infant intelligence at age 7 months. Am. J. Obstet. Gynecol., 188(4): S26–S32. Englyst, V., Lundström, N.G., Gerhardsson, L., Rylander, L. and Nordberg, G. (2001). Lung cancer risks among lead smelter workers also exposed to arsenic. Sci. Total Environ., 273(1–3): 77–82.
- Environment Canada (2010a). National Air Pollution Surveillance (NAPS) Program, monitoring data for years 2000–2009 (internal database prepublication NAPS data). Air Monitoring Data, Environment Canada, Ottawa, Ontario.
- Environment Canada (2010b). National Air Pollution Surveillance Program (NAPS). Analysis and Air Quality Section, Environment Canada, Ottawa, Ontario. Available at: www.ec.gc.ca/rnspa-naps/Default.asp?lang=Enandn=5C0D33CF-1
- Ernhart, C.B., Morrow-Tlucak, M., Marler, M.R. and Wolf, A.W. (1987). Low level lead exposure in the prenatal and early preschool periods: early preschool development. Neurotoxicol. Teratol., 9(3): 259–270.
- Ernhart, C.B., Morrow-Tlucak, M., Wolf, A.W., Super, D. and Drotar, D. (1989). Low level lead exposure in the prenatal and early preschool periods: intelligence prior to school entry. Neurotoxicol. Teratol., 11(2): 161–170.
- Erel, Y. and Morgan, J.J. (1992). The relationships between rock-derived lead and iron in natural waters. Geochim. Cosmochim. Acta, 56(12): 4157–4167.
- Erel, Y., Morgan, J.J. and Patterson, C.C. (1991). Natural levels of lead and cadmium in a remote mountain stream. Geochim. Cosmochim. Acta, 55(3): 707–719.
- Ettinger, A.S., Téllez-Rojo, M.M., Amarasiriwardena, C., Bellinger, D., Peterson, K., Schwartz, J., Hu, H. and Hernández-Avila, M. (2004). Effect of breast milk lead on infant blood lead levels at 1 month of age. Environ. Health Perspect., 112(14): 1381–1385.
- Eum, K.D., Korrick, S.A., Weuve, J., Okereke, O., Kubzansky, L.D., Hu, H. and Weisskopf, M.G. (2012). Relation of cumulative low-level lead exposure to depressive and phobic anxiety symptom scores in middle-age and elderly women. Environ. Health Perspect., 120(6): 817–823.
- European Commission (1999). Developing a new protocol for the monitoring of lead in drinking water. Directorate
- General for Science, Research and Development, European Commission, Brussels (Report No. REPORT EUR
- 19087 EN).
- European Commission (2015). Commission Directive (EU) 2015/1787 of 6 October 2015 amending Annexes II and III to Council Directive 98/83/EC on the quality of water intended for human consumption. Annex II, part D. Available at: https://eur-lex.europa.eu/legal-content/EN/TXT/?uri=celex:32015L1787.
- European Commission (2018). Proposal for a directive of the European parliament and of the council on the quality of water intended for human consumption (recast). Section 5.3.5. Report: COM/2017/0753 final - 2017/0332 (COD) Available at: https://eur-lex.europa.eu/legal-content/EN/TXT/?qid=1519210589057&uri=CELEX:52017PC0753.
- Fachehoun, R.C., Lévesque, B., Dumas, P., St-Louis, A., Dubé, M. and Ayotte, P. (2015). Lead exposure through comsumption of big game meat in Quebec, Canada: Risk assessment and perception. Food Addit. Contam. Part A Chem. Anal. Control Expo. Risk Assess., 32(9): 1501–1511.
- Factor-Litvak, P., Wasserman, G., Kline, J.K. and Graziano, J. (1999). The Yugoslavia Prospective Study of Environmental Lead Exposure. Environ. Health Perspect., 107(1): 9–15.
- Fadrowski, J.J., Navas-Acien, A., Tellez-Plaza, M., Guallar, E., Weaver, V.M. and Furth, S.L. (2010). Blood lead level and kidney function in US adolescents: the third National Health and Nutrition Examination Survey. Arch. Intern. Med., 170(1): 75–82.
- Fears, T.R., Elashoff, R.M. and Schneiderman, M.A. (1989). The statistical analysis of a carcinogen mixture experiment. III. Carcinogens with different target systems, aflatoxin B1, N-butyl-N-(4-hydroxybutyl)nitrosamine, lead acetate, and thiouracil. Toxicol. Ind. Health, 5(1): 1–23.
- Fergusson, D.M., Horwood, L.J. and Lynskey, M.T. (1993). Early dentine lead levels and subsequent cognitive and behavioural development. J. Child Psychol. Psychiatry, 34(2): 215–227.
- Fergusson, D.M., Horwood, L.J. and Lynskey, M.T. (1997). Early dentine lead levels and educational outcomes at 18 years. J. Child Psychol. Psychiatry, 38(4): 471–478.
- Fiorim, J., Ribeiro, R.F., Jr., Silveira, E.A., Padilha, A.S., Vescovi, M.V.A., de Jesus, H.C., Stefanon, I., Salaices, M. and Vassallo, D.V. (2011). Low-level lead exposure increases systolic arterial pressure and endothelium-derived vasodilator factors in rat aortas. PLoS One, 6(2): e17117. doi: 10.1371/journal.pone.0017117
- Fisher Environmental Ltd. (2010). Phase II environmental site assessment, 60 Shepard Road, Oakville, Ontario.
- Fleming, D.E.B., Boulay, D., Richard, N.S., Robin, J.P., Gordon, C.L., Webber, C.E. and Chettle, D.R. (1997). Accumulated body burden and endogenous release of lead in employees of a lead smelter. Environ. Health Perspect., 105(2): 224–233.
- Flora, S.J.S. and Tandon, S.K. (1987). Influence of calcium disodium edetate on the toxic effects of lead administration in pregnant rats. Indian J. Physiol. Pharmacol., 31(4): 267–272.
- Folstein, M.F., Folstein, S.E. and McHugh, P.R. (1975). "Mini-mental state". A practical method for grading the cognitive state of patients for the clinician. J. Psychiatr. Res., 12(3): 189–198.
- Forbes, G.B. and Reina, J.C. (1972). Effect of age on gastrointestinal absorption (Fe, Sr, Pb) in the rat. J. Nutr., 102: 647–652.
- Fowler, B.A. and DuVal, G. (1991). Effects of lead on the kidney: roles of high-affinity lead-binding proteins. Environ. Health Perspect., 91: 77–80.
- Fox, D.A., Campbell, M.L. and Blocker, Y.S. (1997). Functional alterations and apoptotic cell death in the retina following developmental or adult lead exposure. Neurotoxicology, 18(3): 645–664.
- Fox, D.A., Kala, S.V., Hamilton, W.R., Johnson, J.E. and O'Callaghan, J.P. (2008). Low-level human equivalent gestational lead exposure produces supernormal scotopic electroretinograms, increased retinal neurogenesis and decreased retinal dopamine utilization in rats. Environ. Health Perspect., 116(5): 618–625.
- Fracasso, M.E., Perbellini, L., Soldà, S., Talamini, G. and Franceschetti, P. (2002). Lead induced DNA strand breaks in lymphocytes of exposed workers: role of reactive oxygen species and protein kinase C. Mutat. Res., 515(1–2): 159–169.
- Fraser, S., Muckle, G. and Després, C. (2006). The relationship between lead exposure, motor function and behaviour in Inuit preschool children. Neurotoxicol. Teratol., 28(1): 18–27.
- Friedman, M.J., Hill, A.S., Reiber, S.H., Valentine, R.L. and Korshin, G.V. (2009) Assessment of inorganics accumulation in drinking water system scales and sediments. Water Research Foundation, Denver, Colorado (Project No. 3118).
- Froehlich, T.E., Lanphear, B.P., Auinger, P., Hornung, R., Epstein, J.N., Braun, J. and Kahn, R.S. (2009). Association of tobacco and lead exposures with attention-deficit/hyperactivity disorder. Pediatrics, 124(6): e1054–e1063.
- Fu, H. and Boffetta, P. (1995). Cancer and occupational exposure to inorganic lead compounds: a meta-analysis of published data. Occup. Environ. Med., 52(2): 73–81.
- Furst, A., Schlauder, M. and Sasmore, D.P. (1976). Tumorigenic activity of lead chromate. Cancer Res., 36(5): 1779–1783.
- Gauvin, D., Rasmussen, P., Levallois, P., St-Laurent, J., Corteau, M., Lemieux, F., Leblanc, A. and Beaudet, A. (2011). Dust and paint lead levels in homes of old districts of Montreal. Abstract presented at the 21st Annual International Society for Exposure Science Conference, Baltimore, Maryland.
- Gerhardsson, L., Lundstrom, N.G., Nordberg, G. and Wall, S. (1986). Mortality and lead exposure: a retrospective cohort study of Swedish smelter workers. Br. J. Ind. Med., 43(10): 707–712.
- Gilbert, M.E. and Mack, C.M. (1998). Chronic lead exposure accelerates decay of long-term potentiation in rat dentate gyrus in vivo. Brain Res., 789(1): 139–149.
- Gilbert, M.E., Mack, C.M. and Lasley, S.M. (1999a). Chronic developmental lead exposure and hippocampal long-term potentiation: biphasic dose–response relationship. Neurotoxicology, 20(1): 71–82.
- Gilbert, M.E., Mack, C.M. and Lasley, S.M. (1999b). The influence of developmental period of lead exposure on long-term potentiation in the adult rat dentate gyrus in vivo. Neurotoxicology, 20(1): 57–70.
- Gilbert, S.G. and Rice, D.C. (1987). Low-level lifetime lead exposure produces behavioral toxicity (spatial discrimination reversal) in adult monkeys. Toxicol. Appl. Pharmacol., 91(3): 484–490.
- Glenn, B.S., Stewart, W F., Links, J.M., Todd, A.C. and Schwartz, B.S. (2003). The longitudinal association of lead with blood pressure. Epidemiology, 14(1): 30–36.
- Glenn, B.S., Bandeen-Roche, K., Lee, B.K., Weaver, V.M., Todd, A.C. and Schwartz, B.S. (2006). Changes in systolic blood pressure associated with lead in blood and bone. Epidemiology, 17(5): 538–544.
- Glickman, L., Valciukas, J.A., Lilis, R. and Weisman, I. (1984). Occupational lead exposure. Effects of saccadic eye movements. Int. Arch. Occup. Environ. Health, 54(2): 115–125.
- Gnaedinger, R.H. (1993). Lead in school drinking water. J. Environ. Health, 55(6): 15–18.
- Gomaa, A., Hu, H., Bellinger, D., Schwartz, J., Tsaih, S.W., Gonzalez-Cossio, T., Schnaas, L., Peterson, K., Aro, A. and Hernandez-Avila, M. (2002). Maternal bone lead as an independent risk factor for fetal neurotoxicity: a prospective study. Pediatrics, 110(1 Pt. 1): 110–118.
- Gong, Z. and Evans, H.L. (1997). Effect of chelation with meso-dimercaptosuccinic acid (DMSA) before and after the appearance of lead-induced neurotoxicity in the rat. Toxicol. Appl. Pharmacol., 144(2): 205–214.
- Gonick, H.C. (2011). Lead-binding proteins: a review. J. Toxicol., 2011: 686050. doi: 10.1155/2011/686050
- Gonick, H.C., Ding, Y., Bondy, S.C., Ni, Z. and Vaziri, N.D. (1997). Lead-induced hypertension: interplay of nitric oxide and reactive oxygen species. Hypertension, 30(6): 1487–1492.
- González-Cossío, T., Peterson, K.E., Sanín, L.H., Fishbein, E., Palazuelos, E., Aro, A., Hernández-Avila, M. and Hu, H. (1997). Decrease in birth weight in relation to maternal bone-lead burden. Pediatrics, 100(5): 856–862.
- Goodlad, J.K., Marcus, D.K. and Fulton, J.J. (2013). Lead and attention-deficit/hyperactivity disorder (ADHD) symptoms: a meta-analysis. Clin. Psychol. Rev., 33(3): 417–425.
- Goodrum, P.E., Diamond, G.L., Hassett, J.M. and Johnson, D.L. (1996). Monte Carlo modeling of childhood lead exposure: development of a probabilistic methodology for use with the USEPA IEUBK Model for Lead in Children. Hum. Ecol. Risk Assess., 2(4): 681–708.
- Government of Canada (2010a). Canada Consumer Product Safety Act (S.C. 2010, c. 21). Available at: http://laws-lois.justice.gc.ca/eng/acts/C-1.68/page-1.html
- Government of Canada (2010b). Hazardous Products (Kettles) Regulations. C.R.C., c. 927. Available at: http://laws-lois.justice.gc.ca/eng/regulations/C.R.C.,_c._927/page-1.html
- Government of Ontario (2014). Safe Drinking Water Act, 2002. Ontario Regulation 170/03. Drinking Water Systems. Available at: www.e-laws.gov.on.ca/html/regs/english/elaws_regs_030170_e.htm
- Goyer, R.A., Tsuchiya, K., Leonard, D.L. and Kahyo, H. (1972). Aminoaciduria in Japanese workers in the lead and cadmium industries. Am. J. Clin. Pathol., 57(5): 635–642.
- Graziano, J.H. and Blum, C. (1991). Lead exposure from lead crystal. Lancet, 337(8734): 141–142.
- Graziano, J.H., Blum, C.B., Lolacono, N.J., Slavkovich, V., Manton, W.I., Pond, S. and Moore, M.R. (1996). A human in vivo model for the determination of lead bioavailability using stable isotope dilution. Environ. Health Perspect., 104(2): 176–179.
- Griffin, T.B., Coulston, F. and Wills, H. (1975). Biological and clinical effects of continuous exposure to airborne particulate lead. Arh. Hig. Rada Toksikol., 26(Suppl.): 191–208.
- Gross, S.B., Pfitzer, E.A., Yeager, D.W. and Kehoe, R.A. (1975). Lead in human tissues. Toxicol. Appl. Pharmacol., 32(3): 638–651.
- Grosse, S.D., Matte, T.D., Schwartz, J. and Jackson, R.J. (2002). Economic gains resulting from the reduction in children's exposure to lead in the United States. Environ. Health Perspect., 110(6): 563–569.
- Gu, Y., Wang, L., Xiao, C., Guo, F. and Ruan, D.Y. (2005). Effects of lead on voltage-gated sodium channels in rat hippocampal CA1 neurons. Neuroscience, 133(3): 679–690.
- Gulson, B.L., Mahaffey, K.R., Jameson, C.W., Vidal, M., Law, A.J., Mizon, K.J., Smith, A.J. and Korsch, M.J. (1997). Dietary lead intakes for mother/child pairs and relevance to pharmacokinetic models. Environ. Health Perspect., 105(12): 1334–1342.
- Gulson, B.L., Jameson, C.W., Mahaffey, K.R., Mizon, K.J., Patison, N., Law, A.J., Korsch, M.J. and Salter, M.A. (1998). Relationships of lead in breast milk to lead in blood, urine, and diet of the infant and mother. Environ. Health Perspect., 106(10): 667–674.
- Gulson, B.L., Mizon, K.J., Korsch, M.J., Palmer, J.M. and Donnelly, J.B. (2003). Mobilization of lead from human bone tissue during pregnancy and lactation—A summary of long-term research. Sci. Total Environ., 303(1–2): 79–104.
- Gulson, B.L., Mizon, K.J., Palmer, J.M., Korsch, M.J., Taylor, A.J. and Mahaffey, K.R. (2004a). Blood lead changes during pregnancy and postpartum with calcium supplementation. Environ. Health Perspect .,112: 499–507.
- Gulson, B.L., Mizon, K.J., Palmer, J.M., Korsch, M.J., Taylor, A.J. and Mahaffey, K.R. (2004b). Blood lead changes during pregnancy and postpartum with calcium supplementation. Environ. Health Perspect., 112(15): 1499–1507. Gump, B.B., Stewart, P., Reihman, J., Lonky, E., Darvill, T., Matthews, K.A. and Parsons, P.J. (2005). Prenatal and early childhood blood lead levels and cardiovascular functioning in 9½ year old children. Neurotoxicol. Teratol., 27(4): 655–665.
- Gump, B.B., MacKenzie, J.A., Bendinskas, K., Morgan, R., Dumas, A.K., Palmer, C.D. and Parsons, P.J. (2011). Low-level Pb and cardiovascular responses to acute stress in children: the role of cardiac autonomic regulation. Neurotoxicol. Teratol., 33(2): 212–219.
- Gutowski, M., Altmann, L., Sveinsson, K. and Wiegand, H. (1997). Postnatal development of synaptic plasticity in the CA3 hippocampal region of control and lead-exposed Wistar rats. Dev. Brain Res., 98(1): 82–90.
- Gutowski, M., Altmann, L., Sveinsson, K. and Wiegand, H. (1998). Synaptic plasticity in the CA1 and CA3 hippocampal region of pre- and postnatally lead-exposed rats. Toxicol. Lett., 95(3): 195–203.
- Gwiazda, R., Campbell, C. and Smith, D. (2005). A noninvasive isotopic approach to estimate the bone lead contribution to blood in children: implications for assessing the efficacy of lead abatement. Environ. Health Perspect., 113(1): 104–110.
- Ha, M., Kwon, H.J., Lim, M.H., Jee, Y.K., Hong, Y.C., Leem, J.H., Sakong, J., Bae, J.M., Hong, S.J., Roh, Y.M. and Jo, S.J. (2009). Low blood levels of lead and mercury and symptoms of attention deficit hyperactivity in children: a report of the Children's Health and Environment Research (CHEER). Neurotoxicology, 30(1): 31–36.
- Haas, C., Koch, L., Kelty, K., Lytle, D. and Triantafyllidou, S. (2013). Effectiveness of the preservation protocol within the Environmental Protection Agency (EPA) Method 200.8 for soluble and particulate lead recovery in drinking water. U.S. Environmental Protection Agency, Washington, D.C. (EPA/600/R-13/222).
- Haenninen, H., Hernberg, S., Mantere, P., Vesanto, R. and Jalkanen, M. (1978). Psychological performance of subjects with low exposure to lead. J. Occup. Med., 20(10): 683–689.
- Hamilton Health and Social Services (2006). Private well water supplies: naturally occurring lead in bedrock. Hamilton Public Health Services, Hamilton, Ontario. Available at: www.hamilton.ca/HealthandSocialServices/PublicHealth/SafeWater/PrivateWellWaterSupply.htm
- Hamurcu, Z., Donmez, H., Saraymen, R. and Demirtas, H. (2001). Micronucleus frequencies in workers exposed to lead, zinc, and cadmium. Biol. Trace Elem. Res., 83(2): 97–102.
- Hanas, J.S., Rodgers, J.S., Bantle, J.A. and Cheng, Y.G. (1999). Lead inhibition of DNA-binding mechanism of Cys2His2 zinc finger proteins. Mol. Pharmacol., 56(5): 982–988.
- Hänninen, H., Mantere, P., Hernberg, S., Seppäläinen, A.M. and Kock, B. (1979). Subjective symptoms in low-level exposure to lead. Neurotoxicology, 1(2): 333–347.
- Hänninen, H., Aitio, A., Kovala, T., Luukkonen, R., Matikainen, E., Mannelin, T., Erkkilä, J. and Riihimäki, V. (1998). Occupational exposure to lead and neuropsychological dysfunction. Occup. Environ. Med., 55(3): 202–209.
- Hanning, R.M., Sandhu, R., MacMillan, A., Moss, L., Tsuji, L.J.S. and Nieboer, E. (2003). Impact on blood Pb levels of maternal and early infant feeding practices of First Nation Cree in the Mushkegowuk Territory of northern Ontario, Canada. J. Environ. Monit., 5(2): 241–245.
- Hartwig, A., Schlepegrell, R. and Beyersmann, D. (1990). Indirect mechanism of lead-induced genotoxicity in cultured mammalian cells. Mutat. Res., 241(1): 75–82.
- Hauser, R., Sergeyev, O., Korrick, S., Lee, M.M., Revich, B., Gitin, E., Burns, J.S. and Williams, P.L. (2008). Association of blood lead levels with onset of puberty in Russian boys. Environ. Health Perspect., 116(7): 976–980.
- Hayes, C.R. and Croft, T.N. (2012). An investigation into the representativeness of random daytime sampling for lead in drinking water, using computational modelling. . J. Water Supply Res. Technol. – Aqua, 61( 3): 142-152.
- Hayes, C.R., Incledion, S. and Balch, M. (2008). Experience in Wales (UK) of the optimization of ortho-phosphate dosing for controlling lead in drinking water. J. Water Health, 6(2): 177–185.
- Hayes, C.R., Croft, T.N., Phillips, E., Craik, S. and Schock, M. (2014). Optimisation of plumbosolvency control using computation modelling techniques: a demonstration project for the Government of Alberta, working with the City of Calgary and EPCOR (Edmonton). WQM Associates, Pembrokeshire, United Kingdom
- Health Canada (1994). Canadian Environmental Protection Act: human health risk assessment for Priority Substances. Health Canada, Ottawa, Ontario. Available at: www.hc-sc.gc.ca/ewh-semt/alt_formats/hecs-sesc/pdf/pubs/contaminants/approach/approach-eng.pdf
- Health Canada (2009a). Canadian Total Diet Study. Bureau of Chemical Safety, Health Products and Food Branch, Health Canada, Ottawa, Ontario. Available at: www.hc-sc.gc.ca/fn-an/surveill/total-diet/index-eng.php
- Health Canada (2009b). Guidance on controlling corrosion in drinking water distribution systems. Water, Air and Climate Change Bureau, Healthy Environments and Consumer Safety Branch, Health Canada, Ottawa, Ontario.
- Health Canada (2010a). Consumer Products Containing Lead (Contact with Mouth) Regulations: fact sheet, November. Health Canada, Ottawa, Ontario. Available at: www.hc-sc.gc.ca/ahc-asc/media/nr-cp/_2010/2010_203fs-eng.php
- Health Canada (2010b). Health Canada's lead risk reduction strategy for consumer products: fact sheet, November. Health Canada, Ottawa, Ontario. Available at: www.hc-sc.gc.ca/ahc-asc/media/nr-cp/_2010/2010_203fsb-eng.php
- Health Canada (2011a). Dietary intakes of contaminants and other chemicals for different age–sex groups of Canadians. Health Canada, Ottawa, Ontario. Available at: www.hc-sc.gc.ca/fn-an/surveill/total-diet/intake-apport/index-eng.php
- Health Canada (2011b). Health concerns about lead in traditional kohl. Health Canada, Ottawa, Ontario. Available at: www.canada.ca/en/health-canada/services/cosmetics/health-concerns-about-lead-traditional-kohl.html
- Health Canada (2012a). Guidance on heavy metal impurities in cosmetics. Health Canada, Ottawa, Ontario. Available at: www.hc-sc.gc.ca/cps-spc/pubs/indust/heavy_metals-metaux_lourds/index-eng.php
- Health Canada (2012b). Industry guide to Health Canada's safety requirements for children's toys and related products. Consumer Product Safety, Health Canada, Ottawa, Ontario. Available at: www.hc-sc.gc.ca/cps-spc/pubs/indust/toys-jouets/index-eng.php
- Health Canada (2013a). Risk management strategy for lead. Health Canada, Ottawa, Ontario. Available at: www.hc-sc.gc.ca/ewh-semt/pubs/contaminants/prms_lead-psgr_plomb/index-eng.php
- Health Canada (2013b). Second report on human biomonitoring of environmental chemicals in Canada: results of the Canadian Health Measures Survey cycle 2 (2009–2011). Health Canada, Ottawa, Ontario. Available at: http://www.healthyenvironmentforkids.ca/sites/healthyenvironmentforkids.ca/files/HumanBiomonitoringReport__EN.pdf
- Health Canada (2013c). Final human health state of the science report on lead. Health Canada, Ottawa, Ontario. Available at: www.hc-sc.gc.ca/ewh-semt/pubs/contaminants/dhhssrl-rpecscepsh/index-eng.php
- Health Canada (2014). Personal communication with A.-M.Tugulea.
- Health Canada (2015). Third report on human biomonitoring of environmental chemicals in Canada. Results of the Canadian Health Measures Survey Cycle 3 (2012–2013). Available at: https://www.canada.ca/en/health-canada/services/environmental-workplace-health/reports-publications/environmental-contaminants/third-report-human-biomonitoring-environmental-chemicals-canada.html#s3
- Health Canada (2017). Internal report from Environemtnal Health Science and Research Bureau, Healthy Environments and Consumer Safety Branch, Ottawa, Ontario (available upon request).
- Healey, N. (2014). Toxicokinetic modeling to estimate oral equivalent doses for a reference blood lead concentration. Azimuth Consulting Group Partnership, Vancouver, B.C.
- Healey, N., Jones-Otazo, H., Walker, M. and Knafla, A. (2010). Toxicological review and recommended toxicological reference values for environmental lead exposure in Canada. Prepared for Contaminated Sites Division, Environmental Health Bureau, Safe Environments Directorate, Healthy Environments and Consumer Safety Branch, Health Canada, Ottawa, Ontario.
- Heidary-Monfard, S. (2011). Community Garden Heavy Metal Study, Ecology Action Centre,Halifax, Nova Scotia. Available at: www.ecologyaction.ca/files/images-documents/file/Community%20Garden%20Heavy%20Metal%20Contamination%20Study.pdf
- Hernández-Avila, M., Smith, D., Meneses, F., Sanin, L.H. and Hu, H. (1998). The influence of bone and blood lead on plasma lead levels in environmentally exposed adults. Environ. Health Perspect., 106(8): 473–477.
- Hernandez-Avila, M., Peterson, K.E., Gonzalez-Cossio, T., Sanin, L.H., Aro, A., Schnaas, L. and Hu, H. (2002). Effect of maternal bone lead on length and head circumference of newborns and 1-month-old infants. Arch. Environ. Health, 57(5): 482–488.
- Herrnstein, R. and Murray, C. (1994). The bell curve: intelligence and class structure in American life. Free Press, New York, New York.
- Hertz-Picciotto, I. (2000). The evidence that lead increases the risk for spontaneous abortion. Am. J. Ind. Med., 38: 300–309.
- Hilts, S.R. (2003). Effect of smelter emission reductions on children's blood lead levels. Sci. Total Environ., 303(1–2): 51–58.
- Hogan, K., Marcus, A., Smith, R. and White, P. (1998). Integrated Exposure Uptake Biokinetic Model for Lead in Children: empirical comparisons with epidemiologic data. Environ. Health Perspect., 106(Suppl. 6): 1557–1567.
- Hogstedt, C., Hane, M., Agrell, A. and Bodin, L. (1983). Neuropsychological test results and symptoms among workers with well-defined long-term exposure to lead. Br. J. Ind. Med., 40(1): 99–105.
- Holness, D.L. and Nethercott, J.R. (1988). Acute lead intoxication in a group of demolition workers. Appl. Ind. Hyg., 3(12): 338–341.
- Huang, P.C., Su, P.H., Chen, H.Y., Huang, H.B., Tsai, J.L., Huang, H.I. and Wang, S.L. (2012). Childhood blood lead levels and intellectual development after ban of leaded gasoline in Taiwan: a 9-year prospective study. Environ. Int., 40(1): 88–96.
- HUD (2001). National survey of lead and allergens in housing. Final report. Vol. I. Analysis of lead hazards, revision 6.0. Office of Lead Hazard Control, U.S. Department of Housing and Urban Development, Washington, D.C.
- Hulsmann, A.D. (1990). Particulate lead in water supplies. J. Inst. Water Environ. Manage., 4(2): 19–25.
- Hursh, J.B. and Suomela, J. (1968). Absorption of 212Pb from the gastrointestinal tract of man. Acta Radiol. Ther. Phys. Biol., 7(2): 108–120.
- Hursh, J.B., Schraub, A., Sattler, E.L. and Hofmann, H.P. (1969). Fate of 212Pb inhaled by human subjects. Health Phys., 16(3): 257–267.
- IARC (2006). Inorganic and organic lead compounds. International Agency for Research on Cancer, Lyon, France (IARC Monographs on the Evaluation of Carcinogenic Risks to Humans, Vol. 87).
- Iavicoli, I., Carelli, G., Stanek, E.J., III, Castellino, N. and Calabrese, E.J. (2004). Effects of low doses of dietary lead on puberty onset in female mice. Reprod. Toxicol., 19(1): 35–41.
- Iavicoli, I., Carelli, G., Stanek, E.J., Castellino, N., Li, Z. and Calabrese, E.J. (2006). Low doses of dietary lead are associated with a profound reduction in the time to the onset of puberty in female mice. Reprod. Toxicol., 22(4): 586–590.
- ICRP (1993). Age-dependent doses to members of the public from intake of radionuclides. Part 2. Ingestion dose coefficients. Ann. ICRP, 23(3–4). Pergamon Press, Oxford, UK (International Commission on Radiological Protection Publication 67).
- INSPQ (2011). Étude de l'impact de la contamination par le plomb de l'environnement résidentiel sur la plombémie des jeunes enfants—rapport présenté par P. Levallois, J. St-Laurent, D. Gauvin, M. Courteau à Santé Canada. Direction de la santé environnementale et de la toxicologie, Institut national de santé publique du Québec, Québec.
- Ishida, M., Ishizaki, M. and Yamada, Y. (1996). Decreases in postural change of finger blood flow in ceramic painters chronically exposed to low level lead. Am. J. Ind. Med., 29(5): 547–553.
- Ito, N. (1973). Experimental studies on tumors of the urinary system of rats induced by chemical carcinogens. Acta Pathol. Jpn., 23(1): 87–109.
- Ito, N., Hiasa, Y., Kamakoto, Y., Makiura, S. and Sugihara, S. (1971). Histopathological analysis of kidney tumors in rats induced by chemical carcinogens. Gann, 62(6): 435–444.
- Jablonska, L., Walski, M. and Rafalowska, U. (1994). Lead as an inductor of some morphological and functional changes in synaptosomes from rat brain. Cell. Mol. Neurobiol., 14(6): 701–709.
- Jackson, P. (2000). Monitoring the performance of corrective treatment methods. WRc-NSF Ltd., Oakdale, Gwent, UK.
- James, H.M., Hilburn, M.E. and Blair, J.A. (1985). Effects of meals and meal times on uptake of lead from the gastrointestinal tract in humans. Hum. Toxicol., 4(4): 401–407.
- JECFA (2011). Safety evaluation of certain food additives and contaminants. Prepared by the seventy-third meeting of the Joint FAO/WHO Expert Committee on Food Additives (JECFA). World Health Organization, Geneva, Switzerland (WHO Food Additives Series, No. 64). Available at: http://whqlibdoc.who.int/publications/2011/9789241660648_eng.pdf?ua=1
- Jedrychowski, W., Perera, F.P., Jankowski, J., Mrozek-Budzyn, D., Mroz, E., Flak, E., Edwards, S., Skarupa, A. and Lisowska-Miszczyk, I. (2009). Very low prenatal exposure to lead and mental development of children in infancy and early childhood. Neuroepidemiology, 32(4): 270–278.
- Jemal, A., Graubard, B.I., Devesa, S.S. and Flegal, K.M. (2002). The association of blood lead level and cancer mortality among whites in the United States. Environ. Health Perspect., 110(4): 325–329.
- Jusko, T.A., Henderson, C.R., Jr., Lanphear, B.P., Cory-Slechta, D.A., Parsons, P.J. and Canfield, R.L. (2008). Blood lead concentration <10 µg/dL and child intelligence at 6 years of age. Environ. Health Perspect., 116(2): 243–248.
- Karalekas, P.C., Ryan, C.R., Larson, C.D. and Taylor, F.B. (1978). Alternative methods for controlling the corrosion of lead pipes. J. N. Engl. Water Works Assoc., 92(2): 159–178.
- Kasprzak, K.S., Hoover, K.L. and Poirier, L.A. (1985). Effects of dietary calcium acetate on lead subacetate carcinogenicity in kidney of male Sprague-Dawley rats. Carcinogenesis, 6(2): 279–282.
- Kehoe, R.A. (1987). Studies of lead administration and elimination in adult volunteers under natural and experimentally induced conditions over extended periods of time. Food Chem. Toxicol., 25(6): 421–493.
- Kerper, L.E. and Hinkle, P.M. (1997a). Cellular uptake of lead is activated by depletion of intracellular calcium stores. J. Biol. Chem., 272(13): 8346–8352.
- Kerper, L.E. and Hinkle, P.M. (1997b). Lead uptake in brain capillary endothelial cells: activation by calcium store depletion. Toxicol. Appl. Pharmacol., 146(1): 127–133.
- Khalil-Manesh, F., Gonick, H.C., Cohen, A.H., Alinovi, R., Bergamaschi, E., Mutti, A. and Rosen, V.J. (1992a). Experimental model of lead nephropathy. I. Continuous high-dose lead administration. Kidney Int., 41(5): 1192–1203.
- Khalil-Manesh, F., Gonick, H.C., Cohen, A., Bergamaschi, E. and Mutti, A. (1992b). Experimental model of lead nephropathy. II. Effect of removal from lead exposure and chelation treatment with dimercaptosuccinic acid (DMSA). Environ. Res., 58(1): 35–54.
- Khalil-Manesh, F., Gonick, H.C. and Cohen, A.H. (1993a). Experimental model of lead nephropathy. III. Continuous low-level lead administration. Arch. Environ. Health, 48(4): 271–278.
- Khalil-Manesh, F., Gonick, H.C., Weiler, E.W.J., Prins, B., Weber, M.A. and Purdy, R.E. (1993b). Lead-induced hypertension: possible role of endothelial factors. Am. J. Hypertens., 6(9): 723–729.
- Khalil-Manesh, F., Gonick, H.C., Weiler, E.W.J., Prins, B., Weber, M.A., Purdy, R. and Ren, Q. (1994). Effect of chelation treatment with dimercaptosuccinic acid (DMSA) on lead-related blood pressure changes. Environ. Res., 65(1): 86–99.
- Kim, D.S., Yu, S.D. and Lee, E.H. (2010). Effects of blood lead concentration on intelligence and personality in school children. Mol. Cell. Toxicol., 6(1): 19–23.
- Kim, E.J., Herrera, J.E., Huggins, D., Braam, J. and Koshowski, S. (2011). Effect of pH on the concentrations of lead and trace contaminants in drinking water: a combined batch, pipe loop and sentinel home study. Water Res., 45(9): 2763–2774.
- Kim, R., Rotnitzky, A., Sparrow, D., Weiss, S.T., Wager, C. and Hu, H. (1996). A longitudinal study of low-level lead exposure and impairment of renal function: the Normative Aging Study. J. Am. Med. Assoc., 275(15): 1177–1181.
- Kimbrough, D.E. (2001). Brass corrosion and the LCR monitoring program. J. Am. Water Works Assoc., 93(2): 81–91.
- Kimbrough, D.E. (2007). Brass corrosion as a source of lead and copper in traditional and all plastic distribution systems. J. Am. Water Works Assoc., 98(8): 70–76.
- Kimbrough, D.E. (2009). Source identification of copper, lead, nickel, and zinc loading in wastewater reclamation plant influents from corrosion of brass in plumbing fixtures. Environ. Pollut., 157(4): 1310–1316.
- Kirmeyer, G., Edwards, M., Triantafyllidou, S. and Murphy, B. (2007). Performance and metal release of non-leaded brass meters, components and fittings. Water Research Foundation, Denver, Colorado (Awwa Research Foundation Project No. 91174).
- Korshin, G.V., Ferguson, J.F., Lancaster, A.N. and Wu, H. (1999). Corrosion and metal release for lead-containing materials: influence of NOM. Water Research Foundation, Denver, Colorado. (Awwa Research Foundation Project No. 90759. No. 4349).
- Korshin, G.V., Ferguson, J.F. and Lancaster, A.N. (2005). Influence of natural organic matter on the morphology of corroding lead surfaces and behavior of lead-containing particles. Water Res., 39(5): 811–818.
- Kostial, K., Kello, D. and Jugo, S. (1978). Influence of age on metal metabolism and toxicity. Environ. Health Perspect., 25: 81–86.
- Koyashiki, G.A.K., Paoliello, M.M.B. and Tchounwou, P.B. (2010). Lead levels in human milk and children's health risk: a systematic review. Rev. Environ. Health, 25(3): 243–253.
- Krieg, E.F., Jr., Chrislip, D.W., Crespo, C.J., Brightwell, W.S., Ehrenberg, R.L. and Otto, D.A. (2005). The relationship between blood lead levels and neurobehavioral test performance in NHANES III and related occupational studies. Public Health Rep., 120(3): 240–251.
- Krishnan, K. and Carrier, R. (2008). Approaches for evaluating the relevance of multiroute exposures in establishing guideline values for drinking water contaminants. J. Environ. Sci. Health C Environ. Carcinog. Ecotoxicol. Rev., 26(3): 300–316.
- Krishnan, K. and Carrier, R. (2013). The use of exposure source allocation factor in the risk assessment of drinking-water contaminants. J. Toxicol. Environ. Health B Crit. Rev., 16(1): 39–51.
- Laird, B.D. (2010). Evaluating metal bioaccessibility of soils and foods using the SHIME. PhD thesis, University of Saskatchewan, Saskatoon, Saskatchewan. Available at: http://ecommons.usask.ca/bitstream/handle/10388/etd-11292010-165216/Laird_CGSR_Approved_Thesis.pdf?sequence=1
- Lamadrid-Figueroa, H., Téllez-Rojo, M.M., Hernández-Avila, M., Trejo-Valdivia, B., Solano-González, M., Mercado-Garcia, A., Smith, D., Hu, H. and Wright, R.O. (2007). Association between the plasma/whole blood lead ratio and history of spontaneous abortion: a nested cross-sectional study. BMC Pregnancy Childbirth, 7:22. doi: 10.1186/1471-2393-7-22
- Lambert, T.W. and Lane, S. (2004). Lead, arsenic and polycyclic aromatic hydrocarbons in soil and house dust in the communities surrounding the Sydney, Nova Scotia, tar ponds. Environ. Health Perspect., 112(1): 35–41.
- Lanphear, B.P., Matte, T.D., Rogers, J., Clickner, R.P., Dietz, B., Bornschein, R.L., Succop, P., Mahaffey, K.R., Dixon, S., Galke, W., Rabinowitz, M., Farfel, M., Rohde, C., Schwartz, J., Ashley, P. and Jacobs, D.E. (1998). The contribution of lead-contaminated house dust and residential soil to children's blood lead levels: a pooled analysis of 12 epidemiologic studies. Environ. Res., 79(1): 51–68.
- Lanphear, B.P., Dietrich, K., Auinger, P. and Cox, C. (2000). Cognitive deficits associated with blood lead concentrations < 10 µg/dL in US children and adolescents. Public Health Rep., 115(6): 521–529.
- Lanphear, B.P., Hornung, R., Khoury, J., Yolton, K., Baghurst, P., Bellinger, D.C., Canfield, R.L., Dietrich, K.N., Bornschein, R., Greene, T., Rothenberg, S.J., Needleman, H.L., Schnaas, L., Wasserman, G., Graziano, J. and Roberts, R. (2005). Low-level environmental lead exposure and children's intellectual function: an international pooled analysis. Environ. Health Perspect., 113(7): 894–899.
- Lasley, S.M., Green, M.C. and Gilbert, M.E. (1999). Influence of exposure period on in vivo hippocampal glutamate and GABA release in rats chronically exposed to lead. Neurotoxicology, 20(4): 619–629.
- Lasley, S.M., Green, M.C. and Gilbert, M.E. (2001). Rat hippocampal NMDA receptor binding as a function of chronic lead exposure level. Neurotoxicol. Teratol., 23(2): 185–189.
- Laughlin, N.K., Lasky, R.E., Giles, N.L. and Luck, M.L. (1999). Lead effects on neurobehavioral development in the neonatal rhesus monkey (Macaca mulatta). Neurotoxicol. Teratol., 21(6): 627–638.
- Lee, R.G., Becker, W.C. and Collins, D.W. (1989). Lead at the tap: sources and control. J. Am. Water Works Assoc., 81(7): 52–62.
- Leggett, R.W. (1993). Research advances: an age-specific kinetic model of lead metabolism in humans. Environ. Health Perspect., 101(7): 598–616.
- Leroy, P., Schock, M.R., Wagner, I. and Holtschulte, H. (1996). Internal corrosion of water distribution systems. 2nd edition. American Water Works Association Research Foundation, Denver, Colorado.
- Levallois, P., St-Laurent, J., Gauvin, D., Courteau, M., Prévost, M., Campagna, C., Lemieux, F., Nour, S., D'Amour, M. and Rasmussen, P.E. (2014). The impact of drinking water, indoor dust and paint on blood lead levels of children aged 1-5 years in Montréal (Québec, Canada). J. Expo. Sci. Environ. Epidemiol., 24: 185–191.
- Liao, L. M., Friesen, M. C., Yong-Bing, X., Cai, H., Koh, D. H., Ji, B. T., Yang, G., Li, H.L., Locke, S.J., Rothman, N., Zheng, W., Gao, Y.T., Shu, X.O. and Purdue, M.P. (2016). Occupational lead exposure and associations with selected cancers: The Shanghai men's and women's health study cohorts. Environ. Health Perspect., 124(1): 97.
- Lidsky, T.I. and Schneider, J.S. (2003). Lead neurotoxicity in children: basic mechanisms and clinical correlates. Brain, 126(1): 5–19.
- Lin, Y.-P., and Valentine, R.L. (2008). The release of lead from the reduction of lead oxide (PbO2) by natural organic matter. Environ. Sci. Technol., 42(3): 760–765.
- Lin, R.H., Lee, C.H., Chen, W.K. and Lin-Shiau, S.Y. (1994). Studies on cytotoxic and genotoxic effects of cadmium nitrate and lead nitrate in Chinese hamster ovary cells. Environ. Mol. Mutagen., 23(2): 143–149.
- Lindgren, K.N., Ford, D.P. and Bleecker, M.L. (2003). Pattern of blood lead levels over working lifetime and neuropsychological performance. Arch. Environ. Health, 58(6): 373–379.
- Liu, J., Liu, X., Wang, W., McCauley, L., Pinto-Martin, J., Wang, Y., Li, L., Yan, C. and Rogan, W. (2014). Blood lead concentrations and children's behavioral and emotional problems: a cohort study. JAMA Pediatr., 168(8): 737–745.
- Loghman-Adham, M. (1998). Aminoaciduria and glycosuria following severe childhood lead poisoning. Pediatr. Nephrol., 12(3): 218–221.
- Louis, E.D., Jurewicz, E.C., Applegate, L., Factor-Litvak, P., Parides, M., Andrews, L., Slavkovich, V., Graziano, J.H., Carroll, S. and Todd, A. (2003). Association between essential tremor and blood lead concentration. Environ. Health Perspect., 111(14): 1707–1711.
- Louis, E.D., Applegate, L., Graziano, J.H., Parides, M., Slavkovich, V. and Bhat, H. (2005). Interaction between blood lead concentration and δ-amino-levulinic acid dehydratase gene polymorphism increases the odds of essential tremor. Mov. Disord., 20(9): 1170–1177.
- Lowry, J., (2009). Lakhurst Acres, ME: Compliance issues engineering problems and solutions. U.S. EPA Sixth annual drinking water workshop: Small drinking water system challenges and solutions. August 4-6, 2009. Cincinatti, Ohio.
- Lowry, J., (2010). Corrosion control with air stripping. American Water Work Association. Inorganic Contaminants Workshop, Denver, Colorado.
- Lundström, N.G., Nordberg, G., Englyst, V., Gerhardsson, L., Hagmar, L., Jin, T., Rylander, L. and Wall, S. (1997). Cumulative lead exposure in relation to mortality and lung cancer morbidity in a cohort of primary smelter workers. Scand. J. Work Environ. Health, 23(1): 24–30.
- Lustberg, M. and Silbergeld, E. (2002). Blood lead levels and mortality. Arch. Intern. Med., 162(21): 2443–2449. Lytle, D.A. and Schock, M.R. (1996). Stagnation time, composition, pH and orthophosphate effects on metal leaching from brass. Office of Research and Development, U.S. Environmental Protection Agency, Cincinnati, Ohio (EPA/600/R-96/103).
- Lytle, D.A. and Schock, M.R. (2000). Impact of stagnation time on metal dissolution from plumbing materials in drinking water. J. Water Supply Res. Technol. – Aqua, 49(5): 243–257.
- Lytle, D.A., Schock, M.R., Dues, N.R. and Clark, P.J. (1993). Investigating the preferential dissolution of lead from solder particulates. J. Am. Water Works Assoc., 85(7): 104–110.
- Lytle, D.A., Sorg, T.J. and Frietch, C. (2004). Accumulation of arsenic in drinking water distribution systems. Environ. Sci. Technol., 38(20): 5365–5372.
- Maas, R.P., Patch, S.C., Kucken, D.J. and Peek, B.T. (1991) A multi-state study of the effectiveness of various corrosion inhibitors in reducing residential lead levels. In: Proceedings of the 1991 AWWA Annual Conference, Philadelphia, PA. American Water Works Association, Denver, Colorado.
- Maas, R.P., Patch, S.C. and Gagnon, A.M. (1994). The dynamics of lead in drinking water in U.S. workplaces and schools. J. Am. Ind. Hyg. Assoc., 55: 829–832.
- Maas, R.P., Patch, S.C., Pandolfo, T.J., Druhan, J.L. and Gandy, N.F. (2005). Lead content and exposure from children's and adult's jewelry products. Bull. Environ. Contam. Toxicol., 74(3): 437–444.
- Mahaffey, K.R. (1991). Biokinetics of lead during pregnancy. Fundam. Appl. Toxicol., 16(1): 15–16.
- Maizlish, N.A., Parra, G. and Feo, O. (1995). Neurobehavioural evaluation of Venezuelan workers exposed to inorganic lead. Occup. Environ. Med., 52(6): 408–414.
- Manitoba Conservation (2007). Concentrations of metals and other elements in surface soils of Flin Flon, Manitoba and Creighton, Saskatchewan, 2006. Manitoba Conservation, Winnipeg, Manitoba (No. 2007-01).
- Manitoba Conservation and Water Stewardship (2013). Personal communication from K.Philip.
- Mantere, P., Hänninen, H. and Hernberg, S. (1982). Subclinical neurotoxic lead effects: two-year follow-up studies with psychological test methods. Neurobehav. Toxicol. Teratol., 4(6): 725–727.
- Manton, W.I., Rothenberg, S.J. and Manalo, M. (2001). The lead content of blood serum. Environ. Res., 86(3): 263–273.
- Mao, P. and Molnar, J.J. (1967). The fine structure and histochemistry of lead-induced renal tumors in rats. Am. J. Pathol., 50(4): 571–603.
- Marino, P.E., Franzblau, A., Lilis, R. and Landrigan, P.J. (1989). Acute lead poisoning in construction workers: the failure of current protective standards. Arch. Environ. Health, 44(3): 140–145.
- Maslat, A.O. and Haas, H.J. (1989). Mutagenic effects of lead (II) bromide. J. Trace Elem. Electrolytes Health Dis., 3(4): 187–191.
- Matte, T.D., Figueroa, J.P., Burr, G., Flesch, J.P., Keenlyside, R.A. and Baker, E.L. (1989). Lead exposure among lead-acid battery workers in Jamaica. Am. J. Ind. Med., 16(2): 167–177.
- Mazumdar, M., Bellinger, D.C., Gregas, M., Abanilla, K., Bacic, J. and Needleman, H.L. (2011). Low-level environmental lead exposure in childhood and adult intellectual function: a follow-up study. Environ. Health, 10(1): 24.
- McCoy, L., Richfield, E.K. and Cory-Slechta, D.A. (1997). Regional decreases in α-[3H]amino-3-hydroxy-5-methylisoxazole-4-propionic acid ([3H]AMPA) and 6-[3H] cyano-7-nitroquinoxaline-2,3-dione ([3H]CNQX) binding in response to chronic low-level lead exposure: reversal versus potentiation by chronic dopamine agonist treatment. J. Neurochem., 69(6): 2466–2476.
- McDonald, L.T., Rasmussen, P.E., Chenier, M. and Levesque, C. (2010). Wipe sampling methodologies to assess exposures to lead and cadmium in urban Canadian homes. In: Proceedings of the Annual International Conference on Soils, Sediments, Water and Energy. Vol. 15, Article 6. Available at: http://scholarworks.umass.edu/soilsproceedings/vol15/iss1/6/
- McFadden, M., Giani, R., Kwan, P. and Reiber, S.H. (2011). Contributions to drinking water lead from galvanized iron corrosion scales. Journal AWWA, 103:4:76.
- McNeill, F.E., Stokes, L., Brito, J.A.A., Chettle, D.R. and Kaye, W.E. (2000). 109Cd K x ray fluorescence measurements of tibial lead content in young adults exposed to lead in early childhood. Occup. Environ. Med., 57(7): 465–471.
- Mendola, P., Brett, K., DiBari, J.N., Pollack, A.Z., Tandon, R. and Shenassa, E.D. (2013). Menopause and lead body burden among US women aged 45–55, NHANES 1999–2010. Environ. Res., 121: 110–113.
- Menke, A., Muntner, P., Batuman, V., Silbergeld, E.K. and Guallar, E. (2006). Blood lead below 0.48 µmol/L (10 µg/dL) and mortality among US adults. Circulation, 114(13): 1388–1394.
- Ministère du Développement durable, de l'Environnement et des Parcs du Québec (2017). Personal communication with C. Robert.
- Miranda, M.L., Kim, D., Galeano, M.A.O., Paul, C.J., Hull, A.P. and Morgan, S.P. (2007). The relationship between early childhood blood lead levels and performance on end-of-grade tests. Environ. Health Perspect., 115(8): 1242–1247.
- Miranda, M.L., Anthopolos, R. and Hastings, D. (2011). A geospatial analysis of the effects of aviation gasoline on childhood blood lead levels. Environ. Health Perspect., 119(10): 1513–1516.
- Moller, L. and Kristensen, T.S. (1992). Blood lead as a cardiovascular risk factor. Am. J. Epidemiol., 136(9): 1091–1100.
- Moore, M.R., Meredith, P.A., Watson, W.S., Sumner, D.J., Taylor, M.K. and Goldberg, A. (1980). The percutaneous absorption of lead-203 in humans from cosmetic preparations containing lead acetate, as assessed by whole-body counting and other techniques. Food Cosmet. Toxicol., 18(4): 399–405.
- Morgan, R.E., Levitsky, D.A. and Strupp, B.J. (2000). Effects of chronic lead exposure on learning and reaction time in a visual discrimination task. Neurotoxicol. Teratol., 22(3): 337–345.
- Muldoon, S.B. (1996). Effects of blood lead levels on cognitive function of older women. Neuroepidemiology, 15(2): 62–72.
- Muntner, P., He, J., Vupputuri, S., Coresh, J. and Batuman, V. (2003). Blood lead and chronic kidney disease in the general United States population: results from NHANES III. Kidney Int., 63(3): 1044–1050.
- Muro, L.A. and Goyer, R.A. (1969). Chromosome damage in experimental lead poisoning. Arch. Pathol., 87(6): 660–663.
- Murphy, E.A. (1993). Effectiveness of flushing on reducing lead and copper levels in school drinking water. Environ. Health Perspect., 101(3): 240–241.
- Murthy, R.C., Gupta, S.K. and Saxena, D.K. (1995). Nuclear alterations during acrosomal cap formation in spermatids of lead-treated rats. Reprod. Toxicol., 9(5): 483–489.
- Naicker, N., Norris, S.A., Mathee, A., Becker, P. and Richter, L. (2010). Lead exposure is associated with a delay in the onset of puberty in South African adolescent females: findings from the birth to twenty cohort. Sci. Total Environ., 408(21): 4949–4954.
- NAS (1972). Lead: airborne lead in perspective. National Academy of Sciences, Washington, D.C. (No. 71177).
- Nash, D., Magder, L., Lustberg, M., Sherwin, R.W., Rubin, R.J., Kaufmann, R.B. and Silbergeld, E.K. (2003). Blood lead, blood pressure, and hypertension in perimenopausal and postmenopausal women. J. Am. Med. Assoc., 289(12): 1523–1532.
- Navas-Acien, A., Selvin, E., Sharrett, A.R., Calderon-Aranda, E., Silbergeld, E. and Guallar, E. (2004). Lead, cadmium, smoking, and increased risk of peripheral arterial disease. Circulation, 109(25): 3196–3201.
- Navas-Acien, A., Guallar, E., Silbergeld, E.K. and Rothenberg, S.J. (2007). Lead exposure and cardiovascular disease—A systematic review. Environ. Health Perspect., 115(3): 472–482.
- Navas-Acien, A., Schwartz, B.S., Rothenberg, S.J., Hu, H., Silbergeld, E.K. and Guallar, E. (2008). Bone lead levels and blood pressure endpoints: a meta-analysis. Epidemiology, 19(3): 496–504.
- Nawrot, T.S., Thijs, L., Den Hond, E.M., Roels, H.A. and Staessen, J.A. (2002). An epidemiological re-appraisal of the association between blood pressure and blood lead: a meta-analysis. J. Hum. Hypertens., 16(2): 123–131.
- Nayak, B.N., Ray, M., Persaud, T.V.N. and Nigli, M. (1989). Relationship of embryotoxicity to genotoxicity of lead nitrate in mice. Exp. Pathol., 36(2): 65–73.
- Ndzangou, S.O., Richer-LaFlèche, M. and Houle, D. (2006). Anthropogenic Pb accumulation in forest soils from Lake Clair watershed: Duchesnay Experimental Forest (Québec, Canada). Appl. Geochem., 21(12): 2135–2147.
- Needleman, H.L. and Gatsonis, C.A. (1990). Low-level lead exposure and the IQ of children. A meta-analysis of modern studies. J. Am. Med. Assoc., 263(5): 673–678.
- Needleman, H.L., Riess, J.A., Tobin, M.J., Biesecker, G.E. and Greenhouse, J.B. (1996). Bone lead levels and delinquent behavior. J. Am. Med. Assoc., 275(5): 363–369.
- Nelson, B.K., Moorman, W.J., Schrader, S.M., Shaw, P.B. and Krieg, E.F., Jr. (1997). Paternal exposure of rabbits to lead: behavioral deficits in offspring. Neurotoxicol. Teratol., 19(3): 191–198.
- Nestmann, E.R., Matula, T.I., Douglas, G.R., Bora, K.C. and Kowbel, D.J. (1979). Detection of the mutagenic activity of lead chromate using a battery of microbial tests. Mutat. Res., 66(4): 357–365.
- Neuman, W.E. (1995). AWWC experience with zinc orthophosphate treatment. J. N. Engl. Water Works Assoc., 109: 57–60.
- Nevin, R. (2000). How lead exposure relates to temporal changes in IQ, violent crime, and unwed pregnancy. Environ. Res., 83: 1–22.
- Newfoundland and Labrador Department of Environment and Conservation (2011). Personal communication with H. Khan.
- Ngueta, G., Prévost, M., Deshomme, E., Abdous, B., Gauvin, D. and Levallois, P. (2014). Exposure of young children to household water lead in the Montreal area (Canada): the potential influence of winter-to-summer changes in water lead levels on children's blood lead concentration. Environ. Int., 73: 57–65.
- Nguyen, C., Edwards, M., Stone, K., Clark, B., Gagnon, G. and Knowles, A. (2010). Impact of chloride:sulfate mass ratio (CSMR) changes on lead leaching in potable water. Water Research Foundation and U.S. Environmental Protection Agency, Denver, Colorado.
- NHMRC (2011). Australian drinking water guidelines. National Health and Medical Research Council. Available at: https://nhmrc.gov.au/about-us/publications/australian-drinking-water-guidelines.
- Nicolescu, R., Petcu, C., Cordeanu, A., Fabritius, K., Schlumpf, M., Krebs, R., Krämer, U. and Winneke, G. (2010). Environmental exposure to lead, but not other neurotoxic metals, relates to core elements of ADHD in Romanian children: performance and questionnaire data. Environ. Res., 110(5): 476–483.
- Nigg, J.T., Knottnerus, G.M., Martel, M.M., Nikolas, M., Cavanagh, K., Karmaus, W. and Rappley, M.D. (2008). Low blood lead levels associated with clinically diagnosed attention-deficit/hyperactivity disorder and mediated by weak cognitive control. Biol. Psychiatry, 63(3): 325–331.
- Nigg, J.T., Nikolas, M., Knottnerus, G.M., Cavanagh, K. and Friderici, K. (2010). Confirmation and extension of association of blood lead with attention-deficit/hyperactivity disorder (ADHD) and ADHD symptom domains at population-typical exposure levels. J. Child Psychol. Psychiatry, 51(1): 58–65.
- Nordberg, M., Winblad, B., Fratiglioni, L. and Basun, H. (2000). Lead concentrations in elderly urban people related to blood pressure and mental performance: results from a population-based study. Am. J. Ind. Med., 38(3): 290–294.
- NRCC (2010). National Plumbing Code. National Research Council of Canada, Ottawa, Ontario.
- 2010 National Plumbing Code of Canada. 2013 Revisions Package. National Research Council of Canada, Ottawa, Ontario. Available at: www.nrc-cnrc.gc.ca/obj/doc/2010_npc_revisions_november2013.pdf
- NSF (1977). Transport and distribution in a watershed ecosystem. In: W.R. Boggess (ed.), Lead in the environment. National Science Foundation, Washington, D.C. pp. 105–133.
- NSF/ANSI (2017a). NSF International/American National Standards Institute Standard 53: Drinking water treatments units—Health effects. NSF International, Ann Arbor, Michigan.
- NSF/ANSI (2017b). NSF International/American National Standards Institute Standard 58: Reverse osmosis drinking water treatment systems. NSF International, Ann Arbor, Michigan.
- NSF/ANSI (2017c). NSF International/American National Standards Institute Standard 62: Drinking water distillation system. NSF International, Ann Arbor, Michigan.
- NSF/ANSI (2017d). NSF International/American National Standards Institute Standard 61: Drinking water system components—health effects. NSF International, Ann Arbor, Michigan.
- NSF/ANSI (2016). NSF International/American National Standards Institute Standard 372: Drinking water system components—lead content. NSF International, Ann Arbor, Michigan.
- OECD/UNEP (1999). Phasing lead out of gasoline: an examination of policy approaches in different countries. Organisation for Economic Co-operation and Development/United Nations Environment Programme, Paris, France.
- OEHHA (2007). Development of health criteria for school site risk assessment pursuant to Health and Safety Code 901(g): child-specific benchmark change in blood lead concentration for school site risk assessment. Office of Environmental Health Hazard Assessment, California Environmental Protection Agency, Sacramento, California. Available at: www.oehha.ca.gov/public_info/public/kids/schools041707.html
- OEHHA (2009). Public health goals for chemicals in drinking water—lead. Office of Environmental Health Hazard Assessment, California Environmental Protection Agency, Sacramento, California. Available at: www.oehha.org/water/phg/pdf/LeadfinalPHG042409.pdf
- O'Flaherty, E.J. (1991). Physiologically based models for bone-seeking elements: II. Kinetics of lead disposition in rats. Toxicol. Appl. Pharmacol., 111(2): 313–331.
- O'Flaherty, E.J. (1993). Physiologically based models for bone-seeking elements. IV. Kinetics of lead disposition in humans. Toxicol. Appl. Pharmacol., 118(1): 16–29.
- O'Flaherty, E.J. (1995a). PBK modeling for metals. Examples with lead, uranium, and chromium. Toxicol. Lett., 82–83: 367–372.
- O'Flaherty, E.J. (1995b). Physiologically based models for bone-seeking elements. V. Lead absorption and disposition in childhood. Toxicol. Appl. Pharmacol., 131(2): 297–308.
- O'Flaherty, E.J. (2000). Modeling normal aging bone loss, with consideration of bone loss in osteoporosis. Toxicol. Sci., 55(1): 171–188.
- O'Flaherty, E.J., Inskip, M.J., Franklin, C.A., Durbin, P.W., Manton, W.I. and Baccanale, C.L. (1998). Evaluation and modification of a physiologically based model of lead kinetics using data from a sequential isotope study in cynomolgus monkeys. Toxicol. Appl. Pharmacol., 149(1): 1–16.
- Oliphant, R.J. and Schock, M.R. (1996). Copper alloys and solder. In: Internal corrosion of water distribution systems. 2nd edition. American Water Works Association Research Foundation and DVGW Technologiezentrum Wasser, Denver, Colorado. pp. 269–312.
- OMOE (2001). Soil investigation and human health risk assessment for the Rodney Street community, Port Colborne (2001). Standards Development Branch, Ontario Ministry of the Environment (Report No. SDB-01 0-351 1-2001). Available at: www.archive.org/stream/soilinvesitgatio00ontauoft/soilinvesitgatio00ontauoft_djvu.txt
- OMOE (2014). Drinking water surveillance program. Years 2000–2009. Ontario Ministry of the Environment. Available at: www.ontario.ca/environment-and-energy/drinking-water-surveillance-program-dwsp-data
- Opler, M.G.A., Brown, A.S., Graziano, J., Desai, M., Zheng, W., Schaefer, C., Factor-Litvak, P. and Susser, E.S. (2004). Prenatal lead exposure, delta-aminolevulinic acid, and schizophrenia. Environ. Health Perspect., 112(5): 548.
- Opler, M.G.A., Buka, S. L., Groeger, J., McKeague, I., Wei, C., Factor-Litvak, P., Bresnahan, M., Graziano, J., Goldstein, J.M., Seidman, L.J., Brown, A.S. and Susser, E.S. (2008). Prenatal exposure to lead,[delta]-aminolevulinic acid, and schizophrenia: further evidence. Environ. Health Perspect., 116 (11): 1586.
- Osman, K., Pawlas, K., Schütz, A., Gazdzik, M., Sokal, J.A. and Vahter, M. (1999). Lead exposure and hearing effects in children in Katowice, Poland. Environ. Res., 80(1): 1–8.
- Oyasu, R., Battifora, H.A., Clasen, R.A., McDonald, J.H. and Hass, G.M. (1970). Induction of cerebral gliomas in rats with dietary lead subacetate and 2-acetylaminofluorene. Cancer Res., 30(5): 1248–1261.
- Palintest (2014). Palintest SA1100 scanning analyzer instruction manual; V05/09. Palintest Ltd., Gateshead, UK. Available at: www.palintest.com/products/sa1100-scanning-analyzer/
- Palus, J., Rydzynski, K., Dziubaltowska, E., Wyszynska, K., Natarajan, A.T. and Nilsson, R. (2003). Genotoxic effects of occupational exposure to lead and cadmium. Mutat. Res., 540(1): 19–28.
- Panagapko, D. (2009). Canadian minerals yearbook 2009—lead. Mineral and Metal Commodity Reviews, Minerals and Metals Sector, Natural Resources Canada, Ottawa, Ontario.
- Parajuli, R.P., Fujiwara, T., Umezaki, M. and Watanabe, C. (2013). Association of cord blood levels of lead, arsenic, and zinc with neurodevelopmental indicators in newborns: a birth cohort study in Chitwan Valley, Nepal. Environ. Res., 121: 45–51.
- Parajuli, R.P., Fujiwara, T., Umezaki, M., Furusawa, H. and Watanabe, C. (2014). Home environment and prenatal exposure to lead, arsenic and zinc on the neurodevelopment of six-month-old infants living in Chitwan Valley, Nepal. Neurotoxicol. Teratol., 41: 89–95.
- Patrick, L. (2006). Lead toxicity, a review of the literature. Part I: Exposure, evaluation, and treatment. Altern. Med. Rev., 11(1): 2–22.
- Payton, M., Hu, H., Sparrow, D. and Weiss, S.T. (1994). Low-level lead exposure and renal function in the Normative Aging Study. Am. J. Epidemiol., 140(9): 821–829.
- Pesch, B., Haerting, J., Ranft, U., Klimpel, A., Oelschlägel, B. and Schill, W. (2000). Occupational risk factors for renal cell carcinoma: agent-specific results from a case–control study in Germany. MURC Study Group. Multicenter Urothelial and Renal Cancer Study. Int. J. Epidemiol., 29(6): 1014–1024.
- Peters, J. L., Kubzansky, L., McNeely, E., Schwartz, J., Spiro III, A., Sparrow, D., Wright, R.O. and Hu, H. (2007). Stress as a potential modifier of the impact of lead levels on blood pressure: The normative aging study. Environ. Health Perspect., 1154–1159.
- Pieper, K.J., Krometis, L.A., Gallagher, D.L., Benham, B.L.and Edwards, M. Incidence of waterborne lead in private drinking water systems in Virginia. J.Water Health, 13(3): 897–908.
- Pocock, S.J., Smith, M. and Baghurst, P. (1994). Environmental lead and children's intelligence: a systematic review of the epidemiological evidence. Br. Med. J., 309(6963): 1189–1197.
- Popovic, M., McNeill, F.E., Chettle, D.R., Webber, C.E., Lee, C.V. and Kaye, W.E. (2005). Impact of occupational exposure on lead levels in women. Environ. Health Perspect., 113(4): 478–484.
- Pounds, J.G. and Leggett, R.W. (1998). The ICRP age-specific biokinetic model for lead: validations, empirical comparisons, and explorations. Environ. Health Perspect., 106(Suppl. 6): 1505–1511.
- Pounds, J.G., Marlar, R.J. and Allen, J.R. (1978). Metabolism of lead-210 in juvenile and adult rhesus monkeys (Macaca mulatta). Bull. Environ. Contam. Toxicol., 19(6): 684–691.
- Prince Edward Island Department of Environment, Energy and Forestry (2011). Personal communication with G. Somers.
- Quintanilla-Vega, B., Smith, D.R., Kahng, M.W., Hernandez, J.M., Albores, A. and Fowler, B.A. (1995). Lead-binding proteins in brain tissue of environmentally lead-exposed humans. Chem. Biol. Interact., 98(3): 193–209.
- Rabinowitz, M.B., Wetherill, G.W. and Kopple, J.D. (1976). Kinetic analysis of lead metabolism in healthy humans. J. Clin. Invest., 58(2): 260–270.
- Rabinowitz, M.B., Kopple, J.D. and Wetherill, G.W. (1980). Effect of food intake and fasting on gastrointestinal lead absorption in humans. Am. J. Clin. Nutr., 33(8): 1784–1788.
- Rasmussen, P.E., Subramanian, K.S. and Jessiman, B.J. (2001). A multi-element profile of house dust in relation to exterior dust and soils in the city of Ottawa, Canada. Sci. Total Environ., 267(1–3): 125–140.
- Rasmussen, P.E., Dugandzic, R., Hassan, N., Murimboh, J. and Grégoire, D.C. (2006). Challenges in quantifying airborne metal concentrations in residential environments. Can. J. Anal. Sci. Spectrosc., 51(1): 1–8.
- Rasmussen, P.E., Wheeler, A.J., Hassan, N.M., Filiatreault, A. and Lanouette, M. (2007). Monitoring personal, indoor, and outdoor exposures to metals in airborne particulate matter: risk of contamination during sampling, handling and analysis. Atmos. Environ., 41(28): 5897–5907.
- Rasmussen, P.E., Niu, J., Chenier, M., Wheeler, A.J., Nugent, M. and Gardner, H. (2009). Project (II) refined analysis and characterization methods for metals in urban residential air. NSERC Metals in the Human Environment Strategic Network (MITHE-SN) Annual Symposium, Aylmer, Quebec, January 20–21.
- Rasmussen, P.E., Beauchemin, S., Chénier, M., Levesque, C., MacLean, L.C.W., Marro, L., Jones-Otazo, H., Petrovic, S., McDonald, L.T. and Gardner, H.D. (2011). Canadian House Dust Study: lead bioaccessibility and speciation. Environ. Sci. Technol., 45(11): 4959–4965.
- Reddy, G.R. and Zawia, N.H. (2000). Lead exposure alters egr-1 DNA-binding in the neonatal rat brain. Int. J. Dev. Neurosci., 18(8): 791–795.
- Reddy, K.J., Wang, L. and Gloss, S.P. (1995). Solubility and mobility of copper, zinc and lead in acidic environments. Plant Soil, 171: 53–58.
- Regunathan, S. and Sundaresan, R. (1985). Effects of organic and inorganic lead on synaptosomal uptake, release, and receptor binding of glutamate in young rats. J. Neurochem., 44(5): 1642–1646.
- Reiber, S., Poulsam, S., Perry, S.A.L., Edwards, M.A., Patel, S. and Dodrill, D.M. (1997). A general framework for corrosion control based on utility experience. Awwa Research Foundation, Denver, Colorado.
- Rencz, A.N., Garrett, R.G., Adcok, S.W. and Bonham-Carter, G.F. (2006). Geochemical background in soil and till. Geological Survey of Canada, Ottawa, Ontario (Open File No. 5084).
- Renner, R. (2007). Lead pipe replacement should go all the way. Environ. Sci. Technol. Online News, p. 6637, October 1, 2007. Available at: http://pubs.acs.org/doi/pdf/10.1021/es0726198
- Rice, D.C. (1984). Effect of lead on schedule-controlled behaviour in monkeys. In: L.S. Seiden and R.L. Balster (eds.), Behavioral pharmacology: the current status. Alan R. Liss, New York, N.Y. pp. 473–486.
- Rice, D.C. (1985). Chronic low-lead exposure from birth produces deficits in discrimination reversal in monkeys. Toxicol. Appl. Pharmacol., 77(2): 201–210.
- Rice, D.C. (1990). Lead-induced behavioral impairment on a spatial discrimination reversal task in monkeys exposed during different periods of development. Toxicol. Appl. Pharmacol., 106(2): 327–333.
- Rice, D.C. (1992a). Behavioral effects of lead in monkeys tested during infancy and adulthood. Neurotoxicol. Teratol., 14(4): 235–245.
- Rice, D.C. (1992b). Effect of lead during different developmental periods in the monkey on concurrent discrimination performance. Neurotoxicology, 13(3): 583–592.
- Rice, D.C. (1992c). Lead exposure during different developmental periods produces different effects on FI performance in monkeys tested as juveniles and adults. Neurotoxicology, 13(4): 757–770.
- Rice, D.C. and Gilbert, S.G. (1990a). Lack of sensitive period for lead-induced behavioral impairment on a spatial delayed alternation task in monkeys. Toxicol. Appl. Pharmacol., 103(2): 364–373.
- Rice, D.C. and Gilbert, S.G. (1990b). Sensitive periods for lead-induced behavioral impairment (nonspatial discrimination reversal) in monkeys. Toxicol. Appl. Pharmacol., 102(1): 101–109.
- Rice, D.C. and Karpinski, K.F. (1988). Lifetime low-level lead exposure produces deficits in delayed alternation in adult monkeys. Neurotoxicol. Teratol., 10(3): 207–214.
- Richardson, E. (2006). Public health advisory. Hamilton Public Health Services, Hamilton, Ontario. Available at: www.hamilton.ca/NR/rdonlyres/BC070C3A-C54F-49D0-A664-F7F07372C434/0/PublicHealthAdvisorySafeWaterLead.pdf
- Richardson, E., Pigott, W., Craig, C., Lawson, M. and Mackie, C. (2011). North Hamilton Child Blood Lead Study public health report. Hamilton Public Health Services, Hamilton, Ontario.
- Ris, M.D., Dietrich, K.N., Succop, P.A., Berger, O.G. and Bornschein, R.L. (2004). Early exposure to lead and neuropsychological outcome in adolescence. J. Int. Neuropsychol. Soc., 10(2): 261–270.
- Robbiano, L., Carrozzino, R., Puglia, C.P., Corbu, C. and Brambilla, G. (1999). Correlation between induction of DNA fragmentation and micronuclei formation in kidney cells from rats and humans and tissue-specific carcinogenic activity. Toxicol. Appl. Pharmacol., 161(2): 153–159.
- Robison, S.H., Cantoni, O. and Costa, M. (1984). Analysis of metal-induced DNA lesions and DNA-repair replication in mammalian cells. Mutat. Res., 131(3–4): 173–181.
- Roe, F.J., Boyland, E., Dukes, C.E. and Mitchley, B.C. (1965). Failure of testosterone or xanthopterin to influence the induction of renal neoplasms by lead in rats. Br. J. Cancer, 19(4): 860–866.
- Roncal, C., Mu, W., Reungjui, S., Kim, K.M., Henderson, G.N., Ouyang, X., Nakagawa, T. and Johnson, R.J. (2007). Lead, at low levels, accelerates arteriolopathy and tubulointerstitial injury in chronic kidney disease. Am. J. Physiol. Renal Physiol., 293: F1391–F1396.
- Rosenman, K.D., Sims, A., Luo, Z. and Gardiner, J. (2003). Occurrence of lead-related symptoms below the current Occupational Safety and Health Act allowable blood lead levels. J. Occup. Environ. Med., 45(5): 546–555.
- Rothenberg, S.J., Karchmer, S., Schnaas, L., Perroni, E., Zea, F. and Fernández Alba, J. (1994). Changes in serial blood lead levels during pregnancy. Environ. Health Perspect., 102: 876–880.
- Rothenberg, S.J., Schnaas, L., Salgado-Valladares, M., Casanueva, E., Geller, A.M., Hudnell, H.K. and Fox, D.A. (2002). Increased ERG a- and b-wave amplitudes in 7- to 10-year-old children resulting from prenatal lead exposure. Invest. Ophthalmol. Vis. Sci., 43(6): 2036–2044.
- Roy, N.K. and Rossman, T.G. (1992). Mutagenesis and comutagenesis by lead compounds. Mutat. Res., 298(2): 97–103.
- Saint-Laurent, D., St-Laurent, J., Duplessis, P. and Lavoie, L. (2010). Isotopic record of lead contamination in alluvial soils and tree rings on recent floodplains (southern Québec, Canada). Water Air Soil Pollut., 209(1–4): 451–466.
- Sallmén, M., Lindbohm, M.L., Anttila, A., Taskinen, H. and Hemminki, K. (2000). Time to pregnancy among the wives of men occupationally exposed to lead. Epidemiology, 11(2): 141–147.
- Sandvig, A., Boyd, G., Kirmeyer, G., Edwards, M., Triantafyllidou, S. and Murphy, B. (2007). Performance and metal release of non-leaded brass meters, components and fittings. Water Research Foundation, Denver, Colorado (Awwa Research Foundation Project No. 91174).
- Sandvig, A., Kwan, P., Kirmeyer, G., Maynard, B., Mast, D., Trussell, R.R., Trussell, S., Cantor, A. and Prescott, A. (2008). Contribution of service line and plumbing fixtures to lead and copper rule compliance issues. Water Research Foundation, Denver, Colorado (Awwa Research Foundation Project No. 90721).
- Sandvig, A.M., Triantafyllidou, S., Edwards, M., Heumann, D., Boyd, G. and Kirmeyer, G. (2009). Nonleaded brass—A summary of performance and costs. J. Am. Water Works Assoc., 101(7): 83–94.
- Sandvig, A., Martel, K., Beggs, K., Jaffe Murray, A., Greiner, P., Kneen, K., McLellan, C., Bennet, D. and Terrell, J. (2012). Is NSF 61 relevant for chloraminating utilities? Water Research Foundation, Denver, Colorado (Water Research Foundation Project No. 4243).
- Santacruz, K.S. and Swagerty, D. (2001). Early diagnosis of dementia. Am. Fam. Physician, 63(4): 703–714.
- Saskatchewan Ministry of Environment (2011). Personal communication with S. Ferris.
- Sathyanarayana, S., Beaudet, N., Omri, K. and Karr, K. (2006). Predicting children's blood lead levels from exposure to school drinking water in Seattle, Washington, USA. Ambul. Pediatr., 6(5): 288–292.
- Sattler, J.M. (2001). Assessment of children: Cognitive applications. 4th edition. Jerome M. Sattler, San Diego, California.
- Sauer, R.M., Zook, B.C. and Garner, F.M. (1970). Demyelinating encephalomyelopathy associated with lead poisoning in nonhuman primates. Science, 169(3950): 1091–1093.
- Sax, N.I. and Lewis, R.J. (eds.). (1989). Dangerous properties of industrial materials. 7th edition. van Nostrand Reinhold, New York, N.Y. [cited in ATSDR, 1999].
- SCC (2015). Directory of accredited product, process and service certification bodies. Standards Council of Canada, Ottawa, Ontario. Available at: www.scc.ca/en/accreditation/product-process-and-service-certification/directory-of-accredited-clients
- Schell, L.M., Czerminski, S., Stark, A.D., Parsons, P.J., Gomez, M. and Samelson, R. (2000). Variation in blood lead and hematocrit levels during pregnancy in a socioeconomically disadvantaged population. Arch. Environ. Health, 55: 134–140.
- Schell, L.M., Denham, M., Stark, A.D., Gomez, M., Ravenscroft, J., Parsons, P.J., Aydermir, A. and Samelson, R. (2003). Maternal blood lead concentration, diet during pregnancy, and anthropometry predict neonatal blood lead in a socioeconomically disadvantaged population. Environ. Health Perspect., 111: 195–200.
- Schnaas, L., Rothenberg, S.J., Perroni, E., Martínez, S., Hernández, C. and Hernández, R.M. (2000). Temporal pattern in the effect of postnatal blood lead level on intellectual development of young children. Neurotoxicol. Teratol., 22(6): 805–810.
- Schnaas, L., Rothenberg, S.J., Flores, M.F., Martinez, S., Hernandez, C., Osorio, E., Velasco, S.R. and Perroni, E. (2006). Reduced intellectual development in children with prenatal lead exposure. Environ. Health Perspect., 114(5): 791–797.
- Schober, S.E., Mirel, L.B., Graubard, B.I., Brody, D.J. and Flegal, K.M. (2006). Blood lead levels and death from all causes, cardiovascular disease, and cancer: results from the NHANES III mortality study. Environ. Health Perspect., 114(10): 1538–1541.
- Schock, M.R. (1990). Causes of temporal variability of lead in domestic plumbing systems. Environ. Monit. Assess., 15(1): 59–82.
- Schock, M.R. (2005). Distribution systems as reservoirs and reactors for inorganic contaminants. In: Distribution system water quality challenges in the 21st century: a strategic guide. American Water Works Association, Denver, Colorado.
- Schock, M. R., and Lemieux, F. G. (2010). Challenges in addressing variability of lead in domestic plumbing. Water Science & Technology: Water Supply-WSTWS, 10(5), 793–799.
- Schock, M. and Lytle, D. (2011). Chapter 20: Internal corrosion and deposition control. In: J.K. Edzwald (ed.), Water quality and treatment: a handbook on drinking water. 6th edition. McGraw Hill and American Water Works Association, Denver, Colorado.
- Schock, M.R. and Neff, C.H. (1988). Trace metal contamination from brass fittings. J. Am. Water Works Assoc., 80(11): 47–56.
- Schock, M.R., Wagner, I. and Oliphant, R.J. (1996). Corrosion and solubility of lead in drinking water. In: Internal corrosion of water distribution systems. 2nd edition. American Water Works Association Research Foundation and DVGW Technologiezentrum Wasser, Denver, Colorado. pp. 131–230.
- Schock, M.R., Hyland, R.N. and Welch, M.M. (2008). Occurrence of contaminant accumulation in lead pipe scales from domestic drinking-water distribution systems. Environ. Sci. Technol., 42(12): 4285–4291.
- Schock, M.R., Cantor, A., Triantafyllidou, S., Desantis, M.K. and Scheckel, K.G. (2014). Importance of pipe deposits to Lead and Copper Rule compliance. J. Am. Water Works Assoc., 106(7): E336–E349.
- Schütz, A., Bergdahl, I.A., Ekholm, A. and Skerfving, S. (1996). Measurement by ICP-MS of lead in plasma and whole blood of lead workers and controls. Occup. Environ. Med., 53(11): 736–740.
- Schwartz, J. (1994a). Low-level lead exposure and children's IQ: a meta-analysis and search for a threshold. Environ. Res., 65(1): 42–55.
- Schwartz, J. (1994b). Societal benefits of reducing lead exposure. Environ. Res., 66: 105–124.
- Schwartz, J. (1995). Lead, blood pressure, and cardiovascular disease in men. Arch. Environ. Health, 50(1): 31–37.
- Schwartz, J. and Otto, D. (1991). Lead and minor hearing impairment. Arch. Environ. Health, 46(5): 300–305.
- Scinicariello, F., Abadin, H.G. and Edward Murray, H. (2011). Association of low-level blood lead and blood pressure in NHANES 1999–2006. Environ. Res., 111(8): 1249–1257.
- Selevan, S.G., Rice, D.C., Hogan, K.A., Euling, S.Y., Pfahles-Hutchens, A. and Bethel, J. (2003). Blood lead concentration and delayed puberty in girls. N. Engl. J. Med., 348(16): 1527–1536.
- SENES Consultants Ltd. (2012). Blood lead action levels: information for physicians and public health practitioners on the measurement, interpretation and follow-up of blood lead concentrations. SENES Consultants Ltd., Richmond Hill, Ontario.
- Senut, M.C., Sen, A., Cingolani, P., Shaik, A., Land, S.J. and Ruden, D.M. (2014). Lead exposure disrupts global DNA methylation in human embryonic stem cells and alters their neuronal differentiation. Toxicol. Sci., 139(1): 142–161.
- Seppalainen, A.M., Hernberg, S., Vesanto, R. and Kock, B. (1983). Early neurotoxic effects of occupational lead exposure: a prospective study. Neurotoxicology, 4(2): 181–192.
- Shannon, M. and Graef, J.W. (1989). Lead intoxication from lead-contaminated water used to reconstitute infant formula. Clin. Pediatr., 28: 380–382.
- Sharrett, A.R., Carter, A.P., Orheim, R.M. and Feinleib, M. (1982). Daily intake of lead, cadmium, copper, and zinc from drinking water: the Seattle study of trace metal exposure. Environ. Res., 28: 456–475.
- Sheffet, A., Thind, I., Miller, A.M. and Louria, D.B. (1982). Cancer mortality in a pigment plant utilizing lead and zinc chromates. Arch. Environ. Health, 37(1): 44–52.
- Shen, X.M., Yan, C.H., Guo, D., Wu, S.M., Li, R.Q., Huang, H., Ao, L.M., Zhou, J.D., Hong, Z.Y., Xu, J.D., Jin, X.M. and Tang, J.M. (1998). Low-level prenatal lead exposure and neurobehavioral development of children in the first year of life: a prospective study in Shanghai. Environ. Res., 79(1): 1–8.
- Sherlock, J.C., Ashby, D., Delves, H.T., Forbes, G.I., Moore, M.R., Patterson, W.J., Pocock, S.J., Quinn, M.J., Richards, W.N. and Wilson, T.S. (1984). Reduction in exposure to lead from drinking water and its effect on blood lead concentrations. Hum. Toxicol., 3(5): 383–392.
- Shiau, C.Y., Wang, J.D. and Chen, P.C. (2004). Decreased fecundity among male lead workers. Occup. Environ. Med., 61(11): 915–923.
- Shih, R.A., Glass, T.A., Bandeen-Roche, K., Carlson, M.C., Bolla, K.I., Todd, A.C. and Schwartz, B.S. (2006). Environmental lead exposure and cognitive function in community-dwelling older adults. Neurology, 67(9): 1556–1562.
- Silbergeld, E.K. (2003). Facilitative mechanisms of lead as a carcinogen. Mutat. Res., 533(1–2): 121–133.
- Silbergeld, E.K., Waalkes, M. and Rice, J.M. (2000). Lead as a carcinogen: Experimental evidence and mechanisms of action. Am. J. Ind. Med., 38(3): 316–323.
- Silveira, E.A., Siman, F.D.M., De Oliveira Faria, T., Vescovi, M.V.A., Furieri, L.B., Lizardo, J.H.F., Stefanon, I., Padilha, A.S. and Vassallo, D.V. (2014). Low-dose chronic lead exposure increases systolic arterial pressure and vascular reactivity of rat aortas. Free Radic. Biol. Med., 67: 366–376.
- Singh, I. and Mavinic, D.S. (1991). Significance of building and plumbing specifics on trace metal concentrations in drinking water. Can. J. Civil Eng., 18(6): 893–903.
- Smith, D., Hernandez-Avila, M., Téllez-Rojo, M.M., Mercado, A. and Hu, H. (2002). The relationship between lead in plasma and whole blood in women. Environ. Health Perspect., 110(3): 263–268.
- Smith, D.R., Osterloh, J.D. and Russell Flegal, A. (1996). Use of endogenous, stable lead isotopes to determine release of lead from the skeleton. Environ. Health Perspect., 104(1): 60–66.
- Smith, D.R., Kahng, M.W., Quintanilla-Vega, B. and Fowler, B.A. (1998). High-affinity renal lead-binding proteins in environmentally-exposed humans. Chem. Biol. Interact., 115(1): 39–52.
- Smith, F.L.I., Rathmell, T.K. and Marcil, G.E. (1938). The early diagnosis of acute and latent plumbism. Am. J. Clin. Pathol., 8: 471–508.
- Sowers, M., Jannausch, M., Scholl, T., Li, W., Kemp, F.W. and Bogdon, J.D. (2002). Blood lead concentrations and pregnancy outcomes. Arch. Environ. Health, 57: 489–495.
- Spivey, G.H., Baloh, R.W., Brown, C.P., Browdy, B.L., Campion, D.S., Valentine, J.L., Morgan, D.E. and Culver, B.D. (1980). Subclinical effects of chronic increased lead absorption—A prospective study. III. Neurologic findings at follow-up examination. J. Occup. Med., 22(9): 607–612.
- Staessen, J.A., Lauwerys, R.R., Buchet, J.P., Bulpitt, C.J., Rondia, D., Vanrenterghem, Y., Amery, A. and the Cadmibel Study Group (1992). Impairment of renal function with increasing blood lead concentrations in the general population. N. Engl. J. Med., 327(3): 151–156.
- Staessen, J.A., Bulpitt, C.J., Fagard, R., Lauwerys, R.R., Roels, H., Thijs, L. and Amery, A. (1994a). Hypertension caused by low-level lead exposure: myth or fact? J. Cardiovasc. Risk, 1(1): 87–97.
- Staessen, J.A., Lauwerys, R.R., Bulpitt, C.J., Fagard, R., Lijnen, P., Roels, H., Thijs, L. and Amery, A. (1994b). Is a positive association between lead exposure and blood pressure supported by animal experiments? Curr. Opin. Nephrol. Hypertens., 3(3): 257–263.
- Staessen, J.A., Roels, H. and Fagard, R. (1996). Lead exposure and conventional and ambulatory blood pressure: a prospective population study. J. Am. Med. Assoc., 275(20): 1563–1570.
- Stangle, D.E., Smith, D.R., Beaudin, S.A., Strawderman, M.S., Levitsky, D.A. and Strupp, B.J. (2007). Succimer chelation improves learning, attention, and arousal regulation in lead-exposed rats but produces lasting cognitive impairment in the absence of lead exposure. Environ. Health Perspect., 115(2): 201–209.
- Stauber, J.L., Florence, T.M., Gulson, B.L. and Dale, L.S. (1994). Percutaneous absorption of inorganic lead compounds. Sci. Total Environ., 145(1–2): 55–70.
- Steenland, K. and Boffetta, P. (2000). Lead and cancer in humans: where are we now? Am. J. Ind. Med., 38(3): 295–299.
- Steenland, K., Selevan, S. and Landrigan, P. (1992). The mortality of lead smelter workers: an update. Am. J. Public Health, 82(12): 1641–1644.
- Stewart, W.F., Schwartz, B.S., Davatzikos, C., Shen, D., Liu, D., Wu, X., Todd, A.C., Shi, W., Bassett, S. and Youssem, D. (2006). Past adult lead exposure is linked to neurodegeneration measured by brain MRI. Neurology, 66(10): 1476–1484.
- Stollery, B.T. (1996). Reaction time changes in workers exposed to lead. Neurotoxicol. Teratol., 18(4): 477–483.
- Stollery, B.T., Banks, H.A., Broadbent, D.E. and Lee, W.R. (1989). Cognitive functioning in lead workers. Br. J. Ind. Med., 46(10): 698–707.
- Stollery, B.T., Broadbent, D.E., Banks, H.A. and Lee, W.R. (1991). Short term prospective study of cognitive functioning in lead workers. Br. J. Ind. Med., 48(11): 739–749.
- Sun, C.C., Wong, T.T., Hwang, Y.H., Chao, K.Y., Jee, S.H. and Wang, J.D. (2002). Percutaneous absorption of inorganic lead compounds. Am. Ind. Hyg. Assoc. J., 63(5): 641–646.
- Surkan, P.J., Zhang, A., Trachtenberg, F., Daniel, D.B., McKinlay, S. andBellinger, D.C., (2007). Neuropsychological function in children with blood lead levels <10 mg/dL.Neurotoxicology 28 (2007) 1170–1177
- Suzuki, T., Morimura, S., Diccianni, M.B., Yamada, R., Hochi, S., Hirabayashi, M., Yuki, A., Nomura, K., Kitagawa, T., Imagawa, M. and Muramatsu, M. (1996). Activation of glutathione transferase P gene by lead requires glutathione transferase P enhancer I. J. Biol. Chem., 271(3): 1626–1632.
- Sweeney, E., Yu, Z.M., Parker, P. and Dummer, T.J.B. (2017). Lead in drinking water: a response from the Atlantic PATH study. Environ. Health Rev., 60(1): 9–13.
- Tachi, K., Nishimae, S. and Saito, K. (1985). Cytogenic effects of lead acetate on rat bone marrow cells. Arch. Environ. Health, 40(3): 144–147.
- Téllez-Rojo, M.M., Bellinger, D.C., Arroyo-Quiroz, C., Lamadrid-Figueroa, H., Mercado-García, A., Schnaas-Arrieta, L., Wright, R.O., Hernández-Avila, M. and Hu, H. (2006). Longitudinal associations between blood lead concentrations lower than 10 µg/dL and neurobehavioral development in environmentally exposed children in Mexico City. Pediatrics, 118(2): e323–e330.
- Thacker, S.B., Hoffman, D.A., Smith, J., Steinberg, K. and Zack, M. (1992). Effect of low-level body burdens of lead on the mental development of children: limitations of meta-analysis in a review of longitudinal data. Arch. Environ. Health, 47(5): 336–346.
- Thier, R., Bonacker, D., Stoiber, T., Böhm, K.J., Wang, M., Unger, E., Bolt, H.M. and Degen, G. (2003). Interaction of metal salts with cytoskeletal motor protein systems. Toxicol. Lett., 140–141: 75–81.
- Tong, S., Baghurst, P., McMichael, A., Sawyer, M. and Mudge, J. (1996). Lifetime exposure to environmental lead and children's intelligence at 11–13 years: the Port Pirie cohort study. Br. Med. J., 312(7046): 1569–1575.
- Tonz, O. (1957). Changes in the kidney of rats after chronic experimental exposure to lead. Z. Ges. Exp. Med., 128: 361–377 [cited in IARC, 2006].
- Triantafyllidou, S. and Edwards, M. (2010). Contribution of galvanic corrosion to lead in water after partial lead service line replacements. Water Research Foundation, Denver, Colorado (Water Research Foundation Project No. 4088b).
- Triantafyllidou, S. and Edwards, M. (2012). Lead (Pb) in tap water and in blood: implications for lead exposure in the United States. Crit. Rev. Environ. Sci. Technol., 42: 1297–1352.
- Triantafyllidou, S., Parks, J. and Edwards, M. (2007). Lead particles in potable water. J. Am. Water Works Assoc., 99(6): 107–117.
- Triantafyllidou, S., Nguyen, K., Zhang, Y. and Edwards, M. (2013). Lead (Pb) quantification in potable water samples: implications for regulatory compliance and assessment of human exposure. Environ. Monit. Assess., 185: 1355–1365. doi: 10.1007/s10661-012-2637-6
- Tsaih, S.W., Korrick, S., Schwartz, J., Amarasiriwardena, C., Aro, A., Sparrow, D. and Hu, H. (2004). Lead, diabetes, hypertension, and renal function: the Normative Aging Study. Environ. Health Perspect., 112(11): 1178–1182.
- Tsao, D.A., Yu, H.S., Cheng, J.T., Ho, C.K. and Chang, H.R. (2000). The change of β-adrenergic system in lead-induced hypertension. Toxicol. Appl. Pharmacol., 164(2): 127–133.
- Turković, R., Werner, W. and Klinger, J. (2014). The performance of nonleaded brass materials. Water Research Foundation, Denver, Colorado (Water Research Foundation Project No. 9171).
- Turlakiewicz, Z. and Chmielnicka, J. (1985). Diethyllead as a specific indicator of occupational exposure to tetraethyllead. Br. J. Ind. Med., 42(10): 682–685.
- U.S. Department of Health and Human Services (2006). Specifications for the conduct of studies to evaluate the toxic and carcinogenic potential of chemical, biological, and physical agents in laboratory animals for the National Toxicology Program (NTP). National Toxicology Program, Public Health Service, U.S. Department of Health and Human Services, Research Triangle Park, North Carolina.
- U.S. EPA (1986). Air quality criteria for lead. Environmental Criteria and Assessment Office, Office of Health and Environmental Assessment, Office of Research and Development, U.S. Environmental Protection Agency, Research Triangle Park, North Carolina (EPA-600/8-83/028F).
- U.S. EPA (1991). 40 CFR Parts 141 and 142, Maximum Contaminant Level Goals and National Primary Drinking Water Regulations for lead and copper: final rule. U.S. Environmental Protection Agency, Washington, D.C.
- U.S. EPA (1992) Lead and Copper Rule guidance manual. U.S. Environmental Protection Agency, Washington, DC (Report No. EPA/811/B-92/002).U.S. EPA (1994a). Guidance manual for the Integrated Exposure Uptake Biokinetic Model for Lead in Children. U.S. Environmental Protection Agency, Research Triangle Park, North Carolina (EPA 540-R-93-081; PB93-963510).
- U.S. EPA (1994b). Technical support document: parameters and equations used in Integrated Exposure Uptake Biokinetic Model for Lead in Children (v0.99d). U.S. Environmental Protection Agency, Research Triangle Park, North Carolina (EPA 540-R-94-040; PB94-963505).
- U.S. EPA (1994c). Determination of trace elements by stabilized temperature graphite furnace atomic absorption. In: Methods for the determination of metals in environmental samples, Supplement I. National Exposure Research Laboratory, U.S. Environmental Protection Agency, Cincinnati, Ohio (EPA/600/R-94/111).
- U.S. EPA (1996). Three laboratory study: SA-1000 EPA Study. U.S. Environmental Protection Agency. Washington, D.C. Available at: http://www.palintest.com/wp-content/uploads/2014/07/TSI01003-The-EPA-Validation-report-for-the-Scanning-Analyzer.pdf
- U.S. EPA (1998). Small system compliance technology list for the non-microbial contaminants regulated before 1996. Office of Water, U.S. Environmental Protection Agency, Washington, D.C. (EPA 815-R-98-002).
- U.S. EPA (2000). 40 CFR Parts 141 and 142, National Primary Drinking Water Regulations for lead and copper: final rule. U.S. Environmental Protection Agency, Washington, D.C.
- U.S.EPA (2004). Lead and compounds (inorganic) Integrated Risk Information System (IRIS). U.S. Environmental Protection Agency, Washington, DC.. Available at: cfpub.epa.gov/ncea/iris/iris_documents/documents/subst/0277_summary.pdf
- U.S. EPA (2005). Lead and Copper Rule: a quick reference guide for schools and child care facilities that are regulated under the Safe Drinking Water Act. U.S. Environmental Protection Agency, Washington, D.C. (EPA 816-F-05-030).
- U.S. EPA (2006). Inorganic contaminant accumulation in potable water distribution system. Prepared by HDR Engineering Inc. for the U.S. Environmental Protection Agency, Washington, D.C. (Contract No. 68-C-02-042; Work Assignment No. 1-06).
- U.S. EPA (2007). Lead: human exposure and health risk assessment for selected case studies. Vol. I. Human exposure and health risk assessment—full-scale. Office of Air Quality Planning and Standards, U.S. Environmental Protection Agency, Research Triangle Park, North Carolina (EPA-452/R-07-014a).
- U.S. EPA (2009a). Analytical feasibility support document for the second six-year review of existing National Primary Drinking Water Regulations. Office of Water, U.S. Environmental Protection Agency, Cincinnati, Ohio (EPA 815-B-09-003).
- U.S. EPA (2009b). Development of estimated quantitation levels for the second six-year review of National Primary Drinking Water Regulations. Office of Water, U.S. Environmental Protection Agency, Cincinnati, Ohio (EPA 815-B-09-005).
- U.S. EPA (2011a). Science Advisory Board evaluation of the effectiveness of partial lead service line replacements. U.S. Environmental Protection Agency, Washington, D.C. Available at: http://yosemite.epa.gov/sab/sabproduct.nsf/964CCDB94F4E6216852579190072606F/$File/EPA-SAB-11-015-unsigned.pdf
- U.S. EPA (2011b). Reduction of Lead in Drinking Water Act, Safe Drinking Water Act (SDWA), Section 1417. U.S. Environmental Protection Agency, Washington, D.C. Available at: www.gpo.gov/fdsys/pkg/BILLS-111s3874enr/pdf/BILLS-111s3874enr.pdf
- U.S. EPA (2012). Radionuclides in drinking water, compliance options: Treatment technology descriptions. http://cfpub.epa.gov/safewater/radionuclides/radionuclides.cfm
- U.S. EPA (2014a). Analytical methods approved for drinking water compliance monitoring of inorganic contaminants and other inorganic constituents. Available at: http://water.epa.gov/scitech/drinkingwater/labcert/upload/815b14001.pdf
- U.S. EPA (2014b). National Primary Drinking Water Regulations. U.S. Environmental Protection Agency, Washington, D.C. Available at: http://water.epa.gov/drink/contaminants/index.cfm#ListVaglenov, A., Carbonell, E. and Marcos, R. (1998). Biomonitoring of workers exposed to lead. Genotoxic effects, its modulation by polyvitamin treatment and evaluation of the induced radioresistance. Mutat. Res., 418(2–3): 79–92.
- U.S. EPA (2018). 3Ts for reducing lead in drinking water in schools and childcare facilities: revised manual. U.S. Environmental Protection Agency, Washington, D.C.
- Vaglenov, A., Creus, A., Laltchev, S., Petkova, V., Pavlova, S. and Marcos, R. (2001). Occupational exposure to lead and induction of genetic damage. Environ. Health Perspect., 109(3): 295–298.
- van den Hoven, T. and Slaats, N. (2006). Lead monitoring. In: P. Quevaiviller and K.C. Thompson (eds.), Analytical methods for drinking water: advances in sampling and analysis. John Wiley & Sons, Ltd., New York, New York.
- van Esch, G.J. and Kroes, R. (1969). The induction of renal tumours by feeding basic lead acetate to mice and hamsters. Br. J. Cancer, 23(4): 765–771.
- van Esch, G.J., van Genderen, H. and Vink, H.H. (1962). The induction of renal tumours by feeding of basic lead acetate to rats. Br. J. Cancer, 16: 289–297.
- Vaziri, N.D. (2008). Mechanisms of lead-induced hypertension and cardiovascular disease. Am. J. Physiol. Heart Circ. Physiol., 295(2): H454–H465.
- Vaziri, N.D. and Gonick, H. C. (2008). Cardiovascular effects of lead exposure. Indian J. Med. Res., 128(4): 426–435.
- Vaziri, N.D., Ding, Y., Ni, Z. and Gonick, H.C. (1997). Altered nitric oxide metabolism and increased oxygen free radical activity in lead-induced hypertension: effect of lazaroid therapy. Kidney Int., 52(4): 1042–1046.
- Vaziri, N.D., Ding, Y. and Ni, Z. (1999a). Nitric oxide synthase expression in the course of lead-induced hypertension. Hypertension, 34(4 Pt. 1): 558–562.
- Vaziri, N.D., Liang, K. and Ding, Y. (1999b). Increased nitric oxide inactivation by reactive oxygen species in lead- induced hypertension. Kidney Int., 56(4): 1492–1498.
- Vaziri, N.D., Ding, Y. and Ni, Z. (2001). Compensatory up-regulation of nitric-oxide synthase isoforms in lead-induced hypertension; reversal by a superoxide dismutase-mimetic drug. J. Pharmacol. Exp. Ther., 298(2): 679–685.
- Vigeh, M., Yokoyama, K., Kitamura, F., Afshinrokh, M., Beygi, A. and Niroomanesh, S. (2010). Early pregnancy blood lead and spontaneous abortion. Women Health, 50(8): 756–766.
- Vreeburg, J. (2010). Discolouration in drinking water systems: the role of particles clarified. IWA Publishing, London, UK.
- Vupputuri, S., He, J., Muntner, P., Bazzano, L.A., Whelton, P.K. and Batuman, V. (2003). Blood lead level is associated with elevated blood pressure in blacks. Hypertension, 41(3 Pt. 1): 463–468.
- Vural, N. and Duydu, Y. (1995). Biological monitoring of lead in workers exposed to tetraethyllead. Sci. Total Environ., 171(1–3): 183–187.
- Waalkes, M.P., Diwan, B.A., Ward, J.M., Devor, D.E. and Goyer, R.A. (1995). Renal tubular tumors and atypical hyperplasias in B6C3F1 mice exposed to lead acetate during gestation and lactation occur with minimal chronic nephropathy. Cancer Res., 55(22): 5265–5271.
- Waalkes, M.P., Liu, J., Goyer, R.A. and Diwan, B.A. (2004). Metallothionein-I/II double knockout mice are hypersensitive to lead-induced kidney carcinogenesis: role of inclusion body formation. Cancer Res., 64(21): 7766–7772.
- Walker, S.R., Jamieson, H.E. and Rasmussen, P.E. (2011). Application of synchrotron microprobe methods to solid-phase speciation of metals and metalloids in house dust. Environ. Sci. Technol., 45(19): 8233–8240.
- Wang, C.L., Chuang, H.Y., Ho, C.K., Yang, C.Y., Tsai, J.L., Wu, T.S. and Wu, T.N. (2002). Relationship between blood lead concentrations and learning achievement among primary school children in Taiwan. Environ. Res., 89(1): 12–18.
- Wang, H.L., Chen, X.T., Yang, B., Ma, F.L., Wang, S., Tang, M.L., Hao, M.G. and Ruan, D.Y. (2008). Case–control study of blood lead levels and attention deficit hyperactivity disorder in Chinese children. Environ. Health Perspect., 116(10): 1401–1406.
- Wang, J., Wu, J. and Zhang, Z. (2006). Oxidative stress in mouse brain exposed to lead. Ann. Occup. Hyg., 50(4): 405–409.
- Wang, L., Chen, A.S.C. and Wang, A. (2010). Arsenic removal from drinking water by ion exchange. U.S. EPA demonstration project at Fruitland, ID. Final performance evaluation report. Cincinnati, Ohio. EPA/600/R-10/152.
- Wang, Y., Jing, H., Mehta, V., Welter, G.J. and Giammar, D.E. (2012). Impact of galvanic corrosion on lead release from aged lead service lines. Water Res., 46: 5049–5060.
- Wang, Y., Mehta, V., Welter, G.J. and Giammar, D.E. (2013). Effect of connection methods on lead release from galvanic corrosion. J. Am. Water Works Assoc., 105(7): E337–E351.
- Wasserman, G.A., Musabegovic, A., Liu, X., Kline, J., Factor-Litvak, P. and Graziano, J.H. (2000). Lead exposure and motor functioning in 4½-year-old children: the Yugoslavia Prospective Study. J. Pediatr., 137(4): 555–561.
- Waszynski, E. (1977). [Nonneoplastic and neoplastic changes in the kidneys and other organs in rodents fed lead acetate and sulfathiazole chronically.] Patol. Pol., 28(1): 101–111 (in Polish).
- Watts, S.W., Chai, S. and Clinton Webb, R. (1995). Lead acetate–induced contraction in rabbit mesenteric artery: interaction with calcium and protein kinase C. Toxicology, 99(1–2): 55–65.
- Weiss, B. (1988). Neurobehavioral toxicity as a basis for risk assessment. Trends Pharmacol. Sci., 9(2): 59–62.
- Weiss, S.T., Munoz, A., Stein, A., Sparrow, D. and Speizer, F.E. (1986). The relationship of blood lead to blood pressure in a longitudinal study of working men. Am. J. Epidemiol., 123(5): 800–808.
- Wells, A.C., Venn, J.B. and Heard, M.J. (1975). Deposition in the lung and uptake to blood of motor exhaust labelled with 203Pb. Inhaled Part., 4(Pt. 1): 175–189.
- Wells, E.M., Navas-Acien, A., Herbstman, J.B., Apelberg, B.J., Silbergeld, E.K., Caldwell, K.L., Jones, R.L., Halden, R.U., Witter, F.R. and Goldman, L.R. (2011). Low-level lead exposure and elevations in blood pressure during pregnancy. Environ. Health Perspect., 119(5): 664–669.
- Welter, G., Giammar, D., Wang, Y. and Cantor, A. (2013). Galvanic corrosion following partial lead service line replacement. Water Research Foundation, Denver, Colorado (Water Research Foundation Project No. 4349).
- Weuve, J., Korrick, S.A., Weisskopf, M.A., Ryan, L.M., Schwartz, J., Nie, H., Grodstein, F. and Hu, H. (2009). Cumulative exposure to lead in relation to cognitive function in older women. Environ. Health Perspect., 117(4): 574–580.
- White, P.D., van Leeuwen, P., Davis, B.D., Maddaloni, M., Hogan, K.A., Marcus, A.H. and Elias, R.W. (1998). The conceptual structure of the Integrated Exposure Uptake Biokinetic Model for Lead in Children. Environ. Health Perspect., 106(Suppl. 6): 1513–1530.
- WHO (1977). Lead. International Programme on Chemical Safety, World Health Organization, Geneva, Switzerland (Environmental Health Criteria 3). Available at: www.inchem.org/documents/ehc/ehc/ehc003.htm
- WHO (2010). Childhood lead poisoning. World Health Organization, Geneva, Switzerland.
- WHO (2011). Lead in drinking-water: background document for development of WHO Guidelines for Drinking-water Quality. World Health Organization, Geneva, Switzerland. Available at: www.who.int/water_sanitation_health/dwq/chemicals/lead.pdf
- WHO (2017). Guidelines for drinking-water quality, 4th edition, incorporating the 1st addendum ,Ch. 12, p. 383. World Health Organization, Geneva, Switzerland. Available at: https://www.who.int/water_sanitation_health/publications/gdwq4-with-add1-chap12.pdf?ua=1
- Williams, P.L., Sergeyev, O., Lee, M.M., Korrick, S.A., Burns, J.S., Humblet, O., DelPrato, J., Revich, B. and Hauser, R. (2010). Blood lead levels and delayed onset of puberty in a longitudinal study of Russian boys. Pediatrics, 125(5): e1088–e1096.
- Wolff, M.S., Britton, J.A., Boguski, L., Hochman, S., Maloney, N., Serra, N., Liu, Z., Berkowitz, G., Larson, S. and Forman, J. (2008). Environmental exposures and puberty in inner-city girls. Environ. Res., 107(3): 393–400.
- Wong, O. and Harris, F. (2000). Cancer mortality study of employees at lead battery plants and lead smelters, 1947–1995. Am. J. Ind. Med., 38(3): 255–270.
- Wozniak, K. and Blasiak, J. (2003). In vitro genotoxicity of lead acetate: induction of single and double DNA strand breaks and DNA–protein cross-links. Mutat. Res., 535(2): 127–139.
- Wright, R.O., Tsaih, S.W., Schwartz, J., Spiro, A., III, McDonald, K., Weiss, S.T. and Hu, H. (2003). Lead exposure biomarkers and mini-mental status exam scores in older men. Epidemiology, 14(6): 713–718.
- Wu, J., Basha, M.R., Brock, B., Cox, D.P., Cardozo-Pelaez, F., McPherson, C.A., Harry, J., Rice, D.C., Maloney, B., Chen, D., Lahiri, D.K. and Zawia, N.H. (2008). Alzheimer's disease (AD)–like pathology in aged monkeys after infantile exposure to environmental metal lead (Pb): evidence for a developmental origin and environmental link for AD. J. Neurosci., 28(1): 3–9.
- Xie, Y. and Giammar, D.E. (2011). Effects of flow and water chemistry on lead release rates from pipe scales. Water Res., 45(19): 6525–6534.
- Xu, J., Wise, J.P. and Patierno, S.R. (1992). DNA damage induced by carcinogenic lead chromate particles in cultured mammalian cells. Mutat. Res., 280(2): 129–136.
- Yang, J.L., Yeh, S.C. and Chang, C.Y. (1996). Lead acetate mutagenicity and mutational spectrum in the hypoxanthine guanine phosphoribosyltransferase gene of Chinese hamster ovary K1 cells. Mol. Carcinogen., 17(4): 181–191.
- Yang, J.L., Wang, L.C., Chang, C.Y. and Liu, T.Y. (1999). Singlet oxygen is the major species participating in the induction of DNA strand breakage and 8-hydroxydeoxyguanosine adduct by lead acetate. Environ. Mol. Mutagen., 33(3): 194–201.
- Ye, X.B., Fu, H., Zhu, J.L., Ni, W.M., Lu, Y.W., Kuang, X.Y., Yang, S.L. and Shu, B.X. (1999). A study on oxidative stress in lead-exposed workers. J. Toxicol. Environ. Health A, 57(3): 161–172.
- Yuan, W., Holland, S.K., Cecil, K.M., Dietrich, K.N., Wessel, S.D., Altaye, M., Hornung, R.W., Ris, M.D., Egelhoff, J.C. and Lanphear, B.P. (2006). The impact of early childhood lead exposure on brain organization: a functional magnetic resonance imaging study of language function. Pediatrics, 118(3): 971–977.
- Yuan, X. and Tang, C. (2001). The accumulation effect of lead on DNA damage in mice blood cells of three generations and the protection of selenium. J. Environ. Sci. Health A Tox. Hazard. Subst. Environ. Eng., 36(4): 501–508.
- Yukon Environmental Health Services (2011). Personal communication from P. Brooks.
- Zaragoza, L. and Hogan, K. (1998). The Integrated Exposure Uptake Biokinetic Model for Lead in Children: independent validation and verification. Environ. Health Perspect., 106(Suppl. 6): 1551–1556.
- Zawia, N.H. (2003). Transcriptional involvement in neurotoxicity. Toxicol. Appl. Pharmacol., 190(2): 177–188.
- Zawia, N.H., Sharan, R., Brydie, M., Oyama, T. and Crumpton, T. (1998). Sp1 as a target site for metal-induced perturbations of transcriptional regulation of developmental brain gene expression. Dev. Brain Res., 107(2): 291–298.
- Zawirska, B. (1968). [Tumours and disorders of porphyrin metabolism in rats with chronic experimental lead poisoning. I. Morphological studies.] Zentralbl. Allg. Pathol., 111(1): 1–12 (in German).
- Zawirska, B. (1981). The role of the kidneys in disorders of porphyrin metabolism during carcinogenesis induced with lead acetate. Environ. Res., 24(2): 391–408.
- Zawirska, B. and Medras, K. (1972). The role of the kidneys in disorders of porphyrin metabolism during carcinogenesis induced with lead acetate. Arch. Immunol. Ther. Exp., 20(2): 257–272.
- Zelikoff, J.T., Li, J.H., Hartwig, A., Wang, X.W., Costa, M. and Rossman, T.G. (1988). Genetic toxicology of lead compounds. Carcinogenesis, 9(10): 1727–1732.
- Zhang, W., Zhang, G.G., He, H.Z. and Bolt, H.M. (1994). Early health effects and biological monitoring in persons occupationally exposed to tetraethyl lead. Int. Arch. Occup. Environ. Health, 65(6): 395–399.
- Zhang, Y. and Edwards, M. (2011). Zinc content in brass and its influence on lead leaching. J. Am. Water Works Assoc., 103(7): 76–83.
- Ziegler, E.E., Edwards, B.B., Jensen, R.L., Mahaffey, K.R. and Fomon, S.J. (1978). Absorption and retention of lead by infants. Pediatr. Res., 12(1): 29–34.
- Zollinger, H.U. (1953). Renal adenomas and carcinomas induced in rats after chronic lead exposure, and their relationship with corresponding neoplasia in humans. Virchows Arch., 323: 697–710 [cited in IARC, 2006].
- Zota, A. R., Shenassa, E. D., and Morello-Frosch, R. (2013). Allostatic load amplifies the effect of blood lead levels on elevated blood pressure among middle-aged US adults: A cross-sectional study. Environ. Health, 12(1): 64.
Appendix A: List of acronyms
- 30MS
- 30 minutes stagnation time
- ACSL
- Advanced Continuous Simulation Language
- ADHD
- attention deficit hyperactivity disorder
- ALAD
- γ-aminolevulinic acid dehydratase
- ALARA
- as low as reasonably achievable
- ANSI
- American National Standards Institute
- APP
- amyloid precursor protein
- ASCII
- American Standard Code for Information Interchange
- ASME
- American Society of Mechanical Engineers
- ASV
- anodic stripping voltammetry
- BLL
- blood lead level
- BMD
- benchmark dose
- BMD01
- benchmark dose associated with a 1% change in response
- BMD10
- benchmark dose associated with a 10% change in response
- BMDL01
- 95% lower confidence limit on the BMD01
- BMDL10
- 95% lower confidence limit on the BMD10
- bw
- body weight
- CCME
- Canadian Council of Ministers of the Environment
- CCPSA
- Canada Consumer Product Safety Act
- CI
- confidence interval
- CPSC
- Consumer Product Safety Commission (U.S.)
- CSA
- Canadian Standards Association
- CSMR
- chloride to sulphate mass ratio
- DNA
- deoxyribonucleic acid
- DOS
- Disk Operating System
- EFSA
- European Food Safety Authority
- EPA
- Environmental Protection Agency (U.S.)
- FAO
- Food and Agriculture Organization of the United Nations
- FF
- fully flushed
- FORTRAN
- Formula Translating System (now known as Fortran)
- GC-MS
- gas chromatography/mass spectrometry
- GFAAS
- graphite furnace atomic absorption spectroscopy
- HBV
- health-based value
- HOME
- Home Observation for Measurement of the Environment
- IARC
- International Agency for Research on Cancer
- IEUBK
- Integrated Exposure Uptake Biokinetic Model for Lead in Children
- ICP
- inductively coupled plasma
- IQ
- intelligence quotient
- JECFA
- Joint FAO/WHO Expert Committee on Food Additives
- LTP
- long-term potentiation
- MAC
- maximum acceptable concentration
- MDL
- method detection limit
- MMSE
- mini-mental status exam
- MS
- mass spectrometry
- NCRMP
- National Chemical Residue Monitoring Program
- NHANES
- National Health and Nutrition Examination Survey (U.S.)
- NPC
- National Plumbing Code of Canada
- NPRI
- National Pollutant Release Inventory
- NSF
- NSF International
- NTU
- nephelometric turbidity unit
- OMOE
- Ontario Ministry of the Environment
- OR
- odds ratio
- Pb
- lead
- PBPK
- physiologically based pharmacokinetic
- PM2.5
- particulate matter having an aerodynamic diameter of less than 2.5 μm
- POE
- point of entry
- POU
- point of use
- PQL
- practical quantitation limit
- PTWI
- provisional tolerable weekly intake
- RDT
- random daytime
- RO
- reverse osmosis
- RR
- relative risk
- SCC
- Standards Council of Canada
- SM
- Standard Method
- Sp1
- specificity protein 1
- WHO
- World Health Organization