
Chlamydia, gonorrhea and infectious syphilis in Canada: 2021 surveillance data update
Download in PDF format
(930 KB, 1 page)
Organization: Public Health Agency of Canada
Type: Infographic
Date published: October 2023
ISBN: 978-0-660-68083-5
Cat.: HP40-284/2021E-PDF
Pub.: 230461
Impact of the COVID-19 pandemic on reported chlamydia, gonorrhea and infectious syphilis case counts and rates in 2020 and 2021
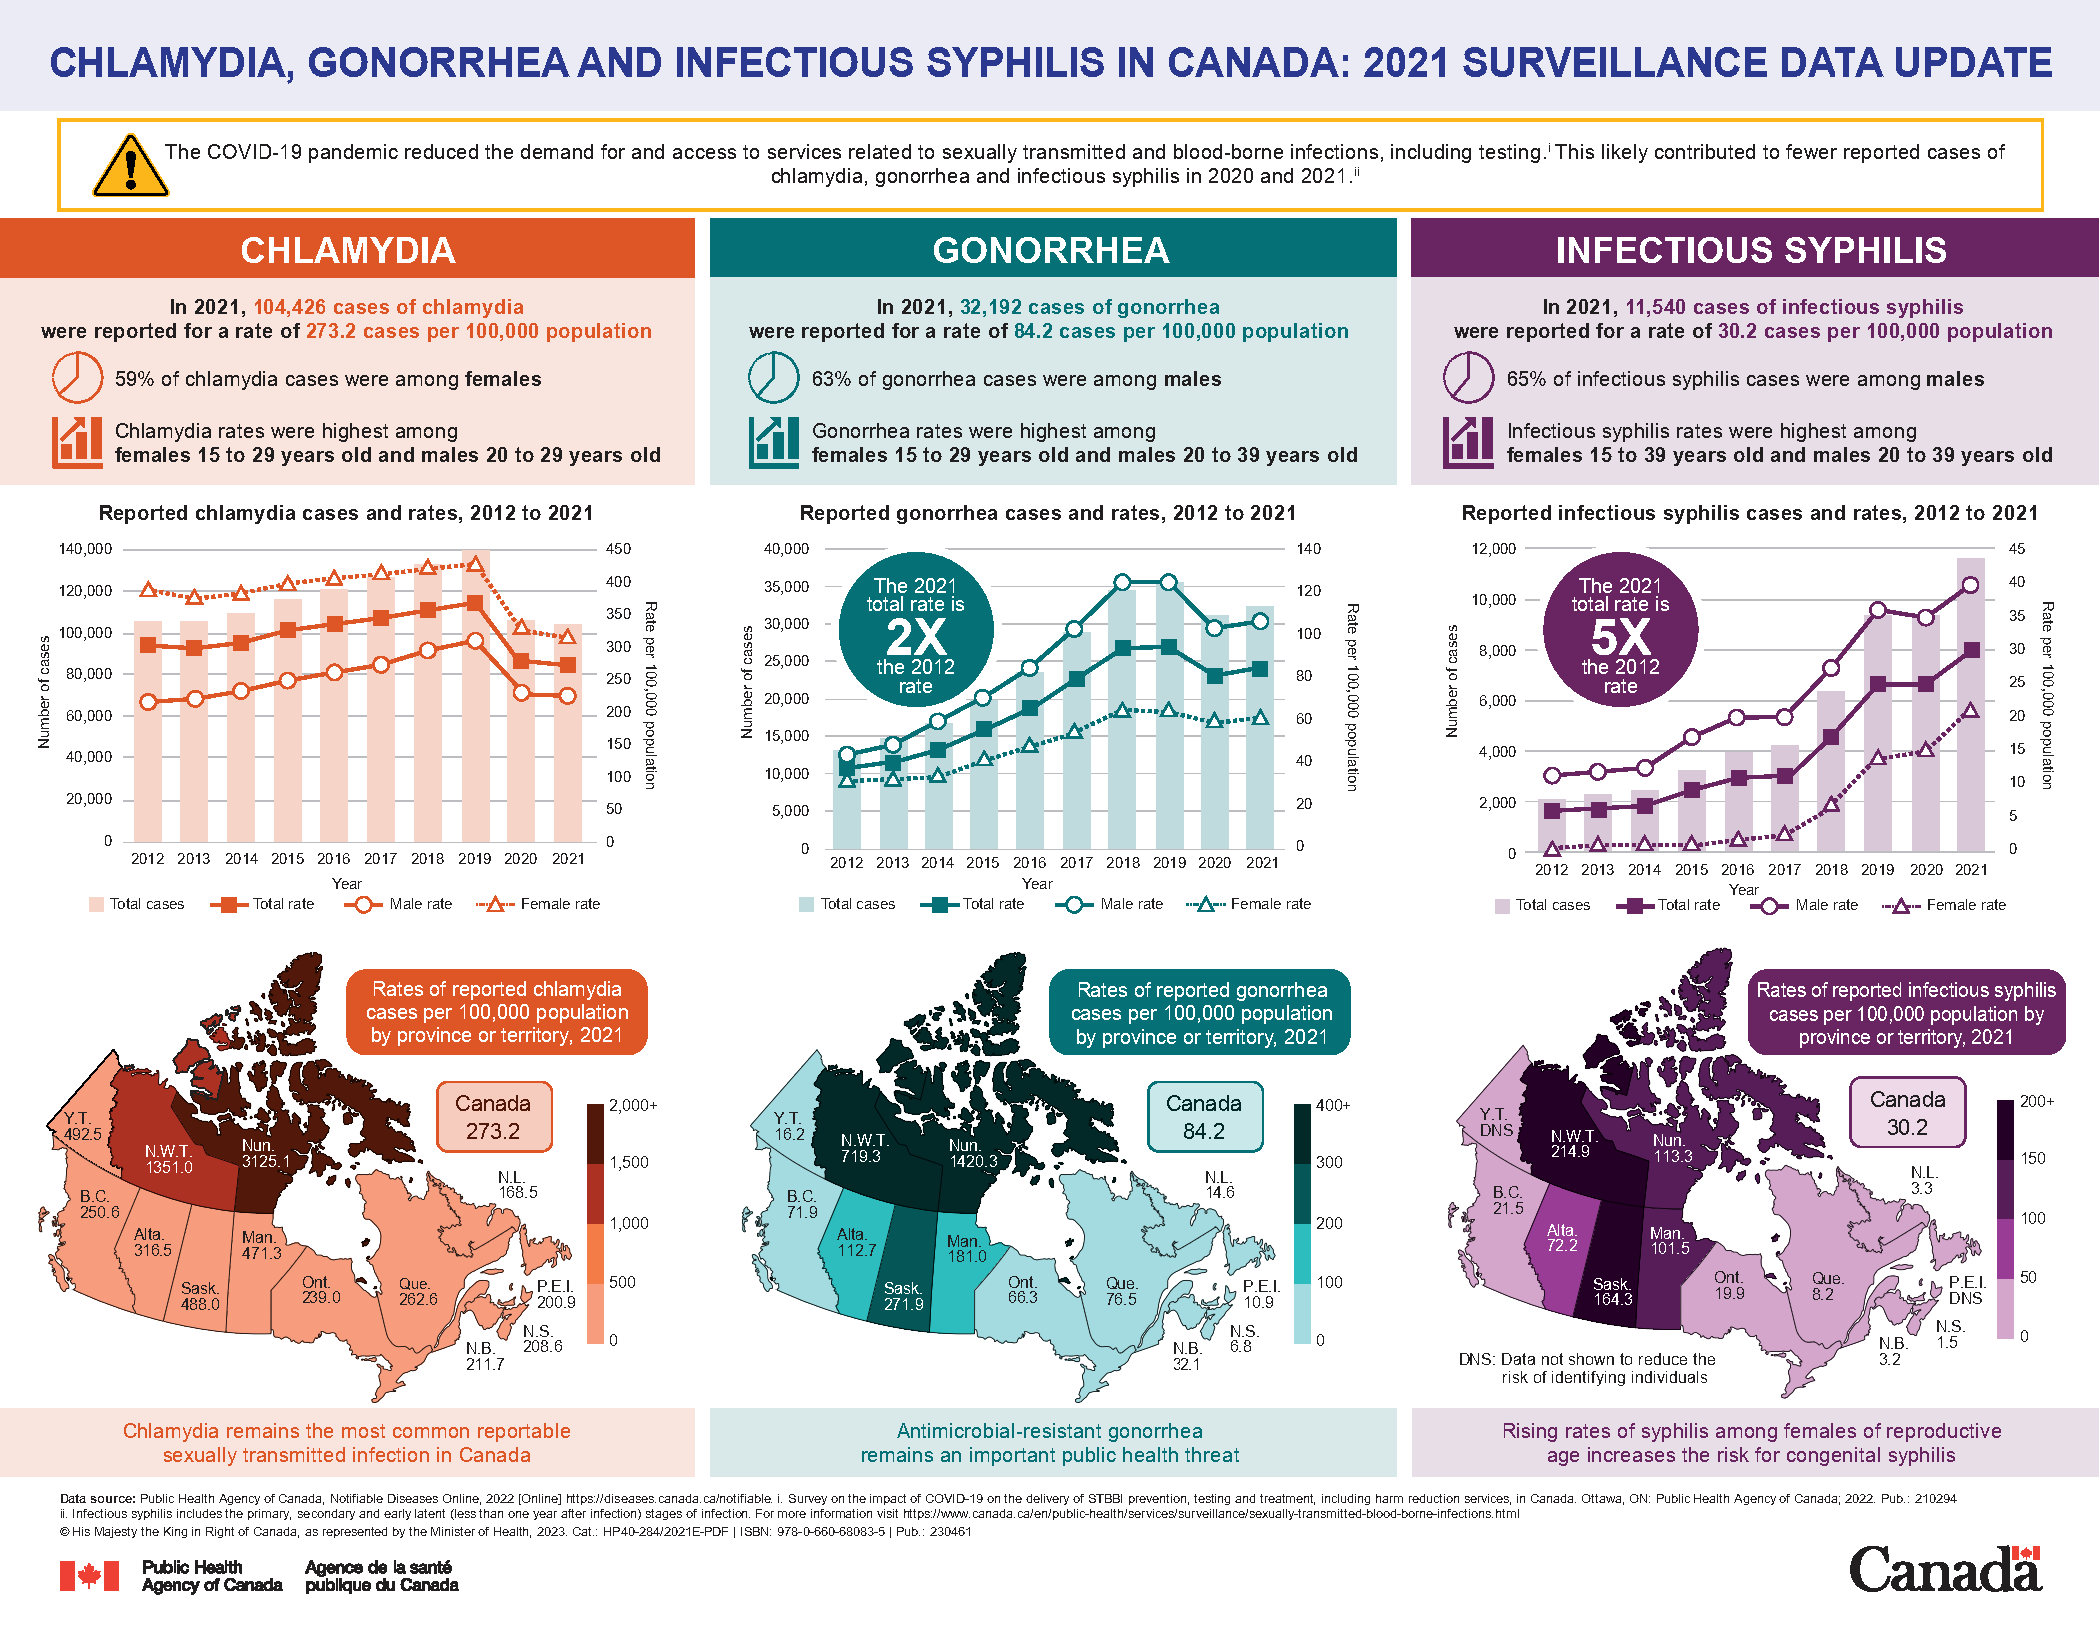
The COVID-19 pandemic reduced the demand for and access to services related to sexually transmitted and blood-borne infections (STBBIs), including testing.Footnote 1 This likely contributed to fewer reported cases of chlamydia, gonorrhea and infectious syphilis in 2020 and 2021.Footnote 2 As parts of the country experienced various levels of disruptions due to COVID-19 during 2020 and 2021, comparisons of reported chlamydia, gonorrhea and infectious syphilis case counts and rates between the provinces and territories may also be inaccurate.
Key trends in chlamydia, gonorrhea and infectious syphilis in Canada
Chlamydia
Chlamydia remains the most common reportable sexually transmitted infection (STI) in Canada. Reported rates of chlamydia in 2020 and 2021 were below pre-pandemic levels, however, rates were increasing steadily from 2012 to 2019.
Gonorrhea
Pre-pandemic, gonorrhea rates were rising rapidly. The 2021 gonorrhea rate was lower than the 2019 rate, although, 124% higher than the 2012 rate. In recent years, concern for antimicrobial-resistant gonorrhea has heightened as new gonorrhea strains continue to demonstrate resistance to antibiotic treatment.Footnote 3 When resistance occurs, the antibiotics become less effective in treating gonorrhea and gonorrhea may become untreatable.Footnote 3
Infectious syphilis
Infectious syphilis rates have been rising rapidly for years. The 2021 rate of reported infectious syphilis was 410% higher than the 2012 rate. Rapidly rising rates among reproductive-aged females have led to an increase in the number of reported cases of babies born with congenital syphilis in Canada.Footnote 4
Chlamydia
Reported chlamydia case counts and rates in Canada
Figure 1 and Table 1 show the number and rates of reported cases of chlamydia overall and by sex from 2012 to 2021. The trends in this figure and table are described below:
- In 2021, 104,426 cases of chlamydia were reported from all 13 Canadian provinces and territories for a rate of 273.2 cases per 100,000 population.
- Between 2012 and 2019, national rates of reported chlamydia cases (male, female, and other or unspecified sex) steadily increased annually (the 2019 chlamydia rate was 22% higher than the 2012 rate).
- During the first year of the COVID-19 pandemic (2020), the rate of nationally reported chlamydia cases dropped by 25% compared to 2019.
- Nationally reported rates of chlamydia remained stable between 2020 and 2021, only decreasing slightly by 2%.
Reported chlamydia case counts and rates by age group and sex in Canada
Figure 1 and Table 1 shows the number and rates of reported cases of chlamydia overall and by sex from 2012 to 2021. Figure 2 and Table 2 shows the number of reported chlamydia cases, rates and proportions (shown only in Table 2) by age group and sex in 2021. The trends in these figures and tables are described below:
- In 2021:
- 59% of reported cases of chlamydia were among females and 41% were among males
- the rate of reported chlamydia cases among females was 318.2 cases per 100,000 females
- the rate of reported chlamydia cases among males was 225.8 cases per 100,000 males
- among females, the rate of reported chlamydia cases was highest among 20- to 24-year-olds (1812.1 cases per 100,000 females) followed by 15- to 19-year-olds (1332.7 per 100,000 females)
- among males, the rate of reported chlamydia cases was highest among 20- to 24-year-olds (942.6 cases per 100,000 males) followed by 25- to 29-year-olds (694.2 per 100,000 males)
- females (35%) and males (28%) aged 20- to 24 years old had the highest proportion of reported cases of chlamydia
- From 2012 to 2021, rates of reported cases of chlamydia were consistently higher among females than males.
- Between 2012 and 2019, chlamydia rates increased for females (10%) and males (45%). Male rates rose faster annually than female rates, thereby, narrowing the gap between male and female chlamydia rates. In 2020 and 2021, rates decreased similarly among both males (1%) and females (3%).
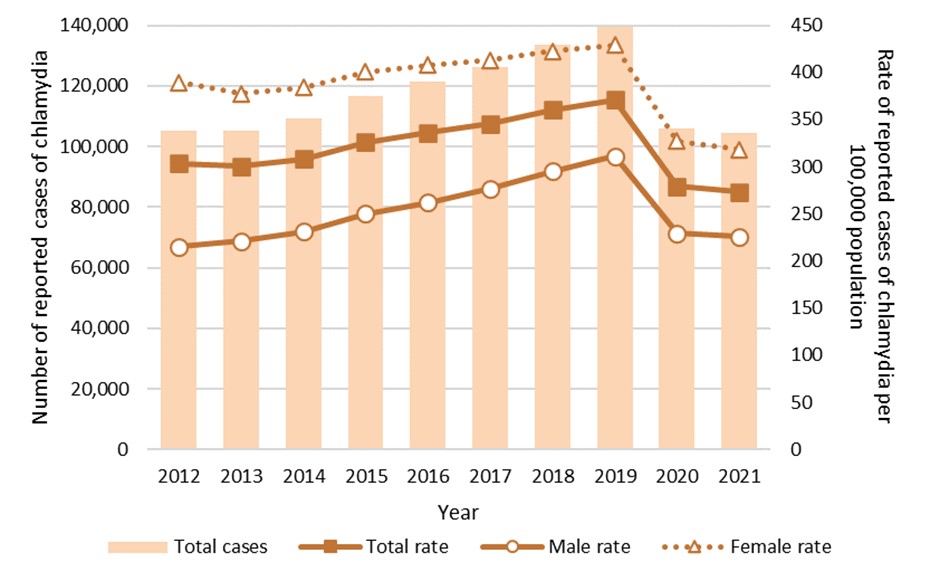
Figure 1 - Text description
| Year | Total cases | Male cases | Female cases | Total rate (per 100,000 population) | Male rate (per 100,000 males) | Female rate (per 100,000 females) |
|---|---|---|---|---|---|---|
| 2012 | 105,281 | 37,056 | 68,144 | 303.3 | 215.3 | 389.3 |
| 2013 | 105,322 | 38,508 | 66,720 | 300.2 | 221.3 | 377.3 |
| 2014 | 109,282 | 40,655 | 68,517 | 308.4 | 231.2 | 383.7 |
| 2015 | 116,445 | 44,261 | 72,017 | 326.1 | 249.9 | 400.3 |
| 2016 | 121,221 | 46,924 | 74,131 | 335.7 | 261.9 | 407.5 |
| 2017 | 126,319 | 50,143 | 75,981 | 345.7 | 276.5 | 412.7 |
| 2018 | 133,435 | 54,335 | 78,842 | 360.0 | 295.2 | 422.5 |
| 2019 | 139,562 | 58,169 | 81,177 | 371.2 | 311.4 | 429.1 |
| 2020 | 106,030 | 43,274 | 62,538 | 279.0 | 229.1 | 327.1 |
| 2021 | 104,426 | 42,902 | 61,178 | 273.2 | 225.8 | 318.2 |
| National annual chlamydia rates were calculated using the number of chlamydia cases reported to the Canadian Notifiable Disease Surveillance System as numerators and Statistics Canada July 2022 yearly population estimates as denominators. The 'total' case count and rate include all males, females and those with other or unspecified sex. There were 346 cases of chlamydia of other or unspecified sex reported in 2021. | ||||||
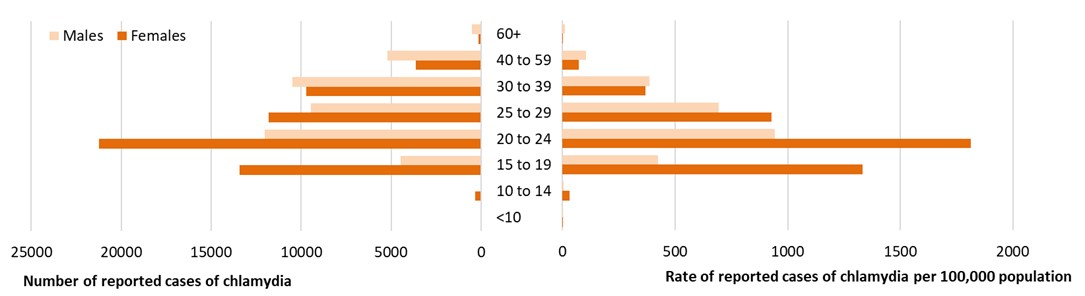
Figure 2 - Text description
| Age group (years) | Males | Females | Total | ||||||
|---|---|---|---|---|---|---|---|---|---|
| Cases (n) | Rate (per 100,000 population) | Proportion of all male cases | Cases (n) | Rate (per 100,000 population) | Proportion of all female cases | Cases (n) | Rate (per 100,000 population) | Proportion of all reported cases | |
| <10 | 28 | 1.4 | <1% | 28 | 1.5 | <1% | 59 | 1.5 | <1% |
| 10 to 14 | 38 | 3.6 | <1% | 334 | 32.6 | 1% | 374 | 17.9 | <1% |
| 15 to 19 | 4,461 | 425.1 | 11% | 13,432 | 1332.7 | 22% | 17,953 | 872.7 | 17% |
| 20 to 24 | 12,048 | 942.6 | 29% | 21,240 | 1812.1 | 35% | 33,380 | 1362.3 | 32% |
| 25 to 29 | 9,479 | 694.2 | 22% | 11,796 | 928.3 | 20% | 21,343 | 809.7 | 21% |
| 30 to 39 | 10,481 | 387.2 | 25% | 9,733 | 367.4 | 16% | 20,270 | 378.4 | 20% |
| 40 to 59 | 5,211 | 104.8 | 12% | 3,621 | 71.8 | 6% | 8,857 | 88.4 | 9% |
| 60+ | 518 | 11.4 | 1% | 140 | 2.7 | <1% | 660 | 6.8 | 1% |
| National chlamydia age rates by sex and overall, in 2021, were calculated using the number of chlamydia cases reported to the Canadian Notifiable Disease Surveillance System as numerators and Statistics Canada July 2022, 2021 population estimates as denominators. The 'total' case count and rate include all males, females and those with other or unspecified sex. There were 346 cases of chlamydia of other or unspecified sex reported in 2021. | |||||||||
Reported chlamydia case counts and rates by province and territory in Canada
In 2021, the national rate of reported chlamydia cases was 273.2 cases per 100,000 population. The following provinces and territories had rates of reported chlamydia cases above the national rate:
- Nunavut (3125.1 cases per 100,000 population)
- Northwest Territories (1351.0 cases per 100,000 population)
- Yukon (492.5 cases per 100,000 population)
- Saskatchewan (488.0 cases per 100,000 population)
- Manitoba (471.3 cases per 100,000 population)
- Alberta (316.5 cases per 100,000 population)
In 2021, the following provinces and territories had rates of reported chlamydia cases below the national rate:
- Quebec (262.6 cases per 100,000 population)
- British Columbia (250.6 cases per 100,000 population)
- Ontario (239.0 cases per 100,000 population)
- New Brunswick (211.7 cases per 100,000 population)
- Nova Scotia (208.6 cases per 100,000 population)
- Prince Edward Island (200.9 cases per 100,000 population)
- Newfoundland and Labrador (168.5 cases per 100,000 population)
Caution should be used when comparing rates across provinces and territories. Reported rates of chlamydia cases may be inflated in provinces and territories with a relatively small population size. To contextualize rates, it is important to look at the case counts per province and territory (Table 7).
In 2021, the highest number of reported cases of chlamydia were reported from Ontario (35,389 cases), Quebec (22,590 cases) and Alberta (14,064 cases).
Gonorrhea
Reported gonorrhea case counts and rates in Canada
Figure 3 and Table 3 show the number and rates of reported cases of gonorrhea overall and by sex from 2012 to 2021. The trends in this figure and table are described below:
- In 2021, 32,192 cases of gonorrhea were reported from all 13 Canadian provinces and territories for a rate of 84.2 cases per 100,000 population.
- Between 2012 and 2019, national rates of reported gonorrhea cases (male, female, and other or unspecified sex) increased annually (the 2019 rate was 151% higher than the 2012 rate).
- During the first year of the COVID-19 pandemic (2020), the rate of nationally reported gonorrhea cases dropped by 14% compared to 2019.
- Nationally reported rates of gonorrhea increased slightly (by 4%) between 2020 and 2021.
- The national rate of reported gonorrhea cases in 2021 was two times higher than the rate in 2012.
Reported gonorrhea case counts and rates by age group and sex in Canada
Figure 3 and Table 3 show the number and rates of reported cases of gonorrhea overall and by sex from 2012 to 2021. Figure 4 and Table 4 show the number of reported cases, rates and proportion of gonorrhea (shown only in Table 4) by age group and sex in 2021. The trends in these figures and tables are described below:
- In 2021:
- 63% of reported cases of gonorrhea were among males and 37% were among females
- the rate of reported gonorrhea cases among males was 106.6 cases per 100,000 males
- the rate of reported gonorrhea cases among females was 61.5 cases per 100,000 females
- among males, the rate of reported gonorrhea cases was highest among 25- to 29-year-olds (309.7 cases per 100,000 males) followed by 30- to 39-year-olds (248.5 per 100,000 males)
- among females, the rate of reported gonorrhea cases was highest among 20- to 24-year-olds (239.0 cases per 100,000 females) followed by 25- to 29-year-olds (197.5 per 100,000 females)
- From 2012 to 2021, rates of reported cases of gonorrhea were higher among males than females.
- Between 2012 and 2018, reported rates of gonorrhea increased for males (191%) and females (96%). Male rates rose faster annually than female rates, further widening the gap between male and female gonorrhea rates.
- Between 2018 and 2019, reported rates of gonorrhea remained stable among both males and females.
- Between 2019 and 2020, reported rates of gonorrhea decreased more rapidly among males (18%) than among females (7%).
- From 2020 to 2021, reported rates of gonorrhea increased similarly among both males (4%) and females (3%).
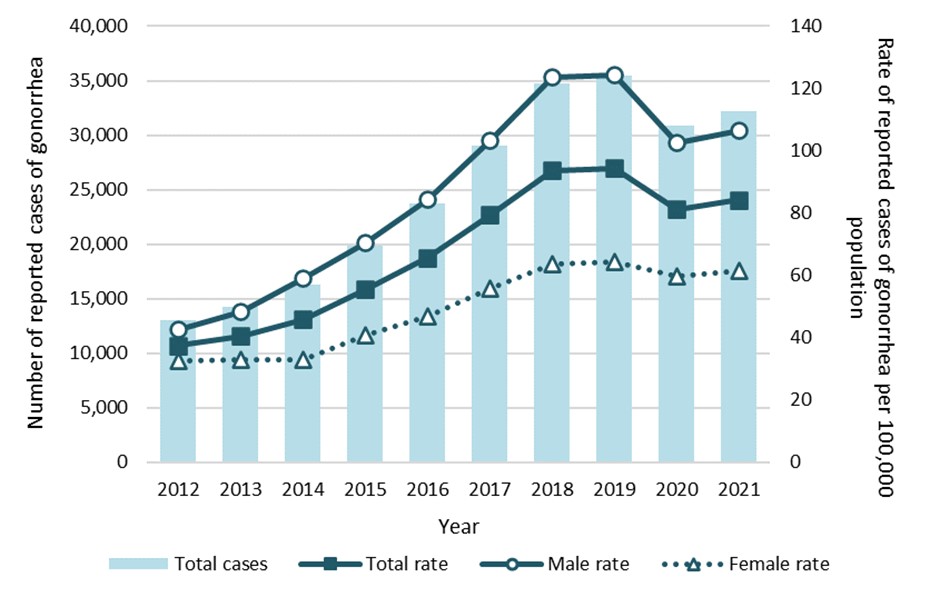
Figure 3 - Text description
| Year | Total cases | Male cases | Female cases | Total rate (per 100,000 population) | Male rate (per 100,000 males) | Female rate (per 100,000 females) |
|---|---|---|---|---|---|---|
| 2012 | 13,027 | 7,327 | 5,682 | 37.5 | 42.6 | 32.5 |
| 2013 | 14,228 | 8,394 | 5,809 | 40.6 | 48.2 | 32.9 |
| 2014 | 16,264 | 10,343 | 5,890 | 45.9 | 58.8 | 33.0 |
| 2015 | 19,817 | 12,448 | 7,337 | 55.5 | 70.3 | 40.8 |
| 2016 | 23,706 | 15,116 | 8,543 | 65.7 | 84.4 | 47.0 |
| 2017 | 29,023 | 18,725 | 10,237 | 79.4 | 103.2 | 55.6 |
| 2018 | 34,719 | 22,773 | 11,843 | 93.7 | 123.7 | 63.5 |
| 2019 | 35,476 | 23,208 | 12,169 | 94.3 | 124.2 | 64.3 |
| 2020 | 30,842 | 19,342 | 11,387 | 81.1 | 102.4 | 59.6 |
| 2021 | 32,192 | 20,258 | 11,821 | 84.2 | 106.6 | 61.5 |
| National annual gonorrhea rates were calculated using the number of gonorrhea cases reported to the Canadian Notifiable Disease Surveillance System as numerators and Statistics Canada July 2022 yearly population estimates as denominators. The 'total' case count and rate include all males, females and those with other or unspecified sex. There were 113 cases of gonorrhea of other or unspecified sex reported in 2021. | ||||||
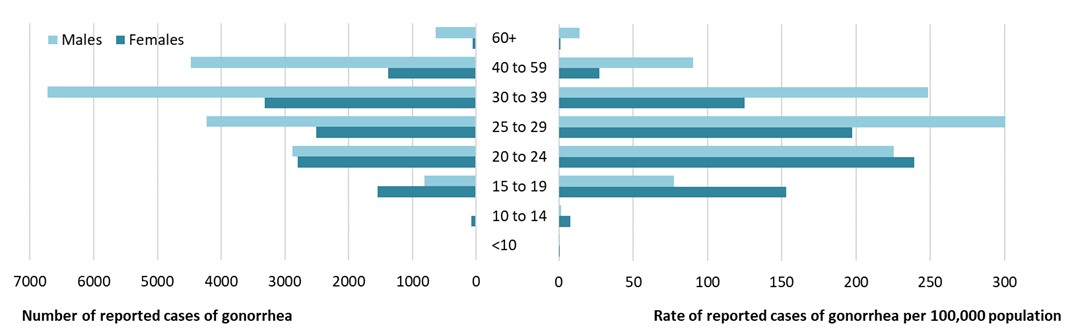
Figure 4 - Text description
| Age group (years) | Males | Females | Total | ||||||
|---|---|---|---|---|---|---|---|---|---|
| Cases (n) | Rate (per 100,000 population) | Proportion of all male cases | Cases (n) | Rate (per 100,000 population) | Proportion of all female cases | Cases (n) | Rate (per 100,000 population) | Proportion of all reported cases | |
| <10 | 12 | 0.6 | <1% | 12 | 0.6 | <1% | 26 | 0.7 | <1% |
| 10 to 14 | 16 | 1.5 | <1% | 77 | 7.5 | 1% | 93 | 4.4 | <1% |
| 15 to 19 | 812 | 77.4 | 4% | 1544 | 153.2 | 13% | 2367 | 115.1 | 7% |
| 20 to 24 | 2878 | 225.2 | 15% | 2801 | 239.0 | 24% | 5706 | 232.9 | 18% |
| 25 to 29 | 4228 | 309.7 | 21% | 2510 | 197.5 | 21% | 6764 | 256.6 | 21% |
| 30 to 39 | 6727 | 248.5 | 34% | 3316 | 125.2 | 28% | 10073 | 188.1 | 32% |
| 40 to 59 | 4482 | 90.2 | 23% | 1377 | 27.3 | 12% | 5869 | 58.6 | 19% |
| 60+ | 640 | 14.1 | 3% | 58 | 1.1 | <1% | 699 | 7.2 | 2% |
| National gonorrhea age rates by sex and overall, in 2021, were calculated using cases reported to the Canadian Notifiable Disease Surveillance System as numerators and Statistics Canada July 2022, 2021 population estimates as denominators. The 'total' case count and rate include all males, females and those with other or unspecified sex. There were 113 cases of gonorrhea of other or unspecified sex reported in 2021. | |||||||||
Reported gonorrhea case counts and rates by province and territory in Canada
In 2021, the national rate of reported gonorrhea was 84.2 cases per 100,000 population. The following provinces and territories had rates of reported gonorrhea cases above the national rate:
- Nunavut (1420.3 cases per 100,000 population)
- Northwest Territories (719.3 cases per 100,000 population)
- Saskatchewan (271.9 cases per 100,000 population)
- Manitoba (181.0 cases per 100,000 population)
- Alberta (112.7 cases per 100,000 population)
In 2021, the following provinces and territories had rates of reported gonorrhea cases below the national rate:
- Quebec (76.5 cases per 100,000 population)
- British Columbia (71.9 cases per 100,000 population)
- Ontario (66.3 cases per 100,000 population)
- New Brunswick (32.1 cases per 100,000 population)
- Yukon (16.2 cases per 100,000 population)
- Newfoundland and Labrador (14.6 cases per 100,000 population)
- Prince Edward Island (10.9 cases per 100,000 population)
- Nova Scotia (6.8 cases per 100,000 population)
Caution should be used when comparing rates across provinces and territories. Reported rates of gonorrhea cases may be inflated in jurisdictions with a relatively small population size. To contextualize rates, it is important to look at the case counts per province and territory (Table 8).
In 2021, the highest number of reported cases of gonorrhea were reported from Ontario (9,814 cases), Quebec (6,584 cases) and Alberta (5,010 cases).
Infectious syphilis
Reported infectious syphilis case counts and rates in Canada
Figure 5 and Table 5 show the number and rates of reported cases of infectious syphilis overall and by sex from 2012 to 2021. The trends in this figure and table are described below:
- In 2021, 11,540 cases of infectious syphilis were reported from all 13 Canadian provinces and territories for a rate of 30.2 cases per 100,000 population.
- Between 2012 and 2019, national rates of reported infectious syphilis cases (male, female, and other or unspecified sex) increased rapidly (by 321%).
- During the first year of the COVID-19 pandemic (2020), the rate of nationally reported infectious syphilis cases was the same as the 2019 rate.
- The 2021 rate of infectious syphilis was 21% higher than the pre-COVID 2019 rate and the 2020 rate.
- The national rate of reported infectious syphilis in 2021 was five times higher than the rate in 2012.
Reported infectious syphilis case counts and rates by age group and sex in Canada
Figure 5 and Table 5 show the number and rates of reported cases of infectious syphilis overall and by sex from 2012 to 2021. Figure 6 and Table 6 show the number of reported infectious syphilis cases, rates and proportion (shown only in Table 6) by age group and sex in 2021. The trends in these figures and tables are described below:
- In 2021:
- 65% of reported cases of infectious syphilis were among males and 34% were among females
- the rate of reported infectious syphilis cases among males was 39.7 cases per 100,000 males
- the rate of reported infectious syphilis cases among females was 20.7 cases per 100,000 females
- among males, the rate of reported infectious syphilis cases was highest among 30- to 39-year-olds (94.4 cases per 100,000 males) followed by 25- to 29-year-olds (90.2 per 100,000 males)
- among females, the rate of reported infectious syphilis cases was highest among 25- to 29-year-olds (69.9 cases per 100,000 females) followed by 20- to 24-year-olds (67.5 per 100,000 females)
- males (34%) and females (32%) aged 30- to 39-years-old had the highest proportion of reported cases of infectious syphilis
- From 2012 to 2021, rates of reported cases of infectious syphilis were higher among males than females.
- Between 2012 and 2019, reported rates of infectious syphilis increased among males (218%) and females (2182%). Since 2016, female rates have been increasing faster annually than male rates, narrowing the gap between male and female infectious syphilis rates.
- Between 2019 and 2020, reported rates of infectious syphilis decreased among males (3%), but continued to increase among females (8%).
- From 2020 to 2021, reported rates of infectious syphilis continued to increase more rapidly among females (38%) than males (14%).
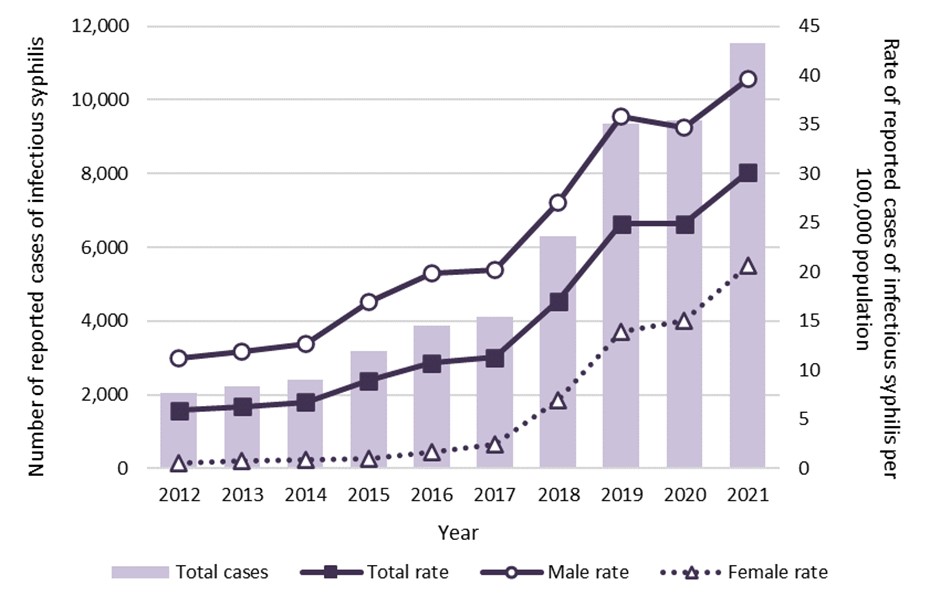
Figure 5 - Text description
| Year | Total cases | Male cases | Female cases | Total rate (per 100,000 population) | Male rate (per 100,000 males) | Female rate (per 100,000 females) |
|---|---|---|---|---|---|---|
| 2012 | 2053 | 1940 | 107 | 5.9 | 11.3 | 0.6 |
| 2013 | 2215 | 2066 | 145 | 6.3 | 11.9 | 0.8 |
| 2014 | 2399 | 2232 | 164 | 6.8 | 12.7 | 0.9 |
| 2015 | 3200 | 3008 | 187 | 9.0 | 17.0 | 1.0 |
| 2016 | 3877 | 3551 | 311 | 10.7 | 19.8 | 1.7 |
| 2017 | 4130 | 3664 | 449 | 11.3 | 20.2 | 2.4 |
| 2018 | 6311 | 4987 | 1290 | 17.0 | 27.1 | 6.9 |
| 2019 | 9359 | 6697 | 2639 | 24.9 | 35.8 | 13.9 |
| 2020 | 9456 | 6555 | 2873 | 24.9 | 34.7 | 15.0 |
| 2021 | 11540 | 7537 | 3979 | 30.2 | 39.7 | 20.7 |
| National annual infectious syphilis rates were calculated using the number of infectious syphilis cases reported to the Canadian Notifiable Disease Surveillance System as numerators and Statistics Canada July 2022 yearly population estimates as denominators. The 'total' case count and rate include all males, females and those with other or unspecified sex. There were 24 cases of infectious syphilis of other or unspecified sex reported in 2021. | ||||||
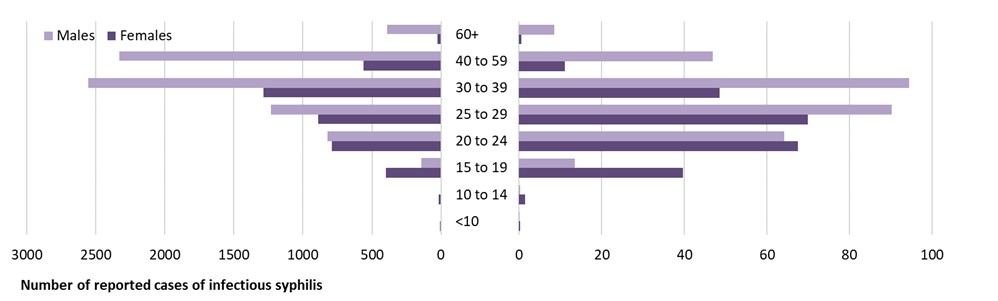
Figure 6 - Text description
| Age group (years) | Males | Females | Total | ||||||
|---|---|---|---|---|---|---|---|---|---|
| Cases (n) | Rate (per 100,000 population) | Proportion of all male cases | Cases (n) | Rate (per 100,000 population) | Proportion of all female cases | Cases (n) | Rate (per 100,000 population) | Proportion of all reported cases | |
| <10 | 3 | 0.1 | <1% | 5 | 0.3 | <1% | 8 | 0.2 | <1% |
| 10 to 14 | 3 | 0.3 | <1% | 15 | 1.5 | <1% | 19 | 0.9 | <1% |
| 15 to 19 | 142 | 13.5 | 2% | 400 | 39.7 | 10% | 542 | 26.3 | 5% |
| 20 to 24 | 820 | 64.2 | 11% | 791 | 67.5 | 20% | 1619 | 66.1 | 14% |
| 25 to 29 | 1232 | 90.2 | 16% | 888 | 69.9 | 22% | 2125 | 80.6 | 19% |
| 30 to 39 | 2555 | 94.4 | 34% | 1284 | 48.5 | 32% | 3842 | 71.7 | 34% |
| 40 to 59 | 2332 | 46.9 | 31% | 560 | 11.1 | 14% | 2898 | 28.9 | 25% |
| 60+ | 390 | 8.6 | 5% | 24 | 0.5 | 1% | 414 | 4.3 | 4% |
| National infectious syphilis age rates by sex and overall, in 2021, were calculated using the number of infectious syphilis cases reported to the Canadian Notifiable Disease Surveillance System as numerators and Statistics Canada July 2022, 2021 population estimates as denominators. The 'total' case count and rate include all males, females and those with other or unspecified sex. There were 24 cases of infectious syphilis of other or unspecified sex reported in 2021. | |||||||||
Reported infectious syphilis case counts and rates by province and territory in Canada
In 2021, the national rate of reported infectious syphilis was 30.2 cases per 100,000 population. The following provinces and territories had rates of reported infectious syphilis cases above the national rate:
- Northwest Territories (214.9 cases per 100,000 population)
- Saskatchewan (164.3 cases per 100,000 population)
- Nunavut (113.3 cases per 100,000 population)
- Manitoba (101.5 cases per 100,000 population)
- Alberta (72.2 cases per 100,000 population)
In 2021, the following provinces and territories had rates of reported infectious syphilis cases below the national rate:
- British Columbia (21.5 cases per 100,000 population)
- Ontario (19.9 cases per 100,000 population)
- Yukon (number not shown to reduce the risk of identifying individuals)
- Quebec (8.2 cases per 100,000 population)
- Newfoundland and Labrador (3.3 cases per 100,000 population)
- New Brunswick (3.2 cases per 100,000 population)
- Nova Scotia (1.5 cases per 100,000 population)
- Prince Edward Island (number not shown to reduce the risk of identifying individuals)
Caution should be used when comparing rates across provinces and territories. Reported rates of infectious syphilis cases may be inflated in jurisdictions with a relatively small population size. To contextualize rates, it is important to look at the case counts per province and territory (Table 9).
In 2021, the highest number of reported cases of infectious syphilis were reported from Alberta (3,209 cases), Ontario (2,946 cases) and Saskatchewan (1,941 cases).
Appendix A: Data tables corresponding to described chlamydia, gonorrhea and infectious syphilis information
| Jurisdiction | Cases (n) | Rate (per 100,000 population) | Proportion of all reported chlamydia cases |
|---|---|---|---|
| Canada | 104,426 | 273.2 | 100.0% |
| British Columbia | 13,038 | 250.6 | 12.5% |
| Alberta | 14,064 | 316.5 | 13.5% |
| Saskatchewan | 5,766 | 488.0 | 5.5% |
| Manitoba | 6,561 | 471.3 | 6.3% |
| Ontario | 35,389 | 239.0 | 33.9% |
| Quebec | 22,590 | 262.6 | 21.6% |
| New Brunswick | 1,673 | 211.7 | 1.6% |
| Nova Scotia | 2,067 | 208.6 | 2.0% |
| Prince Edward Island | 331 | 200.9 | 0.3% |
| Newfoundland and Labrador | 877 | 168.5 | 0.8% |
| Yukon | 213 | 492.5 | 0.2% |
| Northwest Territories | 616 | 1351.0 | 0.6% |
| Nunavut | 1,241 | 3125.1 | 1.2% |
| Provincial and territorial 2021 chlamydia rates were calculated using the number of chlamydia cases reported to the Canadian Notifiable Disease Surveillance System as numerators and Statistics Canada July 2022, 2021 population estimates as denominators. | |||
| Jurisdiction | Cases (n) | Rate (per 100,000 population) | Proportion of all reported gonorrhea cases |
|---|---|---|---|
| Canada | 32,192 | 84.2 | 100.0% |
| British Columbia | 3,738 | 71.9 | 11.6% |
| Alberta | 5,010 | 112.7 | 15.6% |
| Saskatchewan | 3,212 | 271.9 | 10.0% |
| Manitoba | 2,520 | 181.0 | 7.8% |
| Ontario | 9,814 | 66.3 | 30.5% |
| Quebec | 6,584 | 76.5 | 20.5% |
| New Brunswick | 254 | 32.1 | 0.8% |
| Nova Scotia | 67 | 6.8 | 0.2% |
| Prince Edward Island | 18 | 10.9 | 0.1% |
| Newfoundland and Labrador | 76 | 14.6 | 0.2% |
| Yukon | 7 | 16.2 | 0.0% |
| Northwest Territories | 328 | 719.3 | 1.0% |
| Nunavut | 564 | 1420.3 | 1.8% |
| Provincial and territorial 2021 gonorrhea rates were calculated using the number of gonorrhea cases reported to the Canadian Notifiable Disease Surveillance System as numerators and Statistics Canada July 2022, 2021 population estimates as denominators. | |||
| Jurisdiction | Cases (n) | Rate (per 100,000 population) | Proportion of all reported infectious syphilis cases |
|---|---|---|---|
| Canada | 11,540 | 30.2 | 100.0% |
| British Columbia | 1,121 | 21.5 | 9.7% |
| Alberta | 3,209 | 72.2 | 27.8% |
| Saskatchewan | 1,941 | 164.3 | 16.8% |
| Manitoba | 1,413 | 101.5 | 12.2% |
| Ontario | 2,946 | 19.9 | 25.5% |
| Quebec | 702 | 8.2 | 6.1% |
| New Brunswick | 25 | 3.2 | 0.2% |
| Nova Scotia | 15 | 1.5 | 0.1% |
| Prince Edward Island | DNS | DNS | DNS |
| Newfoundland and Labrador | 17 | 3.3 | 0.1% |
| Yukon | DNS | DNS | DNS |
| Northwest Territories | 98 | 214.9 | 0.8% |
| Nunavut | 45 | 113.3 | 0.4% |
| Provincial and territorial 2021 infectious syphilis rates were calculated using the number of infectious syphilis cases reported to the Canadian Notifiable Disease Surveillance System as numerators and Statistics Canada July 2022, 2021 population estimates as denominators. DNS: Data not shown to reduce the risk of identifying individuals. |
|||
Appendix B: List of supplementary tables and figures
Due to the impact of the COVID-19 pandemic on reported chlamydia, gonorrhea and infectious syphilis cases and rates, a 2021 surveillance report was not prepared by the Public Health Agency of Canada. However, the supplementary tables described below are available upon request via sti-hep-its@phac-aspc.gc.ca.
Chlamydia
- Table 1. Rates of reported chlamydia cases (per 100,000 population) by age group and province/territory, 2021
- Table 2. Number of reported chlamydia cases and rates of chlamydia by sex and province/territory, 2012 to 2021
- Figure 1. Proportion of total reported chlamydia cases by age group and sex in Canada, 2021
- Figure 2. Proportion of total reported chlamydia cases by sex and province/territory, 2021
- Figure 3. Annual percent change in rates of reported chlamydia cases by sex in Canada, 2012 to 2021
Gonorrhea
- Table 3. Rates of reported gonorrhea cases (per 100,000 population) by age group and province/territory, 2021
- Table 4. Number of reported cases and rates of gonorrhea by sex and province/territory, 2012 to 2021
- Figure 4. Proportion of total reported gonorrhea cases by age group and sex in Canada, 2021
- Figure 5. Proportion of total reported gonorrhea cases by sex and province/territory, 2021
- Figure 6. Annual percent change in rates of reported gonorrhea cases by sex in Canada, 2012 to 2021
Infectious and congenital syphilis
- Table 5. Rates of reported infectious syphilis cases in Canada (per 100,000 population) by age group, 2012 to 2021
- Table 6. Rates of reported infectious syphilis cases in Canada (per 100,000 males) by age group, 2012 to 2021
- Table 7. Rates of reported infectious syphilis cases in Canada (per 100,000 females) by age group, 2012 to 2021
- Table 8. Rates of reported infectious syphilis cases (per 100,000 population) by age group and province/territory, 2021
- Table 9. Number of cases and rates of infectious syphilis by sex and province/territory, 2012 to 2021
- Table 10. Number of cases and rates of congenital syphilis and rates of infectious syphilis among females aged 15-39 years (of reproductive age), 2012 to 2021
- Figure 7. Proportion of total reported infectious syphilis cases by age group and sex in Canada, 2021
- Figure 8. Number of cases of infectious syphilis by province/territory, 2021
- Figure 9. Proportion of total reported infectious syphilis cases by sex and province/territory, 2021
- Figure 10. Annual percent change in rates of reported infectious syphilis cases by sex in Canada, 2012 to 2021
Population estimates
- Table 11. Annual Canadian provincial and territorial population estimates, 2012 to 2021
- Table 12. Annual Canadian provincial and territorial population estimates for males, 2012 to 2021
- Table 13. Annual Canadian provincial and territorial population estimates for females, 2012 to 2021
Notes
Observed differences in the data published here and the data published in provincial and territorial surveillance products may be due to reporting delays, differences in the date data were extracted from the provincial and territorial surveillance databases or other reporting variations. Where such differences are noted, it is recommended that data and results from provincial and territorial products be used. Also, percent changes in rates were calculated using non-rounded numbers.
Footnotes:
- Footnote 1
-
Public Health Agency of Canada. Survey on the impact of COVID-19 on the delivery of STBBI prevention, testing and treatment, including harm reduction services, in Canada. Ottawa, ON: Public Health Agency of Canada; 2022. Pub.: 210294. Available from: https://www.canada.ca/en/public-health/services/publications/diseases-conditions/survey-impact-covid-19-delivery-stbbi-prevention-testing-treatment.html
- Footnote 2
-
Infectious syphilis includes the primary, secondary and early latent (less than one year after infection) stages of infection.
- Footnote 3
-
Thorington R, Sawatzky P, Lefebvre B, Diggle M, Hoang L, Patel S, Van Caessele P, Minion J, Garceau R, Matheson M, Haldane D, Gravel G, Mulvey MR, Martin I. Antimicrobial susceptibilities of Neisseria gonorrhoeae in Canada, 2020. Can Commun Dis Rep 2022;48(11/12):571–9. Available from: https://www.canada.ca/en/public-health/services/reports-publications/canada-communicable-disease-report-ccdr/monthly-issue/2022-48/issue-11-12-november-december-2022/antimicrobial-susceptibilities-neisseria-gonorrhoeae-canada-2020.html
- Footnote 4
-
Public Health Agency of Canada. Infectious syphilis and congenital syphilis in Canada, 2021. Can Commun Dis Rep 2022;48(11/12): 587. Available from: https://www.canada.ca/en/public-health/services/reports-publications/canada-communicable-disease-report-ccdr/monthly-issue/2022-48/issue-11-12-november-december-2022/infectious-congenital-syphilis-canada-2021.html
Page details
- Date modified: