
Estimates of HIV incidence, prevalence and Canada’s progress on meeting the 90-90-90 HIV targets, 2020

Download in PDF format
(789 KB, 36 pages)
Organization: Public Health Agency of Canada
Date published: 2022-07
Highlights
- In 2020, an estimated 1,520 new HIV infections occurred in Canada, a slight decrease from the estimate for 2018.
- The proportion of new infections among gay, bisexual and other men who have sex with men continued to decrease, whereas the proportion of new infections among people who inject drugs, Indigenous peoples and women slightly increased.
- There is heterogeneity among provinces / territories regarding representation of incident cases by key population.
- An estimated 62,790 people were living with HIV in Canada at the end of 2020. Canada achieved both the 1st and 3rd 90-90-90 targets expected for 2020. Among those living with HIV, an estimated 90% were diagnosed. Of those diagnosed, 87% were estimated to be on treatment and an estimated 95% of persons on treatment had a suppressed viral load.
- This means that an estimated 16,690 people in Canada were not engaged or represented in HIV care continuum in Canada. Individuals missed along the care continuum present an important opportunity for intervention, both to assure better individual health outcomes and to reduce community transmission of HIV.
- For the first time, the Public Health Agency has ascertained 90-90-90 estimates by sex. Among the estimated 62,790 people living with HIV (PLHIV) at the end of 2020, 75.4% were males, and 24.6% were females. Among males living with HIV, progress towards the 90-90-90 targets was similar to the overall population (90%-87%-96%). However, females appear to have had a lower awareness of infection, as well as treatment and viral suppression rates (88%-85%-90%).
- Estimates for the HIV care continuum and the 90-90-90 targets by sex, geography and by key population, showed that:
- Variation between provinces / regions demonstrates the need for focus and improvement in the different stages of the HIV care continuum.
- Certain populations (e.g. people who inject drugs and Indigenous peoples) are disproportionately impacted by HIV and have lower estimates related to HIV awareness, treatment uptake and viral suppression when compared to the overall population;
- Reporting on Canada’s progress towards targets for HIV drives us to improve our strategies when we are not achieving expected results. To reduce the health impact of HIV in Canada, tailored programming for HIV prevention, including screening, and for treatment and care, will help meet the needs of people at greatest risk for infection in communities where HIV is most concentrated.
Acknowledgements
The Public Health Agency of Canada acknowledges the Provincial / Territorial Public Health Authorities and other government departments for their contribution to the national estimates of HIV incidence, prevalence and 90-90-90 targets.
The Public Health Agency of Canada acknowledges the efforts by First Nations partners in the prevention of HIV infections, the care of people living with HIV, and their contribution in estimating HIV indicators for First Nations communities in Saskatchewan.
Table of Contents
- Introduction
- HIV Incidence - Estimated number of new HIV infections in Canada
- HIV Prevalence - Estimated number of people living with HIV in Canada
- Canada’s progress on meeting the 90-90-90 HIV targets by 2020
- Discussion / Conclusion
- Appendix 1. Additional detail related to Canada’s modelling method
- Appendix 2. National HIV incidence and prevalence tables
- Appendix 3. Key population definitions
- References
Introduction
Sexually transmitted and blood borne infections (STBBI) remain a significant health concern in Canada even though they are largely preventable, treatable and in many cases, curable. STBBI impose a significant physical, emotional, social and economic cost to individuals, communities, and society. The Pan-Canadian STBBI Framework for ActionReference 1 provides a roadmap for collaborative and complementary actions to reduce the impact of STBBI in Canada including three strategic goals: reducing the incidence of STBBI; improve access to testing, treatment, care and support; and, reducing the stigma and discrimination that create vulnerabilities to STBBI. Eight guiding principles, including (but not limited to): moving towards truth and reconciliation; health equity; and meaningful engagement of people living with HIV (PLHIV) and key populations, were developed to inform collective action to address STBBI in CanadaReference 1.
The Pan-Canadian STBBI Framework for Action also acknowledges Canada’s contribution to the global efforts to end AIDS, viral hepatitis, and sexually transmitted infections as major health concerns. We have endorsed global targets and initiated development of domestic targets towards ending HIV/AIDS as a public health threat by 2030Reference 2. The global 90-90-90 targets state that by 2020, 90% of all PLHIV know their status, 90% of those diagnosed receive antiretroviral treatment (ART), and 90% of those on treatment achieve viral suppression. When these three targets have been achieved, at least 73% (90% x 90% x 90%) of all people living with HIV will be virally suppressed helping limit both the severe health consequences of HIV as well as community transmission. Modelling suggests that achieving these targets will enable the world to eliminate the AIDS epidemic by 2030Reference 2.
This report provides an update for 2020 on Canada’s estimates of national HIV incidence and prevalence and on progress towards meeting the 90-90-90 targets set out for 2020. Reporting on these targets supports a pan-Canadian multi-sectoral response to HIV/AIDS in which this information can be used to help provide an understanding of the effectiveness of current responses to HIV in Canada, and to identify areas for improvement to guide HIV prevention and care work.
In June 2021, to keep countries on track towards ending AIDS, UNAIDS raised the targets and called on countries to provide 95% of all people at risk of acquiring HIV - within all epidemiologically relevant groups, age groups and geographic settings - with access to people-centred and effective HIV combination prevention options. It also calls on member countries to ensure that by 2025, 95% of people living with HIV know their HIV status, 95% of people who know their status to be on HIV treatment and 95% of people on HIV treatment to be virally suppressedReference 3.
Canada will begin to report on progress towards the 95-95-95 targets using 2022 data when available.
Why is monitoring Canada’s progress important?
The Government of Canada is committed to measuring the impact of programs and policies as we implement the Government of Canada five-year action plan on STBBI, through monitoring and reporting on STBBI trends and resultsReference 4.Understanding HIV incidence (the number of new infections occurring during a specific period of time) is fundamental for understanding temporal changes in transmission patterns, and is useful for public health decision makers to monitor, strengthen and evaluate the impact of multi-sectoral public health actions. Estimating HIV prevalence (the number of people living with HIV - both diagnosed and undiagnosed) is critical for guiding the planning and investment for treatment, care and ongoing support for people living with and affected by HIV. It is also the first step in the HIV care continuum.
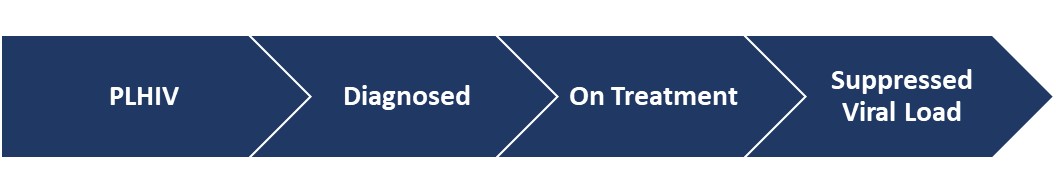
The HIV care continuum is a public health model that outlines the steps or stages that people with HIV go through from initial HIV diagnosis to achieving and maintaining viral suppression. The HIV care continuum is useful both on an individual-level to assess care outcomes, as well as at the population-level to analyze the proportion of people with HIV in a given community who are engaged in each successive stepReference 5. The typical steps in the care continuum are: diagnosis of HIV infection, linkage to HIV care, received or retained in care, and achieving viral suppression (Figure 1).
Figure 1. HIV Care ContinuumReference 5

Text description
This diagram shows the steps of the HIV care continuum:
- Diagnosed – received a diagnosis of HIV;
- Linked to care – visited an HIV health care provider within 1 month (30 days) after learning they were HIV positive;
- Received or were retained in care – received medical care for HIV infection;
- Viral suppression – their HIV “viral load” the amount of HIV in the blood was at a very low level.
By establishing the HIV care continuum, one can then use this as a framework for assessing and reporting on progress against the 90-90-90 targets. The sequential nature of the stages in the continuum, and the associated metrics at each stage (e.g. 90-90-90 targets) allows public health agencies—on national and regional levels—to identify gaps in care and determine the types of interventions that might help increase the number of people who achieve and maintain viral suppressionReference 6.
Globally, estimating HIV incidence, prevalence and progress on the 90-90-90 targets is undertaken to monitor HIV epidemics and to guide prevention and control programs. These estimates support all partners and stakeholders to have a better understanding of key populations where action is needed to reduce the public health impact of HIV and AIDS.
How are we monitoring progress in Canada?
Since 2018, The Public Health Agency of Canada (PHAC or the Agency) has been working with an expert working group to determine the measures used to assess Canada’s progress within the HIV care continuum. Based on a review of measures used internationally, the PHAC expert group recommended evaluating the 90-90-90 measures using a four-stage continuum: Stage 1 – the estimated number of all people living with HIV (PLHIV); Stage 2 – the number of all PLHIV who have been diagnosed; Stage 3 – the number of PLHIV who have been diagnosed and who are on antiretroviral treatment (ART); and Stage 4 – the number of PLHIV on ART who are virally suppressed (Figure 2).
Figure 2. Four-stage HIV care continuum framework for Canada
Text description
This diagram shows the four-stage continuum that Canada uses to measure the HIV continuum of care:
- Stage 1 – the estimated number of all people living with HIV (PLHIV);
- Stage 2 – the number of all PLHIV who have been diagnosed;
- Stage 3 – the number of PLHIV who have been diagnosed and who are on ART; and
- Stage 4 – the number of PLHIV on ART who are virally suppressed.
Standard definitions for each of the measures were developed and used where possible (Table 1). These definitions, which were agreed to by the expert working group supporting the monitoring of Canada’s progress, are aligned with the definitions used by the European Centres for Disease Control (ECDC), the United States Centers for Disease Control and Prevention (USCDC), the Kirby Institute (Australia), and Public Health England (United Kingdom). In some instances, definitions were adapted by jurisdictions to account and adjust for differences in the definitions of “on treatment” and “suppressed viral load”.
| Measure | Definition |
|---|---|
Total estimated number of people living with HIV |
The total estimated number of people living with HIV at the end of 2020 based on a bespoke modelling approach, using the Canadian HIV Modelling ToolReference 7. The estimate includes diagnosed and undiagnosed people. Deaths among people living with HIV are estimated using data from various sources depending on the province / territory, since vital statistics data only record mortality among persons who died of HIV-related causes. Data sources include vital statistics data from Statistics Canada or provincial/territorial vital registries, linked HIV diagnostic and mortality information, national reports of AIDS deaths, cohort data related people living with HIV who are in care, and Canadian research studies. Migration between jurisdictions within Canada, and immigration to Canada from other countries is also included in the total number of people living with HIV. Data on in and out migration are provided by provinces / territories where possible. |
Number; percentage diagnosed |
Among those estimated to be living with HIV in Canada at the end of 2020, the number and proportion (%) of people who were diagnosed. Numerator: Number of people living with diagnosed HIV Denominator: Number of people living with HIV (both diagnosed and undiagnosed) |
Number; percentage who are currently on antiretroviral treatment |
Among those living with diagnosed HIV, the number and proportion (%) of people with ≥1 antiretroviral therapy (ART) in 2020 (prescribed, dispensed or recorded on patient forms) Numerator: Number of people on treatment (≥1 antiretroviral therapy in 2020) Denominator: Number of people living with diagnosed HIV |
Number; percentage who had suppressed virus |
Among those on treatment, the number and proportion (%) of people whose last HIV RNA measurement in 2020 was <200 copies/ml Numerator: Number of people with <200 copies/ml on their latest viral load (VL) test in 2020 Denominator: Number of people on treatment |
The 90–90–90 targets and the HIV care continuum are two ways of looking at the same data. When we report on the progress towards the 90-90-90 targets, the denominator for each of the 90s targets is different (described in Table 1). The first 90 numerical value is the denominator for the second 90, and the second 90 numerical value is the denominator for the third 90.
If we look at the data differently, across the HIV care continuum, the denominator for each step remains the same - all people living with HIV. In this approach, when all three 90-90-90 targets are achieved, 81% of all people living with HIV will be on ART (90% x 90%), and 73% of all people living with HIV will be virally suppressed (81% x 90%)Reference 8.
The Public Health Agency of Canada works closely with provinces, territories and other government departments to develop the national estimates of HIV incidence, prevalence and 90-90-90 measures using statistical modelling methods and available surveillance information from each jurisdiction. Measures were refined through an iterative process with provinces and territories, particularly where adjustments were necessary to account for uncertainty due to incomplete or lack of representative data. The national estimates were developed by rolling-up consensus-based estimates from each jurisdiction.
Data sources
HIV estimates related to incidence, prevalence and the first 90-90-90 target were developed using HIV surveillance data reported by provinces and territories (PTs), estimated deaths among persons living with HIV, and back-calculation statistical modelling methods. Additional detail on these methods is provided in Appendix 1.
The development of estimates for the second and third 90-90-90 targets required additional information from the provinces and territories, including the following where available:
- HIV surveillance data;
- Centralized HIV care program data, including linked treatment and laboratory viral load data;
- Provincial antiretroviral drug prescription data linked to HIV laboratory data;
- Unlinked data from drug prescription databases, laboratories, and HIV clinics;
- Cohorts of diagnosed persons engaged in HIV care.
Data and measurement considerations
Estimates published in this report replace all previous estimates published by the Agency concerning HIV incidence, prevalence and 90-90-90 targets in Canada. Assumptions, methods and primary data may have changed for some jurisdictions because our knowledge of the epidemic has improved and the primary data provided by the PTs for use in the model have been refined. In some instances, provinces / territories have been grouped into regions (e.g. Atlantic and Territories), or data have been suppressed due to small counts and to reduce the risk of identifying an individual).
Estimates are being published for 2020 since that is the most recent year for which complete HIV surveillance data are available. Complete 2021 surveillance data will be available in 2022.
Provincial / territorial data sources for the second and third 90-90-90 targets vary between jurisdictions. These differences occur due to the diverse methods used for HIV surveillance (e.g. laboratory-based versus case-based) and the ability to link data sources. Some jurisdictions have the ability to link datasets related to HIV diagnoses, deaths, treatment and viral load. This allows the jurisdiction to describe progress through the HIV care continuum at the population level. Other jurisdictions estimate each of the HIV care continuum measures using unlinked data sources (e.g. separate diagnosis, death, treatment and viral load data) along with an analysis of, and an adjustment for, the inherent limitations for each data source. Lastly, some jurisdictions are able to monitor progress on the HIV care continuum only among cohorts of diagnosed persons who are engaged in HIV care.
Because the data systems, type of data available, and the capacity to link information from different sources vary across jurisdictions, the national measures developed through this process should be interpreted within the context of plausible ranges around each estimate. National estimates reflect inherent uncertainty as a result of these measurement considerations and limitations.
Revisions to the methods and data mean that estimates for past years in this report may differ from previously published estimates, and the 2020 estimates should not be compared directly with previously published estimates.
Revised estimates for 2018 using updated data and methodology are presented in this report.
HIV Incidence - Estimated number of new HIV infections in Canada
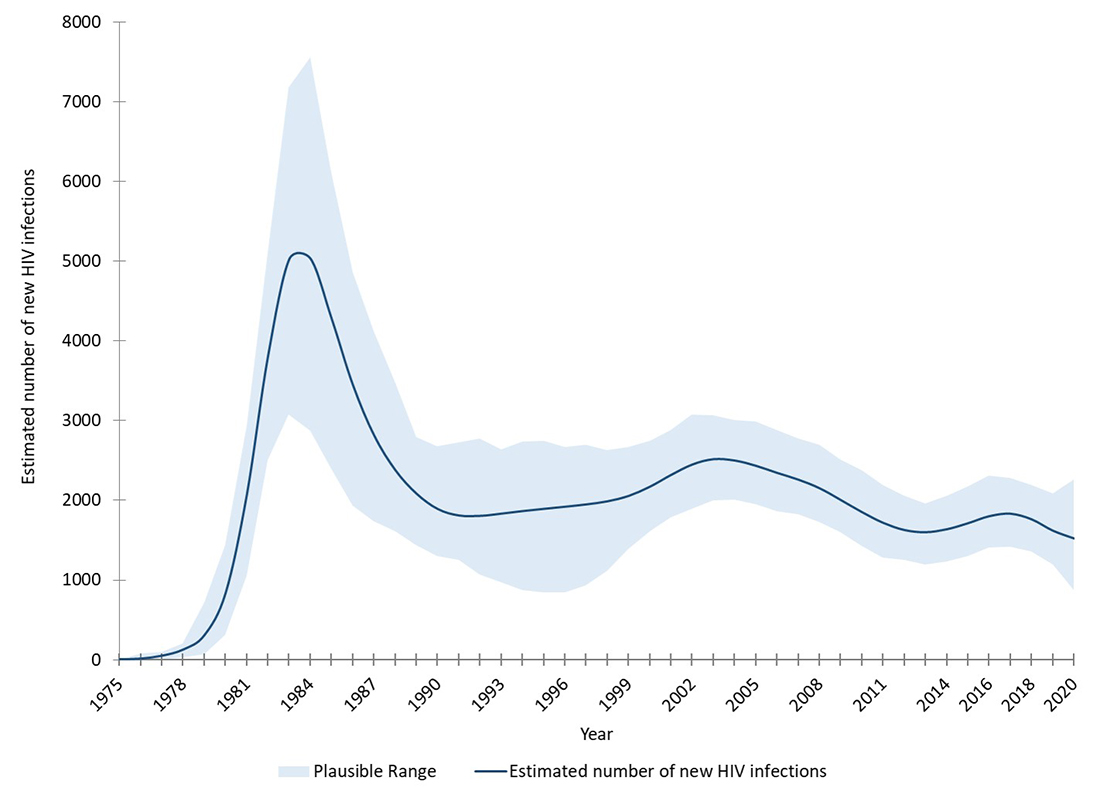
The Agency estimates that 1,520 new infections (range between 870 – 2,260) occurred in Canada in 2020, a slight decrease from the estimate for 2018 (1,760; range between 1,360 and 2,190) (Figure 3, Appendix 2).
The resulting estimated incidence rate for the overall Canadian population for 2020 was 4.0 per 100,000 population (range between 2.3 and 6.0 per 100,000 population) - a slight decrease from the estimate for 2018 (4.7 per 100,000 population; range between 3.7 and 5.9 per 100,000 population)reference a.
The observed decrease in new HIV infections in 2020 may have been impacted by decreased access to HIV testing services as a result of the COVID-19 pandemic. Additional years of data, especially for 2022 and later, are needed to determine whether the trend in new HIV infections will continue to decrease.
Figure 3. HIV incidence: Estimated annual number of new HIV infections in Canada (including plausible ranges)
Text description
This graph shows the estimated number of new HIV infections in Canada by year. The vertical axis shows the point estimate of new HIV infections per year, along with the associated low and high range estimates, and the horizontal axis shows the calendar years.
| Low estimate | Point estimate | High estimate | |
|---|---|---|---|
| 1975 | 0 | 2 | 0 |
| 1976 | 0 | 11 | 80 |
| 1977 | 1 | 48 | 98 |
| 1978 | 27 | 125 | 207 |
| 1979 | 65 | 305 | 720 |
| 1980 | 315 | 834 | 1434 |
| 1981 | 1056 | 2068 | 2938 |
| 1982 | 2502 | 3812 | 5099 |
| 1983 | 3080 | 5028 | 7182 |
| 1984 | 2872 | 5036 | 7552 |
| 1985 | 2397 | 4280 | 6122 |
| 1986 | 1935 | 3448 | 4861 |
| 1987 | 1738 | 2815 | 4123 |
| 1988 | 1609 | 2379 | 3471 |
| 1989 | 1433 | 2083 | 2794 |
| 1990 | 1301 | 1890 | 2679 |
| 1991 | 1253 | 1809 | 2730 |
| 1992 | 1073 | 1804 | 2774 |
| 1993 | 973 | 1832 | 2635 |
| 1994 | 870 | 1864 | 2739 |
| 1995 | 842 | 1892 | 2743 |
| 1996 | 841 | 1919 | 2664 |
| 1997 | 937 | 1948 | 2695 |
| 1998 | 1114 | 1987 | 2631 |
| 1999 | 1393 | 2055 | 2673 |
| 2000 | 1616 | 2170 | 2746 |
| 2001 | 1785 | 2318 | 2886 |
| 2002 | 1893 | 2449 | 3071 |
| 2003 | 1996 | 2516 | 3069 |
| 2004 | 2007 | 2499 | 3008 |
| 2005 | 1953 | 2433 | 2988 |
| 2006 | 1861 | 2344 | 2883 |
| 2007 | 1820 | 2259 | 2778 |
| 2008 | 1730 | 2151 | 2693 |
| 2009 | 1605 | 2003 | 2514 |
| 2010 | 1423 | 1851 | 2376 |
| 2011 | 1286 | 1716 | 2194 |
| 2012 | 1254 | 1626 | 2054 |
| 2013 | 1195 | 1599 | 1965 |
| 2014 | 1230 | 1636 | 2062 |
| 2015 | 1304 | 1712 | 2174 |
| 2016 | 1405 | 1800 | 2311 |
| 2017 | 1419 | 1831 | 2280 |
| 2018 | 1360 | 1760 | 2190 |
| 2019 | 1190 | 1618 | 2090 |
| 2020 | 870 | 1520 | 2260 |
HIV incidence was estimated within demographic and key population groups most affected by HIV in Canada: specifically by sex, Indigenous origin, gay, bisexual and other men who have sex with men (gbMSM), heterosexual people, people who inject drugs (PWID), and gbMSM-PWID. Definitions for the key populations and type of exposure to HIV are included in Appendix 2.
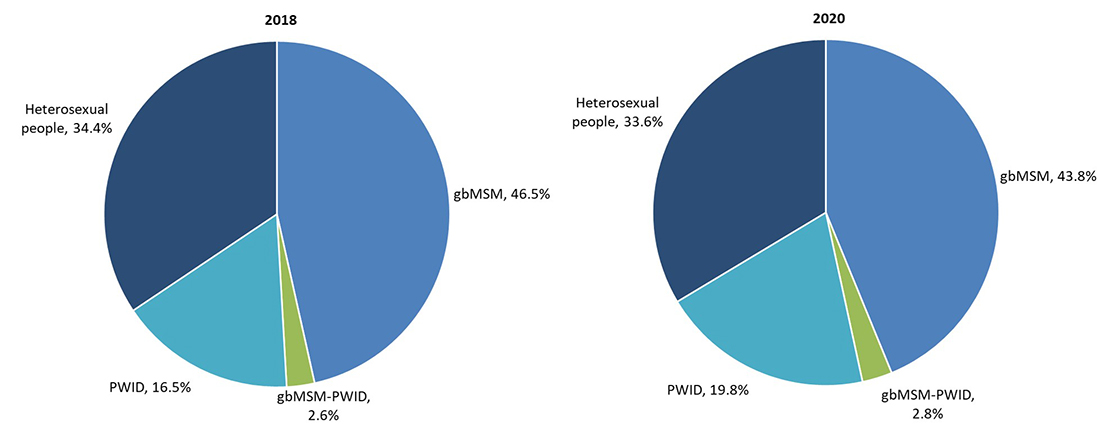
Among the new infections in 2020, an estimated 666 were among gbMSM, representing 43.8% of all new HIV infections in 2020 (Figure 4, Appendix 2). Using recent estimates of the population size for sexually active gbMSM (gbMSM who report having anal sex with a man in the past 6-12 months)Reference 9, the estimated annual incidence rate among sexually active gbMSM in 2020 was 166.2 per 100,000 population. The proportion of new infections among gbMSM continued to decrease (compared with 46.5% and 209.1 per 100,000 in 2018).
Three hundred (300) of the estimated new infections in 2020 were among PWID, accounting for 19.8% of new infections which increased slightly from 2018 estimate (16.5%). Using unpublished preliminary estimates of the population size for people who injected drugs in the past 6-12 months, the estimated annual incidence rate in 2020 was 239.4 per 100,000 population. The proportion of new infections and the annual incidence rate among PWID is gradually increasing (16.5% and 236.5 per 100,000 in 2018). The proportion of new infections attributed to heterosexual people decreased slightly to 33.6% from 34.4% in 2018.
In 2020, the estimated annual incidence rate among:
- Sexually active gbMSM (gbMSM who report having anal sex with a man in the past 6-12 months) in 2020 was 166.2 per 100,000 population.
- People who have injected drugs in the past 6-12 months was 239.4 per 100,000 population.
Figure 4. Proportion of new HIV infections by key population, Canada, 2018 (n = 1,760) and 2020 (n=1,520) (see Appendix 3 for definitions)
Text description
These two pie charts show the estimated percentage of new HIV infections by key population in 2018 and 2020.
| Key Population | 2018 Percentage | 2020 Percentage |
|---|---|---|
| Gay, bisexual and other men who have sex with men (gbMSM) | 46.5% | 43.8% |
| People who inject drugs (PWID) | 16.5% | 19.8% |
| Heterosexual people | 34.4% | 33.6% |
| gbMSM-PWID | 2.6% | 2.8% |
An estimated 276 new HIV infections in 2020 occurred among Indigenous peoples (First Nations / Metis / Inuit) (Appendix 2) which represented 18.2% of all new infections in 2020. This is an increase since 2018, when 14.7% of new infections were estimated to be among Indigenous peoples. However, the incidence rate among Indigenous peoples remained stable at an estimated 15.2 per 100,000 population (compared to 14.2 per 100,000 in 2018). Almost one third of new infections were estimated to be among females (32.0%), which is a slight increase compared to the 2018 estimate of 30.2%.
While the proportion of new infections among some key populations (PWID, females and Indigenous peoples) has increased compared to 2018, the overall number of new infections decreased in 2020 among females (8.3%); but has increased slightly among PWID (3.4%) and Indigenous origin (7.0%) (Appendix 2, Table 6).
Both the proportion of new infections and overall number of new infections have decreased among gbMSM, gbMSM-PWID, heterosexual people, males and non-Indigenous peoples (Appendix 2, Table 6).
Geographical Breakdown
The provinces with the highest estimated number of new infections in 2020 were Ontario, Quebec and Saskatchewan (Table 2), however there is heterogeneity among provinces / territories regarding representation of incident cases by key population. For example, in British Columbia, Ontario, Quebec and the Atlantic provinces, gbMSM accounted for half or more of incident cases; while in Saskatchewan and Manitoba PWID accounted for more than half of incident infections. In Alberta, new HIV infections were distributed across all three key populations, with the highest proportion among heterosexual people.
| Province / region | Measure | Key Population | ||||
|---|---|---|---|---|---|---|
| gbMSM | gbMSM - PWID | PWID | Heterosexual people | Total | ||
| BC | Point Estimate | 56 | 2 | 23 | 27 | 108 |
| Range | 30-85 | <10 | 10-40 | 10-45 | 50-170 | |
| % | 51.8 | 1.9 | 21.3 | 25.0 | 100 | |
| AB | Point Estimate | 49 | 4 | 30 | 66 | 149 |
| Range | 25-75 | <10 | 15-45 | 35-100 | 75-220 | |
| % | 32.9 | 2.7 | 20.1 | 44.3 | 100 | |
| SK | Point Estimate | 14 | 6 | 134 | 60 | 214 |
| Range | 5-25 | <10 | 65-200 | 30-90 | 105-320 | |
| % | 6.5 | 2.9 | 62.6 | 28.0 | 100 | |
| MB | Point Estimate | 8 | 2 | 51 | 24 | 85 |
| Range | 5-15 | <10 | 25-75 | 10-35 | 40-130 | |
| % | 9.4 | 2.4 | 60.0 | 28.2 | 100 | |
| ON | Point Estimate | 297 | 19 | 42 | 149 | 507 |
| Range | 150-440 | 10-30 | 20-65 | 75-225 | 250-760 | |
| % | 58.6 | 3.7 | 8.3 | 29.4 | 100 | |
| QC | Point Estimate | 215 | 9 | 14 | 172 | 410 |
| Range | 105-320 | 5-15 | 5-25 | 85-260 | 200-610 | |
| % | 52.4 | 2.2 | 3.4 | 42.0 | 100 | |
| Atlantic | Point Estimate | 26 | 1 | 6 | 12 | 45 |
| Range | 10-40 | <5 | <10 | 5-20 | 20-70 | |
| % | 57.8 | 2.2 | 13.3 | 26.7 | 100 | |
| Territories | Point Estimate | Number not reported to reduce possibility of identifying individuals | 2 | |||
| Range | <10 | |||||
| % | 100 | |||||
| CANADA | Point Estimate | 666 | 43 | 300 | 511 | 1520 |
| Range | 330-1,000 | 20-70 | 150-450 | 250-770 | 870-2,260 | |
| % | 43.8 | 2.8 | 19.8 | 33.6 | 100 | |
HIV Prevalence - Estimated number of people living with HIV in Canada
The Agency estimates that approximately 62,790 people were living with HIV at the end of 2020 (range between 55,200 and 70,300). This estimate represents a 3.6% increase from the estimated 60,600 (range between 53,300 – 67,800) at the end of 2018 (Figure 5, Appendix 2). The estimated HIV prevalence in Canada at the end of 2020 was 0.17% (range between 0.15% - 0.19%).
Figure 5. HIV Prevalence: Estimated number of people living with HIV in Canada (including plausible ranges)

Text description
This graph shows the estimated number of people living with HIV in Canada by year. The vertical axis shows point estimate of the number of people living with HIV, along with the associated low and high range estimates, and the horizontal axis shows the calendar years.
| Year | Low estimate | Point estimate | High estimate |
|---|---|---|---|
| 1980 | 592 | 1070 | 1613 |
| 1981 | 1995 | 2953 | 4147 |
| 1982 | 4888 | 6697 | 8465 |
| 1983 | 8684 | 11428 | 14567 |
| 1984 | 12100 | 15853 | 20122 |
| 1985 | 14994 | 19491 | 24467 |
| 1986 | 18004 | 22402 | 28032 |
| 1987 | 20107 | 24683 | 30890 |
| 1988 | 21452 | 26427 | 33453 |
| 1989 | 22461 | 27688 | 35194 |
| 1990 | 23102 | 28514 | 36152 |
| 1991 | 23628 | 29159 | 36666 |
| 1992 | 24302 | 29653 | 36752 |
| 1993 | 24482 | 29968 | 36552 |
| 1994 | 24535 | 30073 | 36009 |
| 1995 | 24857 | 30325 | 36076 |
| 1996 | 25945 | 31067 | 37340 |
| 1997 | 27244 | 32169 | 38161 |
| 1998 | 28125 | 33417 | 39419 |
| 1999 | 29184 | 34701 | 40643 |
| 2000 | 30478 | 36073 | 42190 |
| 2001 | 31983 | 37727 | 43781 |
| 2002 | 33599 | 39516 | 45495 |
| 2003 | 35153 | 41354 | 47847 |
| 2004 | 36686 | 43169 | 49569 |
| 2005 | 38424 | 44911 | 51275 |
| 2006 | 40115 | 46599 | 53133 |
| 2007 | 41601 | 48207 | 54855 |
| 2008 | 42860 | 49675 | 56489 |
| 2009 | 43969 | 51031 | 58034 |
| 2010 | 45180 | 52306 | 59390 |
| 2011 | 46339 | 53413 | 60615 |
| 2012 | 47238 | 54429 | 61631 |
| 2013 | 48251 | 55446 | 62754 |
| 2014 | 49277 | 56515 | 63792 |
| 2015 | 50304 | 57643 | 64920 |
| 2016 | 51219 | 58678 | 65599 |
| 2017 | 52128 | 59500 | 66461 |
| 2018 | 53300 | 60600 | 67800 |
| 2019 | 54350 | 61804 | 69052 |
| 2020 | 55200 | 62790 | 70300 |
HIV prevalence was also estimated within demographic and key population groups most affected by HIV in Canada: specifically by sex, Indigenous origin (First Nations / Metis / Inuit), gbMSM, heterosexual people, PWID, and gbMSM-PWID. Definitions for the key populations and type of exposure to HIV are included in Appendix 2.
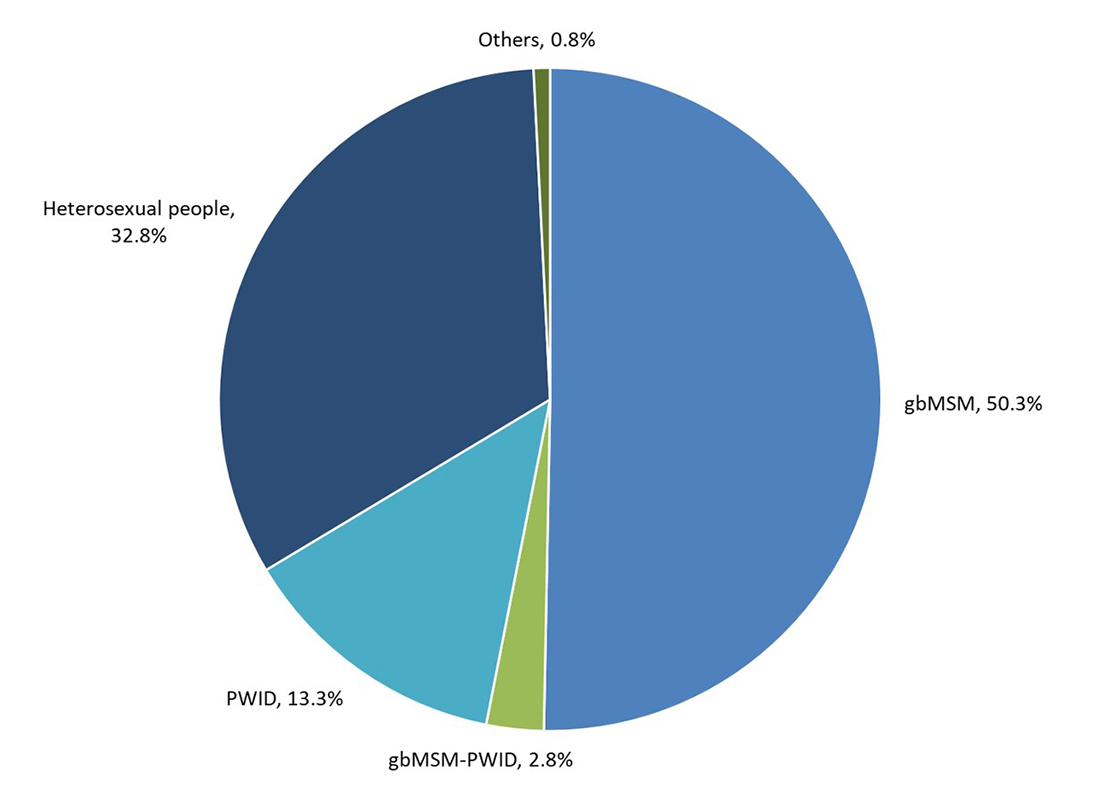
Of the estimated 62,790 PLHIV in Canada at the end of 2020, half (50.3%) were among gbMSM, 13.3% were PWID, and 32.8% were heterosexual people (Figure 6).
Figure 6. Proportion of people living with HIV by key population, Canada, at the end of 2020 (n=62,790) (see Appendix 3 for definitions)
Text description
This pie chart shows the estimated percentage of people living with HIV infection by key population at the end of 2020.
| Key Population | Percentage |
|---|---|
| Gay, bisexual and other men who have sex with men (gbMSM) | 50.3% |
| People who inject drugs (PWID) | 13.3% |
| Heterosexual people | 32.8% |
| gbMSM-PWID | 2.8% |
| Others | 0.8% |
Approximately one in four PLHIV were female (24.6%), and one in ten (10.3%) were Indigenous peoples. These proportions have remained stable compared to the 2018 estimates (Appendix 2).
Geographical Breakdown
The provinces with the highest estimated number of PLHIV at the end of 2020 were Ontario, Quebec, and British Columbia (Table 3). This is expected given these are the three most populous provinces in Canada. The proportion of PLHIV by key population varied across jurisdictions. For example, in British Columbia, Ontario, Quebec and the Atlantic provinces, gbMSM accounted for more than half of PLHIV; whereas in Alberta and Manitoba heterosexual people made up more than half of all PLHIV. In Saskatchewan, more than two-thirds of all PLHIV were people who inject drugs.
| Province / Region | Measure | Key Population | |||||
|---|---|---|---|---|---|---|---|
| gbMSM | gbMSM - PWID | PWID | Heterosexual people | Other | Total | ||
| BC | Point Estimate | 5,180 | 245 | 1,675 | 2,412 | 125 | 9,637 |
| Range | 4,400-6,000 | 200-290 | 1,400-1,900 | 2,000-2,800 | 90-160 | 8,200-11,000 | |
| % | 53.8 | 2.5 | 17.4 | 25.0 | 1.3 | 100 | |
| AB | Point Estimate | 1,810 | 164 | 785 | 2,460 | 40 | 5,259 |
| Range | 1,500-2,100 | 120-210 | 650-900 | 2,100-2,800 | 20-60 | 4,500-6,000 | |
| % | 34.4 | 3.1 | 14.9 | 46.8 | 0.8 | 100 | |
| SK | Point Estimate | 215 | 66 | 2,188 | 712 | 50 | 3,231 |
| Range | 170-260 | 40-90 | 1,800-2,600 | 570-850 | 30-70 | 2,700-3,700 | |
| % | 6.7 | 2.1 | 67.7 | 22.0 | 1.5 | 100 | |
| MB | Point Estimate | 483 | 47 | 354 | 1,122 | 20 | 2,026 |
| Range | 380-580 | 30-70 | 280-420 | 900-1,300 | 10-30 | 1,600-2,400 | |
| % | 23.8 | 2.3 | 17.5 | 55.4 | 1.0 | 100 | |
| ON | Point Estimate | 13,325 | 737 | 1,888 | 7,310 | 120 | 23,380 |
| Range | 11,300-15,300 | 580-890 | 1,600-2,200 | 6,200-8,400 | 70-170 | 20,000-26,500 | |
| % | 57.0 | 3.1 | 8.1 | 31.3 | 0.5 | 100 | |
| QC | Point Estimate | 9,660 | 460 | 1,308 | 6,148 | 150 | 17,726 |
| Range | 8,200-11,100 | 360-560 | 1,100-1,500 | 5,200-7,000 | 80-200 | 15,000-20,300 | |
| % | 54.5 | 2.6 | 7.4 | 34.7 | 0.8 | 100 | |
| Atlantic | Point Estimate | 899 | 27 | 125 | 394 | 13 | 1458 |
| Range | 720-1,070 | 20-40 | 80-170 | 310-470 | 10-20 | 1,100-1,800 | |
| % | 61.6 | 1.9 | 8.6 | 27.0 | 0.9 | 100 | |
| Territories | Point Estimate | Number not reported to reduce possibility of identifying individuals | 73 | ||||
| Range | 50-110 | ||||||
| % | 100 | ||||||
| CANADA | Point Estimate | 31,589 | 1,746 | 8,338 | 20,597 | 520 | 62,790 |
| Range | 27,000-36,100 | 1,400-2,100 | 7,000-9,600 | 17,600-23,500 | 410-630 | 55,200-70,300 | |
| % | 50.3 | 2.8 | 13.3 | 32.8 | 0.8 | 100 | |
Canada’s progress on meeting the 90-90-90 HIV targets by 2020
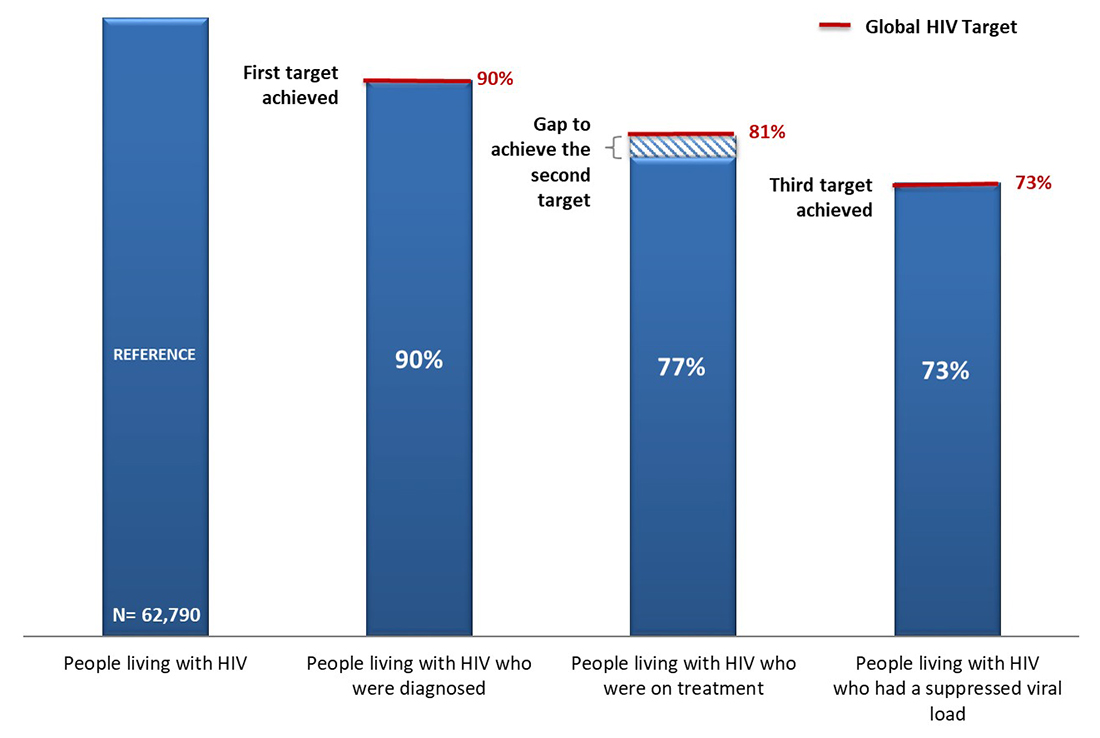
In Canada at the end of 2020, an estimated 62,790 people were living with HIV (plausible range 55,200-70,300). Among those living with HIV, an estimated 90% (plausible range 84% - 96%) were diagnosed. Of those diagnosed, 87% were estimated to be on treatment (plausible range 83% - 91%) and an estimated 95% of persons on treatment had a suppressed viral load (plausible range 93% - 97%) (Figure 7 and Table 4).
Canada achieved both the 1st and 3rd 90-90-90 targets set out for 2020.
Canada's 90-90-90 estimates for 2020 lie within the range reported by other developed countries such as the United States of AmericaReference 10, FranceReference 11, GermanyReference 11, AustraliaReference 12, the NetherlandsReference 13 and FinlandReference 14.
Figure 7. Estimated number and percentage of persons living with HIV, diagnosed, on treatment, and virally suppressed in Canada at the end of 2020 (vertical bars represent plausible ranges).

Text description
This vertical bar graph shows the estimated number of persons in Canada at the end of 2020 who were living with HIV, diagnosed, on treatment, and virally supressed. The horizontal axis shows the four components that were estimated (people living with HIV, diagnosed with HIV, on treatment, and suppressed viral load). The vertical axis shows the estimated number of persons, with the low and high ranges associated with each component.
This graph also shows the point estimate and plausible range associated with each of the three 90-90-90 targets. The first target is the percentage of persons living with HIV who are diagnosed; the second target is the percentage of persons diagnosed who are on treatment; and the third target is the percentage of persons on treatment who had suppressed viral load.
| Estimated number of persons | Low range | Point estimate | High range |
|---|---|---|---|
| Living with HIV | 55,200 | 62,790 | 70,300 |
| Diagnosed with HIV | 52,500 | 56,200 | 60,000 |
| On treatment | 46,300 | 48,660 | 51,100 |
| Suppressed viral load | 45,000 | 46,100 | 47,200 |
| 90-90-90 estimates | Low range | Point estimate | High range |
|---|---|---|---|
| Percentage of persons living with HIV who were diagnosed | 84% | 90% | 96% |
| Percentage of persons diagnosed who were on treatment | 83% | 87% | 91% |
| Percentage of persons on treatment who had suppressed viral load | 93% | 95% | 97% |
| Measure | People living with HIV | People living with HIV who were diagnosed | People diagnosed with HIV who were on treatment | People on treatment who had suppressed viral load |
|---|---|---|---|---|
| Estimated % | n/a | 90% | 87% | 95% |
| Plausible Range (%) | n/a | 84% - 96% | 83% - 91% | 93% - 97% |
| Estimated # | 62,790 | 56,200 | 48,660 | 46,100 |
| Plausible Range (n) | 55,200 – 70,300 | 52,500 – 60,000 | 46,300 – 51,100 | 45,000 – 47,200 |
Canada has demonstrated improvement in all three 90-90-90 targets since 2018. Using current methods and data to update the 2018 estimates, it was estimated that in 2018, 89% (83-95%) of all people living with HIV knew their status, 85% (81-89%) of those diagnosed were on antiretroviral treatment, and 94% (92-96%) of those on treatment had a suppressed viral load.
As a country, Canada has made progress compared to previous 2018 continuum of care estimates. Using the care continuum measurement approach, 73% of people living with HIV in Canada in 2020 were estimated to have a suppressed viral load; these people would be expected to derive personal health benefits and would not pass on infection as long as they are virally suppressedReference 15. Even though Canada has not met the second target related to treatment, the high level of viral suppression makes up for the gap in the number of people on treatment, allowing Canada to meet the overall target of 73% of all people living with HIV who are virally suppressed (Figure 8).
In 2020, an estimated 16,690 people in Canada were not engaged or represented in the HIV care continuum.
The most significant gaps were among those who were diagnosed, but not on treatment, followed by those who were undiagnosed.
Figure 8. Canada's HIV care continuum, and gap to meet global HIV targets, 2020
Text description
This vertical bar graph shows Canada’s overall continuum of care estimates, and gaps to meet global elimination targets, 2020. The continuum of care shows the proportion of persons living with HIV (n = 62,790) who are diagnosed, on treatment and virally suppressed.
| 90-90-90 estimates | Global elimination target | Canada | Gap to achieve target |
|---|---|---|---|
| Percentage of persons living with HIV who were diagnosed | 90% | 90% | First target achieved |
| Percentage of persons living with HIV who were on treatment | 81% | 77% | 4% |
| Percentage of persons living with HIV who were virally suppressed | 73% | 73% | Third target achieved |
By using data to better understand who has been missed throughout the care continuum, community and public health programs can be adjusted to improve their reach to increase the number of people who achieve and maintain viral suppression. It is estimated that in 2020, 16,690 people in Canada were not engaged or represented in HIV care continuum. The most significant gaps were among those who were diagnosed, but not on treatment (7,540; 45%), followed by those who were undiagnosed (6,590; 40%), thus implying a need for interventions targeting linkage and retention in care as well as testing. An estimated 2,560 (15%) of people were on treatment, but did not have a suppressed viral load. Individuals missed along the HIV care continuum present an important opportunity to assure better individual health outcomes and to reduce community transmission of HIV.
90-90-90 Estimates by sex
The new global pledge to end all inequalities faced by communities and people affected by HIV recommends that each country define the specific populations that are central to their epidemic and response, based on the local epidemiological context. In an effort to measure progress towards global HIV targets for epidemiologically relevant groups in Canada, for the first time, the Agency worked with provincial / territorial partners to estimate the number of people living with HIV by sex, and report on progress towards the 90-90-90 targets by sex and by province or region.
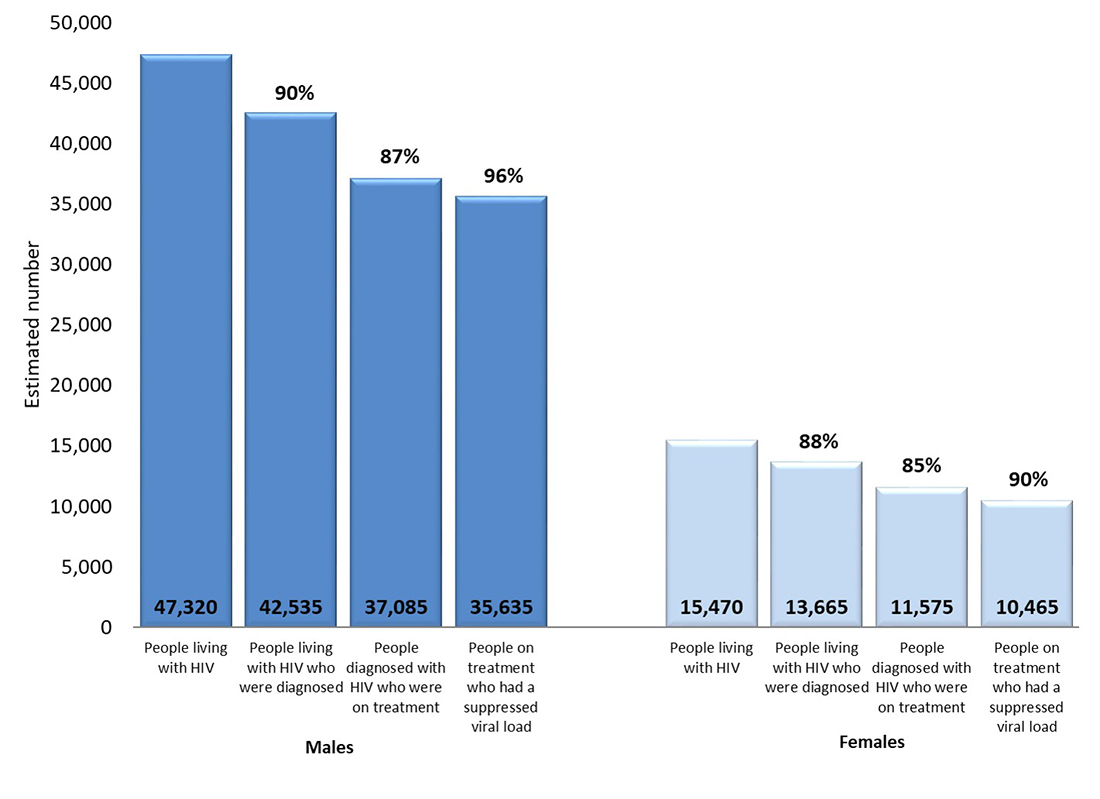
In Canada at the end of 2020, among the estimated 62,790 PLHIV, 47,320 were males (75.4%), and 15,470 were females (24.6%)reference b. Among males living with HIV, an estimated 90% were diagnosed and of those diagnosed, 87% were estimated to be on treatment and an estimated 96% of those on treatment had a suppressed viral load (Figure 9 and Table 5).
Compared to males living with HIV in Canada, women appear to have had lower awareness of infection, as well as treatment and viral suppression rates. Among females living with HIV, an estimated 88% were diagnosed. Of those diagnosed, 85% were estimated to be on treatment and an estimated 90% of those on treatment had a suppressed viral load (Figure 9 and Table 5).
Figure 9. Estimated number and percentage of persons living with HIV, diagnosed, on treatment, and virally suppressed, by sex, at the end of 2020.
Text description
This vertical bar graph shows the estimated number of persons in Canada at the end of 2020 who were living with HIV, diagnosed, on treatment, and virally supressed by sex. The horizontal axis shows the four components that were estimated (people living with HIV, diagnosed with HIV, on treatment, and suppressed viral load). The vertical axis shows the estimated number of persons associated with each component.
This graph also shows the point estimate associated with each of the three 90-90-90 targets by sex. The first target is the percentage of persons living with HIV who are diagnosed, the second target is the percentage of persons diagnosed who are on treatment, and the third target is the percentage of persons on treatment who are virally suppressed.
| Estimated number of persons | Males | Females |
|---|---|---|
| Living with HIV | 47,320 | 15,470 |
| Diagnosed with HIV | 42,535 | 13,665 |
| On treatment | 37,085 | 11,575 |
| Suppressed virus | 35,635 | 10,465 |
| 90-90-90 estimates | Males | Females |
|---|---|---|
| Percentage of persons living with HIV who were diagnosed | 90% | 88% |
| Percentage of persons diagnosed who were on treatment | 87% | 85% |
| Percentage of persons on treatment who were virally suppressed | 96% | 90% |
| People living with HIV | People living with HIV who were diagnosed | People diagnosed with HIV who were on treatment | People on treatment who had suppressed viral load | |||||
|---|---|---|---|---|---|---|---|---|
| Males | Females | Males | Females | Males | Females | Males | Females | |
| Estimated % | n/a | n/a | 90% | 88% | 87% | 85% | 96% | 90% |
| Plausible Range (%) | n/a | n/a | 84%-96% | 82%-94% | 83%-91% | 81%-89% | 94%-98% | 88%-92% |
| Estimated # | 47,320 | 15,470 | 42,535 | 13,665 | 37,085 | 11,575 | 35,635 | 10,465 |
| Plausible Range (n) | 41,500-53,000 | 13,500-17,600 | 39,600-45,400 | 12,700-14,600 | 35,100-39,000 | 11,000-12,200 | 34,700-36,500 | 10,100-10,800 |
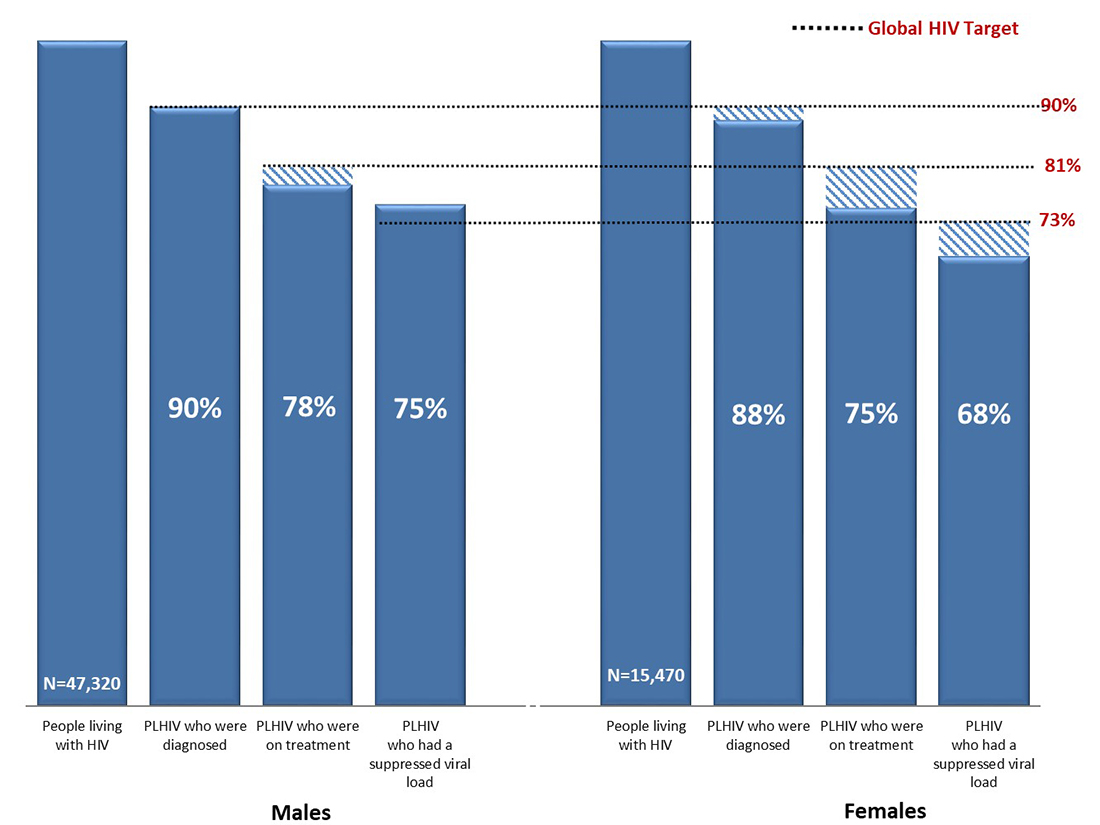
It is estimated that 11,685 males and 5,005 females in Canada were not engaged or represented in the continuum of care (Figure 10). For both males and females, the most significant gaps were among those who were diagnosed, but not on treatment (47% for males, and 42% for females), followed by those who were undiagnosed (41% for males and 36% for females). Twenty-two percent of females missed along the care continuum were on treatment but not virally suppressed, compared to 12% among males.
Figure 10. Canada's continuum of care, and gap to meet global HIV targets, males and females, 2020
Text description
This vertical bar graph shows Canada’s continuum of care estimates by sex, and gaps to meet global elimination targets in 2020. The continuum of care shows the proportion of persons living with HIV among Males (n = 47,320) and Females (n = 15,470) who are diagnosed, on treatment and virally suppressed.
| 90-90-90 estimates | Global elimination target | Point Estimate | Gap to achieve target |
|---|---|---|---|
| Percentage of persons living with HIV who were diagnosed | 90% | 90% | First target achieved |
| Percentage of persons living with HIV who were on treatment | 81% | 78% | 3% |
| Percentage of persons living with HIV who were virally suppressed | 73% | 75% | Third target achieved |
| 90-90-90 estimates | Global elimination target | Point Estimate | Gap to achieve target |
|---|---|---|---|
| Percentage of persons living with HIV who were diagnosed | 90% | 88% | 2% |
| Percentage of persons living with HIV who were on treatment | 81% | 75% | 6% |
| Percentage of persons living with HIV who were virally suppressed | 73% | 68% | 5% |
90-90-90 Estimates by geography
Routinely assessing not only country-level, but also regional progress towards HIV targets is critical to determining progress. Identifying gaps along the HIV care continuum can help make necessary course-corrections to improve prevention and care programs where needed. For the first time since Canada started (2016) measuring progress towards the 90-90-90 global targets, progress across all provinces and territories in Canada is presented below. Some jurisdictions have been grouped together because delivery of HIV treatment and care is conducted jointly between two provinces, or because the data are too small to be presented separately.
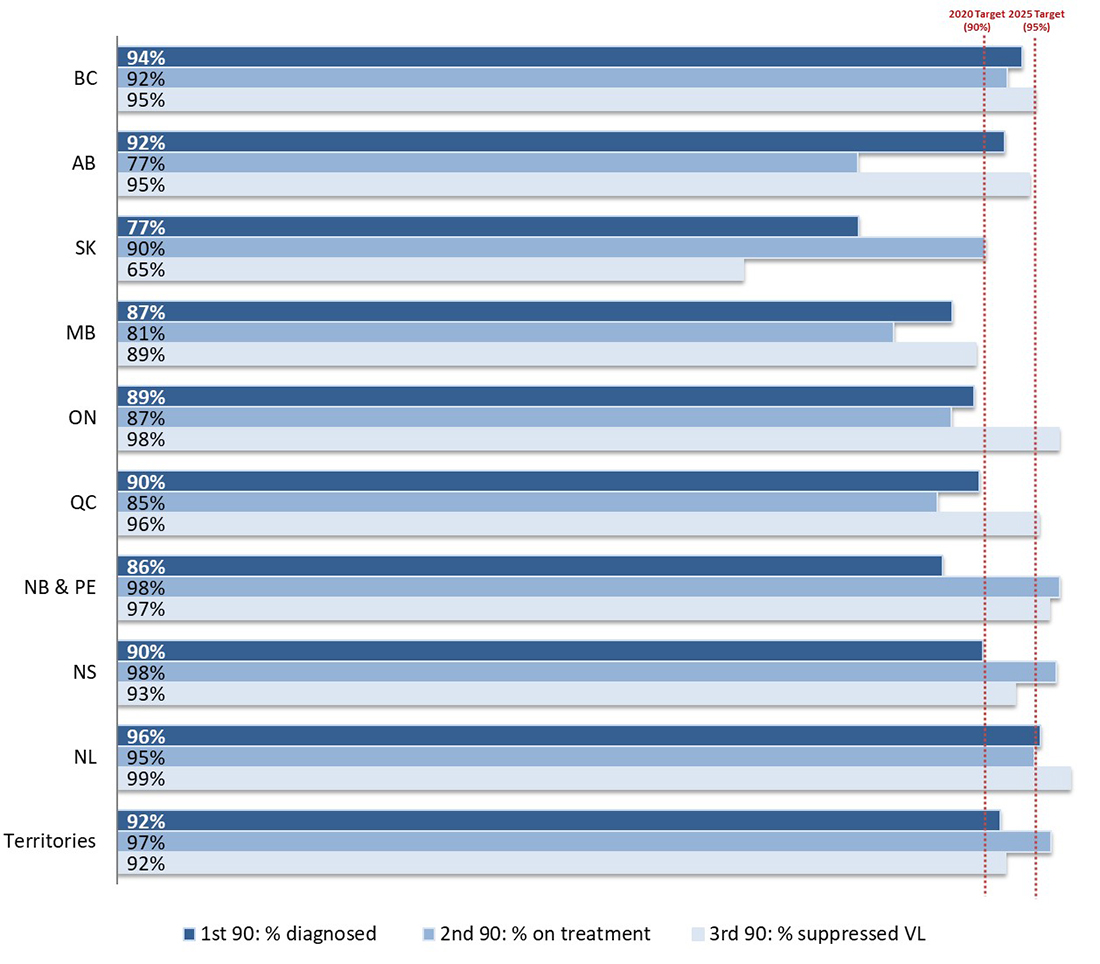
Six of the 10 jurisdictions have met the first 90 target, with ≥90% of people living with HIV in their region being diagnosed. Most of the other jurisdictions were close to meeting the first 90 target (Figure 11). The proportion of people diagnosed with HIV who were on treatment ranged from 77% to 98%, with six jurisdictions meeting the second 90 target. Most of the jurisdictions met the 3rd 90 target for viral suppression (Figure 11).
Using the HIV care continuum measurement approach, where the denominator remains all PLHIV through the continuum, seven of the 10 jurisdictions have already met the overall target of 73% of PLHIV who had a suppressed viral load.
Figure 11. Estimated number and percentage of persons living with HIV, diagnosed, on treatment, and virally suppressed by province or region, at the end of 2020
Text description
This horizontal bar graph shows each province or region’s point estimate associated with each of the three 90-90-90 targets at the end of 2020. The first target is the percentage of persons living with HIV who are diagnosed, the second target is the percentage of persons diagnosed who are on treatment and the third target is the percentage of persons on treatment who are virally suppressed. The graph also shows two vertical lines which represent the UNAIDS 2020 and 2025 targets of 90% and 95% and demonstrate each province or region’s progress toward each target.
| Province or Region | % Diagnosed Among Persons Living with HIV | % On Treatment Among Persons Living with HIV | % Virally Suppressed Among Persons Living with HIV |
|---|---|---|---|
| British Columbia (BC) | 94% | 92% | 95% |
| Alberta (AB) | 92% | 77% | 95% |
| Saskatchewan (SK) | 77% | 90% | 65% |
| Manitoba (MB) | 87% | 81% | 89% |
| Ontario (ON) | 89% | 87% | 98% |
| Quebec (QC) | 90% | 85% | 98% |
| New Brunswick & Prince Edward Island (NB & PEI) | 86% | 98% | 97% |
| Nova Scotia (NS) | 90% | 98% | 93% |
| Newfoundland (NL) | 96% | 95% | 99% |
| Territories | 92% | 97% | 92% |
90-90-90 Estimates in priority populations
The updated political declaration from UNAIDS urges countries to use epidemiological data to identify priority populations who are at higher risk of exposure to HIV, to provide information for the planning of population-centred prevention, care, treatment and other services. The Agency is working with provinces, territories and community organizations to try to provide more community-specific measures of the progress on meeting global HIV targets. Estimates from several priority populations are included below. Data on key populations do not always represent national-level data, and a full set of measures is not available for all communities. Various methods have been used to measure HIV care continuum progress across the key populations, and the year of data ranges from 2017 to 2020.
Federal correction facilities
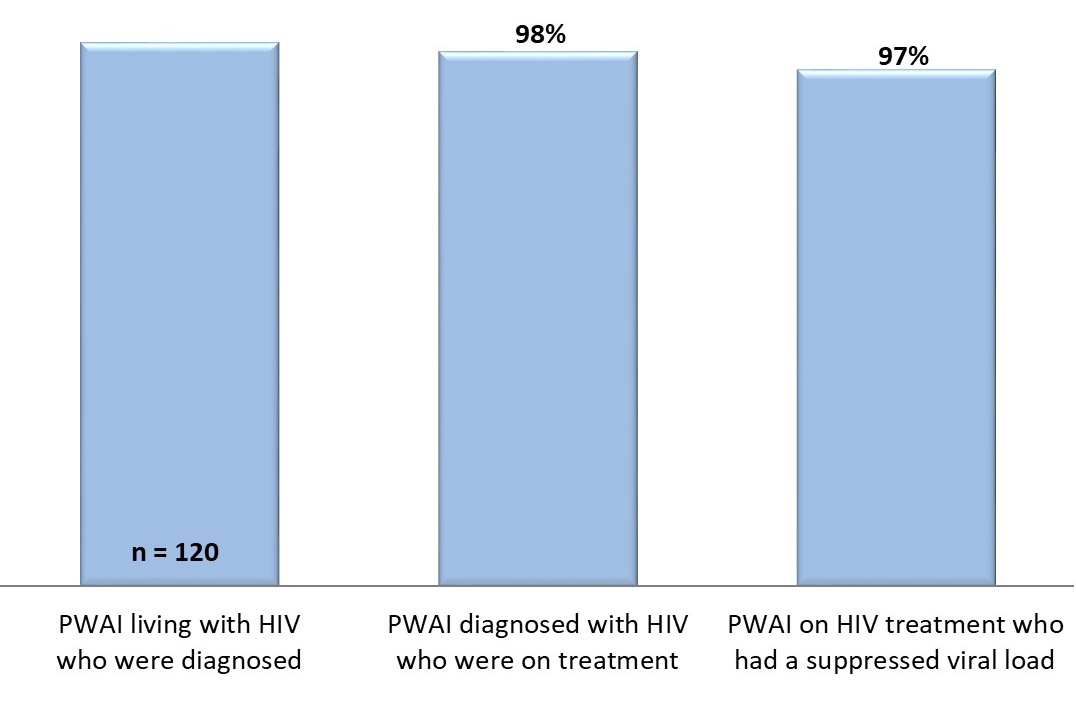
All people who are incarcerated in federal correctional facilities are offered a health assessment on admission, and are also referred for, or can request, HIV testing anytime during incarceration. At the end of 2020 it was estimated that 0.92% of the people who were incarcerated were HIV positive and 88% of incarcerated people knew their HIV status. A person is considered to be aware of their status if they were tested for HIV prior to incarceration, accepted voluntary testing on admission, or were referred for, or requested HIV testing during incarceration. This measure is used to proxy the first 90 indicator for federal correctional facilities, based on currently available data. Among the 120 incarcerated people living with diagnosed HIV at the end of 2020, 98% were on treatment, and 97% of those on treatment had a suppressed viral load (Figure 12).
Figure 12. Estimated proportion of people who are incarcerated (PWAI) diagnosed with HIV, on treatment, and had a suppressed viral load, federal correctional facilities, 2020
Text description
This vertical bar graph shows the estimated number of people who are incarcerated (PWAI) who were living with diagnosed HIV, the percentage of PWAI with diagnosed HIV who were on treatment, and the percentage of PWAI on treatment who had a suppressed viral load in Federal correctional facilities in 2020.
| Indicators | Point estimate |
|---|---|
| Number of PWAI living with HIV who were diagnosed | 120 |
| Percentage of PWAI diagnosed HIV who were on treatment | 98% |
| Percentage of PWAI on HIV treatment who had a suppressed viral load | 97% |
First Nations communities in Saskatchewan
At the end of 2020, data from all 82 First Nations communities in Saskatchewan, showed that 88% of all individuals known to be living with diagnosed HIV were on treatment, and 78% of those on treatment had a suppressed viral load (Figure 13). The proportion of people on treatment has increased since 2018, when it was estimated to be 79%. The proportion of people with a suppressed viral load has decreased slightly since 2018 when it was estimated that 81% of those on treatment had a suppressed viral load.
Figure 13. Estimated proportion of persons living with diagnosed HIV who were on treatment, and had a suppressed viral load, First Nations communities in Saskatchewan, 2020

Text description
This vertical bar graph shows the estimated percentage of people living with diagnosed HIV who were on treatment, and the percentage of those on treatment who had a suppressed viral load, among people living on-reserve First Nations communities in Saskatchewan in 2020.
| Indicators | Point estimate |
|---|---|
| Number of people living with diagnosed HIV | N not presentedFigure 13 reference * |
| Percentage of people living with diagnosed HIV who were on treatment | 88% |
| Percentage of people on HIV treatment who had a suppressed viral load | 78% |
|
|
Tracks surveys implemented by First Nations in Saskatchewan and Alberta
From 2018–2020, the Public Health Agency of Canada’s integrated bio-behavioural surveillance system—Tracks surveys - were implemented by First Nations Health Services Organizations in Alberta and Saskatchewan. First Nations-led survey teams invited community members who identified as First Nations, Inuit or Métis to participate in the Tracks Survey and testing for HIV, hepatitis C and syphilisReference 16. Results from questions on HIV care are presented below.
The majority (95%) of survey participants provided a blood sample for HIV testing. Among participants who tested positive for HIV antibodies and who reported their awareness, 64% were aware of their HIV-positive status. Of those who were aware of their HIV-positive status, 81% reported being on antiretroviral treatment at the time of the survey, and 54% of people on treatment self-reported undetectable viral load (Figure 14)Reference 16.
Figure 14. Estimated proportion of persons who were aware of their HIV positive status, who were on treatment, and had a suppressed viral load, Indigenous Peoples in Saskatchewan and Alberta, 2018-2020Reference 16

Text description
This vertical bar graph displays data from the 2018-2020 Tracks Survey of People who identified as First Nations, Inuit or Métis living in Saskatchewan and Alberta. The graph shows the estimated number of people living with diagnosed HIV, the estimated percentage of people who are aware of their HIV-positive status, the estimated percentage of people known to be living with HIV who self-reported that they are currently taking ART, and the estimated percentage of people known to be on HIV treatment who self-reported having a suppressed viral load.
| Indicators | Point estimate |
|---|---|
| Number of people living with diagnosed HIV | 25 |
| Percentage of people diagnosed with HIV who were aware of their HIV-positive status | 64% |
| Percentage of people aware of their HIV-positive status who were on treatment (self-reported) | 81% |
| Percentage of people on treatment who had a suppressed viral load (self-reported) | 54% |
gbMSM
The Engage cohort is a bio-behavioural research study that relied on social networks to recruit initial participants in three of the largest cities in Canada. Participation involves regular testing (every 6 months) for sexually transmitted infections and completing a self-administered survey to understand the factors that influence the sexual health of gay, bisexual, and queer men, including trans men, and other men who have sex with menReference 17. For this analysis, unadjusted counts from all three sites were used, therefore the data presented below may differ from previously publicationsReference 18.
Among the 2,449 study participants, 421 were living with HIV (confirmed by laboratory / health care provider) during the study period (2017-2019). Among them, 98% were aware of their HIV status (knew prior to any testing that they had HIV). Among those aware, 96% reported to be on antiretroviral treatment, and 94% of those on HIV treatment, had laboratory confirmed suppressed viral load (≤ 200 copies / ml)Reference 19Reference 20Reference 21 (Figure 15).
Figure 15. Estimated proportion of persons who were aware of their HIV positive status, who were on treatment, and had a suppressed viral load, Engage Cohort Study, 2017-2019Reference 19Reference 20Reference 21
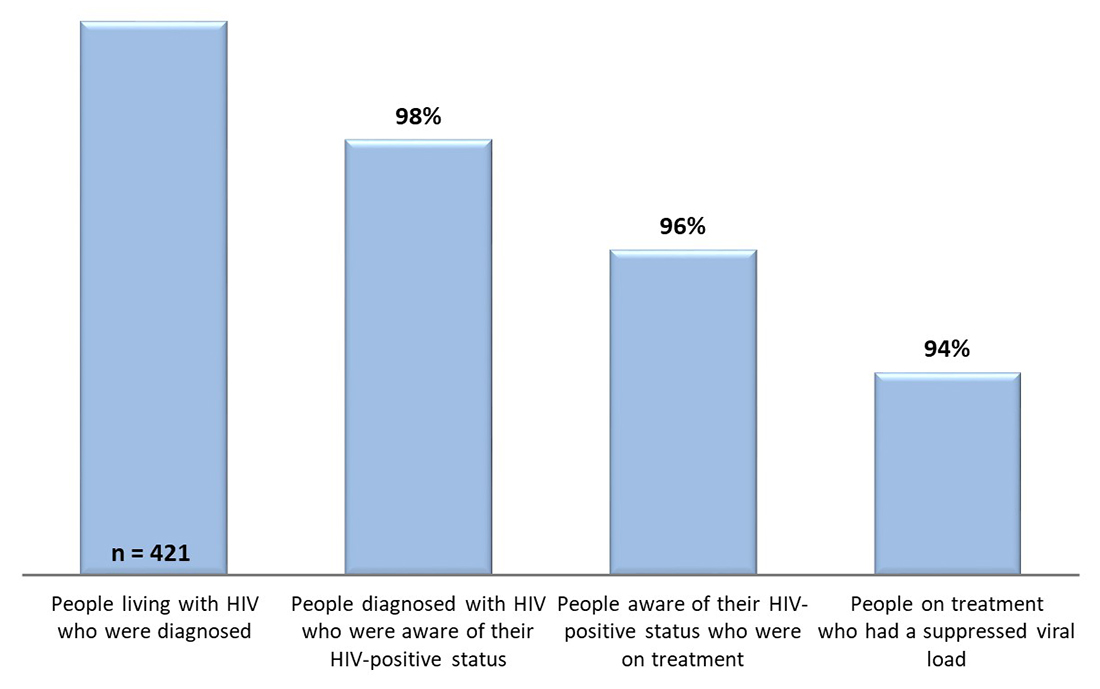
Text description
This vertical bar graph displays data from the 2017-2019 Engage Cohort Study of gay, bi, and queer men, including trans men, and other men who have sex with men. The graph shows the estimated number of people living with diagnosed HIV, the estimated percentage of people who were aware of their HIV-positive status, the estimated percentage of people known to be living with HIV who were on treatment, and the estimated percentage of people known to be on treatment who had a suppressed viral load.
| Indicators | Point estimate |
|---|---|
| Number of people living with diagnosed HIV | 421 |
| Percentage of people living with HIV who were aware of their HIV-positive status | 98% |
| Percentage of people known to be living with HIV who were on treatment | 96% |
| Percentage of people known to be on HIV treatment who had a suppressed viral load | 94% |
People who inject drugs
The Tracks survey of people who inject drugs (PWID) collected data in 14 sentinel sites across Canada from 2017–2019 among people who had injected drugs sixe months prior to participation. HIV prevalence was 10.3%. Among participants who tested positive for HIV antibodies and who provided information on awareness, 83% were aware of their HIV-positive status. Of those who were aware of their HIV-positive status, 88% reported being on antiretroviral treatment at the time of the survey, and 63% of individuals on treatment self-reported an undetectable viral load (Figure 16)Reference 22.
Figure 16. Estimated proportion of persons who were aware of their HIV positive status, who were on treatment, and had a suppressed viral load, Tracks Survey of PWID, 2018-2020Reference 22

Text description
This vertical bar graph displays data from the 2017-2019 Tracks Survey of People who Inject Drugs (PWID). The graph shows the estimated number of people living with diagnosed HIV, the estimated percentage of people who are aware of their HIV-positive status, the estimated percentage of people known to be living with HIV who self-reported that they are currently taking ART, and the estimated percentage of people known to be on HIV treatment who self-reported having a suppressed viral load.
| Indicators | Point estimate |
|---|---|
| Number of people living with diagnosed HIV | 222 |
| Percentage of people diagnosed with HIV who were aware of their HIV-positive status | 83% |
| Percentage of people aware of their HIV-positive status who were on treatment (self-reported) | 88% |
| Percentage of people on treatment who had a suppressed viral load (self-reported) | 63% |
African, Caribbean and Black Community
The Ontario HIV Epidemiology and Surveillance Initiative (OHESI) estimated the proportion of African, Caribbean and Black people diagnosed with HIV in Ontario who were on treatment, and the proportion on treatment who were virally suppressed (the 2nd and 3rd 90 targets). Data from 2018 showed that 83-85% of ACB people diagnosed with HIV in Ontario were on ART, and 96-97% of those on ART had a suppressed viral load (Figure 17). In 2018, ACB people in Ontario achieved levels of treatment uptake and viral suppression comparable to other Ontarians diagnosed with HIV overallReference 23.
Figure 17. Estimated proportion of persons who were on treatment, and had a suppressed viral load, African, Caribbean and Black Community in Ontario, 2018Reference 23
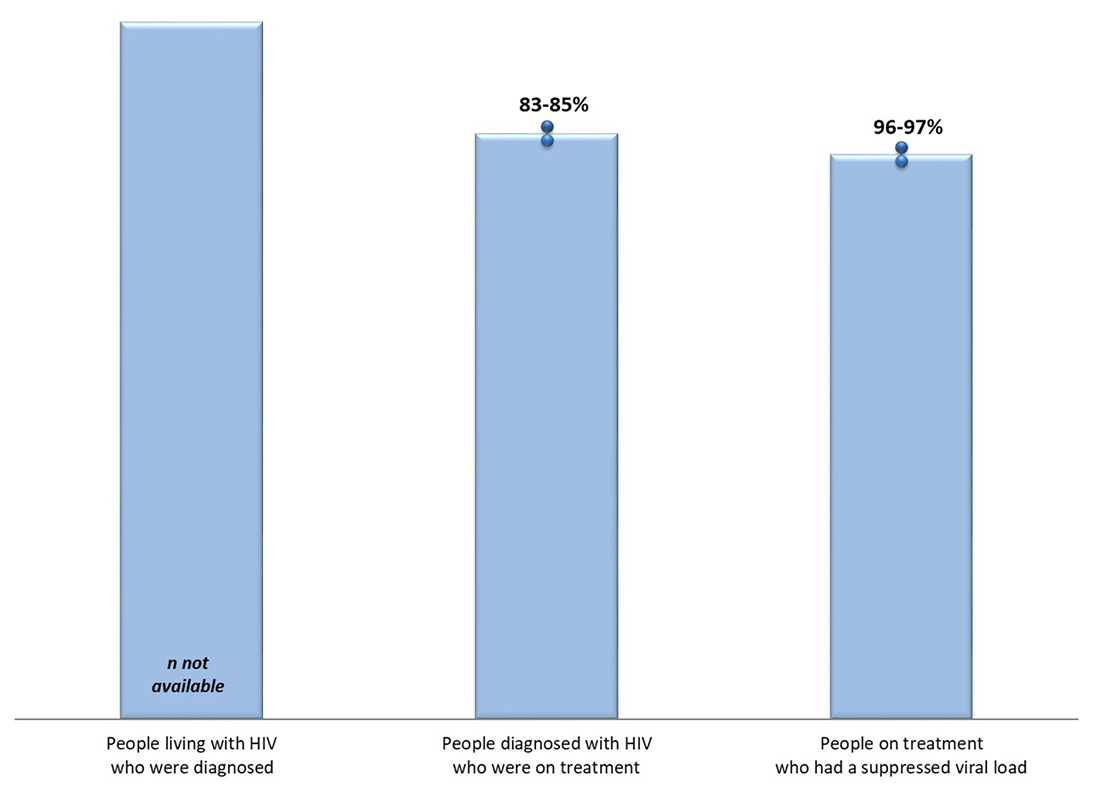
Text description
This vertical bar graph shows the estimated proportion of people living with diagnosed HIV who are on treatment, and the estimated proportion of those on treatment with viral suppression, among people from the African, Caribbean and Black Community in Ontario, 2018.
| Indicators | Point estimate |
|---|---|
| People living with HIV who were diagnosed | N not available |
| People living with diagnosed HIV who were on treatment | 83-85% |
| People on treatment who had a suppressed viral load | 96-97% |
Similar results were reported through the A/C Study - a community-based research project developed by a team of mostly African, Caribbean and Black researchers and service providers in Toronto and OttawaReference 24. HIV prevalence among study participants was 8.4%, 85% of those who tested positive reported being aware of their HIV positive status, and 88% of this group reported currently taking prescribed medication for HIV infection. Questions on viral suppression were not included in the study.
Discussion / Conclusion
The national HIV estimates report for 2020 provides updated insight into the HIV trends in Canada. These estimates will continue to be used to support the Government of Canada five-year action plan on STBBIs, with the goal of reducing the health impacts of STBBI in Canada by 2030.
Overall estimated HIV incidence in Canada appears to be slowly declining since 2017, which could be due in part to increased uptake of pre-exposure prophylaxis (PrEP) among those at high risk or HIV infection. Recent data show that the number of people on PrEP in eight Canadian provinces increased 4x from 2016 to 2020 (273 per 1,000,000 population to 671.5 per 1,000,000 population)Reference 25. However, PrEP awareness and uptake or use varies across and within key populations. Awareness of PrEP has been reported to be high among gbMSM in Canadian urban settings and uptake increased significantly by 2018Reference 26; whereas awareness and uptake of PrEP among PWID was much lowerReference 22. That said, the observed decrease in new HIV infections in 2020 may have been impacted by decreased access to HIV testing services as a result of the COVID-19 pandemicReference 27. Decreased testing for HIV leads to a decrease in new HIV diagnoses, which in turn can influence the modelled estimate of HIV incidence. Additional years of data, especially for 2022 and later, are needed to determine whether the trend in new HIV infections will continue to decrease.
Shifts in the distribution of new HIV infections continues to be seen, with a decreasing proportion (and annual incidence rate) of new HIV infections among gbMSM, and increasing proportions among women, people who inject drugs and Indigenous peoples. Similar findings have been noted among other STBBIs suggesting an overlap (or syndemic) between other STBBIs and HIV. Focus should be placed on the key populations that are affected by overlapping epidemics (or syndemics) to address the unique aspects of these populations and communitiesReference 28.
It is important to note that the increase in HIV incidence among Indigenous peoples may be the result of a data artefact. Provinces and territories made an effort to remove people with previous evidence of HIV infection from the data used for incidence modelling since these do not represent new HIV infections. Many of the people removed may have been from other key populations (decreasing the % of new infections among these key populations), which as a result, would increase the estimated proportion of new infections among Indigenous peoples. Additional years of data are needed to determine whether the increase in 2020 represents a true increase in HIV incidence for this population.
At the end of 2020, an estimated 62,790 individuals were living with HIV in Canada. Canada has met two of the three global HIV targets for 2020 with 90% of all PLHIV who are diagnosed, 87% of people diagnosed who are on treatment, and 95% of people on treatment with a suppressed viral load. Canada's 90-90-90 estimates for 2020 lie within the range reported by other developed countries such as the United States of AmericaReference 10, FranceReference 11, GermanyReference 11, AustraliaReference 12, the NetherlandsReference 13 and FinlandReference 14. Although Canada has not met all three 90-90-90 targets, we have achieved the overall HIV target with 73% of people living with HIV in Canada who have a suppressed viral load.
Despite the progress made, the national estimate for the second 90 (proportion of those diagnosed who are on treatment) remained the lowest of the three targets. The lack of progress on this measure since 2018 was likely secondary to the challenges in delivering health care services due to the COVID-19 pandemic. A recent survey among STBBI service providers demonstrated that there were changes in the demand for and the ability to provide STBBI services. More than two-thirds of respondents (66.3%) experienced a decrease in demand for STBBI prevention, testing and treatment services at some point since the beginning of the pandemicReference 27. More specifically, more than two-thirds of respondents reported changes in the number of people seeking support and treatment services for people living with HIV and/or hepatitis CReference 27. In addition, the slow progress seen in 2020 may relate to challenges with reporting or measurement throughout the COVID-19 pandemic in 2020. Some jurisdictions revised their treatment and follow-up guidelines for people living with HIV to reduce the number of visits and laboratory tests for those who were adherent to treatment and maintained a suppressed viral load. As such, these individuals may not be captured in the reported results. In some cases, jurisdictions made adjustments to account for missed individuals during reduced care and treatment services; however these adjustments may or may not have been adequate resulting in an under-estimate. That said, although we cannot be sure whether the true number is equal to the published point estimate, we can be fairly sure that the true number lies within the range of uncertainty around the estimate.
The presentation of results by sex, geography and key population demonstrates that overall national-level estimates may mask regional and/or population-specific trends in the HIV epidemic in Canada.
Presenting progress towards 90-90-90 targets at a jurisdictional-level provides information needed to better tailor prevention and care programs. For example, in jurisdictions where the first 90 is not met, reaching the undiagnosed is key; whereas, where the second 90 is not met, linkage and retention in care is vital; and lastly where the final 90 is not met, improved support for patients to adhere to treatment is critical.
Sex designations in this report were based on a person’s sex at birth. Sex and gender are not always explicitly measured in routine HIV surveillance by all jurisdictions in Canada, and when data are collected, a range of measures and approaches are used. Therefore this analysis is based on data that is currently available, which is sex at birth. In recognition of the importance of sex and gender identity as demographic characteristics of the Canadian population, the Canadian Human Rights Act and the National Statistical System have added variables related to gender identity and gender expression. The Public Health Agency of Canada is working with communities and with provinces and territories to find ways to better capture information on sex and gender.
By showing estimates for the HIV care continuum and the 90-90-90 targets by sex, geography and key population, it is clear that:
- Women, Indigenous peoples and PWID have lower estimates related to HIV awareness, treatment uptake and viral suppression when compared to the overall population;
- gbMSM have higher estimates related to HIV awareness and treatment uptake compared to the overall population;
- Inmates in federal correction facilities, and African, Caribbean and Black people in Ontario achieved levels of treatment uptake and viral suppression roughly approximating the overall population; and
- Variation between provinces / regions demonstrates the need for focus and improvement in the different stages of the HIV care continuum.
Challenges still remain in reaching the most marginalized people impacted by STBBIs. Individuals who have experienced stigma, marginalization, and discrimination based on race, immigration status, sexual orientation, gender identity, drug use, or involvement in sex work, may be more vulnerable to HIVReference 1. Additionally, the legacy and ongoing impacts of colonialism, residential school and systemic racism experienced by First Nations, Inuit and Métis people intensifies the existing health, structural and social inequities directly and indirectly influence vulnerability to and resilience against HIVReference 16. The disproportionate impact on certain populations underscores the need for timely socio-demographic information to understand existing health inequities and implement the most appropriate targeted approachesReference 28. By using these data to better understand who has not been reached, community and public health programs can be adjusted to improve their approaches and deliver the most effective programs tailored to the needs of people at greatest risk for infection in communities where HIV is most concentrated. This will ultimately help all Canadians living with HIV achieve comparable outcomes across the care continuum.
Reporting on Canada’s progress towards targets for HIV drives us to improve our strategies when we are not achieving expected resultsReference 4. To reduce the health impact of HIV in Canada, tailored programming for HIV prevention, treatment and care are imperative to meet the needs of people at greatest risk for infection in communities where HIV is most concentrated.
Appendix 1. Additional detail related to Canada’s modelling method
Reference: Yan, Ping; Zhang, Fan; and Wand, Handan (2011). Using HIV Diagnostic Data to Estimate HIV Incidence: Method and Simulation. Statistical Communications in Infectious Diseases: Vol. 3: Iss. 1, Article 6.
The statistical modelling method that was used to estimate the number of new HIV infections in Canada is based on a back-calculation method that combines HIV and AIDS diagnostic data (from national routine HIV/AIDS surveillance) with data on the proportions of recent infections among newly diagnosed individuals (from specialized recent-infection laboratory testing algorithms). The model estimates the time trend in the number of past HIV infections, up until the present time (2020 in this case) since surveillance data can only record the date of diagnosis and not the date of infection (which is some time before diagnosis). From this trend in past HIV infections, the model then projects forward to calculate the expected number of HIV diagnoses (using a mathematical formulation of the time between HIV infection and diagnosis based on the recent-infection algorithm data and model assumptions). The back-calculation method used for incidence estimation in Canada is similar to methods used in the European Union, the USA, and Australia.
Once the time trend in past HIV infections has been estimated, cumulative HIV incidence is calculated by adding up the incidence estimates for all years up to and including the most recent year (2020 in this case). Prevalence for the most recent year is then calculated as the cumulative incidence minus estimated total mortality among HIV-infected persons. For this, total mortality needs to be estimated (using data from Statistics Canada, provincial/territorial vital statistics, national reports of AIDS deaths, and Canadian research studies) since vital statistics data only record mortality among persons who died of HIV-related causes. Note that there are additional details not discussed here, such as accounting for HIV cases who had been previously diagnosed, who were likely infected in another province/territory or country, or who migrated out of the province / territory.
Appendix 2. National HIV incidence and prevalence tables
| Category | 2020 | 2018 | ||||
|---|---|---|---|---|---|---|
| Point estimate | RangeTable 6 reference * | Percentage | Point estimate | RangeTable 6 reference * | Percentage | |
| Key Population | ||||||
| gbMSM | 666 | 330-1,020 | 43.8 | 819 | 530-1,120 | 46.5 |
| gbMSM-PWID | 43 | 20-70 | 2.8 | 45 | 20-70 | 2.6 |
| PWID | 300 | 150-460 | 19.8 | 290 | 170-420 | 16.5 |
| Heterosexual people | 511 | 250-780 | 33.6 | 606 | 390-830 | 34.4 |
| Other | <5 | 0-10 | <0.2% | <5 | 0-10 | <0.2% |
| Sex | ||||||
| Female | 487 | 240-740 | 32.0 | 531 | 340-730 | 30.2 |
| Male | 1,033 | 510-1,570 | 68.0 | 1,229 | 800-1,670 | 69.8 |
| Indigenous Origin (First nations, Metis, Inuit) | ||||||
| Indigenous | 276 | 140-420 | 18.2 | 258 | 160-370 | 14.7 |
| Non-Indigenous | 1,244 | 620-1,900 | 81.8 | 1,502 | 1,050-1,960 | 85.3 |
| Total | 1,520 | 870-2,260 | 100.0 | 1,760 | 1,360-2,190 | 100.0 |
|
||||||
| Category | 2020 | 2018 | ||||
|---|---|---|---|---|---|---|
| Point estimate | RangeTable 7 reference * | Percentage | Point estimate | RangeTable 7 reference * | Percentage | |
| Key Population | ||||||
| gbMSM | 31,589 | 27,000-36,000 | 50.3 | 30,526 | 26,500-34,500 | 50.4 |
| gbMSM- PWID | 1,746 | 1,400-2,100 | 2.8 | 1,674 | 1,400-1,900 | 2.8 |
| PWID | 8,338 | 7,100-9,500 | 13.3 | 7,946 | 6,800-9,000 | 13.1 |
| Heterosexual people | 20,597 | 17,600-23,500 | 32.8 | 19,891 | 17,300-22,400 | 32.8 |
| Other | 520 | 420-620 | 0.8 | 563 | 460-660 | 0.9 |
| Sex | ||||||
| Female | 15,470 | 13,200-17,700 | 24.6 | 14,597 | 12,500-16,600 | 24.1 |
| Male | 47,320 | 41,000-53,600 | 75.4 | 46,003 | 40,000-52,000 | 75.9 |
| Indigenous Origin (First nations, Metis, Inuit) | ||||||
| Indigenous | 6,472 | 5,500-7,400 | 10.3 | 6,064 | 5,200-6,900 | 10.0 |
| Non-Indigenous | 56,318 | 48,000-64,500 | 89.7 | 54,536 | 47,000-62,000 | 90.0 |
| Total | 62,790 | 55,200-70,300 | 100.0 | 60,600 | 53,300–67,800 | 100.0 |
|
||||||
Appendix 3. Key population definitions
Table 8. Key populations used for the national estimates of HIV incidence and prevalence
| Key Population | Type of exposure |
|---|---|
| Gay, bisexual and other men who have sex with men (gbMSM) | Exposure during male-to-male sexual contact |
| People who inject drugs(PWID) | Exposure during the use of injection drugs |
| gbMSM-PWID | Exposure during either male-to-male sex and/or the use of injection drugs (used in instances where both exposures were reported for one person) |
| Heterosexual people | Exposure during heterosexual sex |
| Other | Persons who were exposed during: receipt of transfusion of blood or clotting factor, perinatal exposure, or occupational exposure |
In previous reports, the heterosexual category was separated into an “endemic” group (persons born in a so-called HIV-endemic country, mainly sub-Saharan Africa and the Caribbean) and a “non-endemic” group (born elsewhere). This separation is no longer considered appropriate, for reasons of increasing data incompleteness. The Public Health Agency of Canada is working with communities and with provinces and territories to find ways to better reflect the HIV situation in these communities.
References
- Reference 1
-
Public Health Agency of Canada (2018). Reducing the health impact of sexually transmitted and blood-borne infections in Canada by 2030: A pan-Canadian STBBI framework for action. https://www.canada.ca/en/public-health/services/infectious-diseases/sexual-health-sexually-transmitted-infections/reports-publications/sexually-transmitted-blood-borne-infections-action-framework.html
- Reference 2
-
UNAIDS. 90-90-90 An Ambitious Treatment Target to Help End the AIDS Epidemic. Geneva, Switzerland: Joint United Nations Programme on HIV/AIDS; 2014
- Reference 3
-
UNAIDS. Political Declaration on HIV and AIDS: Ending inequalities and getting on track to end AIDS by 2030. 8 June 2021. https://www.unaids.org/sites/default/files/media_asset/2021_political-declaration-on-hiv-and-aids_en.pdf
- Reference 4
-
Public Health Agency of Canada (2019). Accelerating our response: Government of Canada five-year action plan on sexually transmitted and blood-borne infections. https://www.canada.ca/en/public-health/services/reports-publications/accelerating-our-response-five-year-action-plan-sexually-transmitted-blood-borne-infections.html
- Reference 5
-
IAPAC Guidelines for Optimizing the HIV Care Continuum. https://www.iapac.org/fact-sheet/iapac-guidelines-for-optimizing-the-hiv-care-continuum/
- Reference 6
-
HIV.gov. HIV care continuum. Updated June 21, 2021. Accessed July 22, 2021.https://www.hiv.gov/federal-response/policies-issues/hiv-aids-care-continuum
- Reference 7
-
Yan, Ping; Zhang, Fan; and Wand, Handan (2011). Using HIV Diagnostic Data to Estimate HIV Incidence: Method and Simulation. Statistical Communications in Infectious Diseases: Vol. 3: Iss. 1, Article 6.
- Reference 8
-
UNAIDS. Understanding measures of progress towards 90-90-90. https://www.unaids.org/sites/default/files/measures-progress-90-90-90.pdf
- Reference 9
-
Sorge J, Colyer S, Cox J, Kroch A, Lachowsky N, Popovic, N, Yang Q. Estimation of the Population Size of Gay, Bisexual and Other Men Who Have Sex with Men in Canada, 2020. International AIDS Conference, 2022
- Reference 10
-
Centers for Disease Control and Prevention. Monitoring selected national HIV prevention and care objectives by using HIV surveillance data—United States and 6 dependent areas, 2019. HIV Surveillance Supplemental Report 2021;26(No. 2). http://www.cdc.gov/hiv/library/reports/ hiv-surveillance.html. Published May 2021. Accessed 2022-01-12.
- Reference 11
-
European Centre for Disease Prevention and Control. Continuum of HIV care. Monitoring implementation of the Dublin Declaration on partnership to fight HIV/AIDS in Europe and Central Asia: 2020 progress report. Stockholm: ECDC; 2021
- Reference 12
-
The Kirby Institute. HIV Dashboard. https://data.kirby.unsw.edu.au/hiv
- Reference 13
-
HIV Infection in the Netherlands: HIV Monitoring Report 2021. HIV_Monitoring_Report_2021_-_Chapter_1.pdf (hiv-monitoring.nl)
- Reference 14
-
Mutru M, Isosomppi S, Aho I, et al. Finnish HIV Quality of Care Register (FINHIV). BMJ Open. 2022;12(1):e053287. Published 2022 Jan 21. doi:10.1136/bmjopen-2021-053287
- Reference 15
-
Public Health Agency of Canada (2019). HIV factsheet: U = U for health professionals. https://www.canada.ca/en/public-health/services/publications/diseases-conditions/hiv-factsheet-undetectable-untransmittable-health-professionals.html
- Reference 16
-
Lydon-Hassen K, Jonah L, Mayotte L, Hrabowy A, Graham B, Missens B, Nelson A, Andkhoie M, Nahachewsky D, Yalamanchili DT, Gupta S, Ndubuka N, Khan I, Yacoub W, Bryson M, Paquette D. Summary findings from Tracks surveys implemented by First Nations in Saskatchewan and Alberta, Canada, 2018–2020. Can Commun Dis Rep 2022;48(4):x-xx. https://doi.org/10.14745/ccdr.v48i04a05
- Reference 17
-
Engage Cohort Site Reports. https://www.engage-men.ca/
- Reference 18
-
Moore DM, Cui Z, Skakoon-Sparling S, Sang J, Barath J, Wang L, Lachowsky N, Cox J, Lambert G, Noor SW, Grace D, Jollimore J, Apelian H, Lal A, Parlette A, Hart TA. Characteristics of the HIV cascade of care and unsuppressed viral load among gay, bisexual and other men who have sex with men living with HIV across Canada's three largest cities. J Int AIDS Soc. 2021
- Reference 19
-
Lambert, J Cox, M Messier-Peet, H Apelian, EEM Moodie and the members of the Engage research team. Engage Montréal, Portrait of the sexual health of men who have sex with men in Greater Montréal, Cycle 2017-2018, Highlights. Direction régionale de santé publique, CIUSSS du Centre-Sud-de-l’Île-de-Montréal. January 2019
- Reference 20
-
Hart, T. A., Skakoon-Sparling, S., Tavangar, F., Parlette, A., Barath, J., Sang, J., Apelian, H., Noor, S., Sinno, J., Grace, D. Engage Toronto: Portrait of the health and wellbeing of gay, bisexual and other men who have sex with men in the Greater Toronto Area. Ryerson University and the University of Toronto. March 2021
- Reference 21
-
Sang, JM, Lachowsky NJ, Lal A, Wang L, Barath J, Jollimore J, Howard T, Blackwell E, Leonce I, Rayek S, Grennan T, Hull M, Wong J, Hogg RS, Moore DM. Momentum II Health Study—Vancouver site of the National Engage Study: Portrait of the health and wellbeing of gay, bisexual and other men who have sex with men in Metro Vancouver. BC Centre for Excellence in HIV/AIDS. February 2021
- Reference 22
-
Tarasuk J, Zhang J, Lemyre A, Cholette F, Bryson M, Paquette D. National findings from the Tracks survey of people who inject drugs in Canada, Phase 4, 2017–2019. Can Commun Dis Rep 2020;46(5):138–48. https://doi.org/10.14745/ccdr.v46i05a07
- Reference 23
-
Ontario HIV Epidemiology and Surveillance Initiative. A Snapshot of HIV Diagnoses and the HIV Care Cascade among African, Caribbean and Black People in Ontario. Feb 7th, 2022. https://www.ohesi.ca/a-snapshot-of-hiv-diagnoses-and-the-hiv-care-cascade-among-african-caribbean-and-black-people-in-ontario/
- Reference 24
-
Dr. Shamara Baidoobonso, Medys Kihembo, Hilary Nare, Dr. Lawrence Mbuagbaw, Dr. Winston Husbands, Dr. Josephine Etowa, Wangari Tharao, Dr. Pascal Djiadeu, Dr. Charles Daboné, Dr. Egbe Etowa, Daeria Lawson, Suzanne Obiorah, Mary Ndung’u, Fanta Ongoiba, Haoua Inoua, Jane K. Odongo, Maureen Owino, Dr. LaRon Nelson, and Akalewold Gebremeske A/C STUDY COMMUNITY REPORT: HIV AMONG AFRICAN, CARIBBEAN, AND BLACK PEOPLE IN ONTARIO. https://acstudy.ca/a-c-study-kte-products-2/
- Reference 25
-
Public Health Agency of Canada (Dec 2021). Trends in HIV pre-exposure prophylaxis use in eight Canadian provinces, 2016-2020. https://www.canada.ca/en/public-health/services/publications/diseases-conditions/hiv-trends-pre-exposure-prophylaxis-canadian-provinces-2016-2020.html
- Reference 26
-
Colyer, S., Lachowsky, N.J., Schmidt, A.J. et al. Measures of HIV Pre-exposure Prophylaxis Uptake Among Gay, Bisexual, and Other Men Who Have Sex with Men in Canada and Demographic Disparities Among Those at Elevated Likelihood for HIV Acquisition. AIDS Behav 25, 3638–3650 (2021). https://doi.org/10.1007/s10461-021-03336-3
- Reference 27
-
Public Health Agency of Canada (2021). National Report: Findings from the Survey on the Impact of COVID-19 on the delivery of STBBI prevention, testing and treatment including harm reduction services in Canada.
- Reference 28
-
Public Health Agency of Canada (2021). Chief Public Health Officer's Report on the State of Public Health in Canada 2021. https://www.canada.ca/en/public-health/corporate/publications/chief-public-health-officer-reports-state-public-health-canada/state-public-health-canada-2021/report.html
Footnotes
- Footnote a
-
Statistics Canada. Q4 2020 Population estimate. Table 17-10-0009-01 Population estimates, quarterly
- Footnote b
-
Sex designations in this report are based on a person’s sex at birth.
Page details
- Date modified: